 Shang-Wei Chen1†Hua-Fu Zhou1†
 Han-Jie Zhang2
 Rong-Quan He3Zhi-Guang Huang2
 Yi-Wu Dang2Xia Yang2Jun Liu1Zong-Wang Fu1Jun-Xian Mo4Zhong-Qing Tang5Chang-Bo Li4Rong Li3Li-Hua Yang3
 Jie Ma3Lin-Jie Yang2*
 Gang Chen2*
- 1Department of Cardio-Thoracic Surgery, The First Affiliated Hospital of Guangxi Medical University, Nanning, China
- 2Department of Pathology, The First Affiliated Hospital of Guangxi Medical University, Nanning, China
- 3Department of Medical Oncology, First Affiliated Hospital of Guangxi Medical University, Nanning, China
- 4Department of Cardio-Thoracic Surgery, The Seventh Affiliated Hospital of Guangxi Medical University/Wuzhou Gongren Hospital, Wuzhou, China
- 5Department of Pathology, Wuzhou Gongren Hospital/The Seventh Affiliated Hospital of Guangxi Medical University, Wuzhou, China
Esophageal squamous cell carcinoma (ESCC) is the major histological type of esophageal cancers worldwide. Transcription factor PTTG1 was seen highly expressed in a variety of tumors and was related to the degree of tumor differentiation, invasion, and metastasis. However, the clinical significance of PTTG1 had yet to be verified, and the mechanism of abnormal PTTG1 expression in ESCC was not clear. In this study, the comprehensive analysis and evaluation of PTTG1 expression in ESCC were completed by synthesizing in-house immunohistochemistry (IHC), clinical sample tissue RNA-seq (in-house RNA-seq), public high-throughput data, and literature data. We also explored the possible signaling pathways and target genes of PTTG1 in ESCC by combining the target genes of PTTG1 (displayed by ChIP-seq), differentially expressed genes (DEGs) of ESCC, and PTTG1-related genes, revealing the potential molecular mechanism of PTTG1 in ESCC. In the present study, PTTG1 protein and mRNA expression levels in ESCC tissues were all significantly higher than in non-cancerous tissues. The pool standard mean difference (SMD) of the overall PTTG1 expression was 1.17 (95% CI: 0.72–1.62, P < 0.01), and the area under curve (AUC) of the summary receiver operating characteristic (SROC) was 0.86 (95% CI: 0.83–0.89). By combining the target genes displayed by ChIP-seq of PTTG1, DEGs of ESCC, and PTTG1-related genes, it was observed that PTTG1 may interact with these genes through chemokines and cytokine signaling pathways. By constructing a protein–protein interaction (PPI) network and combining ChIP-seq data, we obtained four PTTG1 potential target genes, SPTAN1, SLC25A17, IKBKB, and ERH. The gene expression of PTTG1 had a strong positive correlation with SLC25A17 and ERH, which suggested that PTTG1 might positively regulate the expression of these two genes. In summary, the high expression of PTTG1 may play an important role in the formation of ESCC. These roles may be completed by PTTG1 regulating the downstream target genes SLC25A17 and ERH.
Introduction
Esophageal cancer is the sixth leading cause of cancer-related deaths in the world and the eighth most common cancer globally; esophageal squamous cell carcinoma (ESCC) is the major histological type of esophageal cancers worldwide (Arnal et al., 2015). Despite the improved management and treatment of ESCC patients, the overall 5-year survival rate (10%) and 5-year survival rate following resection (15–40%) have remained low (Huang and Yu, 2018). The poor prognosis and rising morbidity of ESCC highlights the importance of improving detection methods, which is essential before treatment. As early clinical symptoms are not obvious, many ESCC patients are not diagnosed until the clinical symptoms appear in the late stage. In order to improve the prognosis of patients after surgery, patients were often treated with surgery combined with radiotherapy and chemotherapy, but this has not significantly increased the survival rate of ESCC patients. Since we have failed to fully understand the mechanism of the occurrence and development of ESCC, it is necessary and meaningful to explore its potential molecular mechanism to identify new prognostic biomarkers and potential ESCC therapeutic targets.
In recent years, studies have shown that transcription factors might play an important role in the occurrence and development of tumors, which has prompted us to study the clinical value and mechanism of transcription factor PTTG1 in ESCC. PTTG1 was the first proto-oncogene detected from rat pituitary tumor cells, encoding the securin protein—a protein that prevented separins from promoting the separation of sister chromatids (Pei and Melmed, 1997; Arenas et al., 2018). PTTG1 was seen highly expressed in a variety of tumors and was related to the degree of tumor differentiation, invasion, and metastasis (Vlotides et al., 2007). It was shown that PTTG1 played an essential role in the biological function of tumor cells. Its high expression in colorectal cancer promoted proliferation and metastasis (Ren and Jin, 2017). Its high expression in hepatocellular carcinoma, small cell lung carcinoma, and prostate cancer had value for clinical diagnosis and prognosis (Kong et al., 2019; Yang et al., 2019; Ersvær et al., 2020). Although studies found that PTTG1 was likely to exhibit high expression in ESCC, the number of cases has been small and the research was based on a single center study, using a single detection method (Shibata et al., 2002; Ito et al., 2008; Feng et al., 2017). There have been only two reports on the mechanism of PTTG1 in ESCC. It was found that PTTG1 promoted the movement and migration of ESCC cells by activating related genes (Ito et al., 2008; Feng et al., 2017). The possible target genes of PTTG1 as a transcription factor in ESCC had not been reported yet, and the practice of using integrated computational biology to mine ChIP-seq data to study the underlying molecular mechanism of PTTG1 had not been reported.
Based on the existing research on PTTG1 in ESCC, this study used clinical samples to make tissue chips, performed immunohistochemistry (IHC) to detect the expression level of PTTG1 protein in ESCC tissues, and used our clinical sample tissues to conduct RNA sequencing (RNA-seq) to verify the expression of PTTG1 mRNA. The comprehensive analysis and evaluation of PTTG1 expression in ESCC were completed by synthesizing in-house IHC, clinical sample tissue RNA-seq (in-house RNA-seq), public high-throughput data, and literature data. We also explored the possible signaling pathways and target genes of PTTG1 in ESCC by combining the target genes of PTTG1 (displayed by ChIP-seq), differentially expressed genes (DEGs) of ESCC, and PTTG1-related genes (Supplementary Figure 1), revealing the potential molecular mechanism of PTTG1 in ESCC and providing a new target for ESCC research.
Materials and Methods
Expression Level of PTTG1 Protein in Tissue Chip
A total of 302 cases were collected, including 159 ESCC tissues and 143 paracancerous tissues of 153 males and 18 females with a median age of 58 years. These chips (ESC242, ESC1503, and ESC1504) were produced by Fanpu Biotech, Inc. (Guilin, China). Two experienced pathologists read each case separately. PTTG1 was a product of Biorbyt (Catalog No. orb3740037, Cambridge, United Kingdom). IHC was performed according to the instructions. The results were scored according to the IRS scoring system of 0–12 points (Lin et al., 2018). The scores of staining intensity were divided into 0, 1, 2, and 3, which represented negative, weak, medium, and strong, respectively. Positive staining proportion was classified as 0 for <10%, 1 for 11–25%, 2 for 26–50%, 3 for 51–75%, and 4 for 76–100%. The ultimate score was obtained based on the product of the positive proportion and the staining intensity. Then, the relationship between the PTTG1 protein expression level and clinicopathological parameters was analyzed based on the IHC score.
RNA-Seq of Clinical Samples
We collected eight pairs of ESCC samples and corresponding adjacent normal esophageal tissues for RNA-seq from eight ESCC patients who underwent radical resection of EC from the First Affiliated Hospital of Guangxi Medical University (Nanning, Guangxi, China), from April to August 2019. None of these ESCC patients received preoperative chemotherapy or radiotherapy. The tissue samples were stored at −80°C immediately after resection. These eight patients included six males and two females with a median age of 60 years. RNA-seq was executed by Wuhan Seqhealth Technology Co., LTD. (Wuhan, China). TRIzol reagent (Invitrogen, Carlsbad, CA, United States) was applied to extract and prepare total RNA from tumors and paired adjacent non-ESCC tissues. A total amount of 3 μg RNA per sample was used as initial material for the RNA sample preparations. NanodropTM 1000 spectrophotometer (Thermo Fisher Scientific, United States) was applied to examine RNA purity. RNA concentration was determined using a Qubit® 3.0 Fluorometer (Life Technologies, CA, United States). RNA integrity was determined using an RNA Nano 6000 Assay Kit and a Bioanalyzer 2100 system (Agilent Technologies, CA, United States). Afterward, the sequencing libraries were established using the NEBNext Ultra Directional RNA Library Prep Kit for Illumina (NEB, Ipswich, MA, United States) based on manufacturer’s protocols. The 200 Illumina HiSeq X Ten platform was used to sequence the libraries. RNA-seq reads were aligned to the reference of homo_sapiens. GRCh38.1 In the current study, we obtained the data on log2 (x + 0.001) conversion level 3 and reported RNA-seq data in transcripts per kilobase million (TPM). All enrolled patients signed an informed consent form, and the research including tissue chip and RNA-seq was approved by the ethics committee of the First Hospital Affiliated to Guangxi Medical University.
Collection of High-Throughput Data Sets
In order to compare the differences in gene expression between ESCC tissues and non-cancerous esophageal tissues, we used Gene Expression Omnibus (GEO), SRA, ArrayExpress, Oncomine, The Cancer Genome Atlas (TCGA), and various literature databases to extensively search ESCC-related data sets. The search formula is (Esophageal OR Esophagus) AND (maliganan∗ OR cancer OR tumor OR neoplas∗ OR carcinoma), AND “Homo sapiens” (porgn:_txid9606). All the information, including summary and overall design, of these data sets was then further evaluated.
Statistical Analysis
Student’s t-test was performed using SPSS 22.0 to compare the differential expression of PTTG1 between ESCC and non-cancerous tissues. The calculated results were presented in the form of the mean ± standard deviation (SD). GraphPad Prism 8.0 was applied to draw scatter plots and box plots. The area under curve (AUC) of receiver operating characteristic (ROC) was used to evaluate the ability of PTTG1 levels to distinguish ESCC tissues from non-cancer tissues. In order to systematically analyze the expression level of PTTG1, we comprehensively analyzed in-house IHC, in-house RNA-seq, public RNA-seq, gene chip data, and published data. The standard mean difference (SMD) and 95% confidence interval (CI) were calculated by R 3.6.1, and the expression levels of PTTG1 in ESCC and non-cancer tissues were compared. The funnel chart was employed to detect publication bias. Synthesizing all the data, the researchers used Stata12.0 to calculate the summary receiver operating characteristic (SROC) and further clarified the differential expression of PTTG1 in ESCC and non-cancer tissues. Student’s t-test was used to show the heterogeneity of the results. When P < 0.05 or I2 > 50%, there was heterogeneity, and a random effect model was used. When P > 0.05 or I2 < 50%, no obvious heterogeneity was detected, and a fixed-effect model was used. P < 0.05 was considered statistically significant.
Screening for PTTG1 Target Genes, Esophageal Cancer Differentially Expressed Genes and PTTG1-Related Genes
Since PTTG1 was a transcription factor, in order to obtain the key downstream target genes of PTTG1, we collected PTTG1 target genes and potential binding sites proved by ChIP-seq through the Cistrome DB database2 (Mei et al., 2017). Subsequently, we used the LIMMA package to process all gene chips containing PTTG1 expression data and used LIMMA-VOOM to process DEGs of RNA-seq data [| log fold change (FC)| > 1, P < 0.05]. By calculating the correlation coefficient, the related genes were calculated in each high-throughput data set including PTTG1 (| r| > 0.5, P < 0.05). Because each of the above steps contained multiple data sets, we researchers extracted genes that met the criteria in all data sets for intersection.
Functional Enrichment Analysis and Construction of Protein–Protein Interaction Networks to Screen Key Target Genes
In order to study the possible functions of these key target genes, the researchers carried out gene ontology (GO) functional enrichment analysis and Kyoto Encyclopedia of Genes and Genomes (KEGG) pathway enrichment analysis and visualization. We applied Cytoscape 3.7.1 to construct a protein–protein interaction (PPI) network of these genes and then used the MCODE algorithm to determine the hub gene of the protein densely connected neighborhood. The University of California, Santa Cruz (UCSC) Genome Browser on Human (GRCh38/hg38) Assembly was employed to display the binding position of the target gene and PTTG1 in ChIP-seq.
Results
Expression Level of PTTG1 Protein in Tissue Microarray
The IHC scores of PTTG1 in each ESCC and normal case based on two pathologists were presented in Supplementary Table 1. The intraclass correlation coefficients of IHC score in ESCC and normal tissues between two pathologists were 0.943 and 0.938, respectively. IHC staining of tissue chips showed that the PTTG1 protein expression level in ESCC tissues was significantly higher than in non-cancerous tissues (10.410 ± 1.880 vs. 7.410 ± 2.153, P < 0.0001; AUC = 0.8405, P < 0.0001) (Figure 1). However, PTTG1 expression did not show a significant correlation with various clinical parameters (Supplementary Table 2).
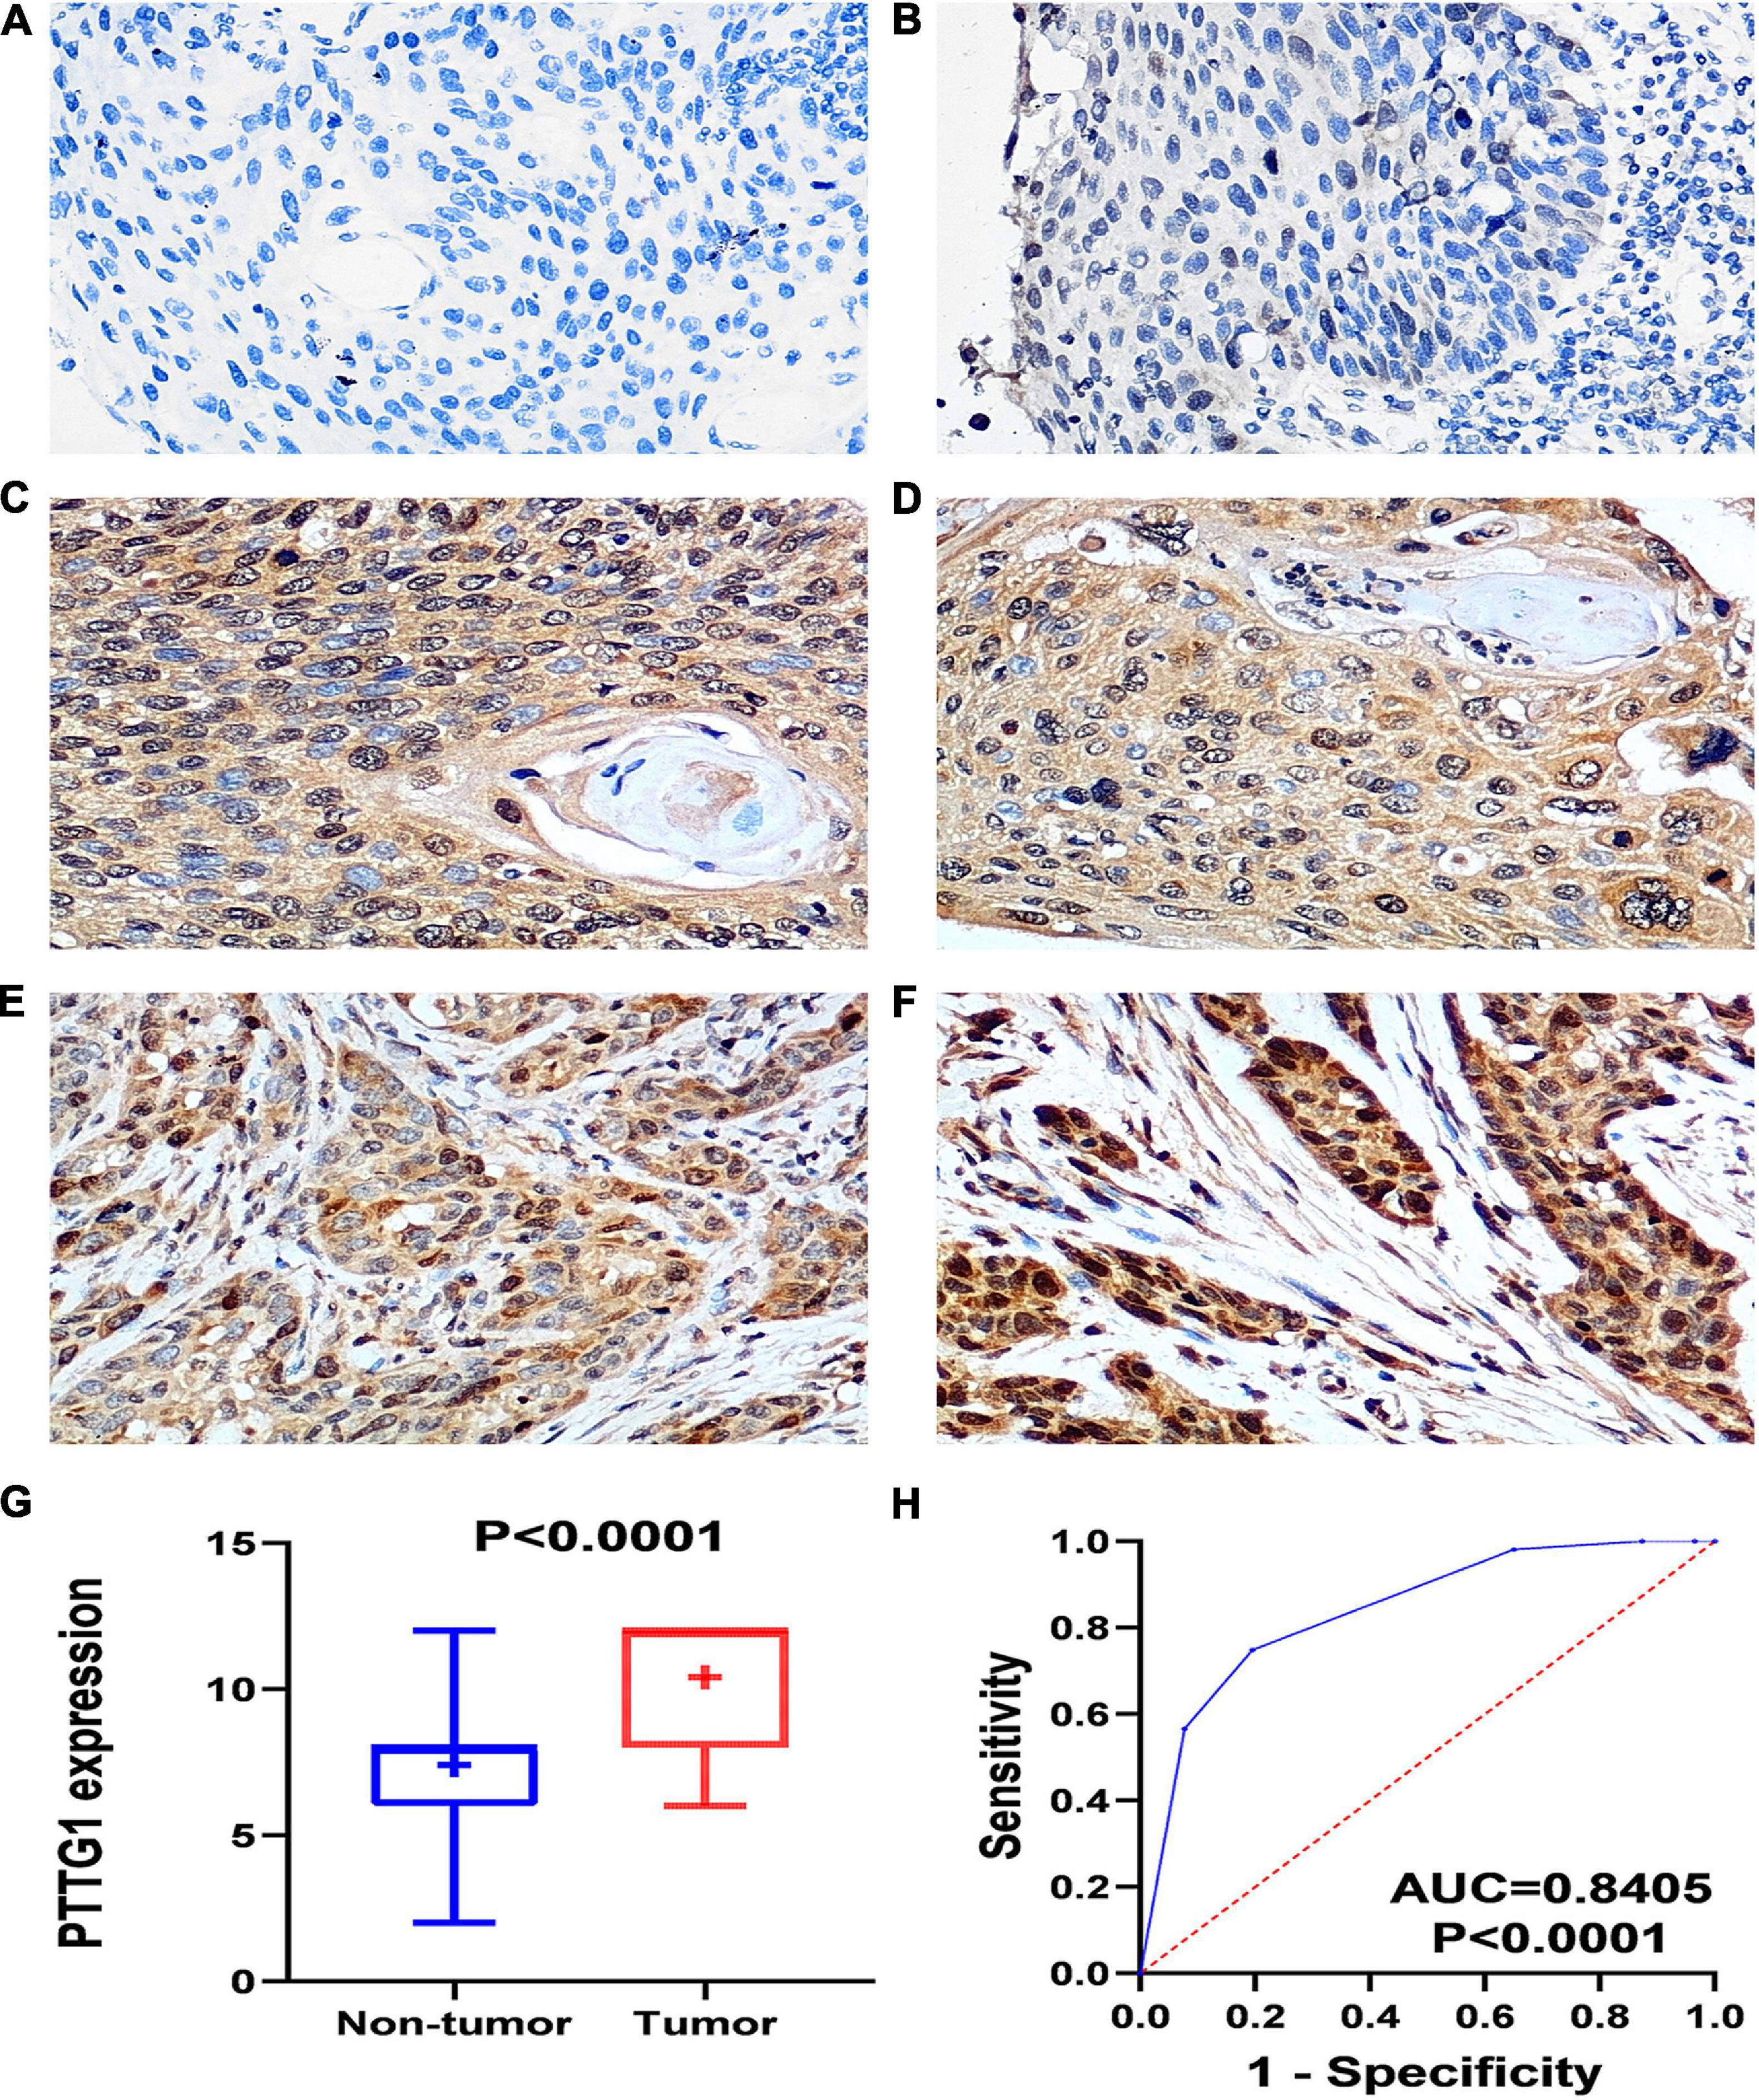
Figure 1. PTTG1 protein expression elevated in esophageal squamous cell carcinoma (ESCC) tissue chip assessed by in-house immunohistochemistry. (A,B) Immunohistochemical staining of PTTG1 protein in non-cancerous esophageal tissues from different cases. Both cases were scored as 0 (×400); (C–F) ESCC tissues (×400). The scores of case (C) and case (D) were both 6. The score was recorded as 8 for case (E) and 12 for case (F); (G) box diagram; (H) receiver operating characteristic (ROC) curve; AUC, area under the curve.
Expression Level of PTTG1 mRNA in In-House RNA-Seq
In order to confirm the high expression of PTTG1 in ESCC tissues, we collected ESCC tissues and their matched non-cancer tissues from eight clinical patients with ESCC and obtained in-house RNA-seq data of these samples. It was found that the expression of PTTG1 in ESCC tissues was significantly higher than in the adjacent tissues (5.6999 ± 0.6218 vs. 3.8690 ± 1.6307, P = 0.0102) (Figures 2A,B). ROC analysis showed that the expression of PTTG1 was remarkably different between ESCC and non-cancerous tissues (AUC = 0.8906, P = 0.0087) (Figure 2C). These results further confirmed that PTTG1 was overexpressed in ESCC.
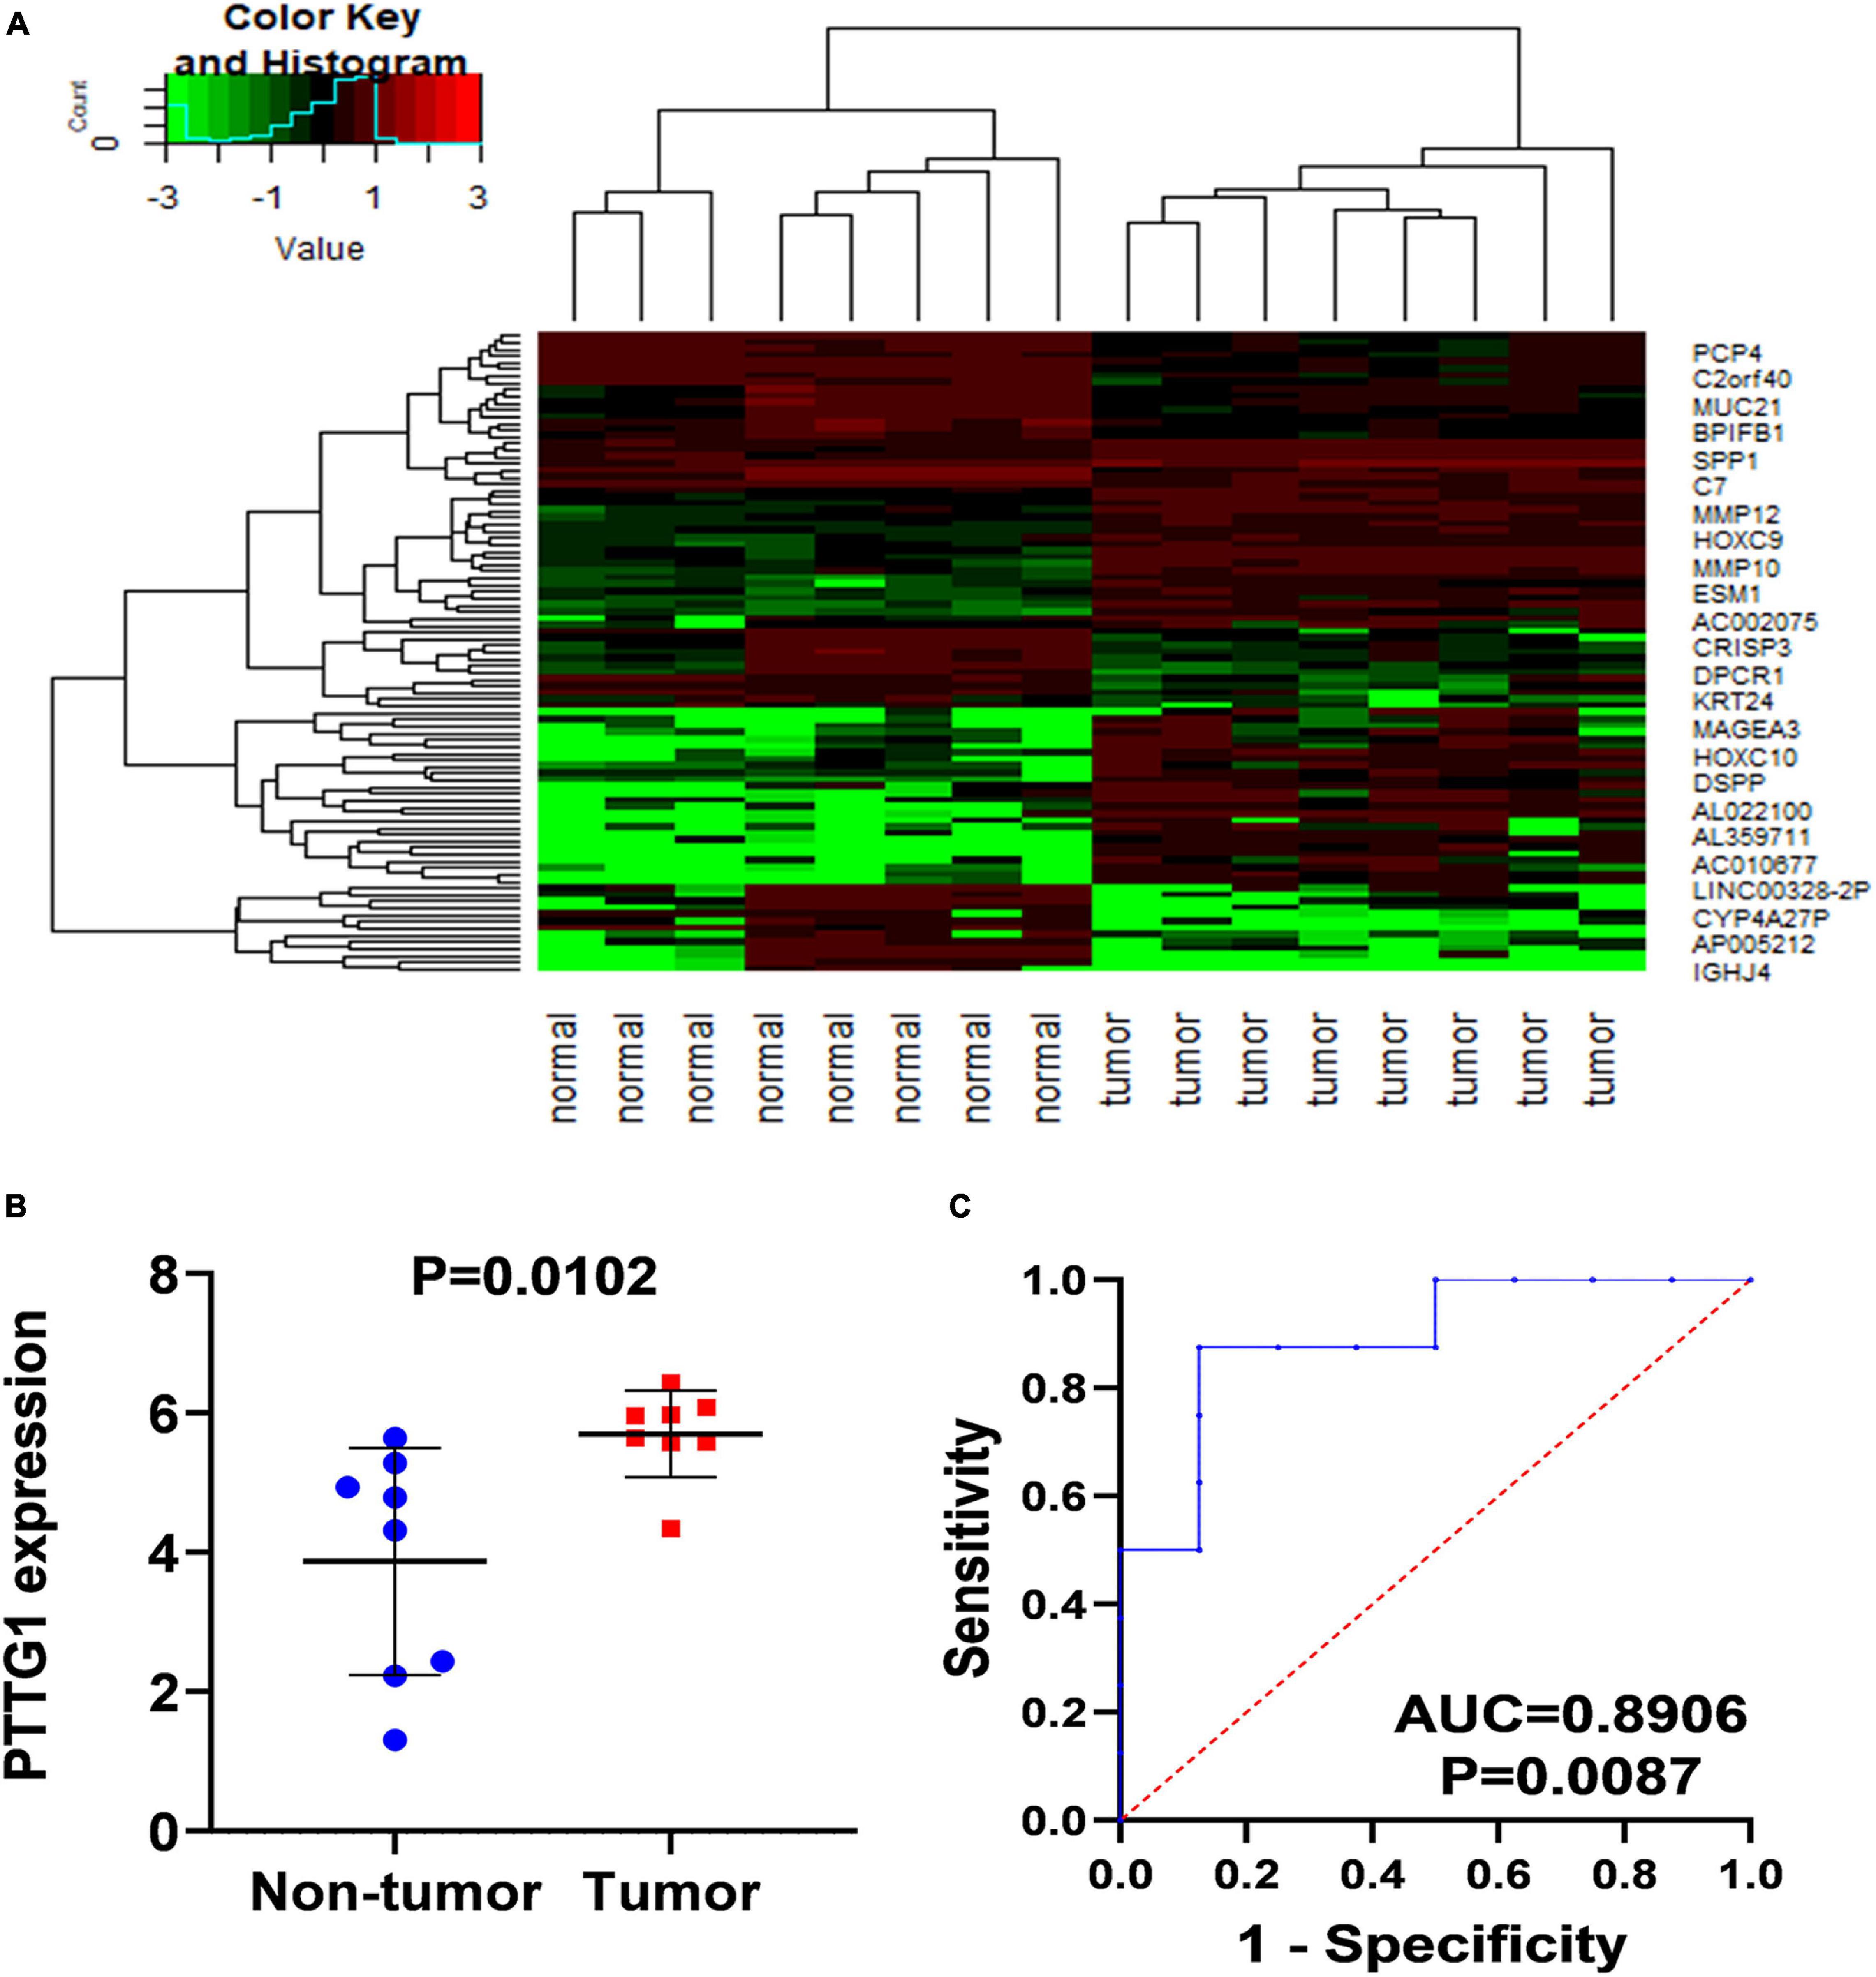
Figure 2. In-house RNA-seq confirmed PTTG1 overexpression in ESCC tissues. (A) Heatmap of differentially expressed genes (DEGs). (B) Scatter plot. (C) ROC curve.
Clinical Significance of PTTG1 Expression Based on Public High-Throughput Data
To verify the results of our immunohistochemistry and RNA-seq experiments, a total of 15 GeneChips of ESCC tissues were gathered from public databases, namely, GSE45670GPL570, GSE77861GPL570, GSE26886GPL570, GSE69925GPL570, GSE100942GPL570, GSE33810GPL570, GSE17351GPL570, GSE20347GPL571, GSE38129GPL571, GSE29001GPL571, GSE33426GPL571, GSE23400GPL96, GSE32424, GSE45168, and GSE70409. In order to avoid batch effects, the GPL570 and GPL571 from the same platform were combined. In order to improve the reliability of differential mRNA screening results, we downloaded the RNA-seq data and clinical follow-up information of ESCC. All data collection processes are shown in Figure 3. We used seven data sets, including six GeneChips (GPL570, GPL571, GSE23400, GSE32424, GSE45168, and GSE70409), and RNA-seq data (2,307 cases in total, with 620 cases of ESCC and 1,687 non-cancer cases) to investigate the expression of PTTG1 in ESCC. After research, it was found that the expression of PTTG1 in four high-throughput platforms (GPL570, GSE23400, GSE70409, and TCGA-GTEx) was significantly higher than in the non-cancer control group (Figures 4A–F,M). ROC analysis of all data sets showed that the expression of PTTG1 had different degrees of significance for the clinical diagnosis of ESCC (Figures 4G–L,N). Further analysis of public RNA-seq data showed that the average expression of PTTG1 in ESCC was 11.5794 ± 0.7270, which was significantly higher than that of the non-cancer control group (7.5575 ± 2.5127, P < 0.001). We also analyzed the relationship between the expression of PTTG1 and the clinical pathological parameters of ESCC patients. The expression of PTTG1 was negatively correlated with the age of ESCC patients (r = −0.3097, P = 0.004), and the expression of PTTG1 in young patients was higher (11.8 ± 0.7 vs. 11.3 ± 0.6, P = 0.004) (Supplementary Table 3). However, no significant difference in PTTG1 expression was found in other clinicopathological parameters. The survival condition of patients with high PTTG1 expression was worse than that of patients with low PTTG1 expression (HR = 1.29), but no significant statistical difference was found (Figure 4O).
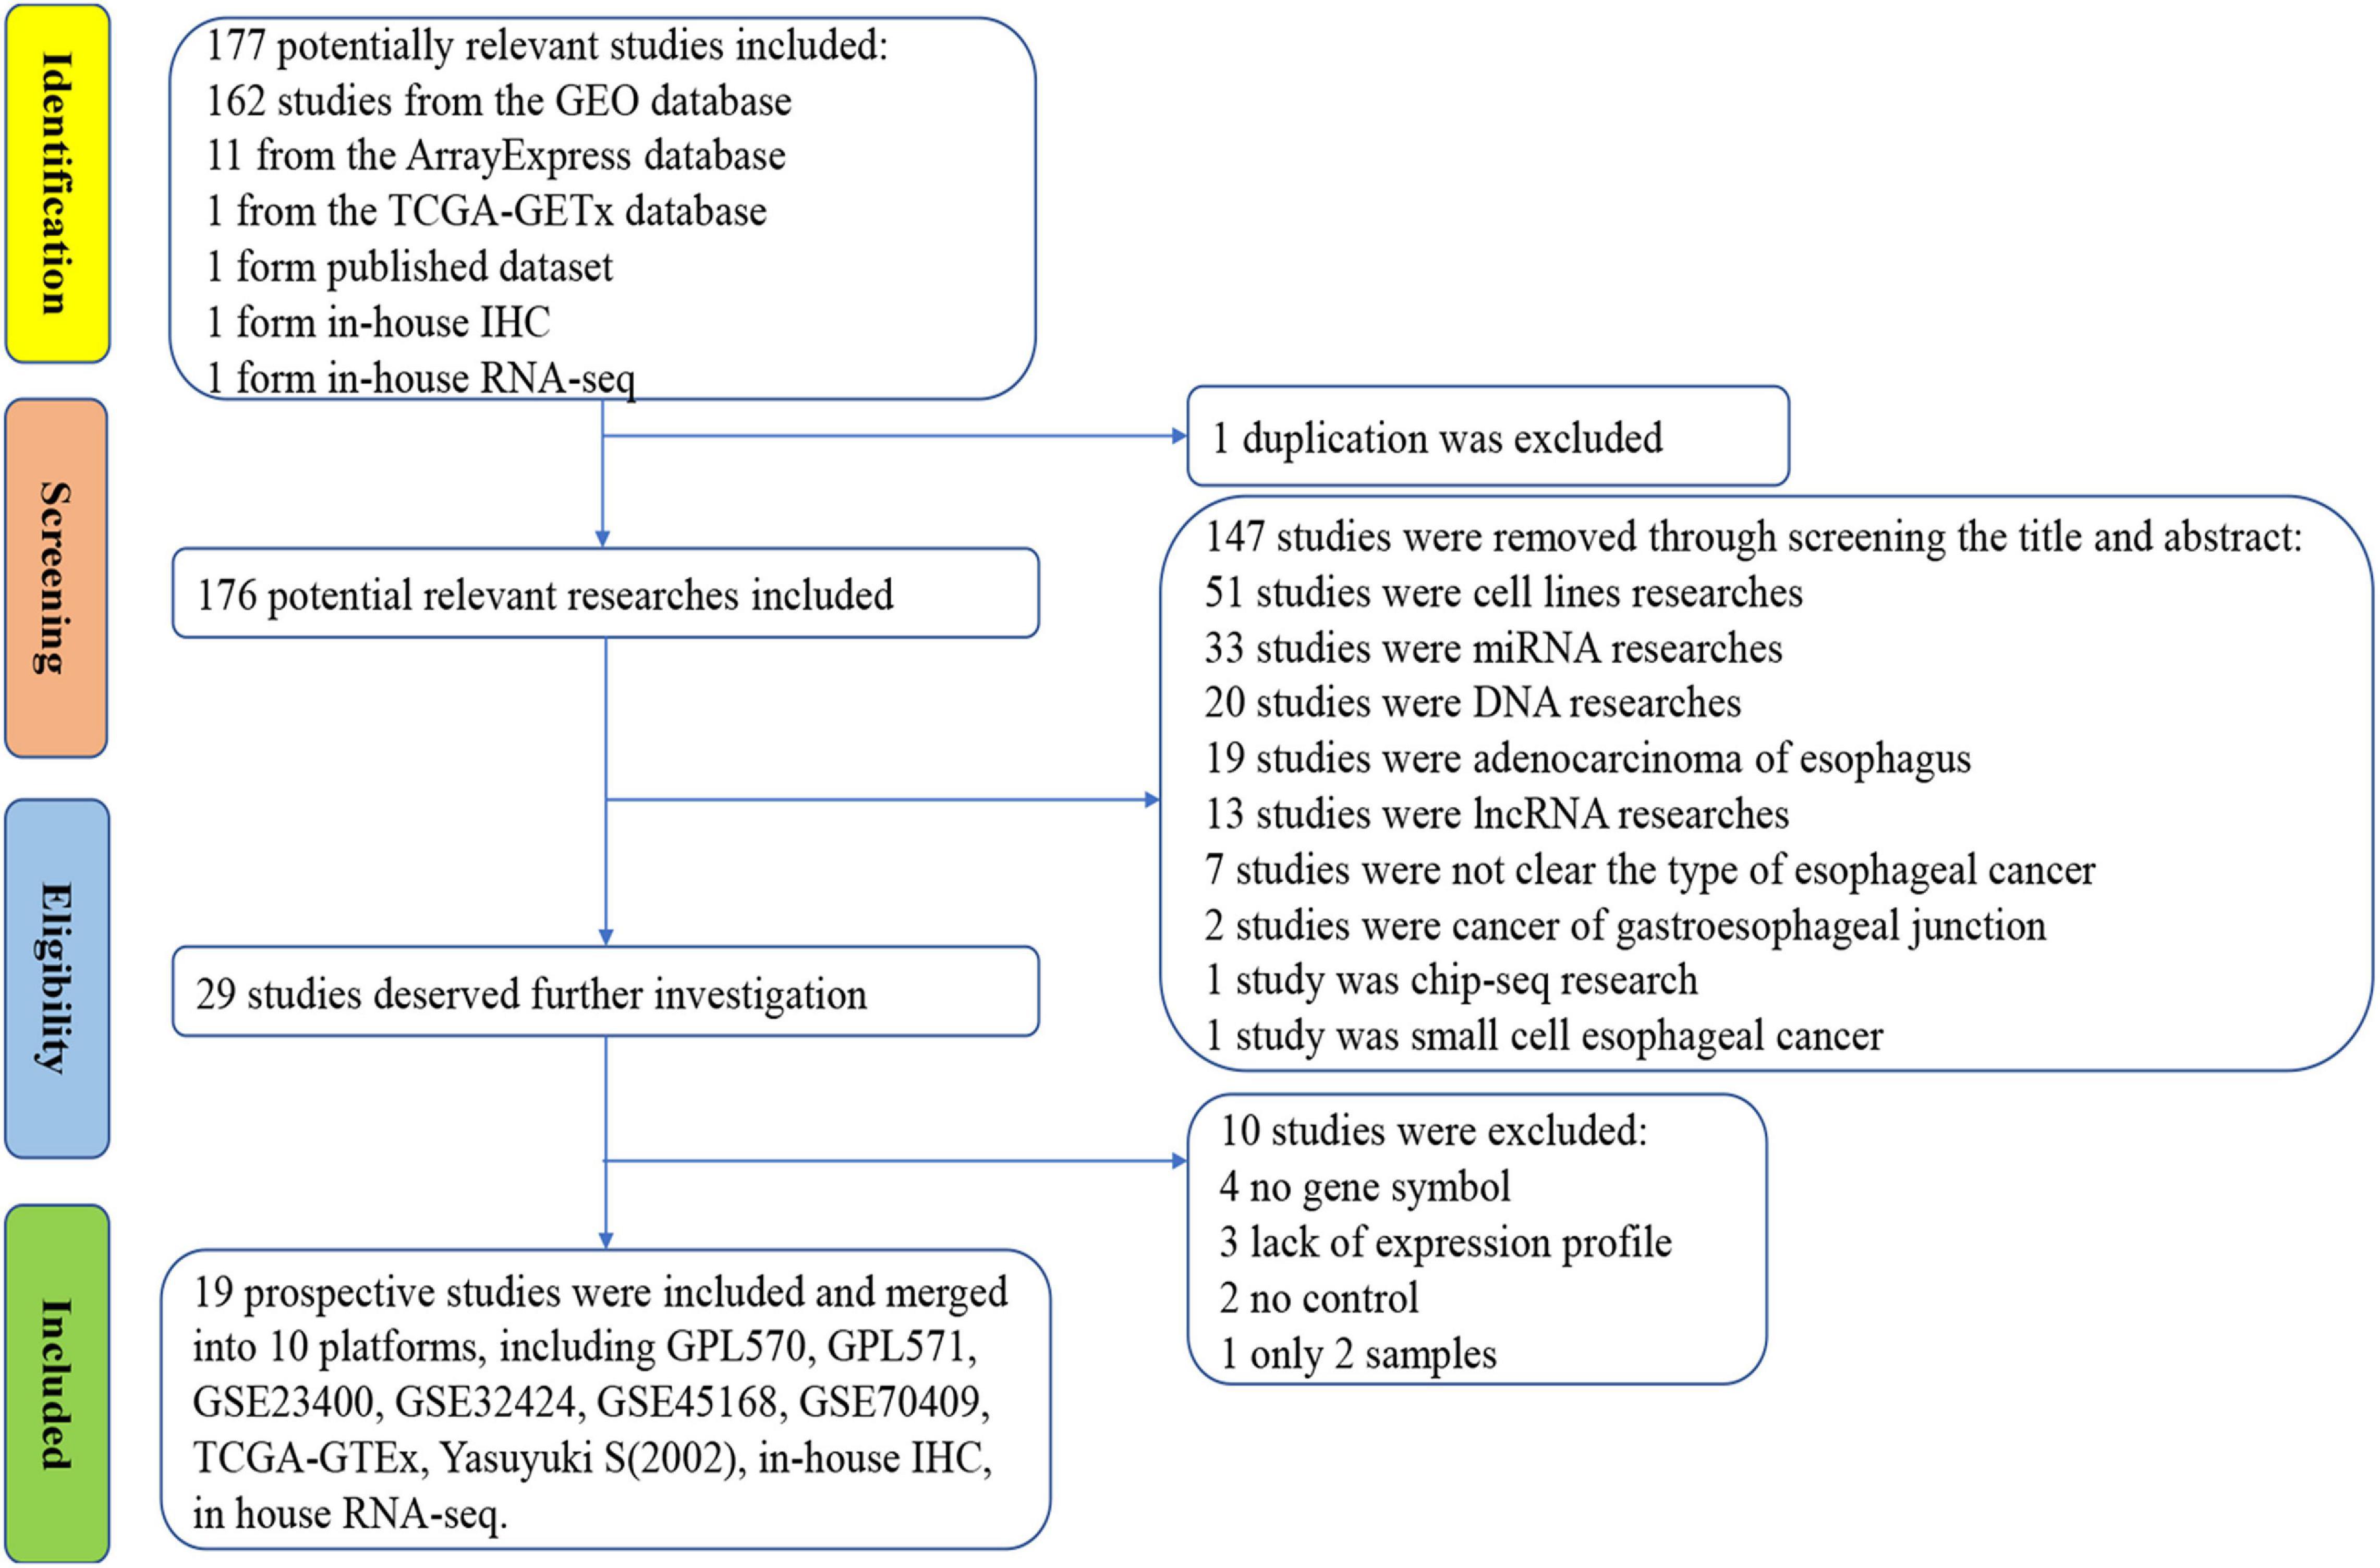
Figure 3. Flow chart of data collection for this study.
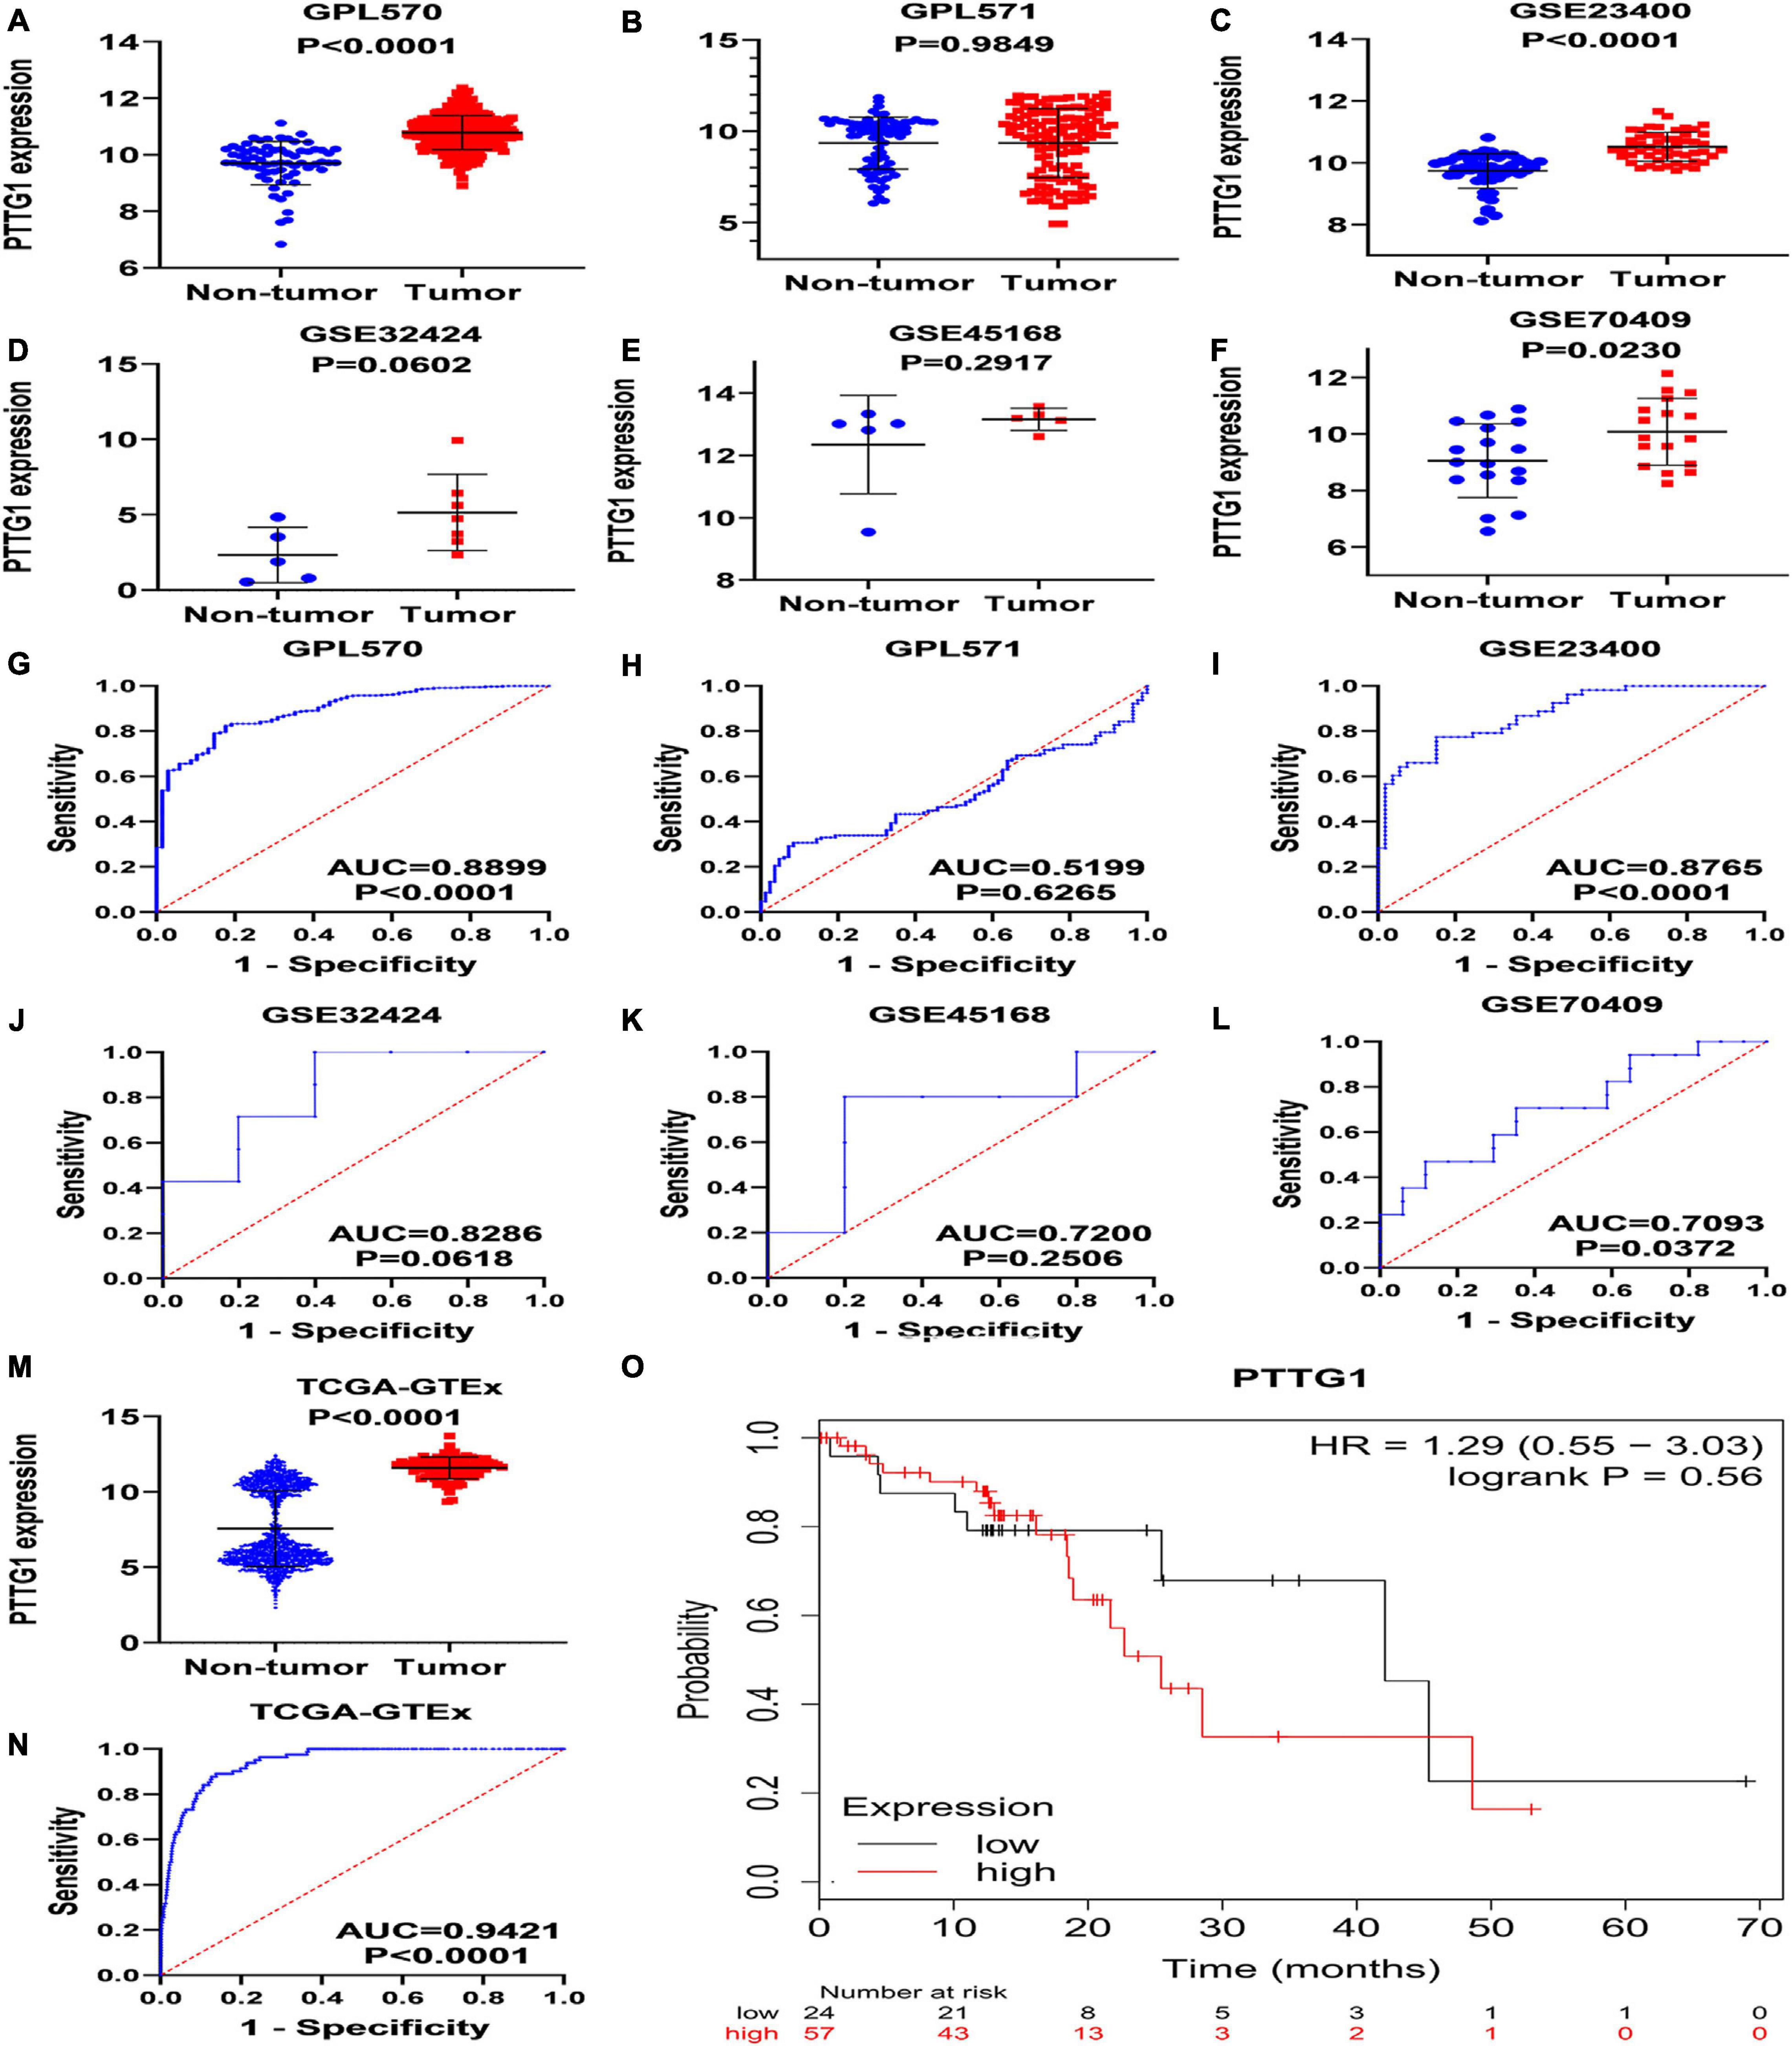
Figure 4. Expression of PTTG1 mRNA upregulates in ESCC based on high-throughput RNA-seq of public database. GPL570 (A,G), GPL571 (B,H), GSE23400 (C,I), GSE32424 (D,J), GSE45168 (E,K), and GSE70409 (F,L). The cancer genome atlas (TCGA) dot plot and ROC curve (M–O) KM survival analysis curve based on TCGA data from KMplot database; the median expression value of PTTG1 was applied as cut-off value to classify patients into low and high expression groups.
Comprehensive Analysis of PTTG1 Expression
Because the research scale of a single data set was too small, it was difficult to draw effective conclusions. To make the results more reliable, we combined public RNA-seq, GeneChip, in-house IHC, in-house RNA-seq data, and published data (Shibata et al., 2002) for analysis. Our research included 835 cancer tissues and 1,886 non-cancer tissues. Considering the heterogeneity of our data, we chose a random effects model. The SMD of the overall PTTG1 expression was 1.17 (95% CI: 0.72–1.62, P < 0.01, Table 1), which indicated that PTTG1 was noticeably expressed in ESCC. The area under the SROC curve was 0.86 (95% CI: 0.83–0.89), with sensitivity being 0.75 (95% CI: 0.62–0.85), and specificity being 0.83 (95% CI: 0.77–0.87) (Figure 5A and Supplementary Figure 2A). The positive likelihood ratio was 4.31 (95% CI: 3.21–5.80), and the negative likelihood ratio was 0.30 (95% CI: 0.19–0.48) (Supplementary Figure 2B). The diagnostic odds ratio was 14.22 (95% CI: 7.60–26.62) (Supplementary Figure 2C). To visualize the publication bias, we performed Begg’s funnel plot and Egger’s test. The Begg’s test showed no obvious publication bias (P = 0.175, Figure 5B). Egger’s test also showed that the high expression of PTTG1 in ESCC did not have a publication bias (P = 0.844). After a comprehensive analysis, PTTG1 was confirmed to display high expression in ESCC.
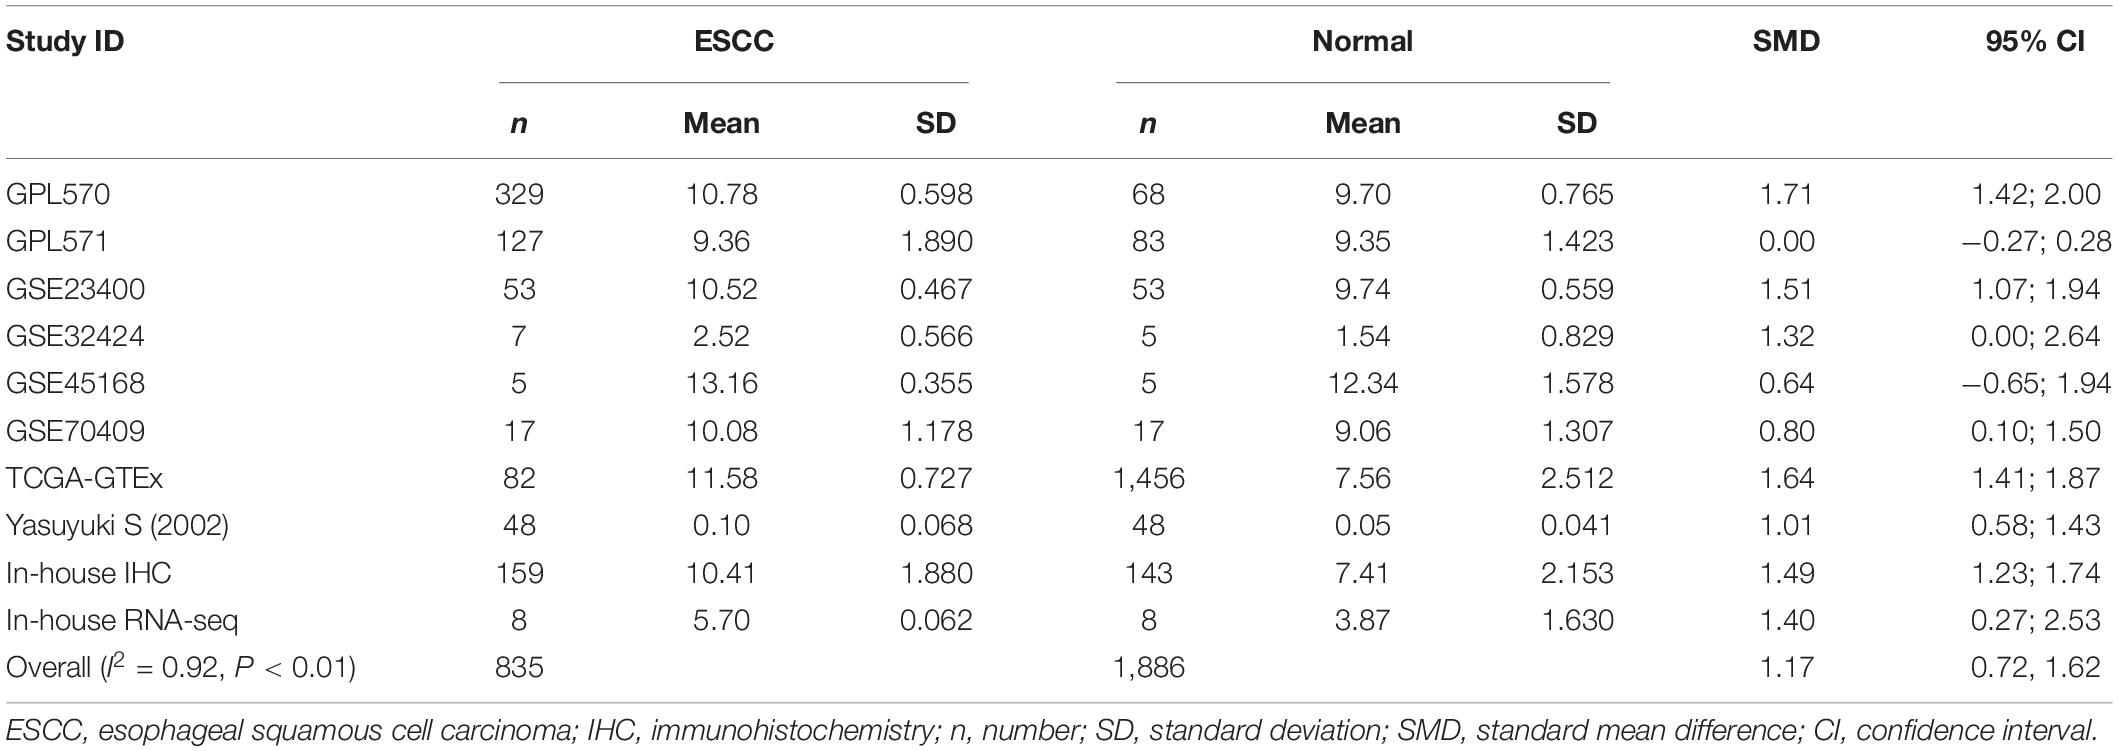
Table 1. Comprehensive analysis of PTTG1 expression in esophageal squamous cell carcinoma (ESCC) based on gene microarrays, in-house immunohistochemistry (IHC), public RNA-seq, and in-house RNA-seq.
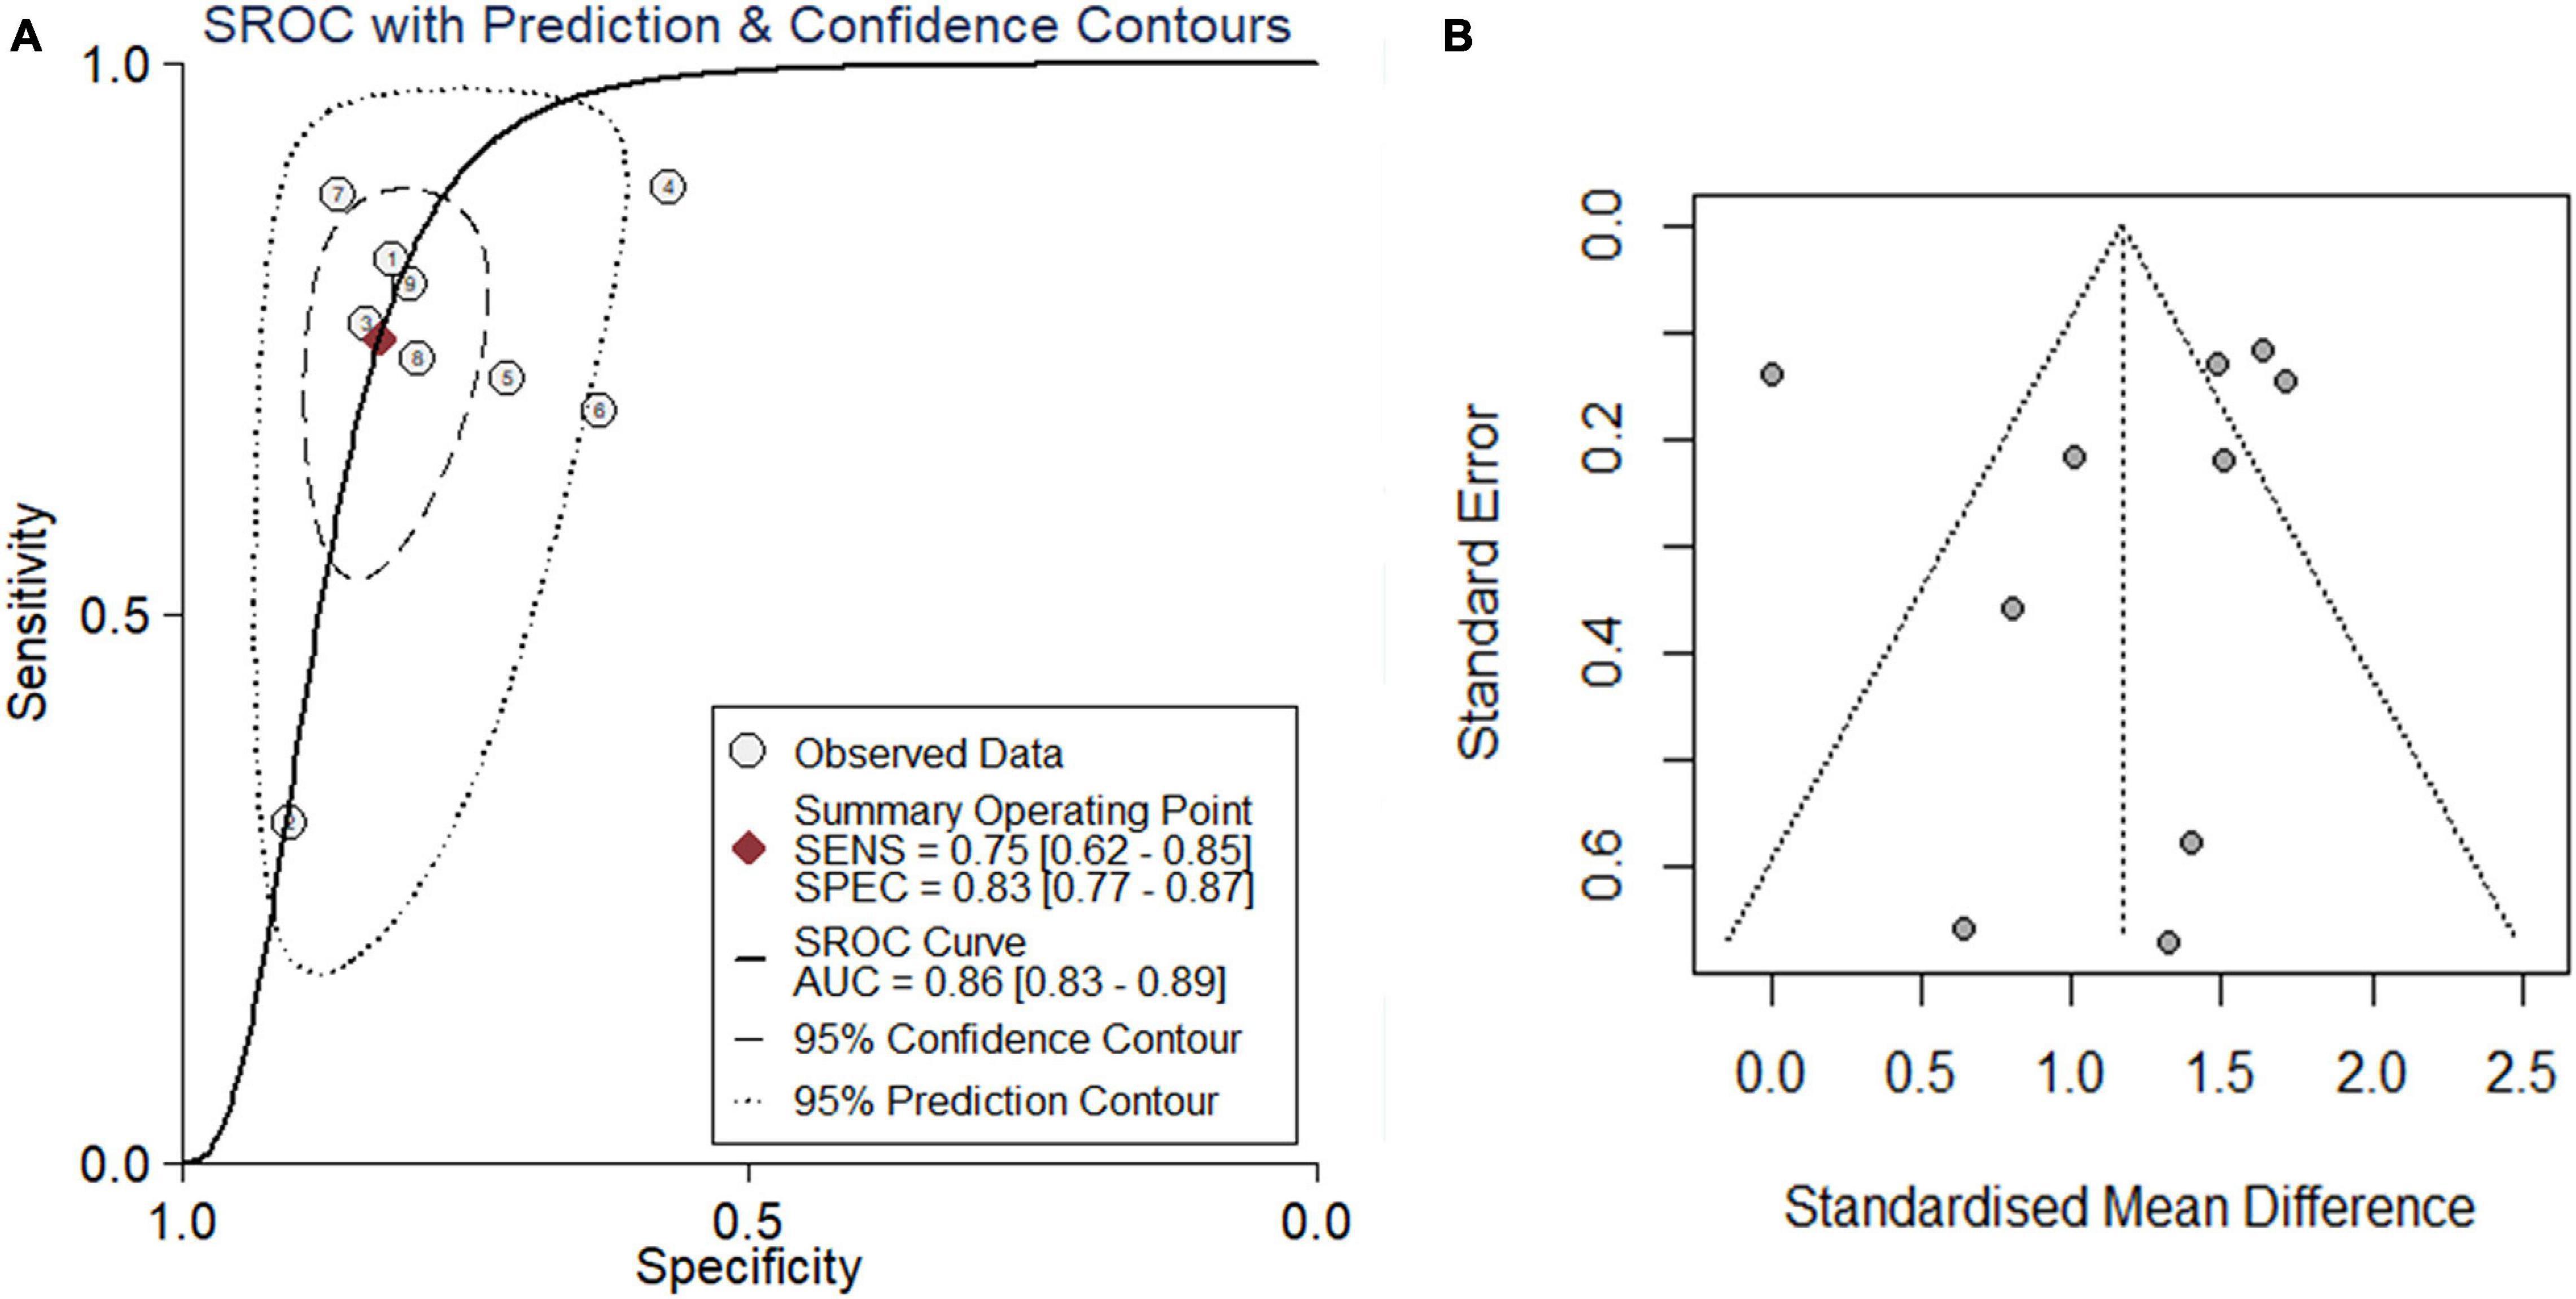
Figure 5. Comprehensive analysis further confirmed that PTTG1 was significantly overexpressed in ESCC. (A) Summary receiver operating characteristic (SROC) curve. (B) Funnel chart of publication bias. AUC, area under curve.
Enrichment Analysis of Differentially Expressed Genes, PTTG1-Related Genes and Predicted Target Genes and Construction of Protein–Protein Interaction Network
Our researchers obtained a total of 23,872 DEGs, including 14,594 upregulated genes, 9,278 downregulated genes, and 11,450 related genes from six GeneChip platforms, TCGA-GTEx RNA-seq and in-house RNA-seq. The Cistrome DB database was used to predict PTTG1 target genes, and 19,719 genes were acquired. We selected all the PTTG1-related genes to combine with 706 target genes with a score greater than 0.5 in the results of the Bistro DB ChIP-seq. We examined intersections with the upregulated and downregulated genes, respectively, and eventually gained 192 genes that crossed with the upregulation and 139 genes that overlapped with downregulation (Figures 6A,B). Then, we conducted GO function enrichment, including biological process (BP), cellular component (CC), molecular function (MF), and KEGG pathway analysis. Figures 7, 8 illustrate the enrichment analysis of upregulated and downregulated overlapping genes, respectively. As shown in the figures, the results of gene enrichment of the two parts were similar. In the BP process, these genes were mainly enriched in cellular processes, metabolic processes, and biological regulation; in CC, they were largely enriched in organelles; in MF, they were mostly concentrated in functions such as catalytic activity, binding, and transportation activities; in KEGG pathway analysis, they were mainly enriched in inflammation mediated by chemokine and cytokine signaling pathway. The upregulated genes were also enriched in the ubiquitin proteasome pathway, while the downregulated genes were enriched in the apoptosis signaling pathway. This indicated that PTTG1 may play a biological role in ESCC through these pathways. We also constructed a PPI network for these overlapping genes (Figure 9) and acquired the hub gene using MCODE. The hub genes we obtained were ARFGAP1, UBA6, STK4, ERCC4, SPTAN1, DDX24, RFC5, CHEK2, MAP1LC3B, ITCH, UBE2L3, MRPL20, MRPL22, RPL8, RPS14, PEX11A, ACSL1, SLC25A17, IKBKB, CFLAR, BCL10, CLNS1A, LSM3, and ERH. These hub genes were entered into the Cistrome DB website. In the ChIP-seq track, each block represented a peak where the target gene would bind to the corresponding transcription factor. Figure 10 shows that the SPTAN1 and PTTG1 binding peak could be seen at the site 278,308 bp away from the PTTG1 transcription start site, SLC25A17 was detected at 166,478 bp, IKBKB was discovered at 173,073 bp, and the overlapped peak of ERH and PTTG1 was found at 96,965 bp. The transcription initiation sites of these genes were all integrated with PTTG1 (Figure 10). To further explore the relationship between these target genes and PTTG1, we calculated the SMD of these genes and found that SLC25A17 (SMD = 1.13, 95% CI: 0.04–2.22, P < 0.01; Table 2) and ERH (SMD = 1.20, 95% CI: 0.26–2.15, P < 0.01; Table 3) were significantly highly expressed. We also analyzed the correlation between PTTG1 and these two target genes. The results showed that PTTG1 and SLC25A17 (r = 0.5399, P < 0.0001) (Figure 11A) and ERH (r = 0.5498, P < 0.0001) (Figure 11B) had a strong positive correlation, which suggested that PTTG1 might positively regulate the expression of these two genes. These results indicated that PTTG1 played an important part in regulating the functions of these proteins.
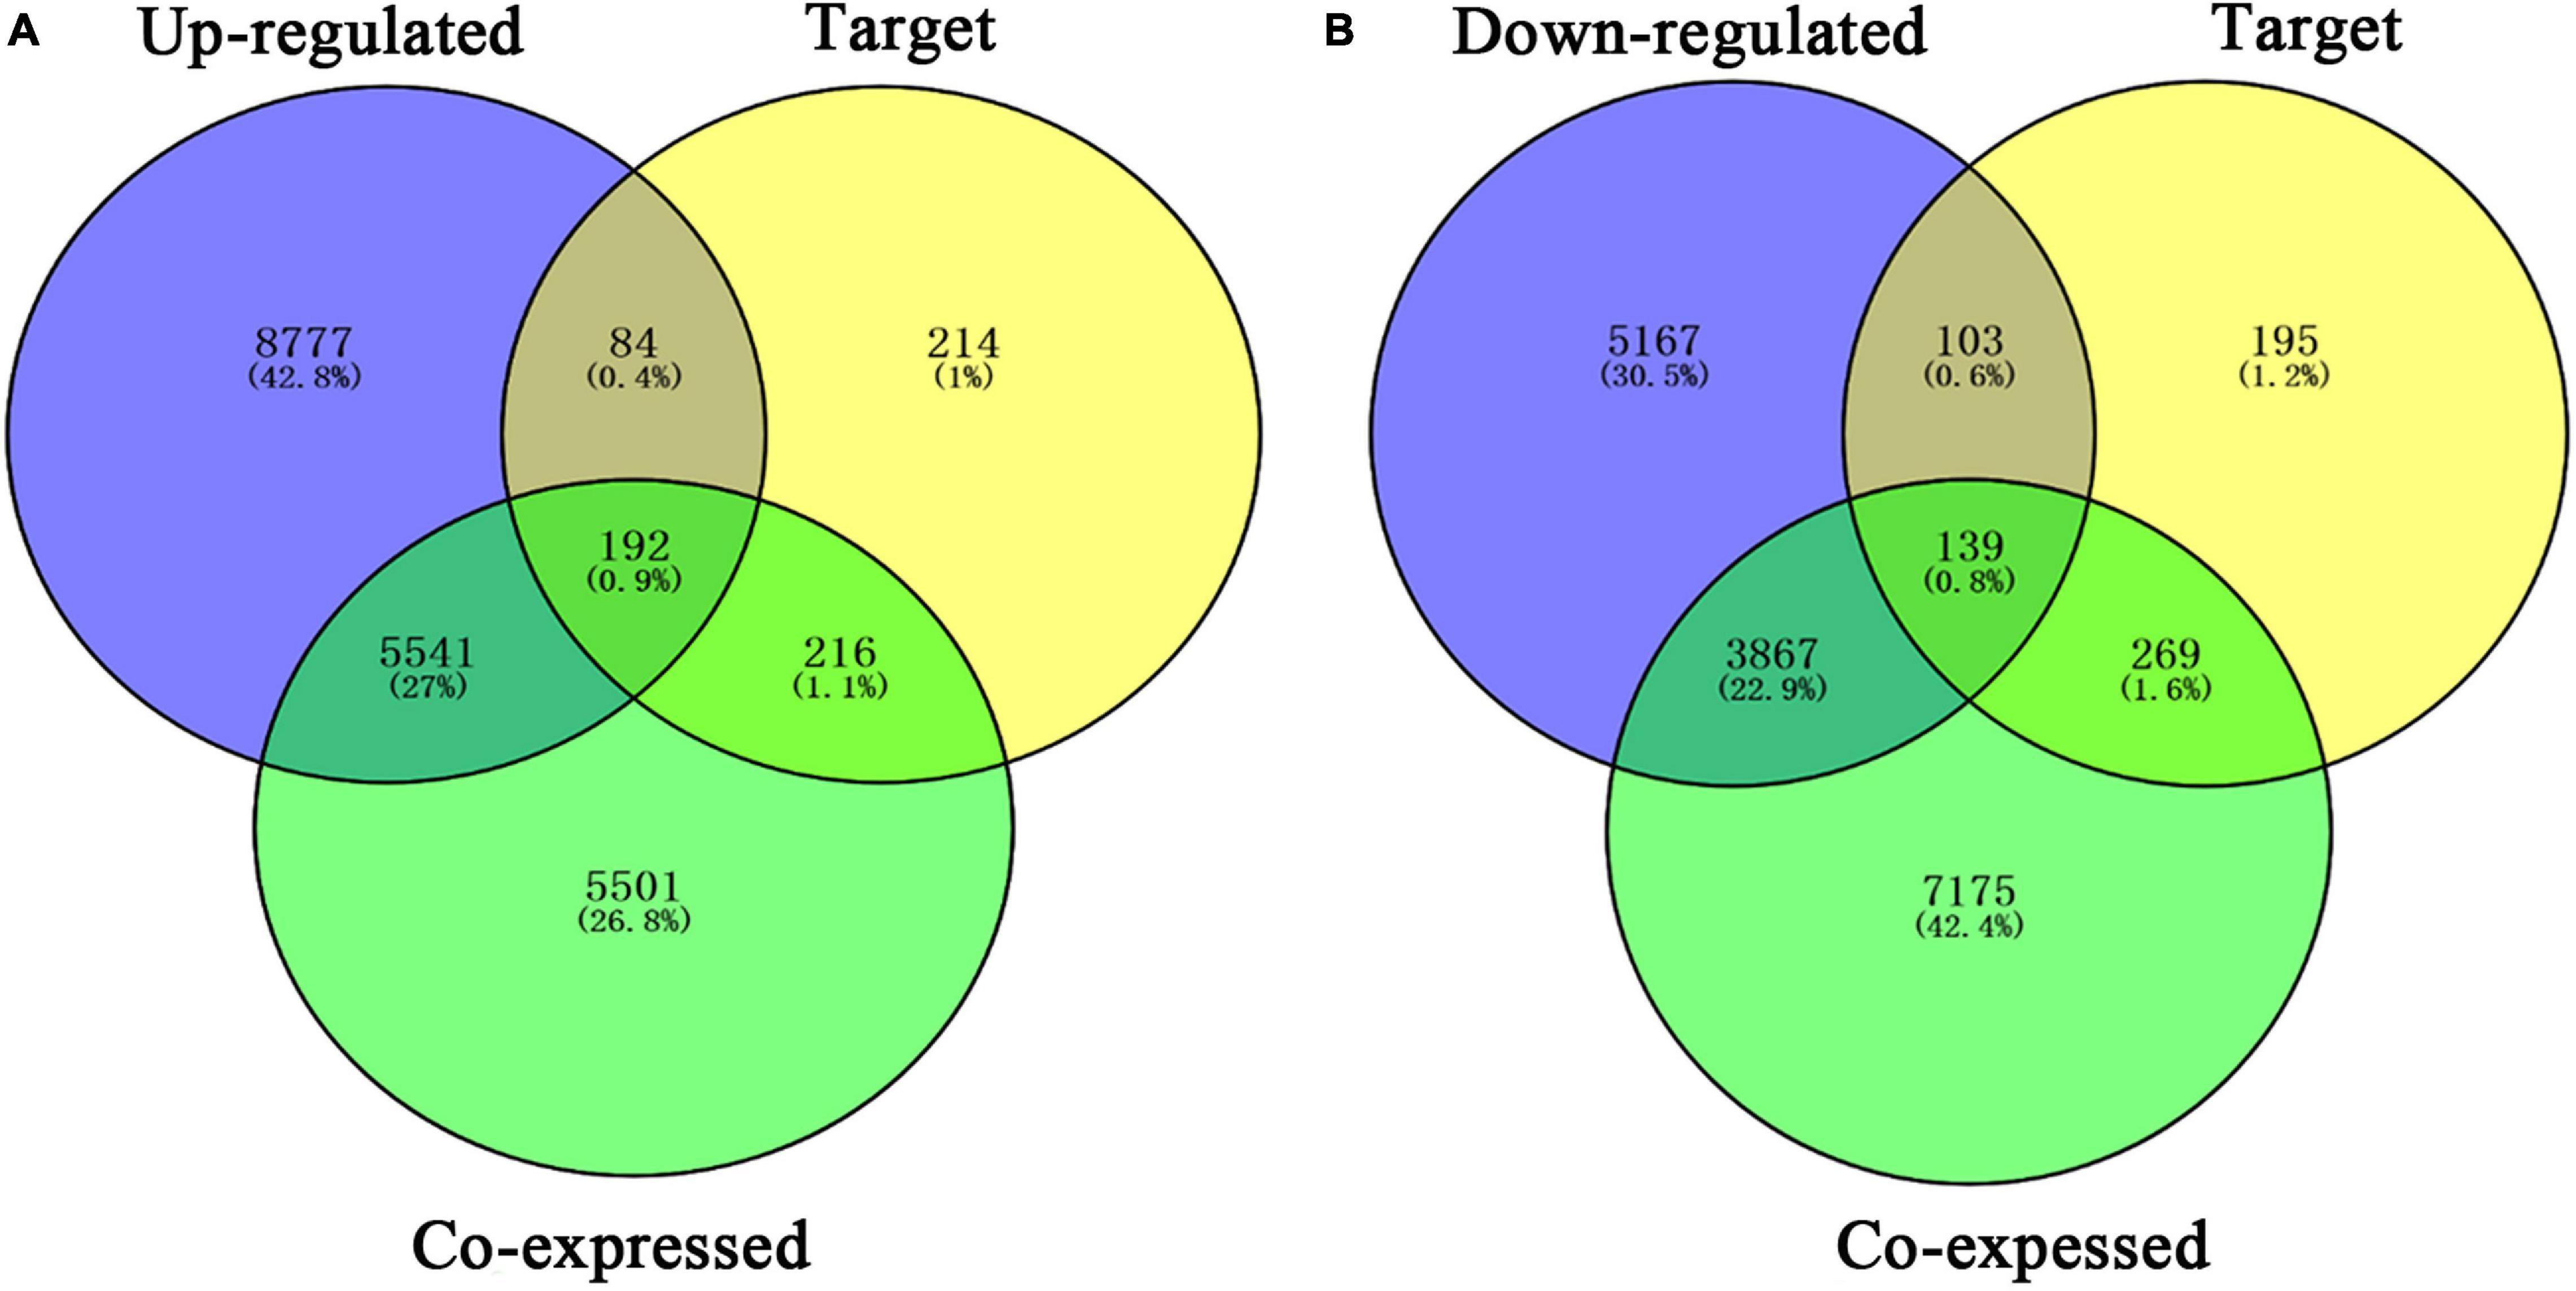
Figure 6. Venn diagrams of overlapping PTTG1-related genes, target genes, and upregulated genes (A) and downregulated genes (B). Upregulated, upregulated differential genes; downregulated, downregulated differential genes; target, target genes of PTTG1 in ChIP-seq.
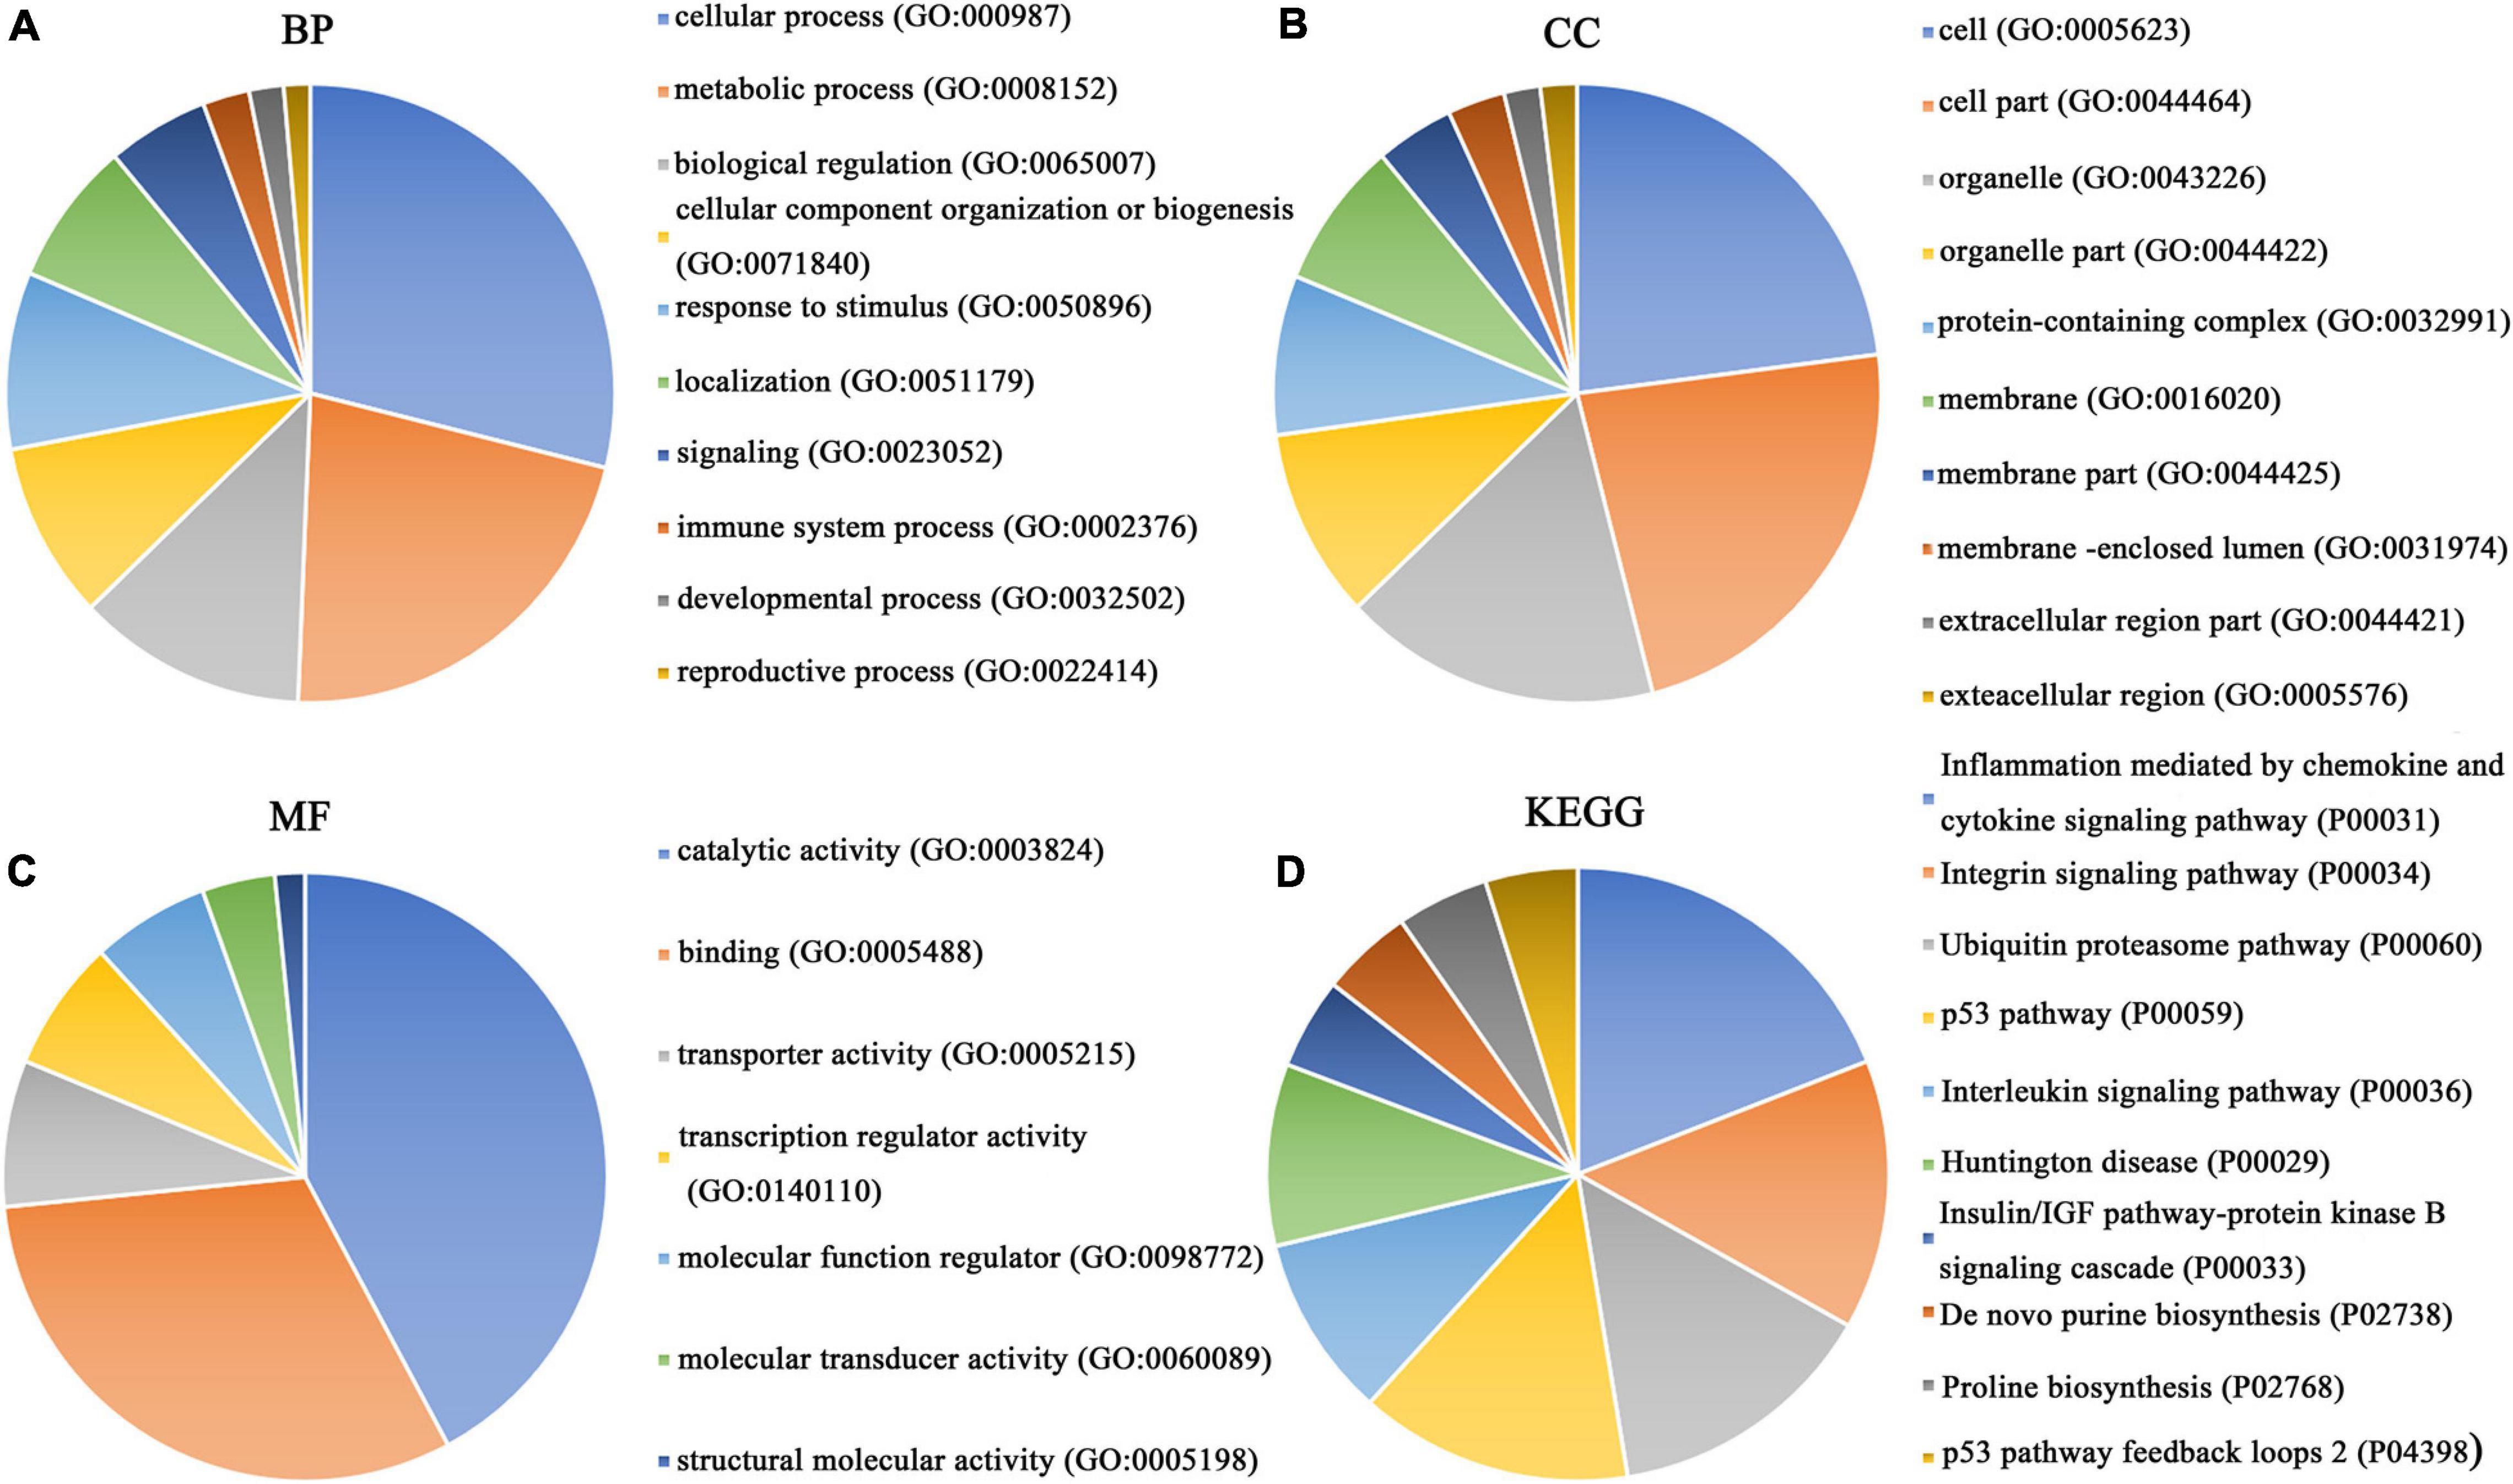
Figure 7. Gene ontology (GO) function annotation and Kyoto Encyclopedia of Genes and Genomes (KEGG) pathway analysis of upregulated overlapping genes. (A) Biological process. (B) Cell composition. (C) Molecular function. (D) KEGG pathway analysis.
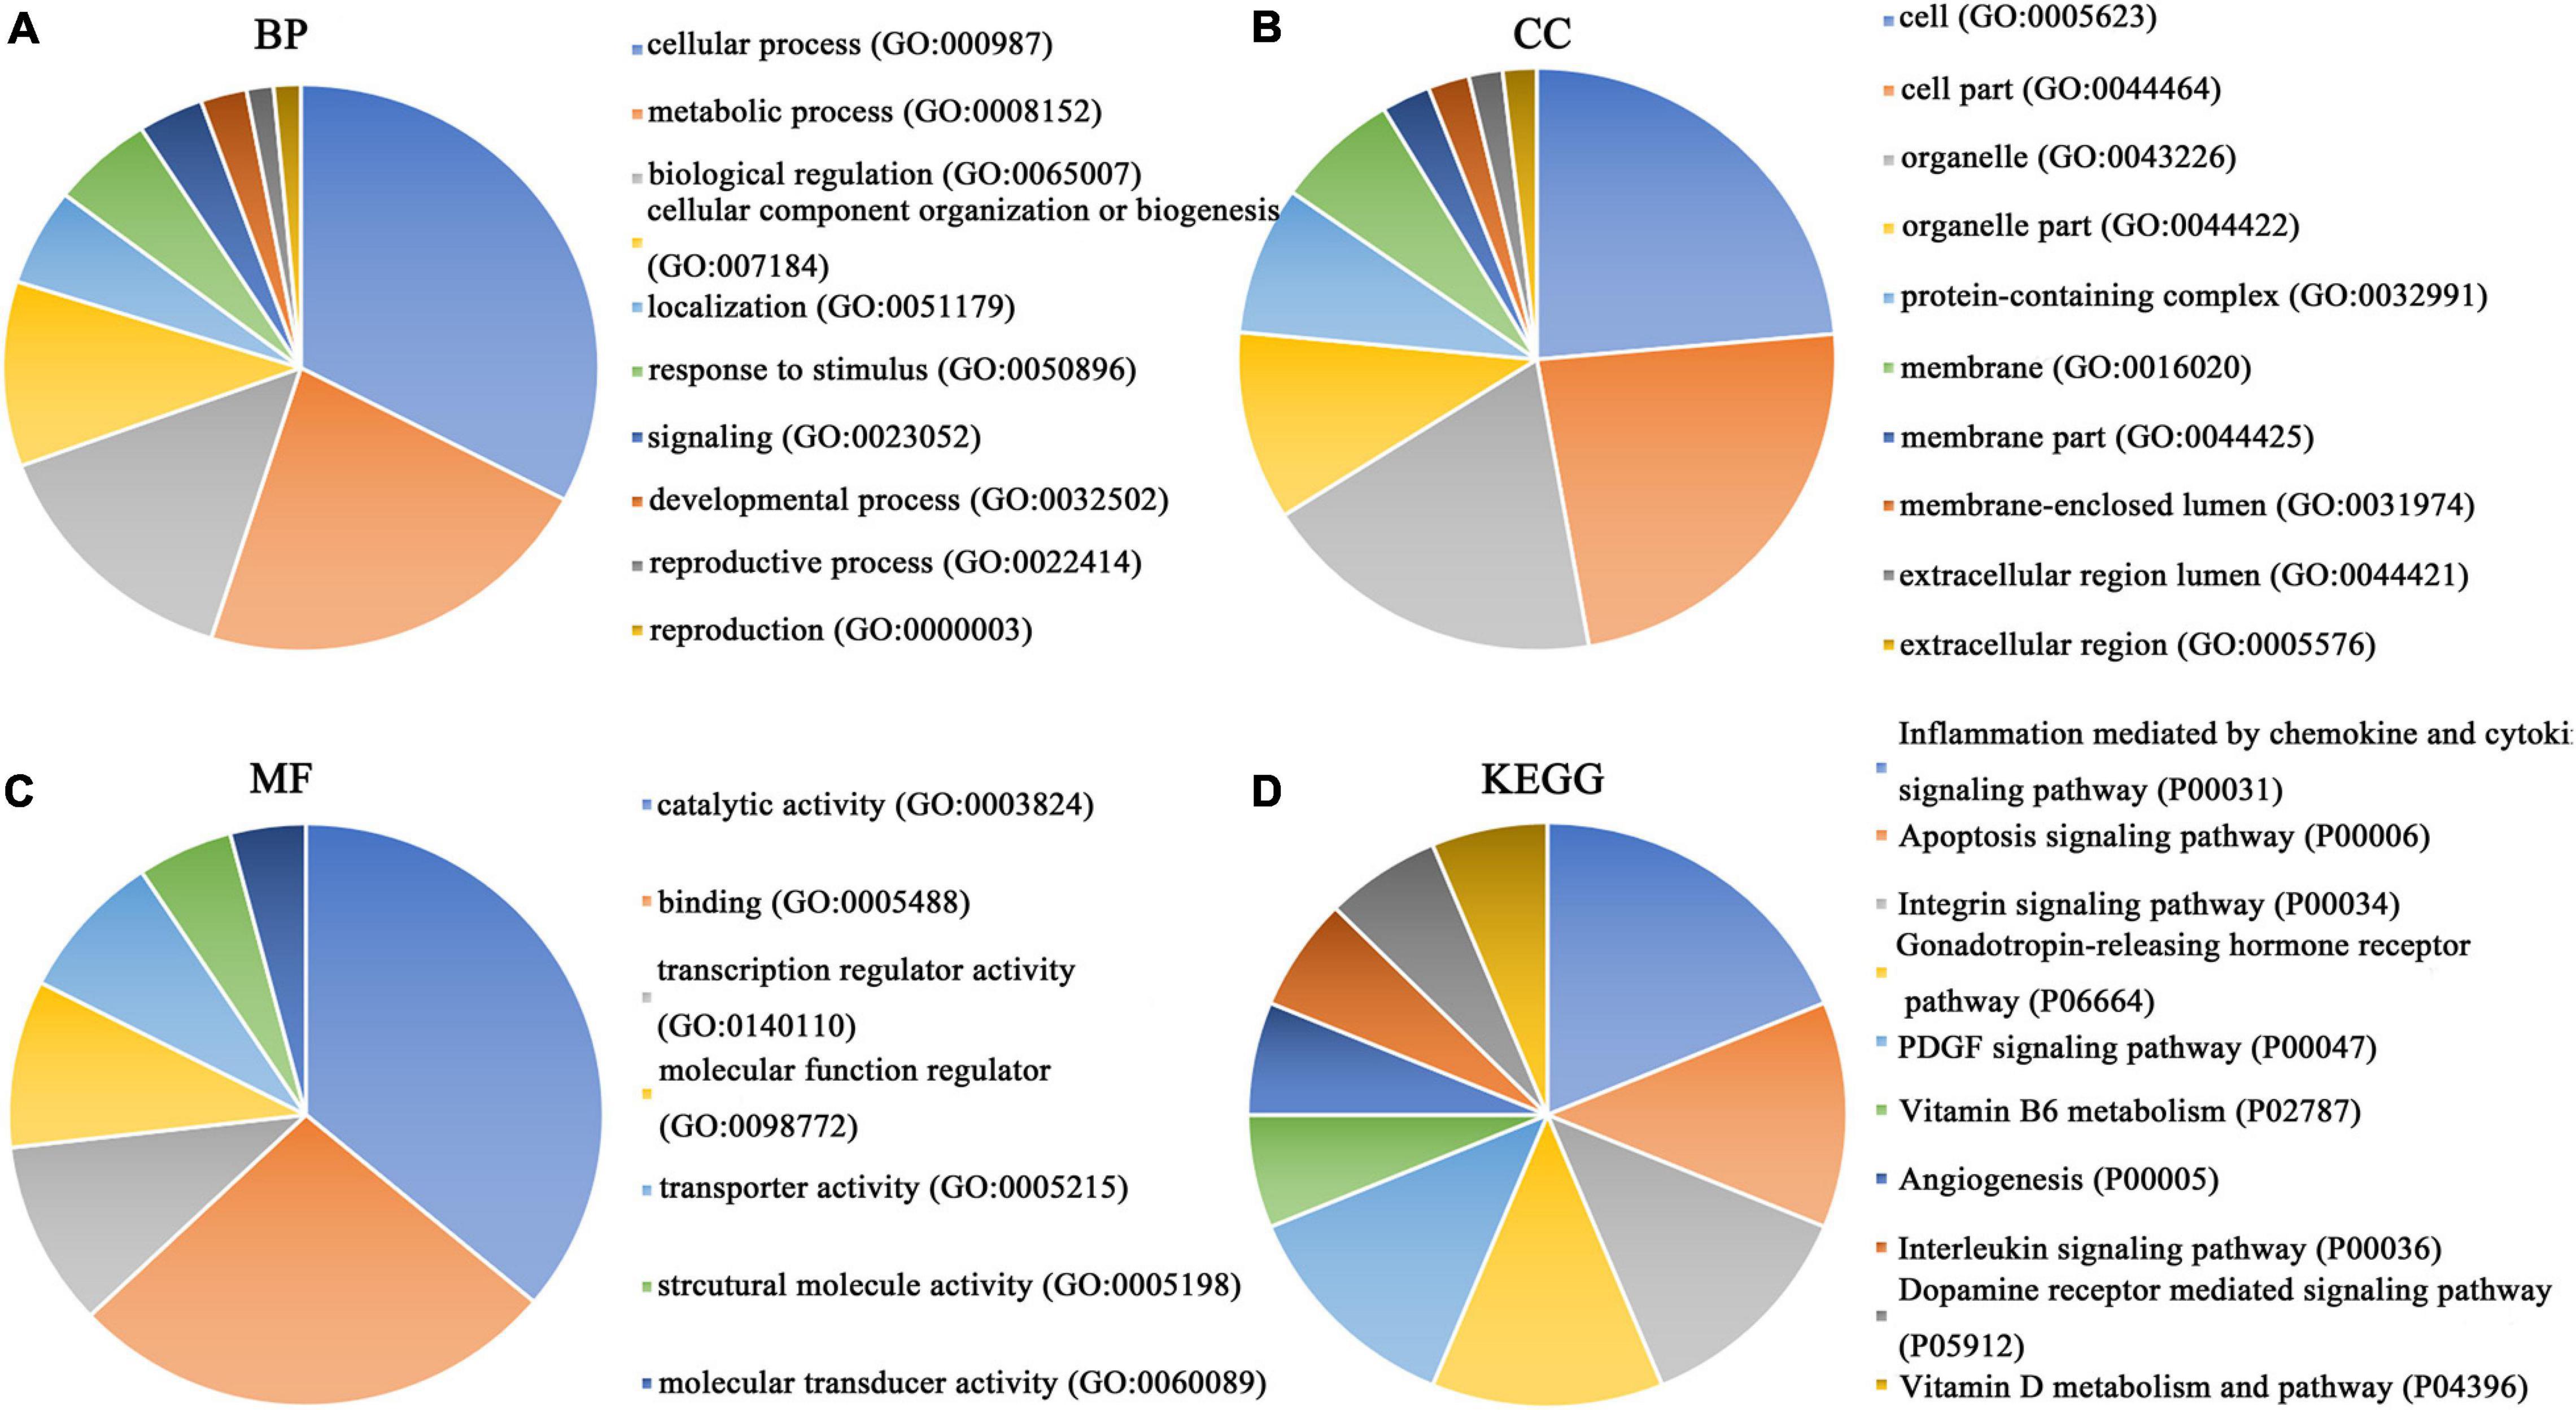
Figure 8. GO function annotation and KEGG pathway analysis of downregulated overlapping genes. (A) Biological process. (B) Cell composition. (C) Molecular function. (D) KEGG pathway analysis.
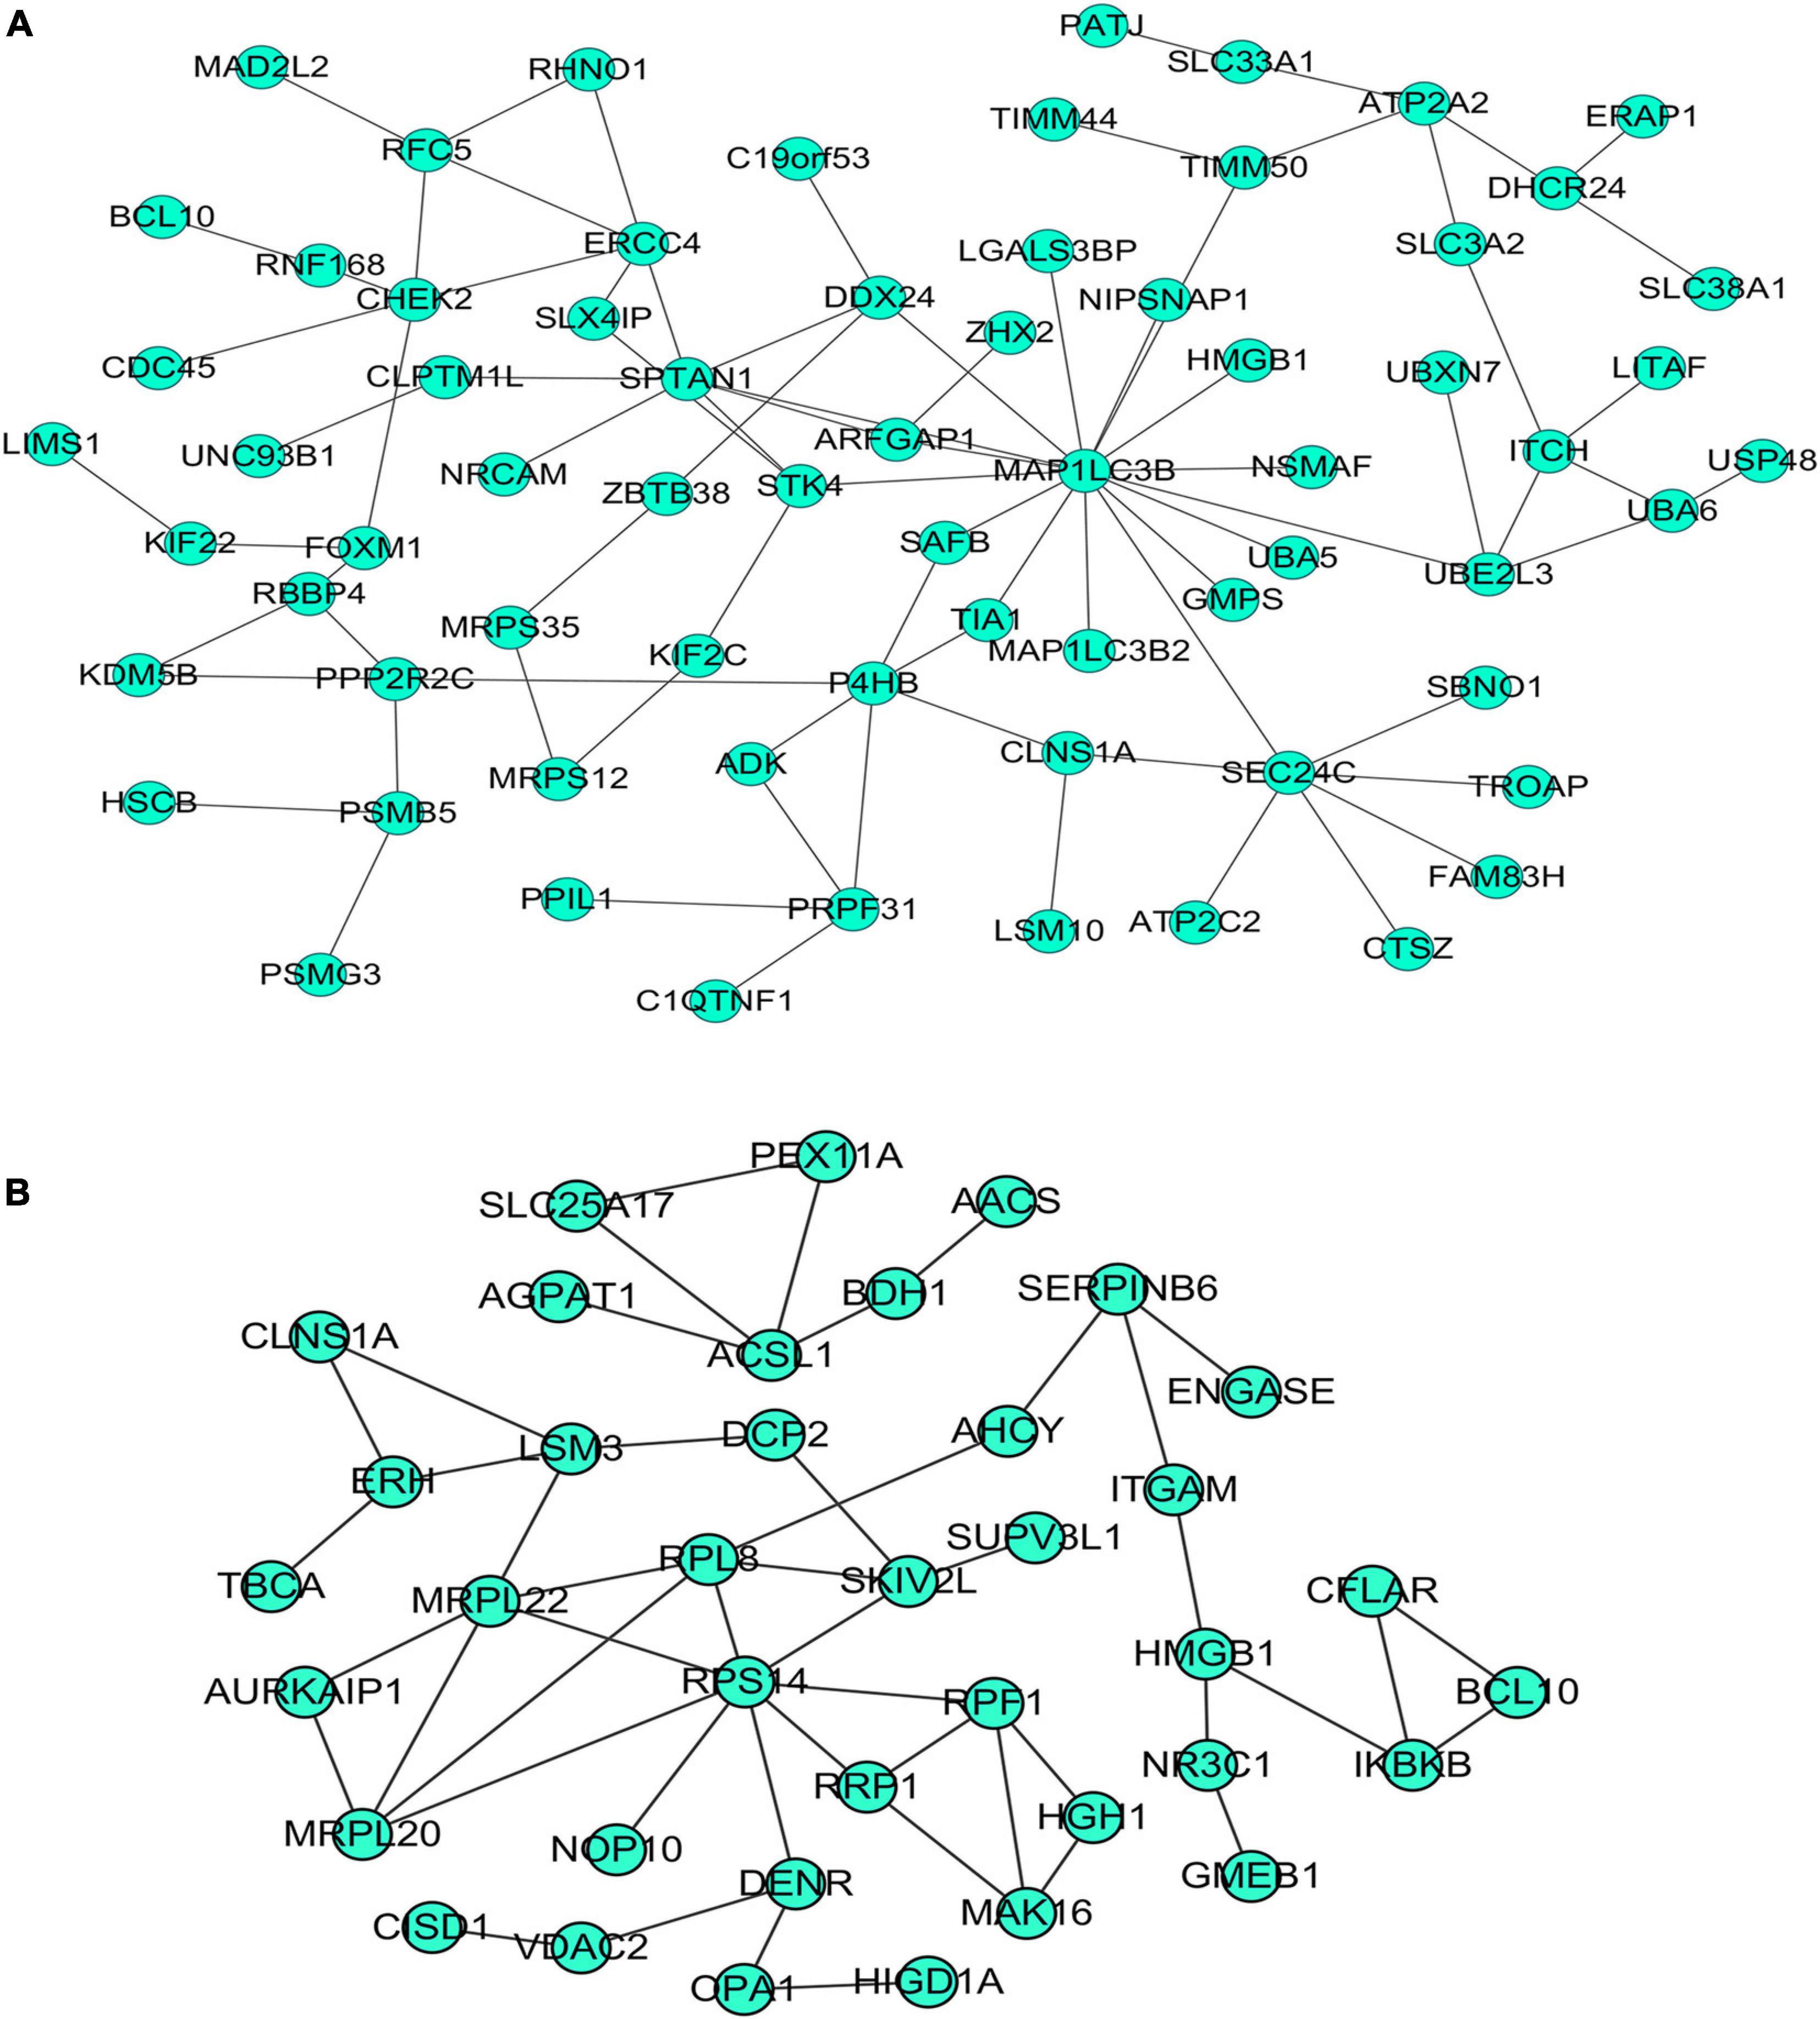
Figure 9. Protein–protein interaction (PPI) network of overlapping genes. (A) PPI network of upregulated overlapping genes. (B) PPI network of downregulated overlapping genes.
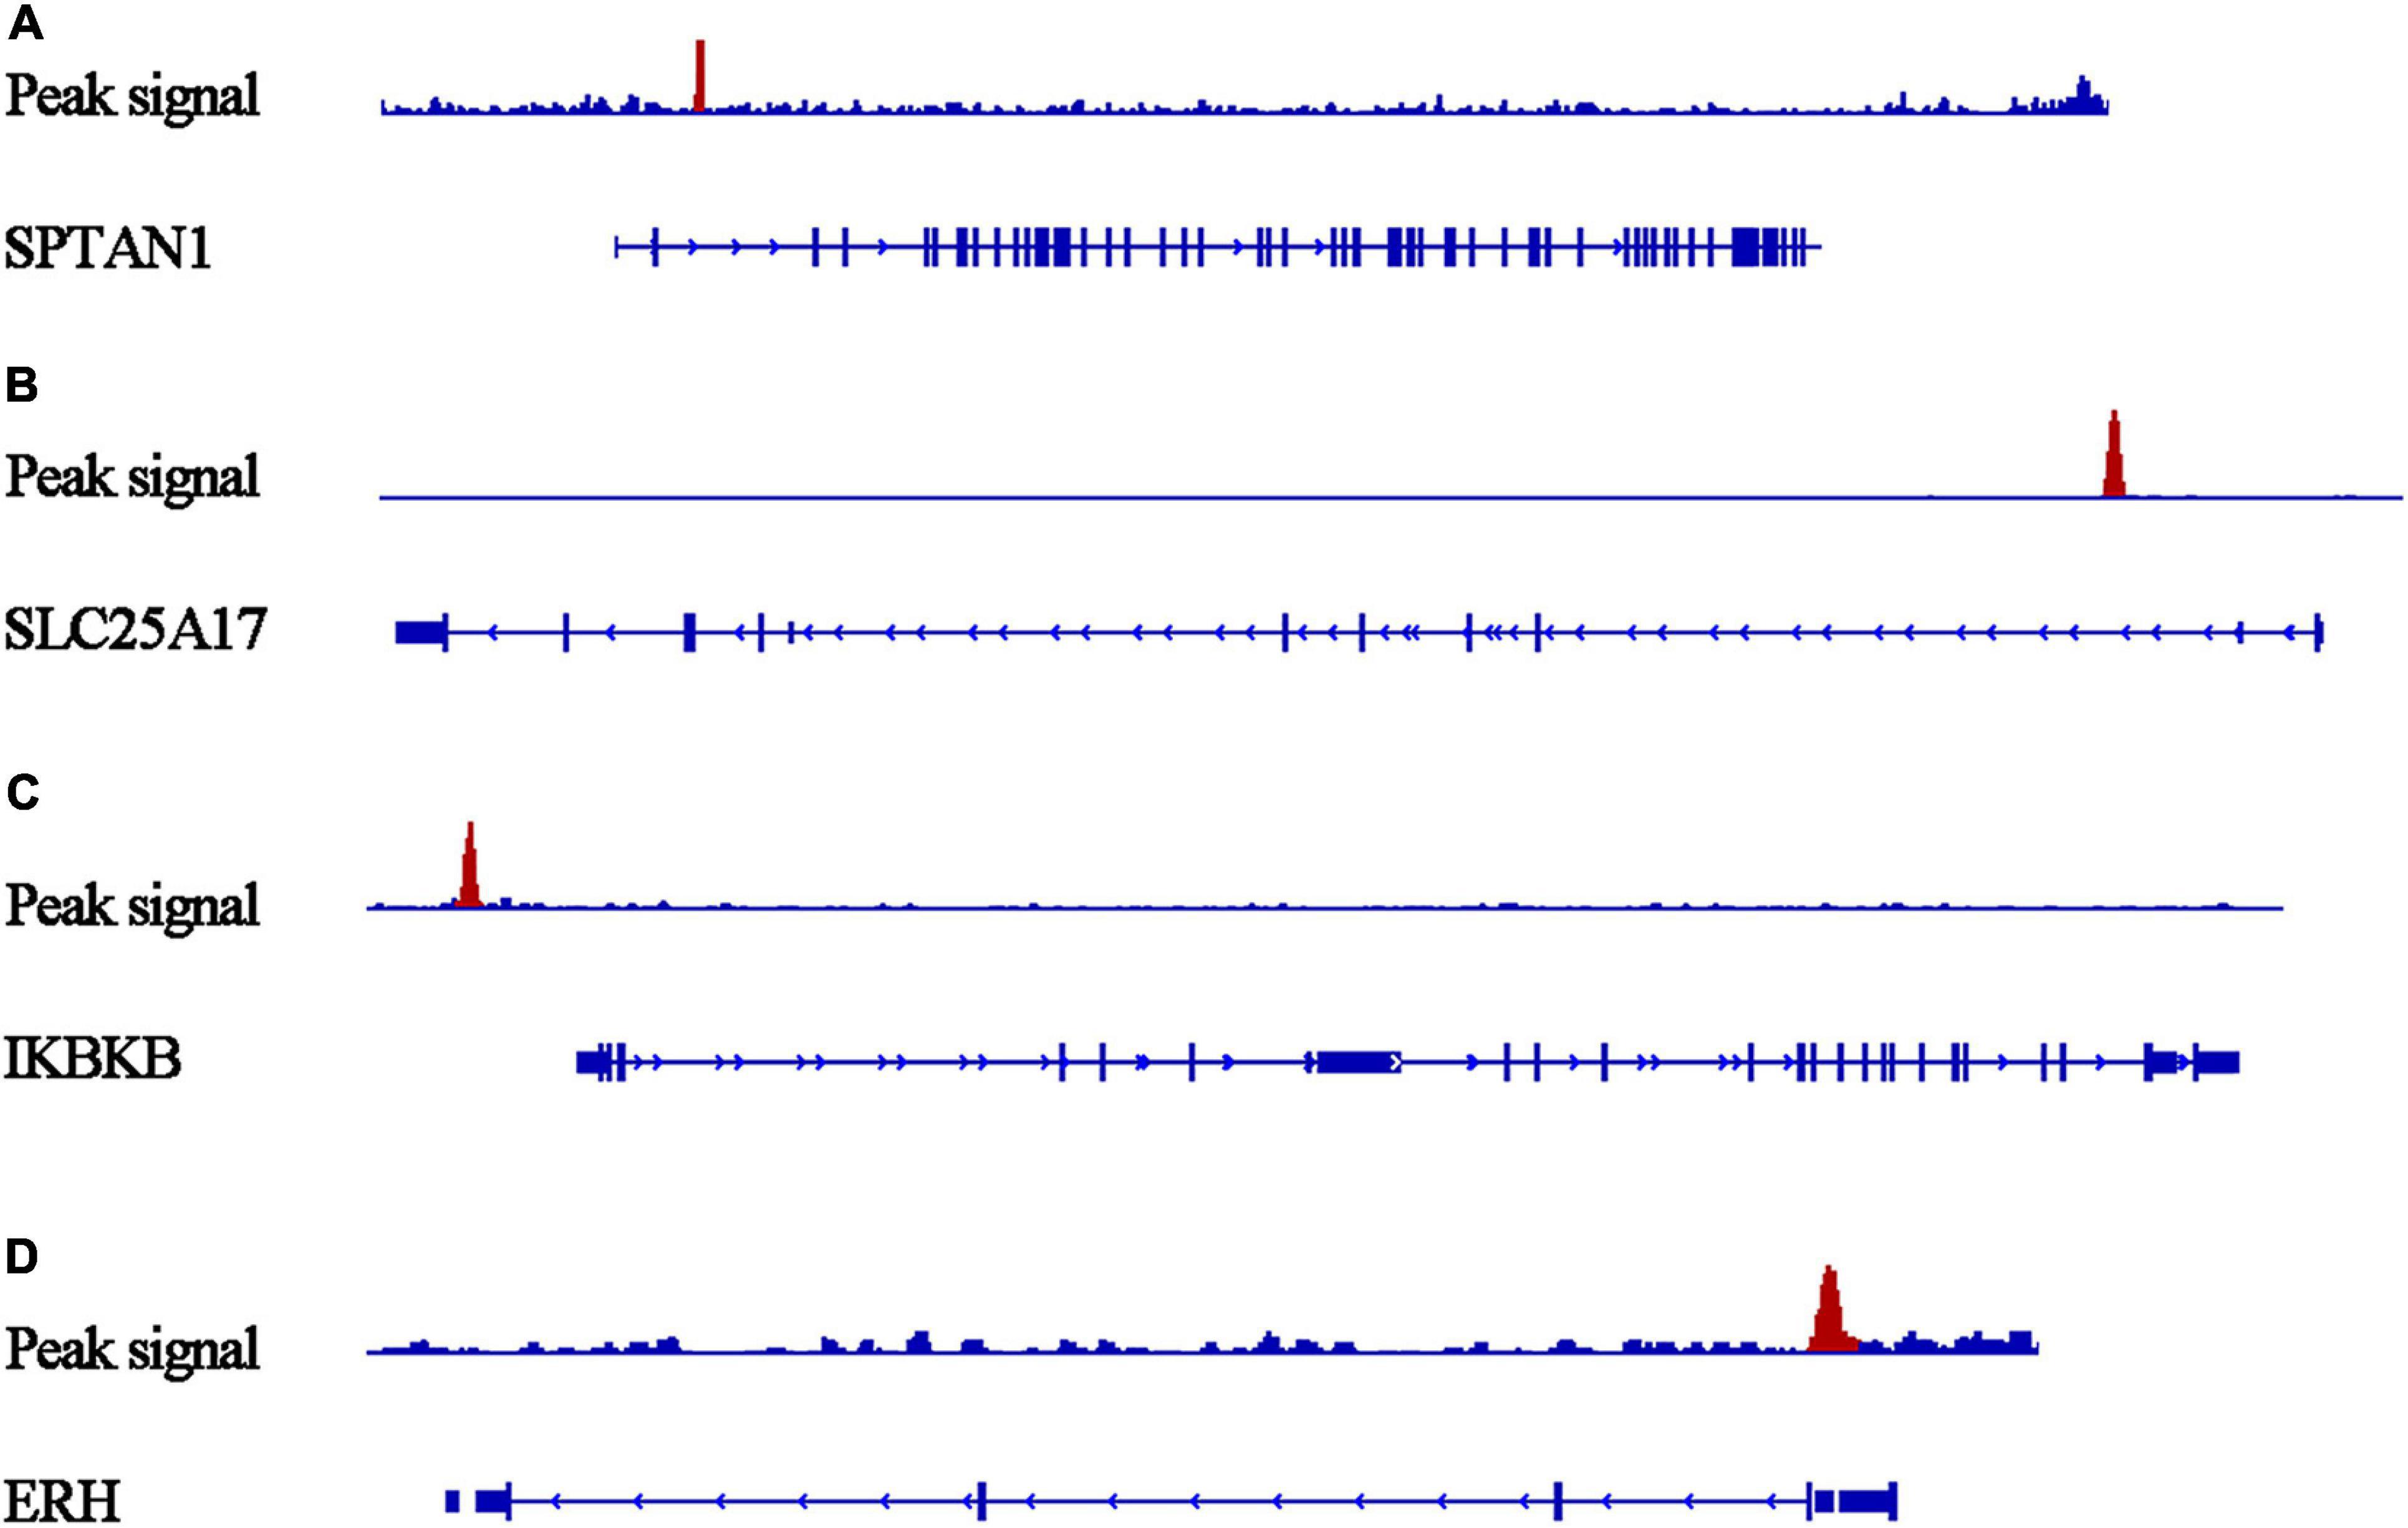
Figure 10. Peaks of target genes binding to PTTG1 in ChIP-seq based on the Cistrome DB database. The peak signals of each target genes are colored red. (A) SPTAN1; (B) SLC25A17; (C) IKBKB; (D) ERH.
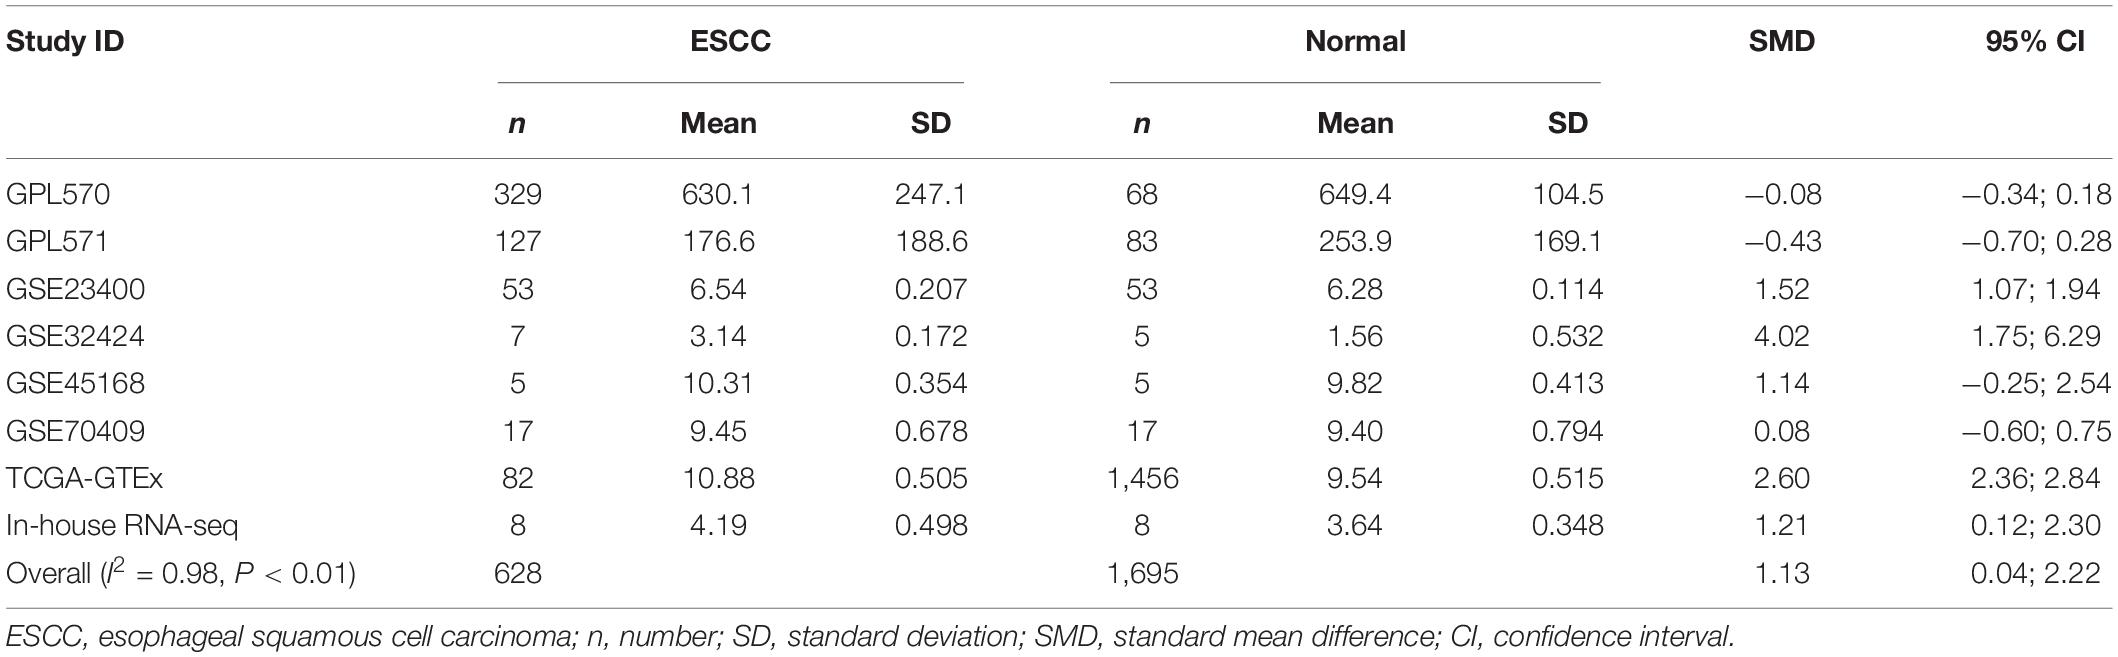
Table 2. Comprehensive analysis of SLC25A17 expression in ESCC based on gene microarrays, public RNA-seq, and in-house RNA-seq.
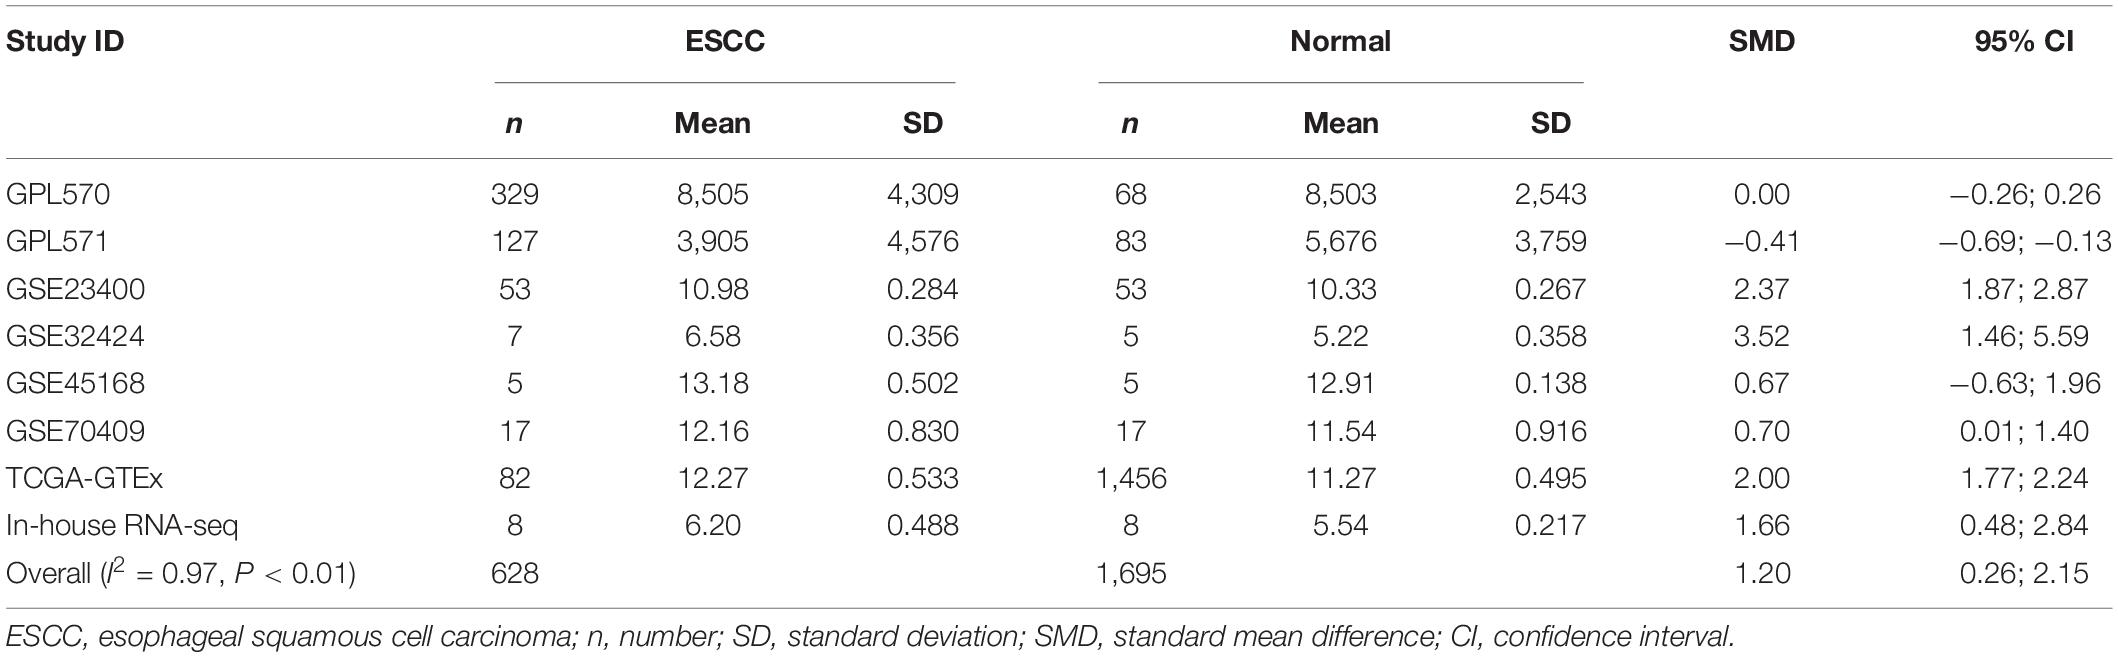
Table 3. Comprehensive analysis of ERH expression in ESCC based on gene microarrays, public RNA-seq, and in-house RNA-seq.
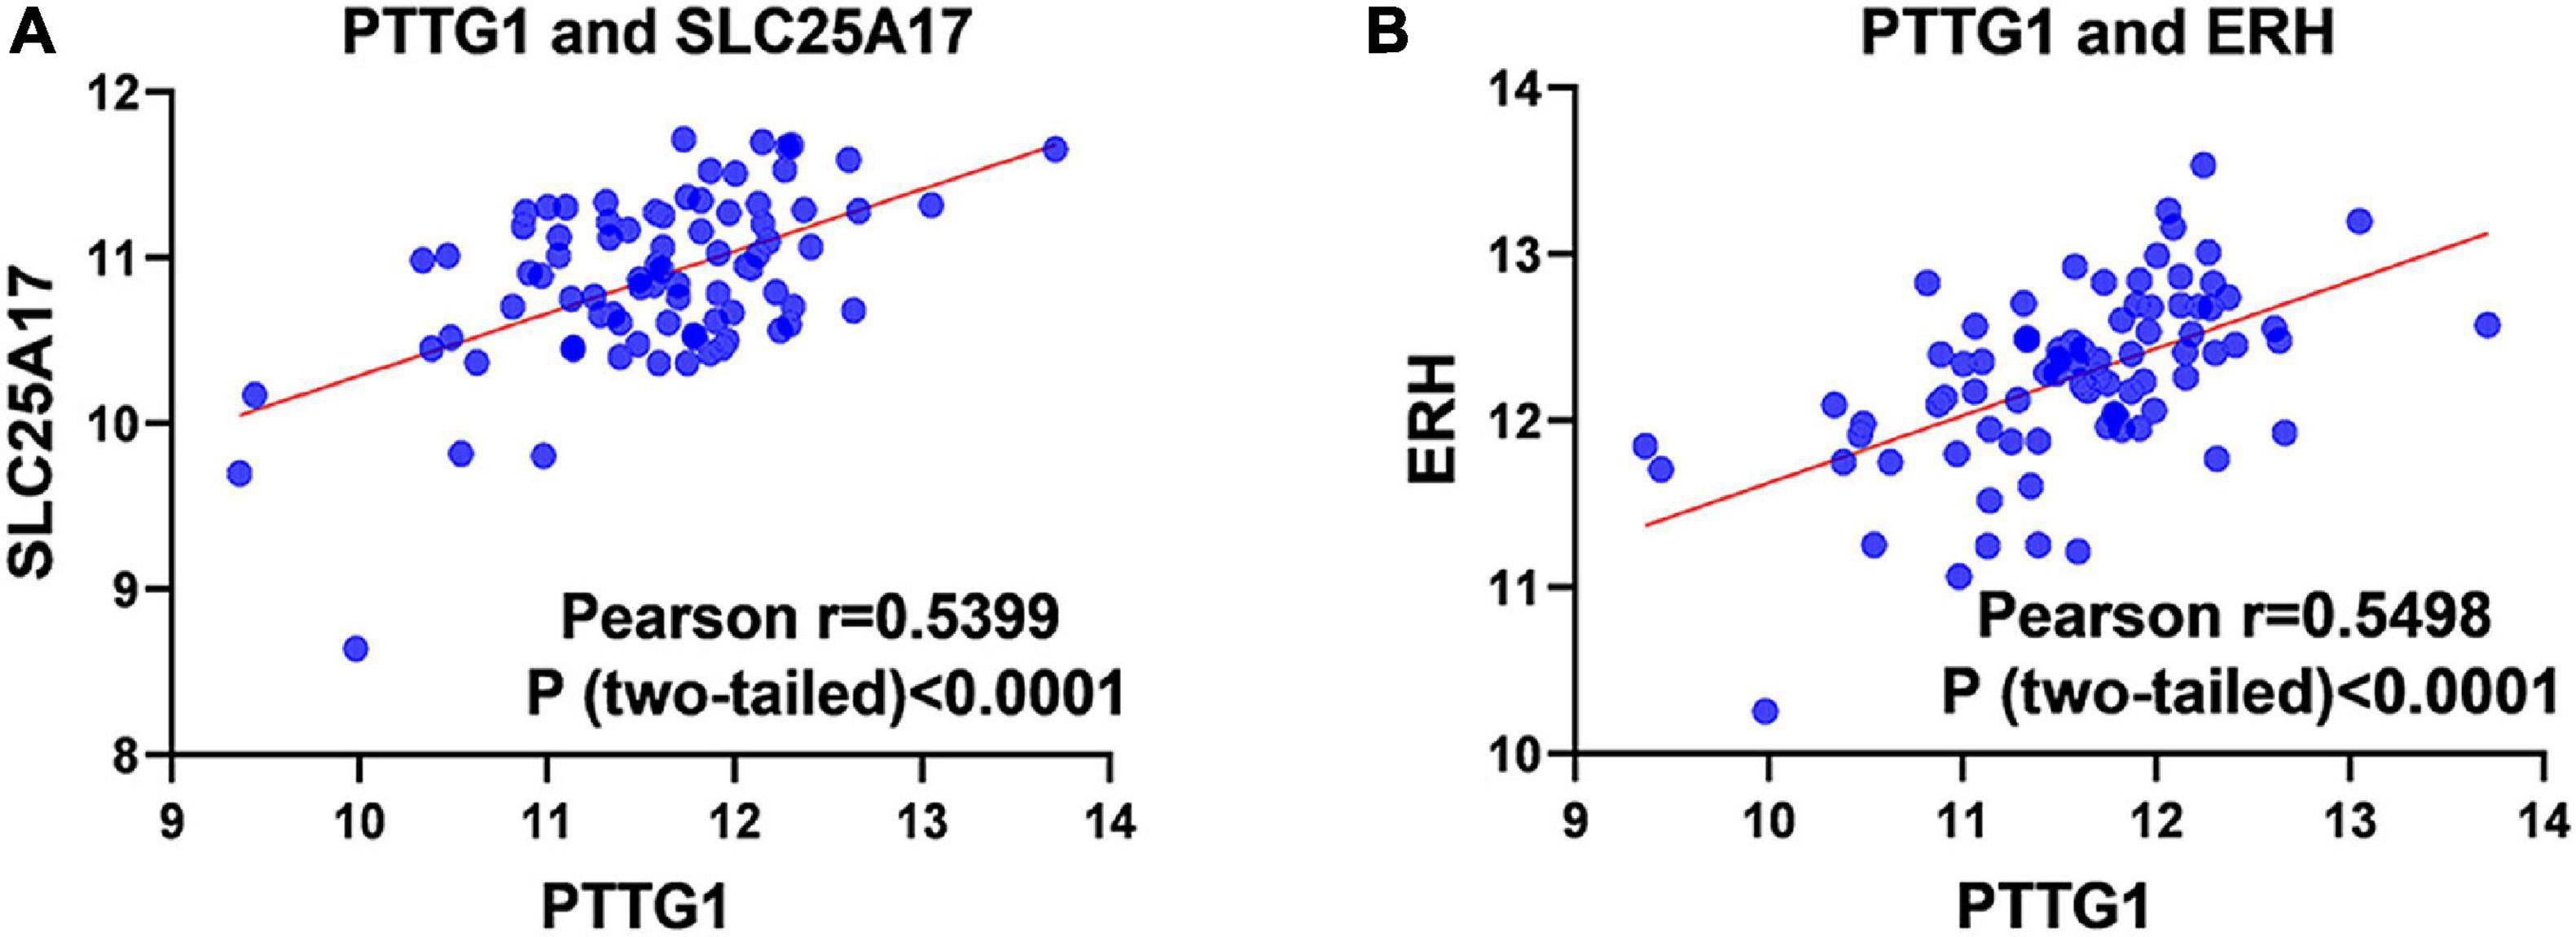
Figure 11. Pearson correlation analysis of PTTG1 and its target genes. (A) Pearson correlation between PTTG1 and SLC25A17. (B) Pearson correlation between PTTG1 and ERH.
Discussion
Although some studies reported on the expression level of PTTG1 in ESCC, its clinical significance had yet to be verified, and the mechanism of abnormal PTTG1 expression in ESCC was not clear. To address these issues, this study used a variety of detection methods to investigate the expression level of PTTG1 in ESCC, including in-house IHC, in-house RNA-seq, gene chips, public RNA-seq, and a published study. We conducted a comprehensive integrated analysis of the expression data of 2,721 samples from independent studies to calculate SMD and SROC. This study on PTTG1 expression in ESCC had the largest sample size of any related study by far. The analysis results showed that the expression of PTTG1 in ESCC was upregulated. As a transcription factor, PTTG1 could target and regulate specific genes to perform biological functions. Combining the analysis results of DEGs, PTTG1-related genes of ESCC, and ChIP-seq of PTTG1, we found for the first time that SLC25A17 and ERH were likely to be the target genes of PTTG1 in ESCC. These findings could help to study the key role of PTTG1 in the regulation mechanism in ESCC.
So far, there have been only three reports on the clinical significance of PTTG1 expression in ESCC. The sample size of these was relatively small, and they were based on a single center study. The use of a single detection method failed to fully represent the role of PTTG1 in ESCC. At the time of these reports, the widely used high-throughput technology had not been adopted. Differences existed among the results of several studies. One study using RT-PCR of 48 cases of ESCC and its matched samples revealed that PTTG1 expression was upregulated in ESCC, and the average expression level in tumor tissue was 2.19 times than that of normal tissue (0.105 vs. 0.048) (Shibata et al., 2002). In another study, the immunohistochemistry of 50 ESCC samples and normal esophageal tissues suggested that PTTG1 was highly expressed in ESCC. Of 50 ESCC tissues, 31 (62%) were positive, while only 17 of 50 normal tissues (34%) were positive (Feng et al., 2017). Another study, using 113 cases of ESCC immunohistochemistry and immunoblotting, revealed the overexpression of PTTG1. It was found that 14 tumors in 113 cases were negatively expressed; 31 cases expressed 0–10% of tumor cells (1+), 52 cases showed 10–30% tumor cell expression (2+), and 16 cases showed 30% tumor cell expression (3+). PTTG1 expression of 2+ or 3+ was determined as PTTG1 positive (68/113, 60.2%), while PTTG1 staining of normal esophageal epithelium showed no intracytoplasmic staining and occasionally intranuclear staining (about 10%) (Ito et al., 2008). In order to expand the sample size and integrate various detection methods and multi-center data, in this study, we employed various detection methods (immunohistochemistry of tissue chips, RNA-seq, microarrays, and RT-PCR) to study the clinical significance of PTTG1 expression in ESCC tissues. The single detection method and the comprehensive results indicated that the PTTG1 protein and mRNA were highly expressed in ESCC, which was consistent with the reported results (Shibata et al., 2002; Ito et al., 2008; Feng et al., 2017). In the study, SMD = 1.17 (95% CI: 0.72–1.62, P < 0.01), and this result was strongly supported by the SROC combined with AUC 0.86 (95% CI: 0.83–0.89). This study used a large sample to verify the upregulation of PTTG1 in ESCC, suggesting that high expression of PTTG1 might promote the occurrence of ESCC.
In addition to its role in promoting ESCC, we also discussed the possibility of PTTG1 advancing tumor progression. It was reported in the literature that the high expression of PTTG1 was closely related to the pathological stage and lymph node metastasis (Shibata et al., 2002). In vitro, knocking down PTTG1 in EC-1 and Eca-109 cell lines could inhibit EMT, migration, and metastasis (Ito et al., 2008; Feng et al., 2017). This study also examined the relationship between the progress of PTTG1 and ESCC on a variety of data sets. In our study, we have confirmed that PTTG1 was significantly overexpressed in ESCC tissues, and in the prognosis analysis, the survival condition of patients with high PTTG1 expression was worse than that of patients with low PTTG1 expression (HR = 1.29), but no significant statistical difference was found. The reason for this situation may be that overexpression of PTTG1 plays an important role in the occurrence of ESCC, but it may have little effect on the development and progression of ESCC. Of course, this hypothesis needs to be further verified by our future experiments. We did not establish a relationship between the high expression of PTTG1 and other pathological parameters that represented the clinical process; however, the expression of PTTG1 in patients less than or equal to 60 years old was higher than that of patients older than 60, and a higher expression of PTTG1 was correlated to a lower age. The mechanism of the relationship between PTTG1 and the patient’s age was unclear and requires further study.
We then investigated the reasons for the high expression of PTTG1. The mechanism of PTTG1 in ESCC has been reported in previous studies. PTTG1 induces EMT and metastasis in ESCC by activating GLI1 (Feng et al., 2017). PTTG1 might also regulate the expression of multiple genes related to cell movement, including members of the Ras–Rho oncogene superfamily (Ito et al., 2008). As a transcription factor, PTTG1 may achieve its biological function through targeted regulation of a certain set of genes. However, there was no report on the potential target genes of PTTG1 in ESCC. By combining the target genes displayed by ChIP-seq of PTTG1, DEGs of ESCC, PTTG1-related genes, and the possible signaling pathways of PTTG1, it was observed that PTTG1 may interact with these genes through chemokines and cytokine signaling pathways. The inflammatory response, integrin signaling pathway, ubiquitin proteasome pathway, and apoptosis signaling pathway played a role in ESCC. By constructing a PPI network and combining ChIP-seq data, we obtained four potential target genes, SPTAN1, SLC25A17, IKBKB, and ERH. These hub genes all had binding sites with PTTG1. Interestingly, these genes had been reported as tumor related, and SPTAN1 was a family of filamentous cytoskeletal proteins that acted as an essential scaffold protein for stabilizing the plasma membrane and organizing intracellular organelles. The encoded protein had functions of DNA repair and cell cycle regulation. The expression of SPTAN1 in metastatic colon cancer was lower than that in non-metastatic colon cancer. The low expression of SPTAN1 reduced the ability of cell-to-cell contact, which facilitated the metastasis of colon cancer cells (Hinrichsen et al., 2014; Ackermann et al., 2019). It was found that SPTAN1 expression increased in ovarian cancer after chemotherapy (L’Espérance et al., 2006). The SLC25A17 gene was the only member of the mitochondrial carrier family that had previously been confirmed to be located in the peroxisomal membrane. It encoded a peroxisomal membrane protein of the mitochondrial solute carrier family and display varied expression levels in 21 human tissues (including brain, esophagus, lung, liver, and kidney tissues) (Agrimi et al., 2012). However, only one relevant study reported its role in tumors, showing that genetic changes in SLC25A17 (CNV deletion) were closely associated with the overall survival rate and relapse-free survival rate of neuroblastoma patients (Khan et al., 2015). Because SLC25A17 is positively correlated with TF PTTG1 expression, it was worth further study. IKBKB, also known as IKKβ, is a nuclear factor κB kinase subunit β inhibitor, affecting cell physiology in many ways and phosphorylating proteins to regulate cellular processes from the cell cycle to metabolism and differentiation (Page et al., 2017). Excessive activity of IKBKB in oral and dental epithelial cells leads to changes in the composition of epithelial cells and the expression of several tumor suppressor proteins and miRNAs. This results in cells in a pre-tumor state, and the lack of p53 or p16 tumor suppressor proteins and the loss of p19 would cause odontogenic tumors and metastases to local lymph nodes and lungs. IKBKB was observed in the areas of tumor ameloblasts that express keratin K5 at high levels (Page et al., 2020). IKBKB could be activated by α-KG produced by GDH1 and then upregulate GLUT1 to promote glucose uptake and tumor cell survival, thus accelerating the occurrence of glioma (Wang et al., 2019). ERH was an mRNA splicing and mitotic factor, and its function was related to pyrimidine biosynthesis and cell cycles (Gelsthorpe et al., 1997). The ERH gene might affect the apoptosis of bladder cancer T24 cells through TLR, NF-κB, TNF, or TGF-β signaling pathways, activating the growth of malignant tumors (Pang et al., 2020). The research team also proved that ERH knockdown could inhibit the transfer of BUC T24 cells in vitro and in vivo through nude mice tail vein metastasis experiments. They found that ERH gene knockdown suppressed MYC-mediated migration and invasion in bladder cancer T24 cells (Pang et al., 2019). In primary human breast cancer and breast cancer cell models, quantitative RT-PCR found that ERH expression was significantly more upregulated in tumorigenic breast cancer cell lines than in non-tumorigenic cell lines (Zafrakas et al., 2008). This study also found a significant positive correlation between ERH and PTTG1 expression; the molecular relationship between these is also worthy of further study. These reports, to some extent, supported our hypothesis that PTTG1 may play an important role in the occurrence and development of ESCC by upregulating SLC25A17 and ERH.
Future research could continue this work and improve on the current deficiencies. First, extra research should be conducted on the relationship between PTTG1 and ESCC progress and prognosis to explore whether PTTG1 could act as a factor to evaluate the prognosis of ESCC. Second, the research should investigate whether PTTG1 can be detected in body fluids and whether it contributes to the early diagnosis of ESCC. Third, a ChIP-seq of PTTG1 using the ESCC cell line needs to be performed. Although the target genes of PTTG1 in different tissue cells might partially overlap, they also have tumor specificity. Fourth, in vivo and in vitro experiments need to be carried out to study the biological functions and related molecular mechanisms of PTTG1. Fifth, related experiments need to demonstrate the function of the highlighted potential markers in our study.
Conclusion
This study combined multiple detection methods—IHC, RNA-seq, and gene chip data—to comprehensively demonstrate for the first time that PTTG1 was highly expressed in ESCC tissues. This was true from the protein level to the mRNA level and from individual research to integrated analysis. The results were confirmed by a study based on 2,721 cases. It was found that the high expression of PTTG1 may play an important role in the formation of ESCC. These roles may be completed by PTTG1 regulating the downstream target genes SLC25A17 and ERH; however, this hypothesis requires extra experiments to verify.
Data Availability Statement
The data presented in the study are deposited in the Gene Expression Omnibus (GEO) (https://www.ncbi.nim.nih.gov/geo/) repository, accession number (GSE164158).
Ethics Statement
The studies involving human participants were reviewed and approved by the First Affiliated Hospital of Guangxi Medical University. The patients/participants provided their written informed consent to participate in this study.
Author Contributions
All authors contributed to the study conception and design. H-FZ performed the data extraction and statistical analysis and drafted the manuscript. S-WC and H-JZ conceived and designed the study and edited the manuscript. L-JY, R-QH, and GC contributed to the design of the study, supervised all the experiments, and corrected the manuscript. Z-GH, XY, Y-WD, JL, and Z-WF collected, extracted, and analyzed the data. J-XM, Z-QT, C-BL, RL, L-HY, and JM critically revised the manuscript. All authors read and approved the final manuscript.
Funding
This study was supported by the Guangxi Degree and Postgraduate Education Reform and Development Research Projects, China (JGY2019050), Guangxi Medical University Training Program for Distinguished Young Scholars, Medical Excellence Award Funded by the Creative Research Development Grant from the First Affiliated Hospital of Guangxi Medical University, and Guangxi Zhuang Autonomous Region Health and Family Planning Commission Self-financed Scientific Research Project (Z20200928).
Conflict of Interest
The authors declare that the research was conducted in the absence of any commercial or financial relationships that could be construed as a potential conflict of interest.
Acknowledgments
The authors thank all the public data sources involved in the present study.
Supplementary Material
The Supplementary Material for this article can be found online at: https://www.frontiersin.org/articles/10.3389/fgene.2020.583085/full#supplementary-material
Footnotes
References
Ackermann, A., Schrecker, C., Bon, D., Friedrichs, N., Bankov, K., Wild, P., et al. (2019). Downregulation of SPTAN1 is related to MLH1 deficiency and metastasis in colorectal cancer. PLoS One 14:e0213411. doi: 10.1371/journal.pone.0213411
Agrimi, G., Russo, A., Scarcia, P., and Palmieri, F. (2012). The human gene SLC25A17 encodes a peroxisomal transporter of coenzyme A, FAD and NAD+. Biochem. J. 443, 241–247. doi: 10.1042/bj20111420
Arenas, M. A. R., Whitsett, T. G., Aronova, A., Henderson, S. A., LoBello, J., Habra, M. A., et al. (2018). Protein Expression of PTTG1 as a Diagnostic Biomarker in Adrenocortical Carcinoma. Ann. Surg. Oncol. 25, 801–807. doi: 10.1245/s10434-017-6297-6291
Arnal, M. J. D., Arenas, Áf, Arbeloa, and Ál. (2015). Esophageal cancer: Risk factors, screening and endoscopic treatment in Western and Eastern countries. World J. Gastroenterol. 21, 7933–7943. doi: 10.3748/wjg.v21.i26.7933
Ersvær, E., Kildal, W., Vlatkovic, L., Cyll, K., Pradhan, M., Kleppe, A., et al. (2020). Prognostic value of mitotic checkpoint protein BUB3, cyclin B1, and pituitary tumor-transforming 1 expression in prostate cancer. Mod. Pathol. 33, 905–915. doi: 10.1038/s41379-019-0418-412
Feng, W., Xiaoyan, X., Shenglei, L., Hongtao, L., and Guozhong, J. (2017). PTTG1 cooperated with GLI1 leads to epithelial-mesenchymal transition in esophageal squamous cell cancer. Oncotarget 8, 92388–92400. doi: 10.18632/oncotarget.21343
Gelsthorpe, M., Pulumati, M., McCallum, C., Dang-Vu, K., and Tsubota, S. I. (1997). The putative cell cycle gene, enhancer of rudimentary, encodes a highly conserved protein found in plants and animals. Gene 186, 189–195. doi: 10.1016/s0378-1119(96)00701-709
Hinrichsen, I., Ernst, B. P., Nuber, F., Passmann, S., Schäfer, D., Steinke, V., et al. (2014). Reduced migration of MLH1 deficient colon cancer cells depends on SPTAN1. Mol. Cancer. 13:11. doi: 10.1186/1476-4598-13-11
Huang, F. L., and Yu, S. J. (2018). Esophageal cancer: Risk factors, genetic association, and treatment. Asian J. Surg. 41, 210–215. doi: 10.1016/j.asjsur.2016.10.005
Ito, T., Shimada, Y., Kan, T., David, S., Cheng, Y., Mori, Y., et al. (2008). Pituitary tumor-transforming 1 increases cell motility and promotes lymph node metastasis in esophageal squamous cell carcinoma. Cancer Res. 68, 3214–3224. doi: 10.1158/0008-5472.can-07-3043
Khan, F. H., Pandian, V., Ramraj, S., Natarajan, M., Aravindan, S., Herman, T. S., et al. (2015). Acquired genetic alterations in tumor cells dictate the development of high-risk neuroblastoma and clinical outcomes. BMC Cancer 15:514. doi: 10.1186/s12885-015-1463-y
Kong, J., Wang, T., Zhang, Z., Yang, X., Shen, S., and Wang, W. (2019). Five Core Genes Related to the Progression and Prognosis of Hepatocellular Carcinoma Identified by Analysis of a Coexpression Network. DNA Cell Biol. 38, 1564–1576. doi: 10.1089/dna.2019.4932
L’Espérance, S., Popa, I., Bachvarova, M., Plante, M., Patten, N., Wu, L., et al. (2006). Gene expression profiling of paired ovarian tumors obtained prior to and following adjuvant chemotherapy: molecular signatures of chemoresistant tumors. Int. J. Oncol. 29, 5–24.
Lin, P., Wen, D. Y., Dang, Y. W., He, Y., Yang, H., and Chen, G. (2018). Comprehensive and Integrative Analysis Reveals the Diagnostic, Clinicopathological and Prognostic Significance of Polo-Like Kinase 1 in Hepatocellular Carcinoma. Cell Physiol. Biochem. 47, 925–947. doi: 10.1159/000490135
Mei, S., Qin, Q., Wu, Q., Sun, H., Zheng, R., Zang, C., et al. (2017). Cistrome Data Browser: a data portal for ChIP-Seq and chromatin accessibility data in human and mouse. Nucleic Acids Res. 45, D658–D662. doi: 10.1093/nar/gkw983
Page, A., Bravo, A., Suarez-Cabrera, C., Sanchez-Baltasar, R., Oteo, M., Morcillo, M. A., et al. (2020). IKKβ overexpression together with a lack of tumour suppressor genes causes ameloblastic odontomas in mice. Int. J. Oral. Sci. 12:1. doi: 10.1038/s41368-019-0067-69
Page, A., Navarro, M., Suárez-Cabrera, C., Bravo, A., and Ramirez, A. (2017). Context-Dependent Role of IKKβ in Cancer. Genes 8:376. doi: 10.3390/genes8120376
Pang, K., Hao, L., Shi, Z., Chen, B., Pang, H., Dong, Y., et al. (2020). Comprehensive gene expression analysis after ERH gene knockdown in human bladder cancer T24 cell lines. Gene 738, 144475. doi: 10.1016/j.gene.2020.144475
Pang, K., Zhang, Z., Hao, L., Shi, Z., Chen, B., Zang, G., et al. (2019). The ERH gene regulates migration and invasion in 5637 and T24 bladder cancer cells. BMC Cancer 19:225. doi: 10.1186/s12885-019-5423-5429
Pei, L., and Melmed, S. (1997). Isolation and characterization of a pituitary tumor-transforming gene (PTTG). Mol. Endocrinol. 11, 433–441. doi: 10.1210/mend.11.4.9911
Ren, Q., and Jin, B. (2017). The clinical value and biological function of PTTG1 in colorectal cancer. Biomed. Pharmacother. 89, 108–115. doi: 10.1016/j.biopha.2017.01.115
Shibata, Y., Haruki, N., Kuwabara, Y., Nishiwaki, T., Kato, J., Shinoda, N., et al. (2002). Expression of PTTG (pituitary tumor transforming gene) in esophageal cancer. JPN. J. Clin. Oncol. 32, 233–237. doi: 10.1093/jjco/hyf058
Vlotides, G., Eigler, T., and Melmed, S. (2007). Pituitary tumor-transforming gene: physiology and implications for tumorigenesis. Endocr. Rev. 28, 165–186. doi: 10.1210/er.2006-2042
Wang, X., Liu, R., Qu, X., Yu, H., Chu, H., Zhang, Y., et al. (2019). α-Ketoglutarate-Activated NF-κB Signaling Promotes Compensatory Glucose Uptake and Brain Tumor Development. Mol. Cell. 76, 148–162e7. doi: 10.1016/j.molcel.2019.07.007
Yang, S., Wang, X., Liu, J., Ding, B., Shi, K., Chen, J., et al. (2019). Distinct expression pattern and prognostic values of pituitary tumor transforming gene family genes in non-small cell lung cancer. Oncol. Lett. 18, 4481–4494. doi: 10.3892/ol.2019.10844
Keywords: PTTG1, esophageal squamous cell carcinoma, transcription factor, RNA sequencing, tissue microarray
Citation: Chen S-W, Zhou H-F, Zhang H-J, He R-Q, Huang Z-G, Dang Y-W, Yang X, Liu J, Fu Z-W, Mo J-X, Tang Z-Q, Li C-B, Li R, Yang L-H, Ma J, Yang L-J and Chen G (2021) The Clinical Significance and Potential Molecular Mechanism of PTTG1 in Esophageal Squamous Cell Carcinoma. Front. Genet. 11:583085. doi: 10.3389/fgene.2020.583085
Received: 14 July 2020; Accepted: 30 November 2020;
Published: 22 January 2021.
Edited by:
Xiao Zhu, Guangdong Medical University, ChinaCopyright © 2021 Chen, Zhou, Zhang, He, Huang, Dang, Yang, Liu, Fu, Mo, Tang, Li, Li, Yang, Ma, Yang and Chen. This is an open-access article distributed under the terms of the Creative Commons Attribution License (CC BY). The use, distribution or reproduction in other forums is permitted, provided the original author(s) and the copyright owner(s) are credited and that the original publication in this journal is cited, in accordance with accepted academic practice. No use, distribution or reproduction is permitted which does not comply with these terms.
*Correspondence: Lin-Jie Yang, ZXlhbmdsaW5qaWVAMTYzLmNvbQ==; orcid.org/0000-0002-3353-0863; Gang Chen, Y2hlbmdhbmdAZ3htdS5lZHUuY24=; orcid.org/0000-0002-4864-1451
†These authors have contributed equally to this work