 Lishun Xiao1†
 Zhongshang Yuan
 Siyi Jin
 Shuiping Huang
 Ping Zeng
- 1Department of Epidemiology and Biostatistics, Xuzhou Medical University, Xuzhou, China
- 2Department of Biostatistics, School of Public Health, Cheeloo College of Medicine, Shandong University, Jinan, China
- 3Center for Medical Statistics and Data Analysis, School of Public Health, Xuzhou Medical University, Xuzhou, China
Genome-wide association studies (GWAS) have identified multiple causal genes associated with amyotrophic lateral sclerosis (ALS); however, the genetic architecture of ALS remains completely unknown and a large number of causal genes have yet been discovered. To full such gap in part, we implemented an integrative analysis of transcriptome-wide association study (TWAS) for ALS to prioritize causal genes with summary statistics from 80,610 European individuals and employed 13 GTEx brain tissues as reference transcriptome panels. The summary-level TWAS analysis with single brain tissue was first undertaken and then a flexible p-value combination strategy, called summary data-based Cauchy Aggregation TWAS (SCAT), was proposed to pool association signals from single-tissue TWAS analysis while protecting against highly positive correlation among tests. Extensive simulations demonstrated SCAT can produce well-calibrated p-value for the control of type I error and was often much more powerful to identify association signals across various scenarios compared with single-tissue TWAS analysis. Using SCAT, we replicated three ALS-associated genes (i.e., ATXN3, SCFD1, and C9orf72) identified in previous GWASs and discovered additional five genes (i.e., SLC9A8, FAM66D, TRIP11, JUP, and RP11-529H20.6) which were not reported before. Furthermore, we discovered the five associations were largely driven by genes themselves and thus might be new genes which were likely related to the risk of ALS. However, further investigations are warranted to verify these results and untangle the pathophysiological function of the genes in developing ALS.
Background
Amyotrophic lateral sclerosis (ALS), also known as Lou Gehrig’s disease, is an adult-onset progressive and fatal neurodegenerative disease (Kiernan et al., 2011). Although its prevalence rate is not high worldwide (Vazquez, 2008; Marin et al., 2017; Mehta et al., 2018), ALS can lead to severe clinical consequence (Chio et al., 2009) and economic burden (Larkindale et al., 2014; Gladman and Zinman, 2015). One of the greatest challenges with regards to ALS is that few effective therapeutic interventions have been confirmed and nearly no cure is available in clinic (Mehta et al., 2018; Zeng et al., 2019a). In addition, it is evaluated that the ALS cases across the globe will elevate up to ∼400K in the coming 20 years owing to aging of the population (Arthur et al., 2016), which will further aggravate the socioeconomic threat of ALS.
Prior work has revealed that ALS is highly heritable, with the heritability ranging from 0.52 (95%CI 0.43–0.62) for the ordinary population, to 0.37 (95%CI 0.20–0.54) for those without genetic risks according to population-based studies, and to 0.66 (95%CI 0.59–0.74) based on mother-daughter pairings (Ryan et al., 2019) or 0.61 (95%CI 0.38–0.78) in terms of twin studies (Al-Chalabi et al., 2010). Therefore, understanding the genetic etiology of ALS and identifying risk genes are crucial for early prevention and also have the potential to discover effective therapeutic targets. Indeed, in the past decade dozens of genome-wide association studies (GWAS) have identified multiple single nucleotide polymorphisms (SNPs) and genes causally associated with ALS (McMahon et al., 2019) (Table 1 and Supplementary Table S1). However, the genetic architecture of ALS remains largely unknown and the functional influences of those genetic variants are also not completely clear. For example, the SNP-based heritability estimated in GWAS is only 21%, which is much smaller than that reported above (Keller et al., 2014), implying a large amount of causal genes have not yet been identified and the effort to find causative genes for ALS should continue.
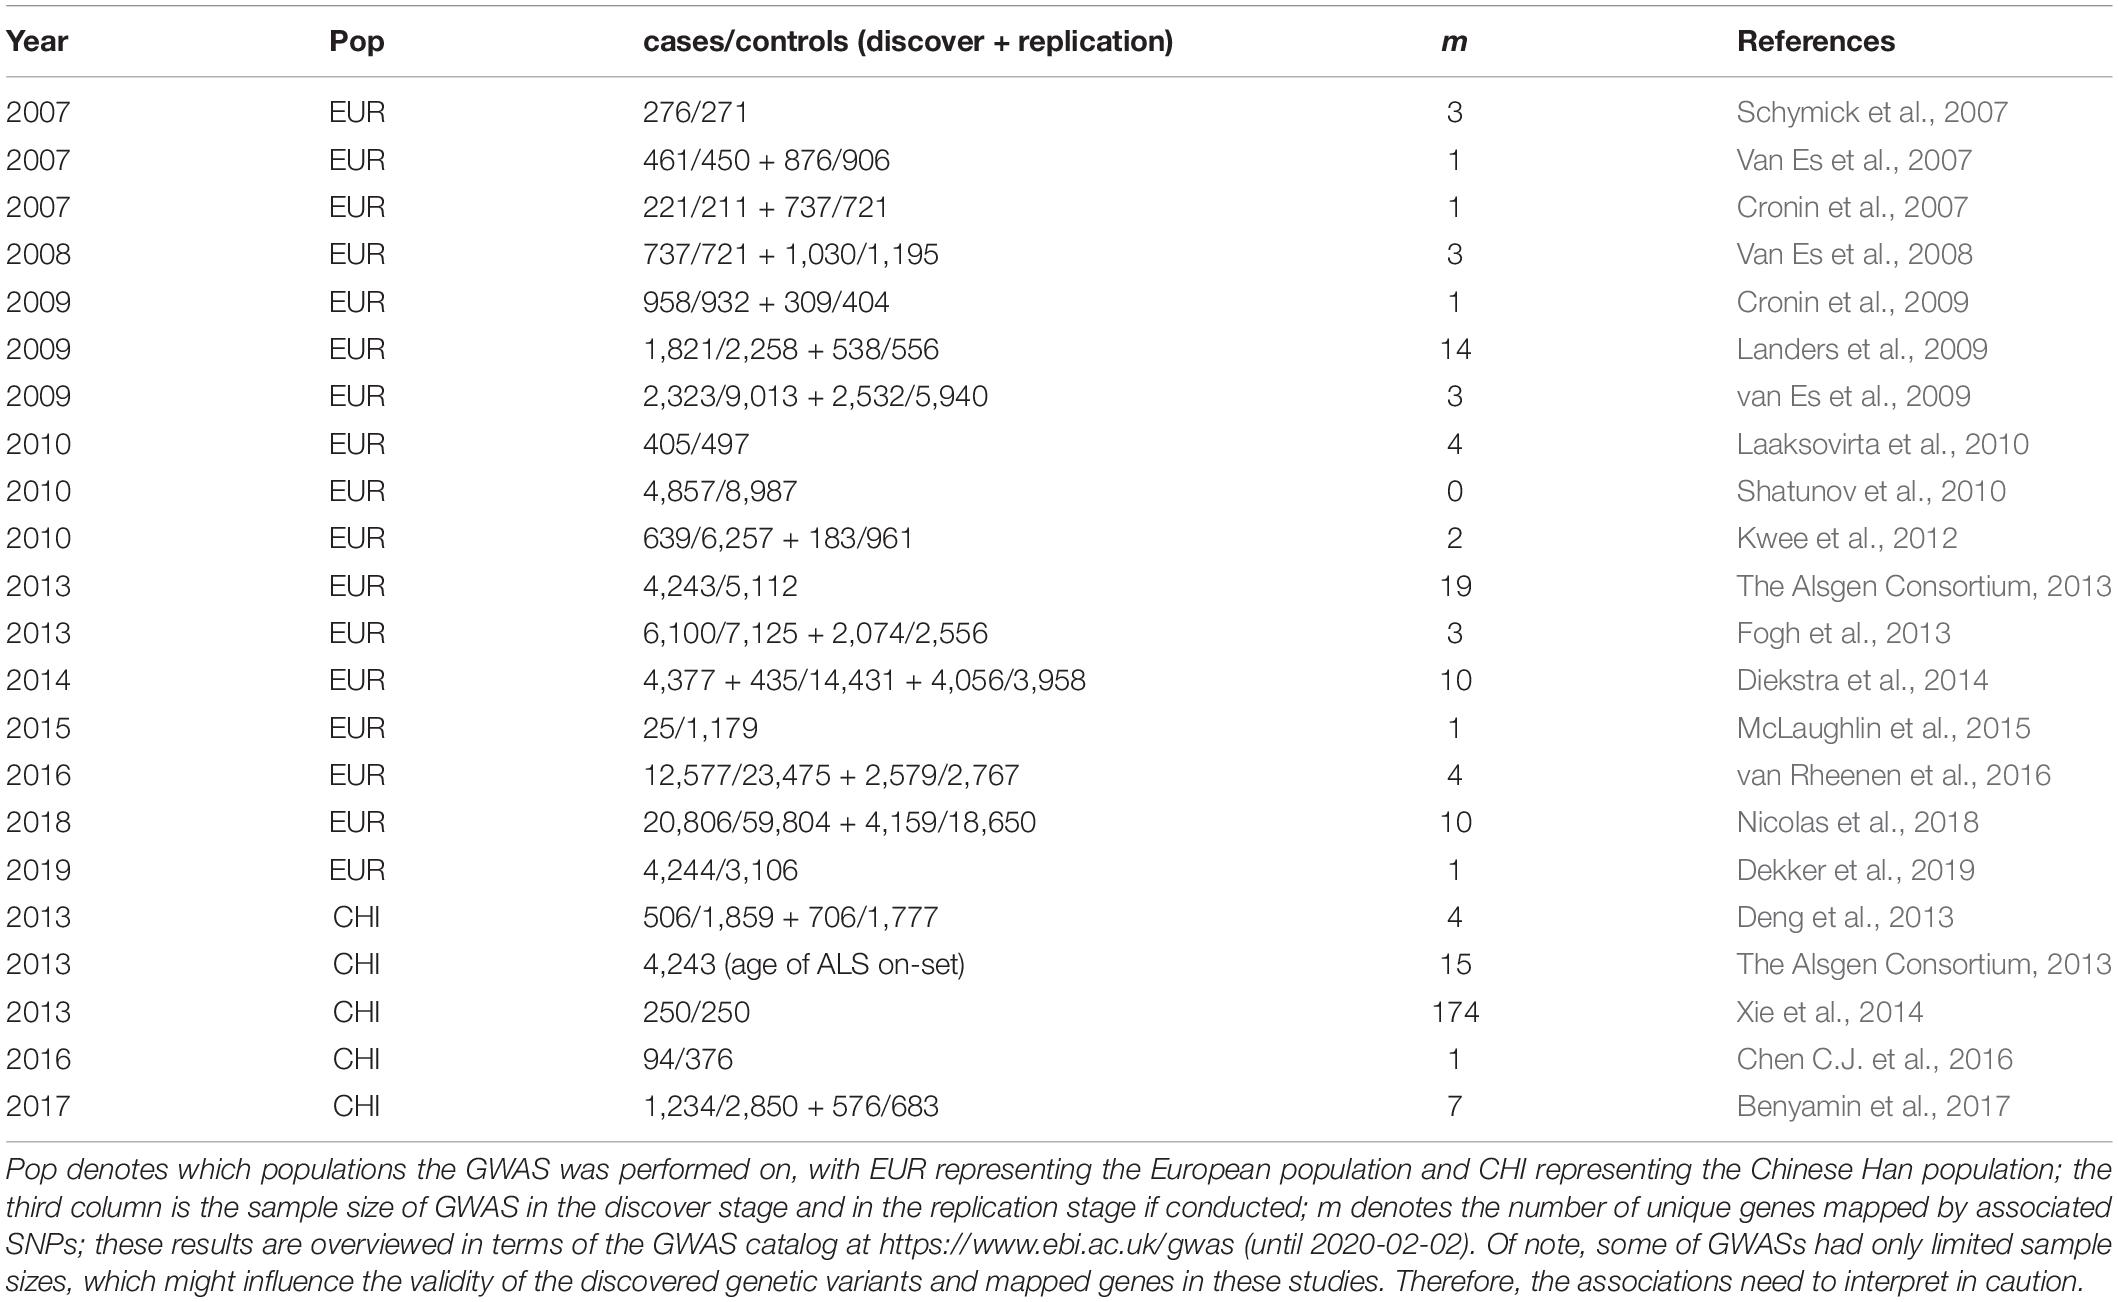
Table 1. Previous association studies for ALS in terms of the GWAS catalog.
The importance of gene expression regulation in complex diseases motivates us to apply novel statistical tools prioritizing causal genes of ALS through the integration of expression quantitative trait loci (eQTL) into GWAS (Nica et al., 2010; Nicolae et al., 2010; GTEx Consortium, 2015; Li et al., 2016; Wen et al., 2016; GTEx Consortium, 2017; Mancuso et al., 2019). Transcriptome-wide association study (TWAS) is exactly one of such approaches popular in genomic integrative analysis (Gusev et al., 2016; Hu et al., 2019; Mancuso et al., 2019; Wainberg et al., 2019). Methodologically, TWAS can be viewed as a relatively independent two-stage inference procedure to discover causal genes (Figure 1). Briefly, in the first stage weights (i.e., the joint effect sizes) of cis-SNPs of a given gene are computed from external tissue-related transcriptome reference datasets; and then the association between the imputed expression and the disease of interest is examined for that gene in the second stage. The original TWAS analysis needs large scale individual-level data sets (Gusev et al., 2016), which limits its applicability due to unavailability of such data sets because of privacy concerns in data sharing among various research groups (Gusev et al., 2016; Pasaniuc and Price, 2016). Fortunately, such limitation is already eliminated with the development of summary-level TWAS (Gusev et al., 2016; Barbeira et al., 2018), for which only pre-estimated weights of QTL and summary statistics of GWAS are necessary.
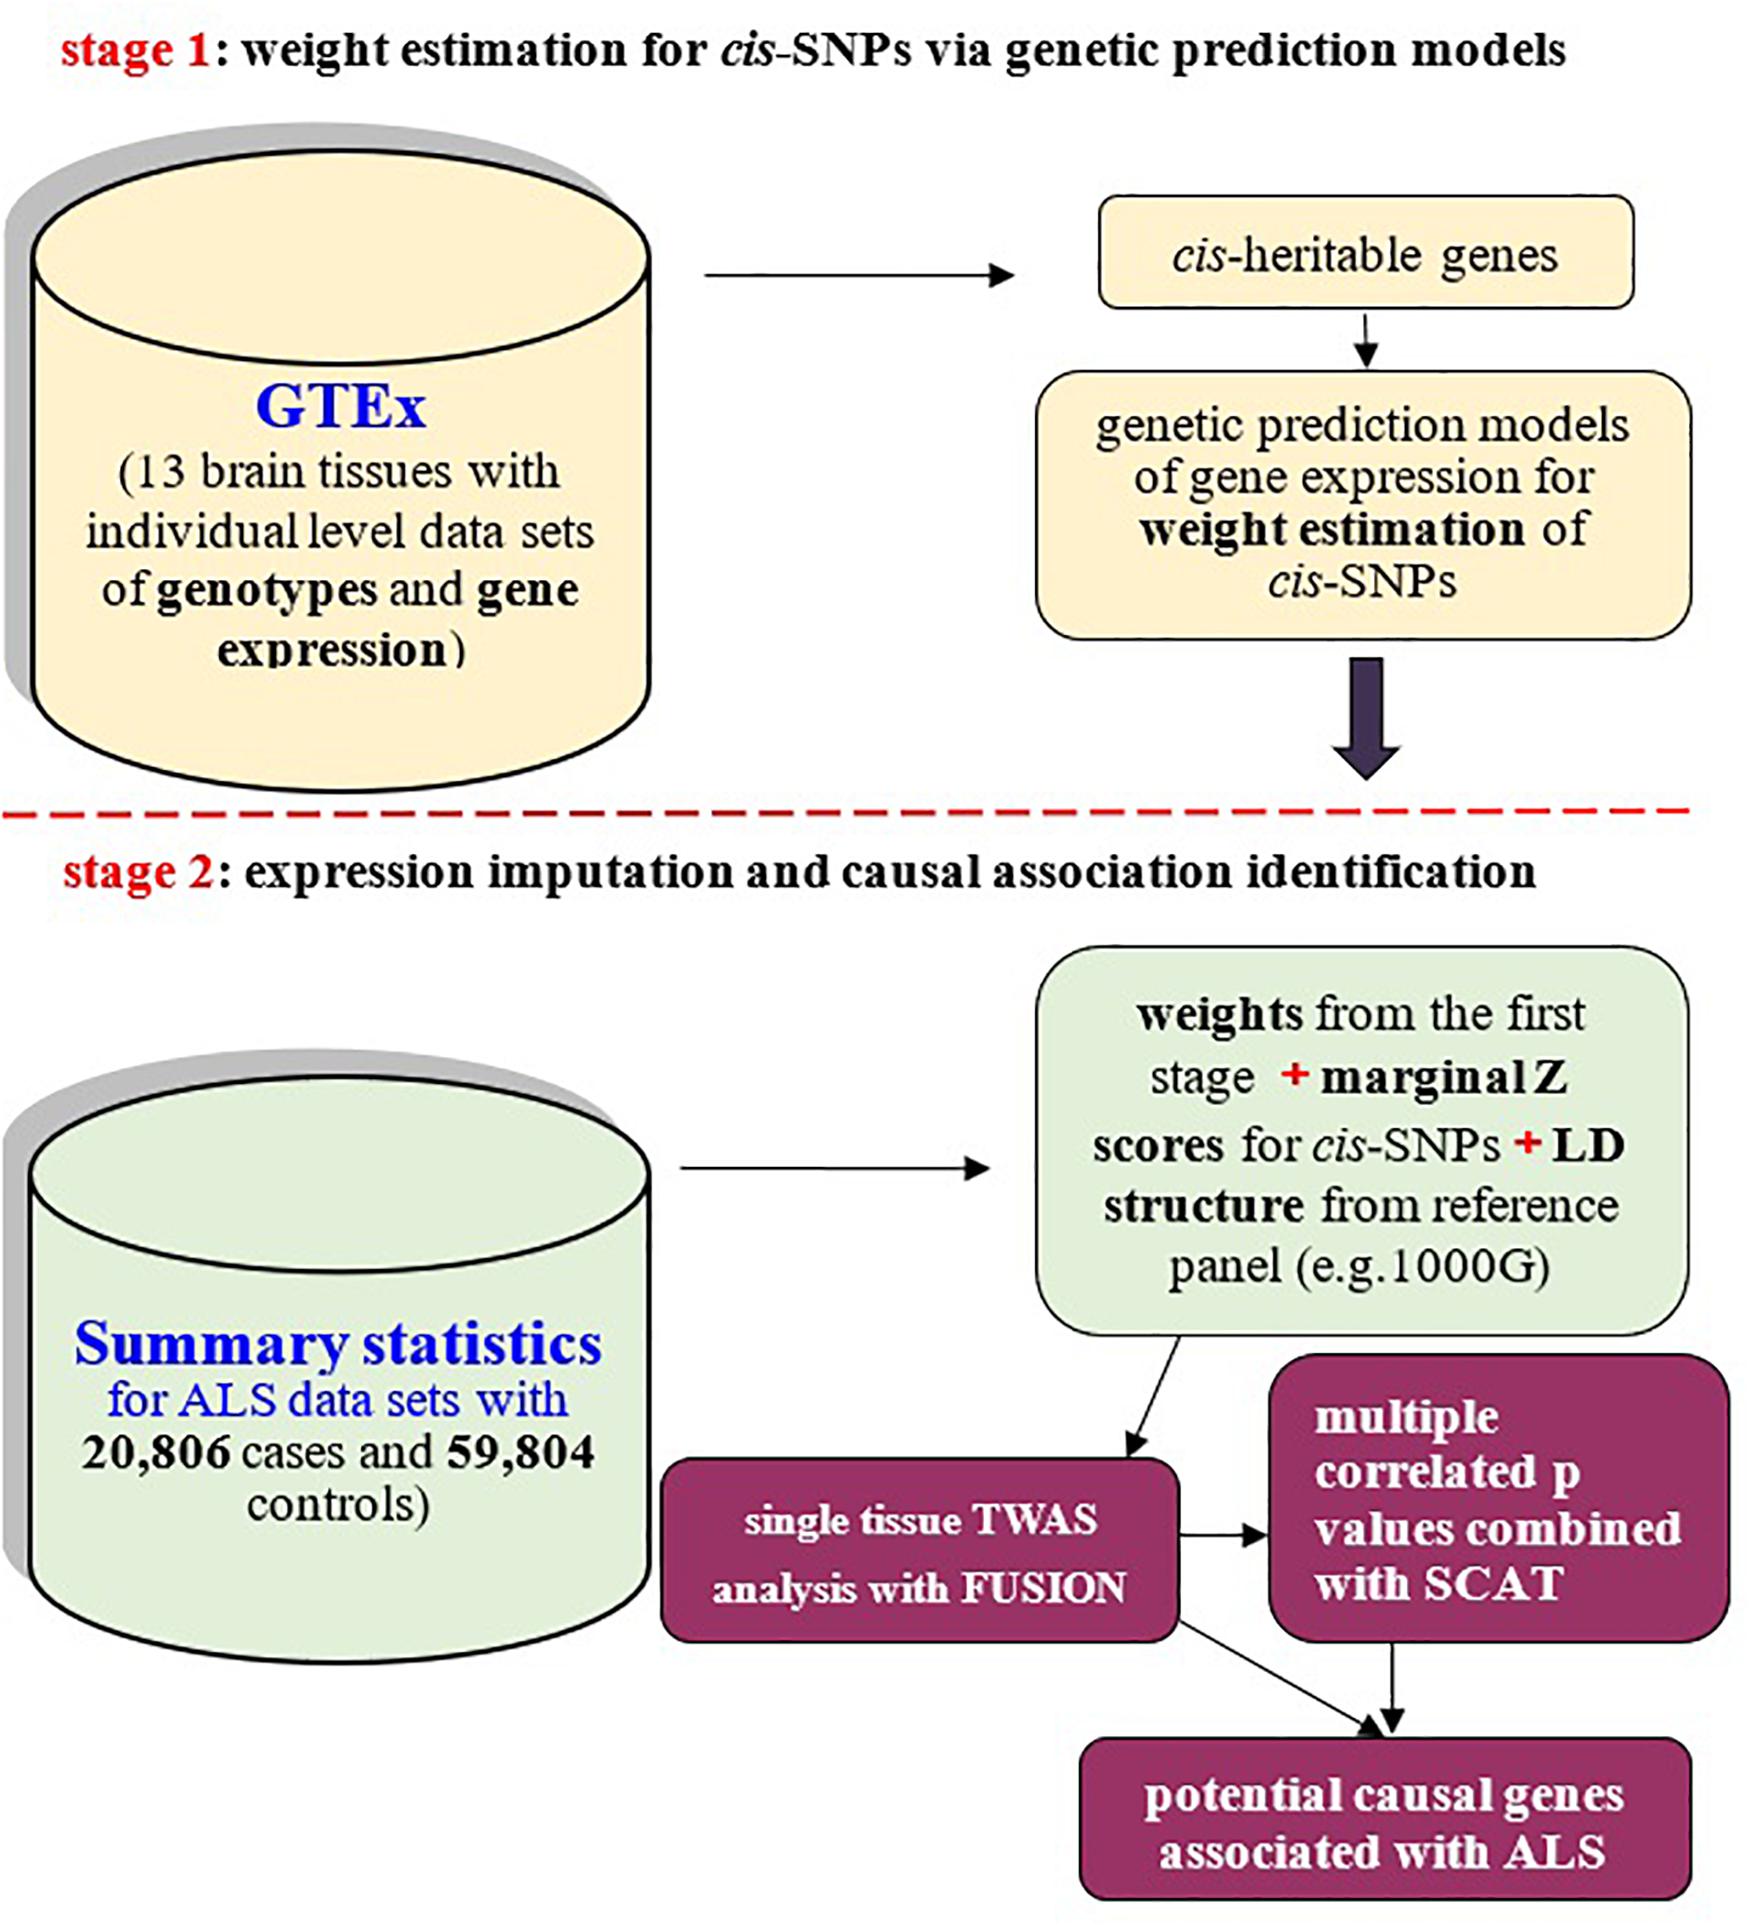
Figure 1. Schematic framework of TWAS with FUSION and SCAT based on only summary-level datasets and reference panel for linkage disequilibrium (LD) structure of SNPs. TWAS can be viewed to be a relatively independent two-stage inference procedure: the first stage is to estimate weights for cis-SNPs with GTEx brain transcriptome reference panel (the top panel); the second stage is to examine causal association between genes and ALS with weights obtained from the first stage (the bottom panel).
Moreover, because it has been shown that spurious associations may be generated if integrating gene expression from tissues that are not biologically related to the disease (Wainberg et al., 2019), a strongly recommended strategy in TWAS analysis is that one should calculate weights of cis-SNPs with expression measurements from the most relevant tissues in the first stage. For instance, the breast-cancer TWAS analysis employs transcriptome datasets of the breast tissue (Wu et al., 2018) and the prostate-cancer TWAS analysis applies transcriptome datasets of the prostate tissue (Mancuso et al., 2018; Wu et al., 2019). Therefore, it is the natural choice of brain tissues when implementing TWAS for ALS. There are 13 GTEx brain tissues that can be employed as reference transcriptome panels (GTEx Consortium, 2015, 2017) (Table 2). The rich transcriptome datasets offer an unprecedented opportunity to comprehensively integrating QTL information into the GWAS of ALS. In the meantime, they also propose a great statistical challenge for such integration.
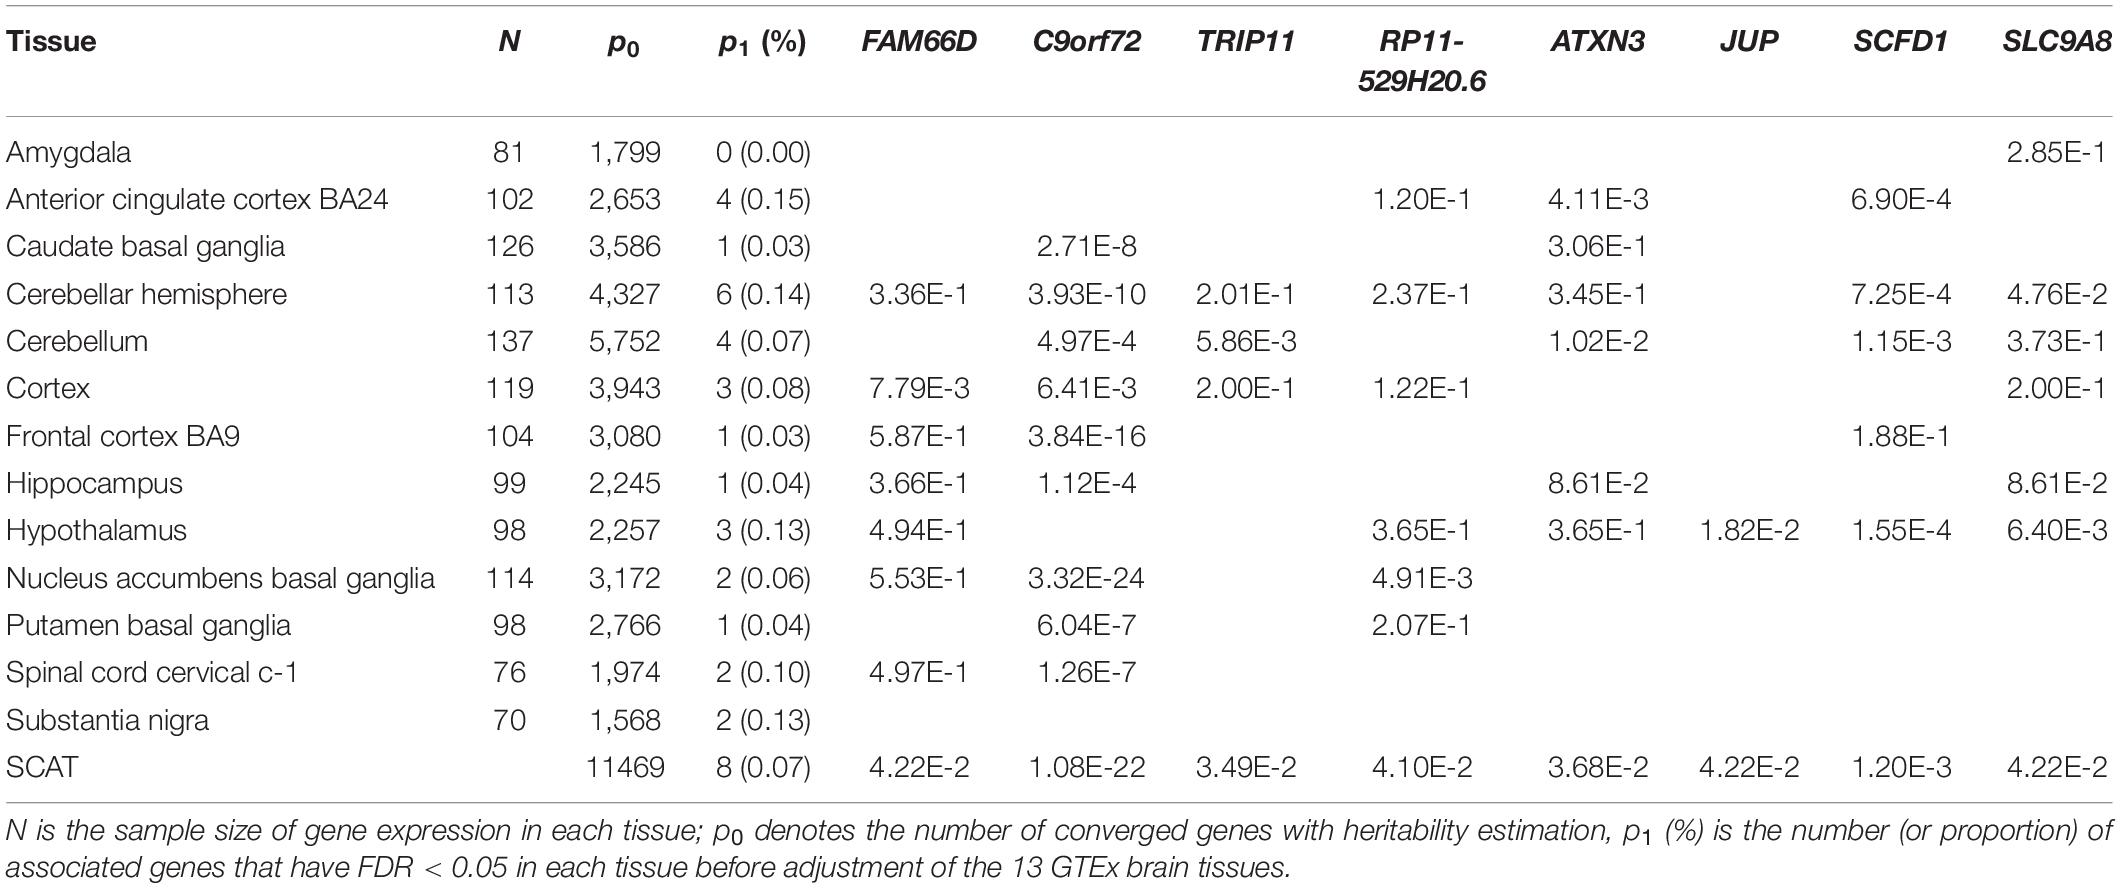
Table 2. ALS-associated genes identified by SCAT or FUSION with 13 GTEx brain tissues.
Performing ALS TWAS analysis from one brain tissue to another and then adjusting for multiple comparisons is a conventional approach. However, doing this may be underpowered because of the multiple testing burden; and such a manipulation is not optimal as it ignores useful information of shared eQTLs across brain tissues (GTEx Consortium, 2017). Therefore, it is important to integrate associations from all available brain tissues in the TWAS analysis of ALS with a more efficient manner, which would have the potential to improve power and discover newly genes associated with ALS. However, in terms of our literature view there is little existing work on how to aggregate such evidence efficiently when only summary-level eQTL and GWAS marginal statistics are utilizable. It is hence desirable to construct feasible omnibus tests to handle this problem.
The Fisher’s method (Fisher, 1934), one commonly used omnibus test, may be the first choice. Unfortunately, the Fisher’s method is only valid for independent multiple tests and thus cannot be employed due to highly positive correlation among individual TWAS tests (see simulations below for details). In fact, as we will demonstrate later, the Fisher’s method is overinflated and can lead to too many spurious associations when the TWAS test statistics are not independent. Alternatively, one may take the minimum p-value as the significance measure (Conneely and Boehnke, 2007). However, due to the same issue of unknown positive dependence, the null distribution of the minimum p-value may be extremely complicated and the computation is often time-consuming since numerical permutation/bootstrap is involved (Conneely and Boehnke, 2007; Sun and Lin, 2019).
Therefore, it is of substantial interest to develop omnibus tests that are robust against correlation. To achieve this objective, herein we propose a novel p-values integrative strategy called summary data-based Cauchy Aggregation TWAS (SCAT). Compared to previous approaches, SCAT owns an attractive strength that it takes the summary of a set of p-values as test statistic and evaluates the significance analytically without the knowledge of correlation structure. Consequently, SCAT is extraordinarily flexible and computationally fast. With extensive simulation studies we demonstrated that SCAT can produce well-calibrated p-value for the control of type I error and is often much more powerful compared with single-tissue TWAS analysis. Finally, using SCAT we discovered several new ALS-associated genes that would be missed by existing statistical strategies.
Materials and Methods
GWAS Summary Statistics for ALS
We obtained marginal summary statistics (e.g., Z scores) of ALS from the largest ALS GWAS to date (Nicolas et al., 2018). This study included several previous ALS cohorts such as the work of van Rheenen et al. (2016). For each SNP the logistic regression was first implemented per cohort with individual-level genotypes while incorporating several top principal components, age, and gender as covariates. Then, the inverse-variance weighted fixed-effect meta-analysis was implemented to pool association results across cohorts. Finally, after quality control approximately 8.6 million SNPs on 20,806 cases and 59,804 controls of European ancestry were left for our TWAS analysis.
TWAS Analysis With Single Brain Tissue
To be self-contained, we first introduce TWAS approach for individual-level dataset. Suppose that G is an n × m matrix of genotypes of cis-SNPs for a gene, n is the sample size for ALS and m is the number of genetic variants and generally changes from gene to gene; E is an n-vector for unmeasured gene expression in the ALS GWAS and y is an n-vector of binary variable for ALS cases and controls. In addition, assume g is a d × m genotype matrix of cis-SNPs and e is a d-vector of gene expression from one of the GTEx brain tissues for the same gene, with d the sample size of the reference panel. The individual-level TWAS analysis can be implemented as
where w = (w1, w2, …, wm) is the m-vector of effect sizes for cis-SNPs and can be estimated (denoted by ) with some genetic prediction model (denoted by fw) (Zeng and Zhou, 2017); ε is a normal residual and μ is the expectation of y; and θ is the effect size for imputed gene expression. In the TWAS analysis we aim to test for the null hypothesis H0: θ = 0. It is seen that TWAS bridges the gap between QTL and GWAS in a conceptually simple fashion.
FUSION: A Summary-Level TWAS With Single Tissue
When only summary-level datasets are available (as the case in our analysis of ALS), under the condition of no association between SNP and ALS we have
where is an m-vector of marginal Z scores of cis-SNPs and often generated with single SNP regression (Zeng et al., 2015); MVN denotes the multivariate normal distribution, and R is the unknown LD correlation matrix among cis-SNPs and can be approximately estimated with reference datasets such as 1000 Genomes Project (The 1000 Genomes Project Consortium, 2015). With these in hand we define the TWAS statistic as
The p-value of Zt can be easily obtained since it asymptotically follows a standard normal distribution. The above TWAS analysis is implemented through the FUSION software (Gusev et al., 2016).
Summary-Level TWAS for Multiple-Tissues With Known Correlation Structure
When the correlation structure among gene expressions is known (but it is in fact unknown), a summary-level TWAS approach combining FUSION results of multiple tissues can be designed assuming no association between the gene and ALS across tissues
where Z = (Z1, …, ZT) approximately follows MVN(0, C) with C the correlation matrix of gene expressions from T tissues. The above method is also called multiXcan (Barbeira et al., 2019) and provides an omnibus test for the combination of effect in any brain tissue while accounting for correlation. We refer to the test shown in (4) as the oracle TWAS. However, due to the lack of transcriptome reference panels (The 1000 Genomes Project Consortium, 2015), C is often unknown or cannot be estimated accurately from expression datasets with small sample sizes (Gusev et al., 2016; GTEx Consortium, 2017).
Combination of TWAS via the Aggregated Cauchy Association Test
We here introduce how SCAT can be adopted in our ALS TWAS analysis. First, we separately implement FUSION for each brain tissue and yield Zt and pt (t = 1, 2, …, T; with T = 13 here); as expected, these pts (or Zts) are highly correlated (see also below) (Brown, 1975; Kost and McDermott, 2002; Poole et al., 2016; Heard and Rubin-Delanchy, 2018). As a result, as mentioned before the Fisher’s method, which assumes independent tests, is not appropriate. We instead apply SCAT which allows us to aggregate multiple potentially dependent p-values obtained from multiple FUSION analyses into a single well-calibrated p-value that can maintain the type I error correctly. The pooled p-value of SCAT follows a Cauchy distribution regardless whether p-values are correlated or not (Liu et al., 2019; Liu and Xie, 2019). Briefly, with SCAT we have
where ϖt denotes the non-negative weight for each pt with , and assume that ϖt is independent of pt. When no prior information is available, equal weights are utilized. Because SCAT only takes a group of p-values as input and no any dependence structure is required, its implementation is thus rather straightforward and fast.
Numerical Simulations
We implement simulation studies to assess the performance of SCAT and compare it with the Fisher’s method. As described before because both the two methods used only p-values as input; we thus start our simulations by generating a series of independent or non-independent p-values. This is also the simulation framework used in previous work (Liu and Xie, 2019). Specifically, we first obtained the correlation matrix of Z values of FUSION (i.e., the C matrix; shown in Supplementary Figure S1) and generated a 13-dimentional multivariate random variable which followed MVN(μ, C). Then, we yielded the p-value for each marginal random variable by assuming it followed a standard normal distribution. Finally, we combined these p-values with SCAT or the Fisher’s method.
We set μ = 0 when evaluating the type I error control, but randomly sampled μ from an independent normal distribution with mean zero and variance 2.5 when assessing the statistical power. A total of 106 or 103 replications were generated for type I error control and power evaluation respectively. Furthermore, to match the application in real-life datasets — not all genes were identified to be cis-heritable across all brain tissues with the current sample sizes of transcriptome datasets (see Supplementary Figure S2 for more information) — in each replication of the power assessment we randomly selected at least five but at most eleven tissues to be missing. Doing this was equivalent to generating missing values in each group of marginal p-values.
In the present analysis genes with false discover rate (FDR) (Benjamini and Hochberg, 1995) less than 0.05 were defined to be associated genes. All analyses were carried out with the R software (version 3.6.2); and the codes to reproduce simulations as well as the FUSION results of ALS can be found at https://github.com/biostatpzeng. In addition, since we only employed summary-level genetic datasets that can be publicly available; therefore, additional ethical review was not needed for our study.
Results
Type I Error Control and Power Evaluation
It is observed that both the Fisher’s method and SCAT can correctly control the type I error if the p-values are independent (Figures 2A,B). However, in the presence of positive dependence among p-values, the Fisher’s method fails to maintain the type I error control and is rather liberal (Figures 2C,D). In contrast, SCAT is robust to the positive correlation structure and still displays a desirable behavior on the control of type I error (Figures 2C,D). Because of the failure in the type I error control, in the following we no longer consider the Fisher’s method.
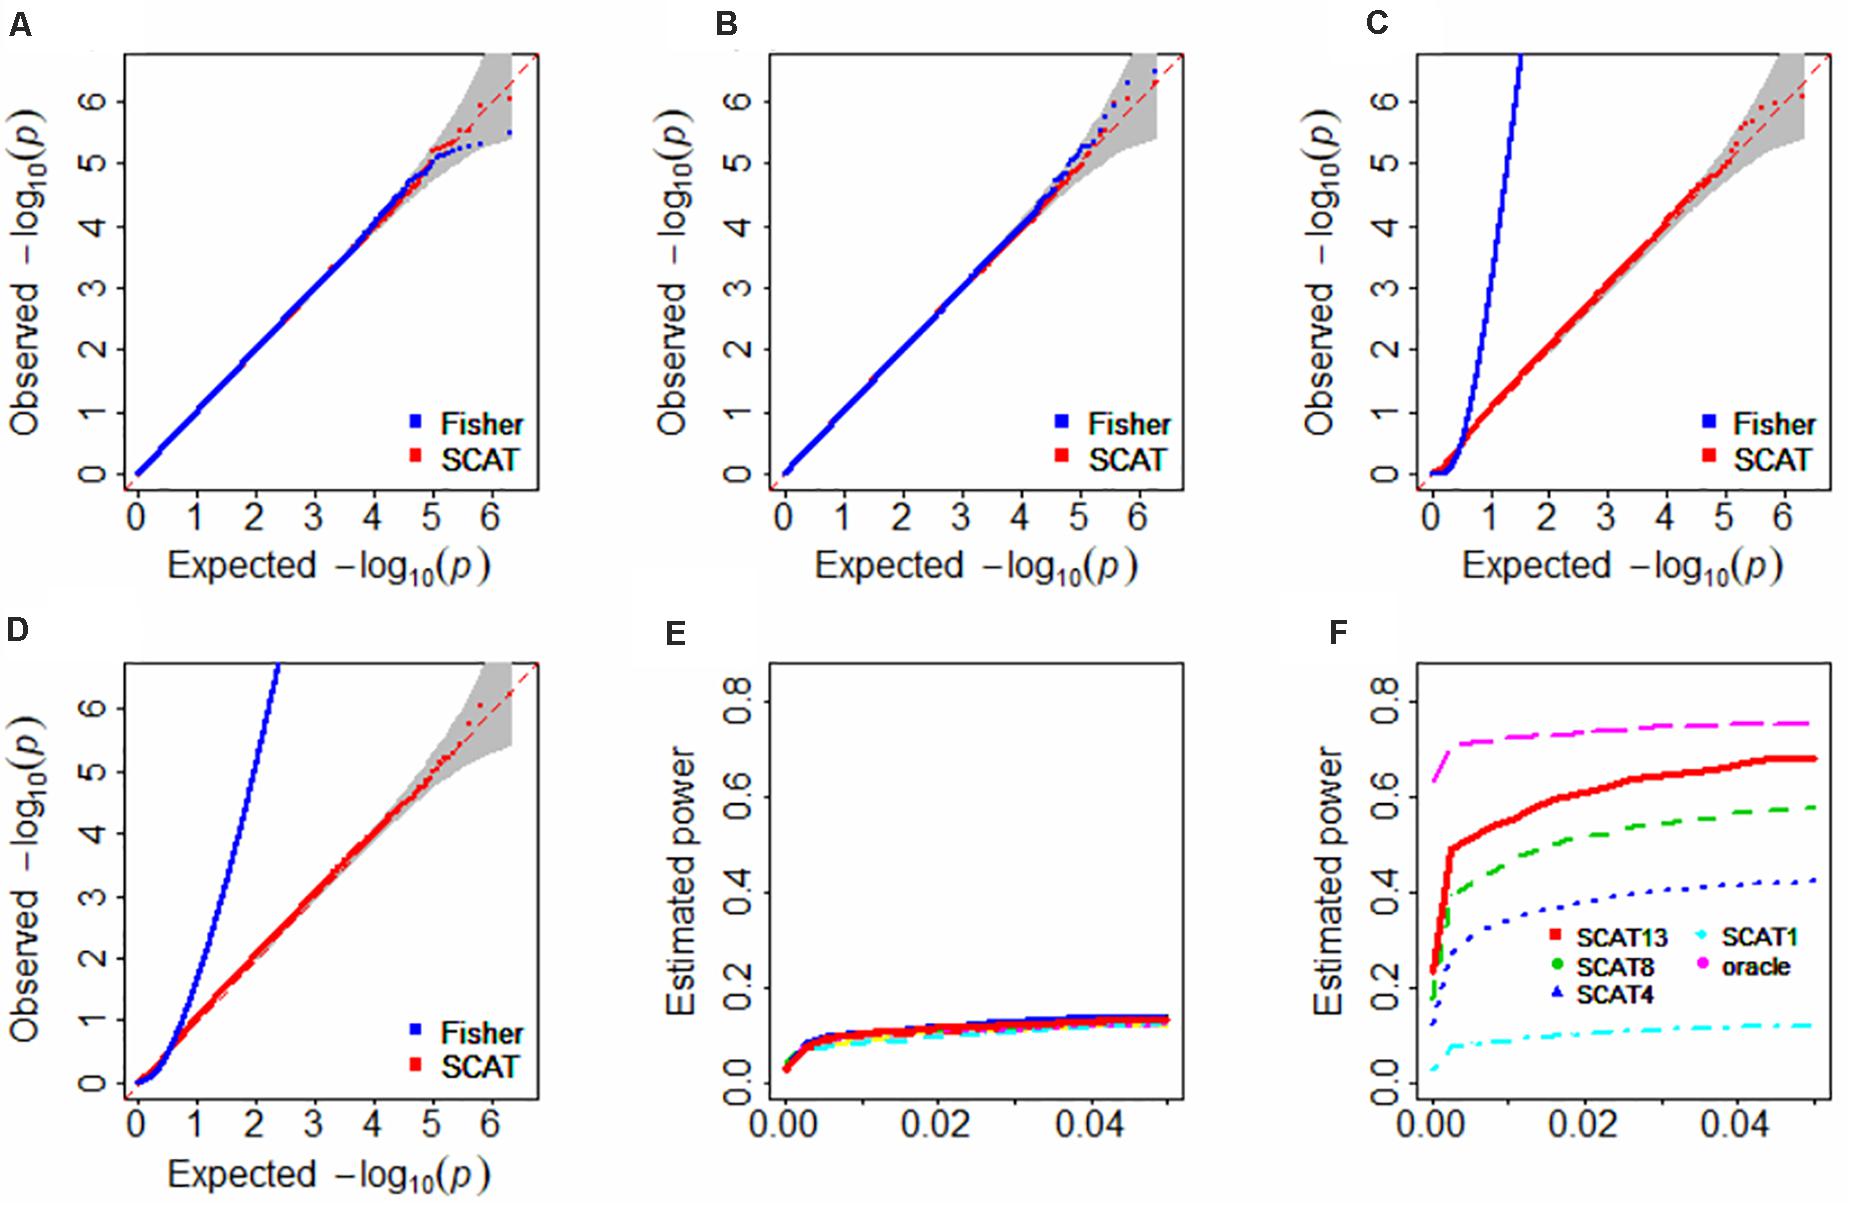
Figure 2. Type I error control (A–D) and Estimated statistical power (E,F) in the simulation studies. In (A,B), the correlation matrix was independent; in panels (C,D), the correlation matrix was specified with the matrix shown in Supplementary Figure S2; in (E), the clustered lines with various colors represent the 13 types of FUSION analysis with one tissue and cannot be clearly separated; in (F), the number attached by SCAT indicates various tissues included; oracle denotes the oracle TWAS approach with the matrix shown in Supplementary Figure S2; because the inclusion of all 13 tissues in the oracle TWAS would result in 100% power; thus, here we only considers three tissues that were randomly selected in the oracle TWAS.
The estimated statistical power is shown in Figures 2E,F. Here, several pronounced observations need to emphasize. First, SCAT substantially outperforms any individual one-tissue FUSION in our simulation settings (Figure 2E vs. Figure 2F). Second, as anticipated, ignoring correlation among p-values can indeed lead to power reduction. For example, the oracle TWAS (denoted by oracle in Figure 2F), which considers the true correlation among the test statistics, has an approximately 10.1% higher power compared with SCAT (denoted by SCAT13 in Figure 2F), and the advantage of the oracle TWAS would be more evident if less FUSION analyses are combined by SCAT (e.g., oracle vs. SCAT4 or oracle vs. SCAT8 in Figure 2F). However, as aforementioned, the oracle TWAS cannot be applicable due to unavailability of correlation structure in practice, while SCAT is a universal combination approach without such limitation.
Third, SCAT that combines FUSION with a larger set of tissues is often much more powerful than that contains a smaller set of tissues (e.g., SCAT13 vs. SCAT8 or SCAT4; here the number attached represents the number of tissues used in the SCAT analysis, with a greater number indicating more tissues included); in the extreme case where only one tissue in each group (i.e., SCAT1), SCAT reduces to FUSION and exhibits the similar behavior to FUSION. Note that, this simulation is also equivalent to the case where missing p-values emerge. Nevertheless, SCAT is still better than any FUSION analysis with one tissue as long as more than two significant tissues are contained. Fourth, however, it is not necessarily the case that SCAT can always improve the power. For example, we find SCAT would encounter a loss of power if some of the combined individual FUSION analyses are non-significant (Supplementary Figure S3). Fifth, it is shown that SCAT would loss the power as the increase in the correlation under various correlation structures (Supplementary Figure S4). For instance, SCAT has a power of 0.241, 0.317, 0.427, or 0.572 when the correlation is 0.9, 0.6, 0.3 or 0 in the exchangeable structure (Supplementary Figure S4A). In addition, as can be expected, different correlation structures among the test statistics have various influences on the power of SCAT (Supplementary Figures S4A–C).
Associated Genes With ALS Discovered in Previous GWASs
In terms of the GWAS Catalog1, most of the ALS GWASs (17 out of 22) were performed on European individuals (Table 1). Totally, there are 313 SNP association pairs discovered across all chromosomes, especially in chromosomes 1 (i.e., 19 SNPs), 2 (i.e., 19 SNPs), and 9 (i.e., 21 SNPs) (Figures 3A,B). Those genetic variants are mapped to 253 unique genetic regions, among which 25 are located within intergenic (Figure 3C). In particular, C9orf72 — a famous risk gene of ALS (Renton, 2011; Byrne, 2012; Garcia-Redondo, 2013; Diekstra et al., 2014; Chen Y. et al., 2016) — is the most frequent gene. The remaining genes with high frequency include UNC13A and CPNE4 (Figure 3C).
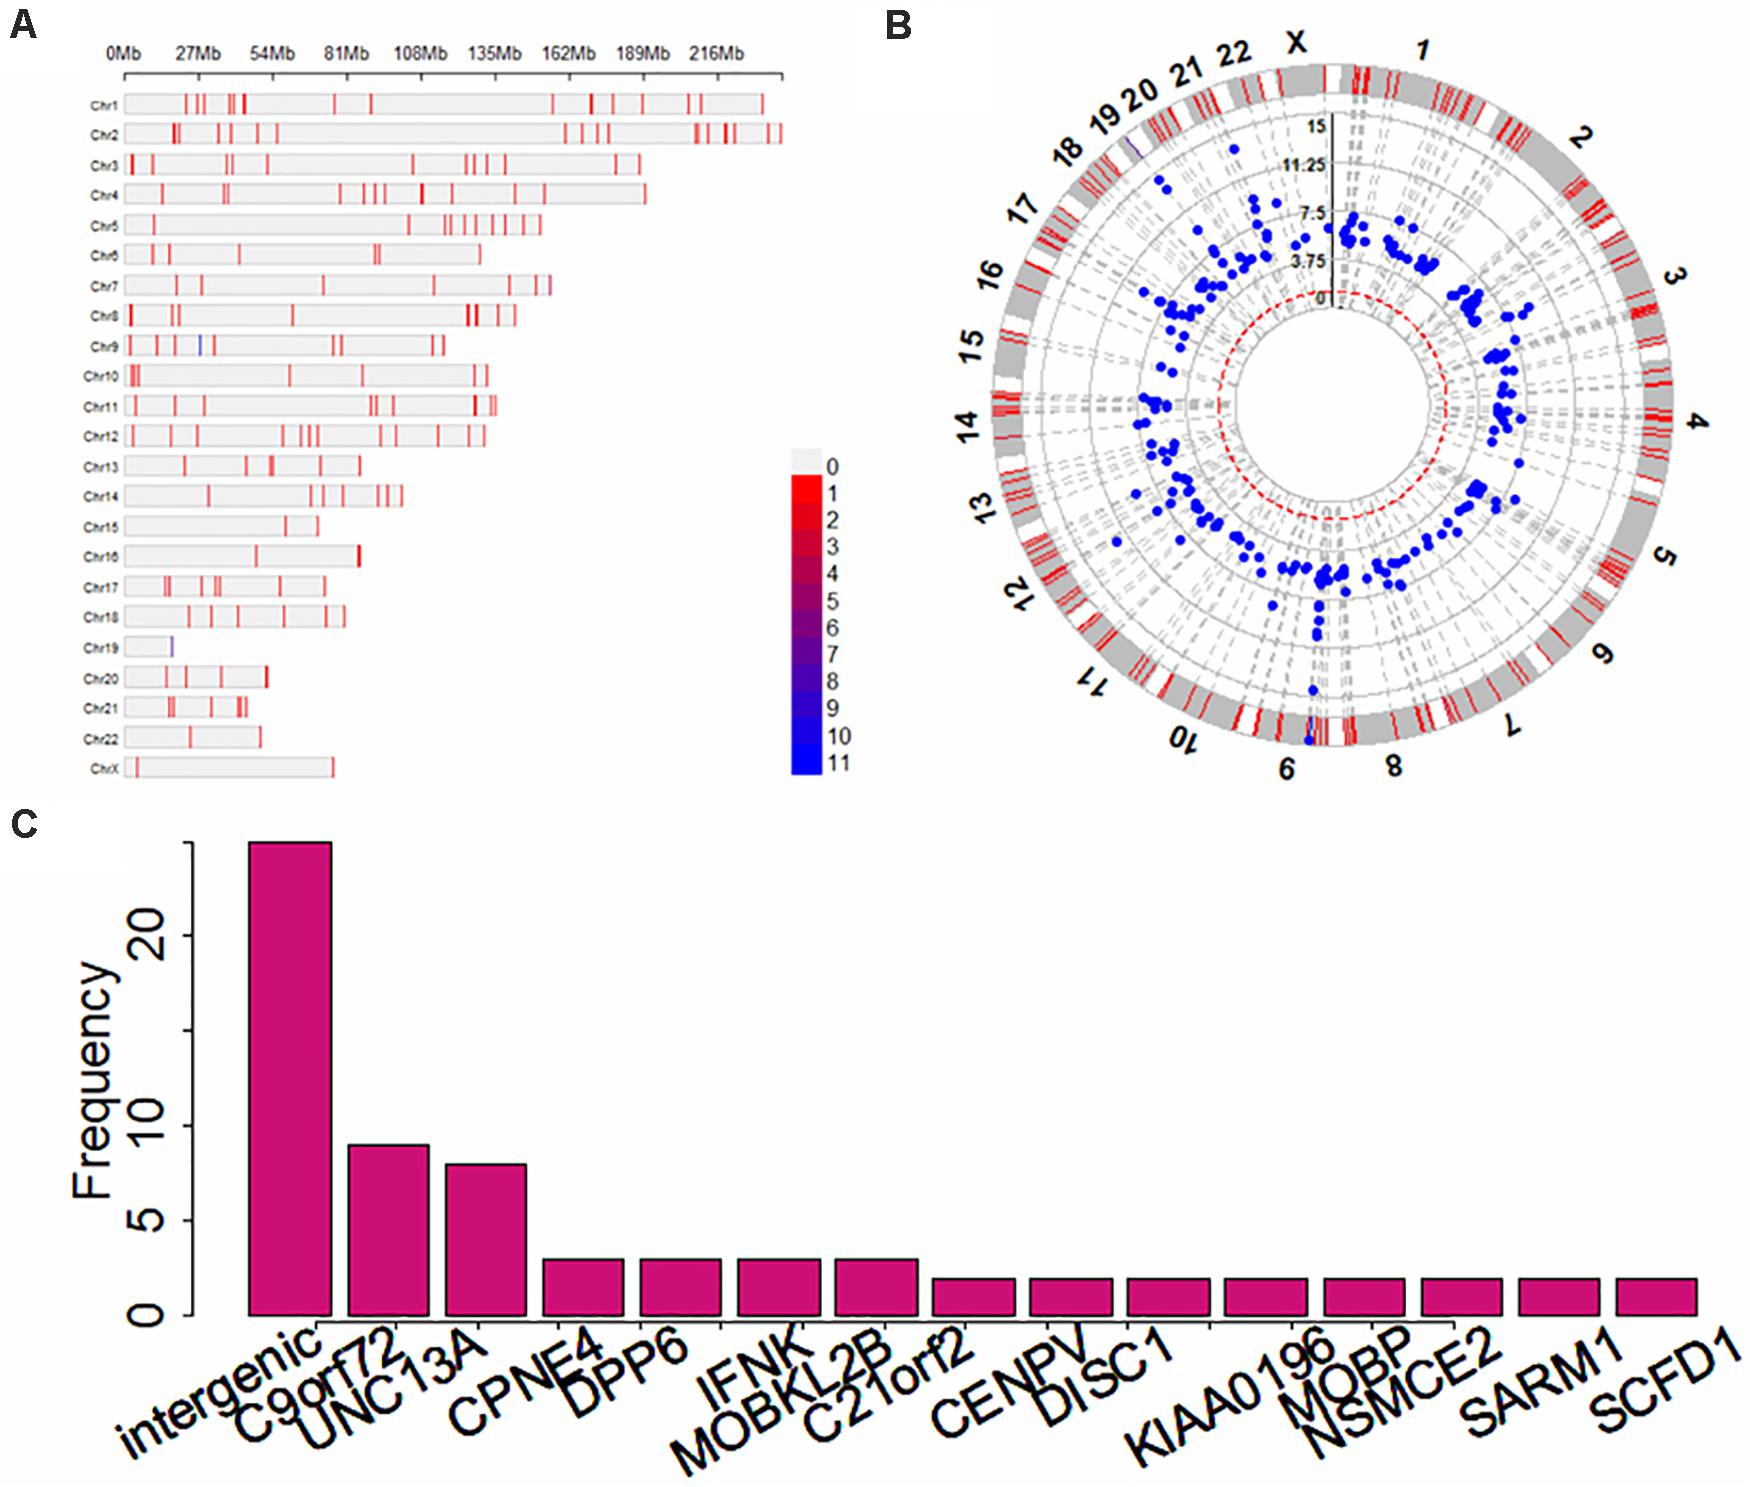
Figure 3. Summary results for ALS-associated SNPs and mapped genes identified in previous GWASs. (A) The distribution for associated SNPs across all 22 chromosomes; (B) The p-values of circle Manhattan plot of associated SNPs for significance; (C) The distribution for genes with high frequency.
Associated Genes With ALS Discovered by FUSION and SCAT
Now we applied FUSION to ALS using 13 GTEx brain tissues as reference transcriptome datasets and then combined the results with SCAT for the overall significance. The correlation among gene expressions is displayed in Supplementary Figure S5. A total of 11,469 unique genes are analyzed but only 361 overlapped genes emerging in all the 13 GTEx brain tissues. It is empirically demonstrated that the p-values of FUSION among various GTEx brain tissues exhibit highly positive dependency (Supplementary Figure S5), which, together the unavailability of correlation information makes nearly all previous p-values combined methods cannot be directly utilized.
For each GTEx brain tissue the number of genes with FDR < 0.05 (before adjustment of the issue of multiple tissues) is shown in Table 2 and Supplementary Figure S6A. The full results of TWAS for ALS are shown in Figure 4. It is seen that more genes are discovered in cerebellar hemisphere (i.e., 6 genes), following by anterior cingulate cortex BA24 and cerebellum (e.g., 4 genes for both tissues). Again, we observe that C9orf72 is discovered to be associated with ALS in almost brain tissues which previously had been kept after screening of heritable genes in FUSION. However, if further considering the issue of multiple testing, many of these genes identified by single-tissue FUSION would be non-significant, leaving only two statistically significant genes (i.e., SCFD1 and C9orf72).
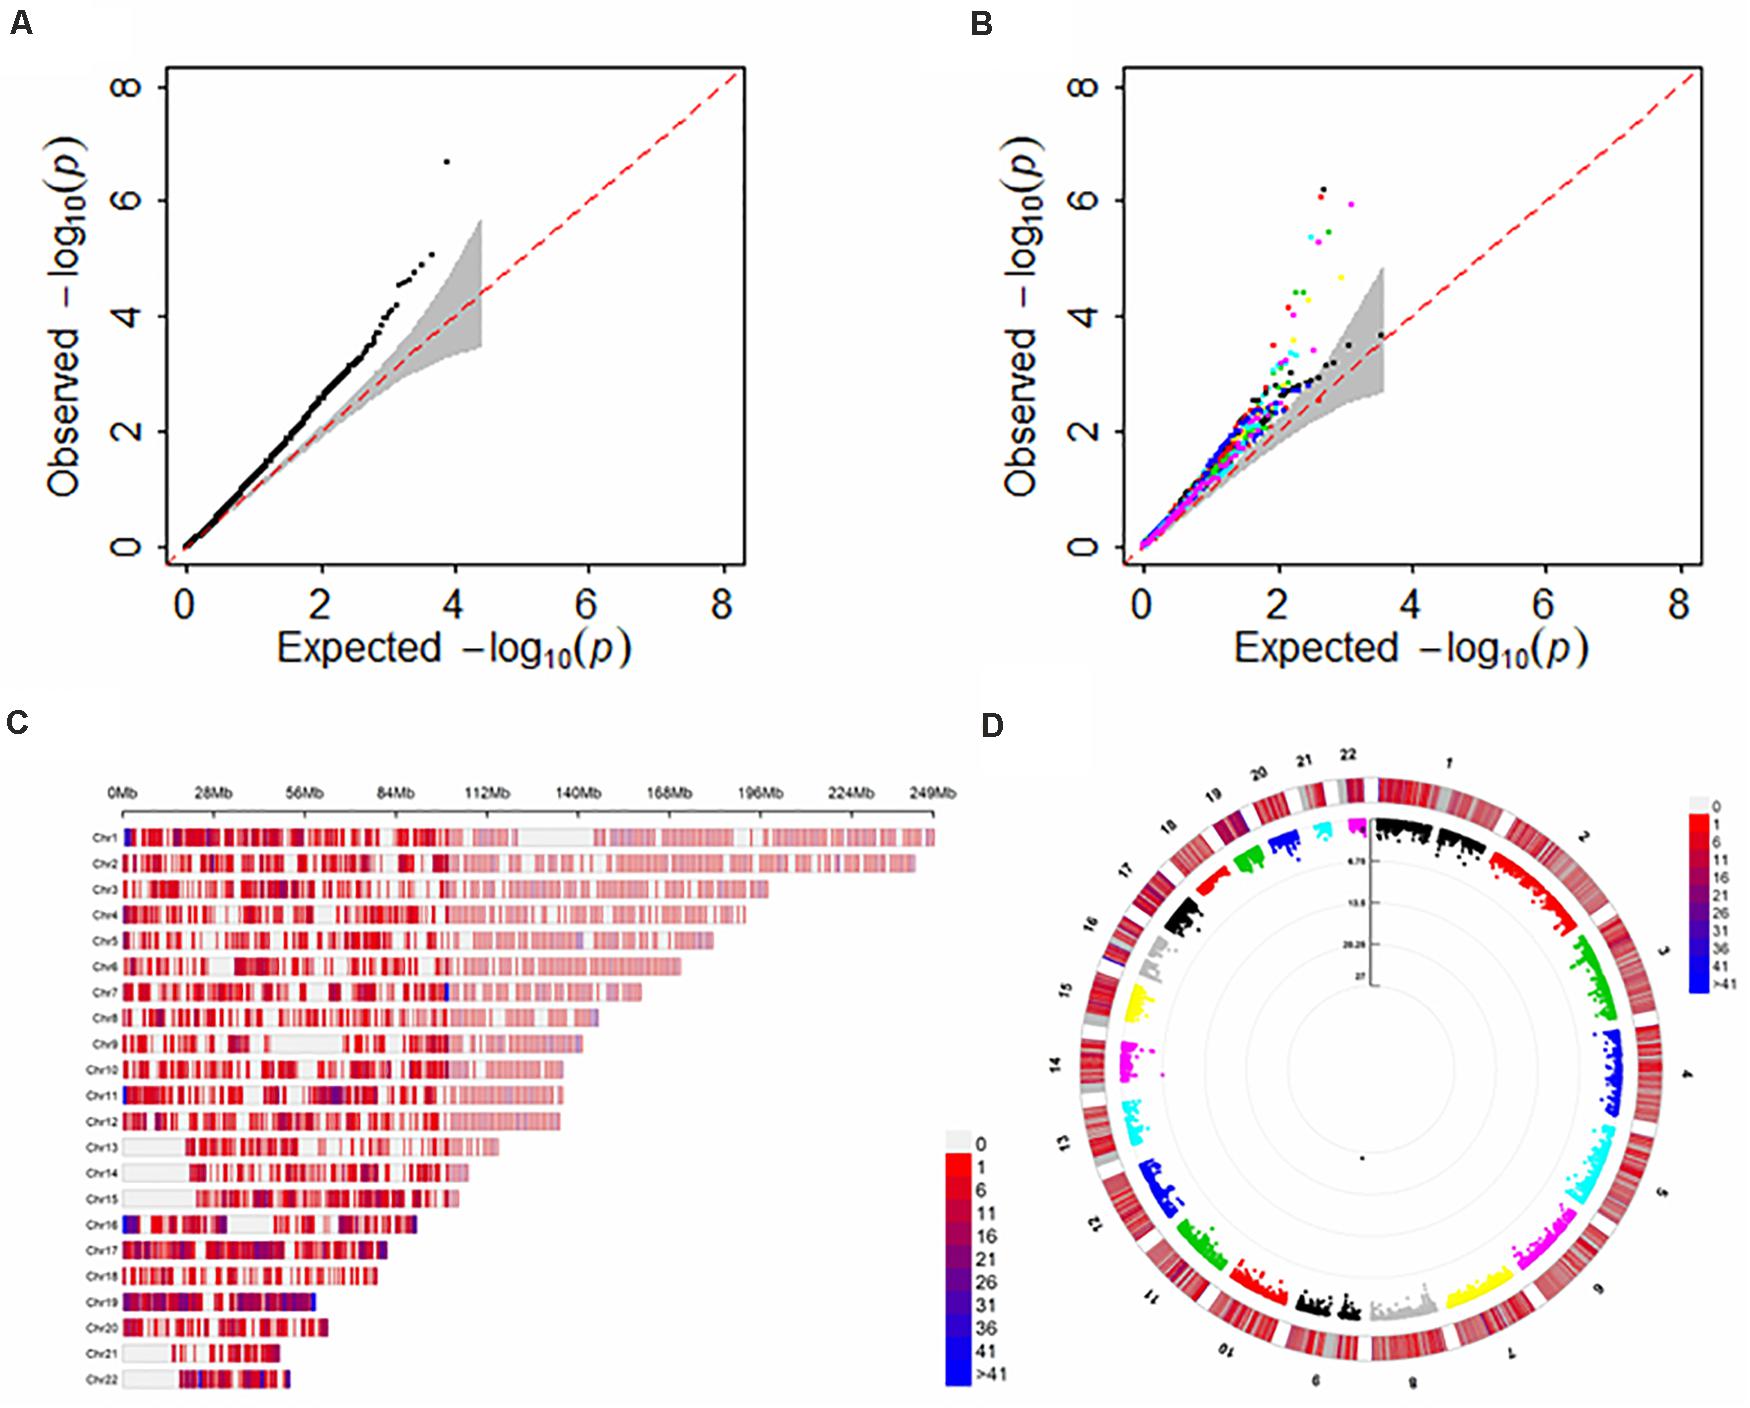
Figure 4. Results of FUSION and SCAT for TWAS analysis of ALS with multiple brain tissues. (A) The QQ plot for SCAT; (B) The QQ plot for FUSION with each of the GTEx brain tissues as reference dataset; (C) The distribution for analyzed genes across all 22 chromosomes; (D) The p-values of circle Manhattan plot of analyzed genes for significance. Of note, the genomic inflation factor of the p values obtained via SCAT is 1.04, indicating the slight inflation observed in (A) might be due to the polygenicity of ALS rather than uncontrolled unknown confounders.
The adjusted associations are displayed in Table 2 and Supplementary Figure S6B. Here, a total of eight genes are found by SCAT (FDR < 0.05), among which three (i.e., SCFD1 with FDR = 0.001, ATXN3 with FDR = 0.04 and C9orf72 with FDR = 1.08E-22) are previously identified (Supplementary Table S1), while five (i.e., SLC9A8 with FDR = 0.04, FAM66D with FDR = 0.04, TRIP11 with FDR = 0.03, JUP with FDR = 0.04 and RP11-529H20.6 with FDR = 0.04) are not. Except for FAM66D (antisense) and RP11-529H20.6 (sense overlapping), all others are protein-coding genes (Supplementary Table S2). Furthermore, we find that there are no significant SNPs (with p < 5.00E-8) included within any of these five genes (Supplementary Figure S7). Thus, in our analysis SLC9A8, FAM66D, TRIP11, JUP, and RP11-529H20.6 can be deemed to be newly genes that are likely associated with ALS.
Discussion
Given the severe health threat and little knowledge of ALS, persistent work should be done to explore genetic and environmental risk factors related to ALS. The present study is one of such efforts with the aim to discover newly causal genes for ALS. To achieve this goal, we conducted the TWAS analysis and integrated association signals from multiple GTEx brain tissues to improve power by borrowing the idea of p-values combination. As demonstrated before, the main challenge in our TWAS analysis of ALS emerges in two aspects. First, multiple brain tissues were involved and the statistics of FUSION across tissues exhibited highly positive correlation; second, the dependency structure was unknown in practice because only summary-level statistics results can be available. Those difficulties lead to the failure of the Fisher’s method and also hamper the use of other commonly employed methods that can combine dependent p-values such as the Brown’s method (Brown, 1975), the Kost’s method (Kost and McDermott, 2002) and some tests proposed recently (Barnett et al., 2017; Gaynor et al., 2019; Sun et al., 2019; Sun and Lin, 2019), which typically require known covariance among p-values.
Our TWAS analysis relies on the newly flexible statistical framework of SCAT for hypothesis testing. Compared with FUSION (i.e., the summary-level TWAS analysis with one tissue each time), SCAT is more efficient as it aggregates individual association signals. With simulation studies we revealed that SCAT produced well-calibrated p-value for type I error control and was often much more powerful to identify associated signals across various scenarios compared with FUSION with only single tissue. Using SCAT we replicated three GWAS-discovered genes including SCFD1 found in van Rheenen et al. (2016) and Nicolas et al. (2018), ATXN3 identified in Nicolas et al. (2018) and C9orf72 found in multiple previous GWASs (Supplementary Table S1). Among those C9orf72 is a well-known genetic mutation of ALS previously detected in both European population (The Alsgen Consortium, 2013; Diekstra et al., 2014; McLaughlin et al., 2015; van Rheenen et al., 2016; Nicolas et al., 2018; Dekker et al., 2019) and East Asian population (Benyamin et al., 2017).
More importantly, with SCAT we identified five newly ALS-associated genes that were otherwise missed by existing statistical strategies, including SLC9A8, FAM66D, TRIP11, JUP, and RP11-529H20.6. Our new findings are also partially supported by previous studies. First, in the molecular level one typical pathological hallmark for neurodegeneration of ALS (e.g., tau, amyloid, and beta-protein precursor) is the change in cell cycle control and progression, which can be regulated by SLC9A8 by inhibiting Na+/H+ exchanger activity in epithelia (Hu et al., 1998; Orlowski and Grinstein, 2004). In the population level, SLC9A8 exhibits widely pleiotropic influence on chronic inflammatory diseases including ankylosing spondylitis, Crohn’s disease, psoriasis, primary sclerosing cholangitis, and ulcerative colitis (Stuart et al., 2010; Ellinghaus et al., 2016); in addition, SLC9A8 is also associated with psoriasis (Stuart et al., 2010), gut microbiota (beta diversity) (Wang et al., 2016) and multiple sclerosis (International Multiple Sclerosis Genetics Consortium, 2013).
Second, TRIP11 can provide instruction for generating a type of protein known as Golgi microtubule-associated protein 210 (GMAP-210) (Infante et al., 1999). This protein is found in the Golgi apparatus, a cell structure in which newly produced proteins are modified so they can be activated. On the other hand, the depletion of Golgi matrix proteins can result in an abnormal, fragmented Golgi morphology, which has been observed in multiple neurodegenerative diseases including ALS (Fujita and Okamoto, 2005), suggesting that the fragmentation of Golgi apparatus may be related to the neuronal degeneration of ALS. In population-based studies, TRIP11 is identified to be associated with anthropometric traits including height (Gudbjartsson et al., 2008; Lettre et al., 2008; Lango Allen et al., 2010; Wood et al., 2014; He et al., 2015; Tachmazidou et al., 2017; Akiyama et al., 2019) and waist circumference adjusted for body mass index (Shungin et al., 2015; Graff et al., 2017; Justice et al., 2017), which are in turn believed to be relevant to the development of ALS (Desport et al., 1999; Jawaid et al., 2010; Paganoni et al., 2011; Shimizu et al., 2012; O’Reilly et al., 2013; Reich-Slotky et al., 2013; Calvo et al., 2017; Peter et al., 2017; Zeng et al., 2019b).
Third, JUP can regulate plakoglobin, a protein plays an important role in signaling within cells as part of the Wingless/Int (Wnt) pathway (Asimaki et al., 2007). The Wnt is a key pathway involved in neural development during embryogenesis (Wang and Wynshaw-Boris, 2004; Harrison-Uy and Pleasure, 2012) and in the maintenance of neuronal homeostasis (Ille and Sommer, 2005; Zhang et al., 2011). In particular, the perturbations of the Wnt pathway have been shown to have a correlation to neurological disorders (De Ferrari and Moon, 2006) as well as neurodegenerative diseases (De Ferrari et al., 2003; Inestrosa and Arenas, 2010).
In addition, in terms of BioSystems SLC9A8 and TRIP11 belong to the pathway of GO 0000139 Golgi membrane and JUP belongs to the pathway of GO 0000988 transcription factor activity, both of which have a functional role on brain tissues. All those provide evidence that supports the relationship between SLC9A8, JUP, and TRIP11 with ALS. It also suggests that those genes may be associated with ALS in a direct, pleiotropic or mediated manner. Those new discoveries are expected to have the potential to advance our understanding of the molecular mechanism with regards to ALS and offer new insight into the etiology of ALS.
Besides discovering new ALS-associated genes, another contribution of the present study exists in the development of SCAT that can integrate a series of correlated association signals efficiently. As illustrated before, SCAT owns the attractive advantage that it takes the summary of a group of p-values as test statistic and evaluates the significance analytically without the knowledge of correlation structure (Liu et al., 2019; Liu and Xie, 2019). Therefore, as enthusiastic interest in TWAS continues to grow with more and more genetic and transcriptome data sets collected, especially since large scale individual-level datasets are still unable to obtain for some reasons, we believe that SCAT possesses extensive usefulness to many analogous situations of integrative genomic analyses.
Finally, several limitations of our work need to state. First, among the five new SCAT-identified genes, we do not find reasonable evidence for FAM66D and RP11-529H20.6 in the literature. Second, we cannot replicate those new discoveries in external data sets since such data resources are unavailable for us; we thus simultaneously highlight the need to further validate our findings with additional investigation and experimental follow-up. Third, the used GTEx brain transcriptome reference panels have small samples sizes (ranging from 70 to 137, with the average of 102); as a result, our TWAS analysis may have only limited power. Nevertheless, we note that, in terms of the number of associated genes detected by FUSION with single brain tissue, we believe those new associations are more likely biologically relevant to ALS rather than completely driven by tissues with greater sample size. For example, only 0.07% (i.e., 4) genes were found in brain cerebellum although it has the largest sample size (i.e., 137) and the greatest cis-heritable genes (i.e., 5,752); while 0.15% genes were identified in brain anterior cingulate cortex BA24 which has only moderate sample size (i.e., 102) and cis-heritable genes (i.e., 2,653). Fourth, because not all genes can be available across all GTEx brain tissues (e.g., Table 2), we cannot determine ALS-specific tissues or identify tissue-specific ALS-associated genes, although both are also very interesting and worth of pursuing further (Sonawane et al., 2017; Finucane et al., 2018; Hao et al., 2018). Nevertheless, results displayed in Table 2 offer some suggestive observations for this issue. For instance, FAM66D is likely specially associated with ALS in brain cortex and RP11-529H20.6 is possibly specifically associated with ALS in brain nucleus accumbens basal ganglia; ATXN3, SCFD1 and SLC9A8 are relevant to ALS in some brain tissues but not others; while C9orf72 is associated with ALS across nearly all brain tissues. We note that the step-down inference procedure introduced in Sun et al. (2019) may be a promising approach that can be applied to discriminate which genes drive the observed association signal; but we reserve this problem for investigation in the future.
Data Availability Statement
The raw data supporting the conclusions of this article will be made available by the authors, without undue reservation.
Author Contributions
PZ conceived the idea for the study. PZ, LX, SH, and ZY obtained the data. TW and PZ cleared up the datasets. PZ, LX, SJ, and ZY performed the data analyses. PZ, LX, and ZY interpreted the results of the data analyses. PZ, LX, and ZY drafted the manuscript. All the authors approved the manuscript and provided relevant suggestions.
Funding
The research of PZ was supported in part by the Youth Foundation of Humanity and Social Science funded by Ministry of Education of China (18YJC910002), the Natural Science Foundation of Jiangsu Province of China (BK20181472), the China Postdoctoral Science Foundation (2018M630607 and 2019T120465), the QingLan Research Project of Jiangsu Province for Outstanding Young Teachers, the Six-Talent Peaks Project in Jiangsu Province of China (WSN-087), the Training Project for Youth Teams of Science and Technology Innovation at Xuzhou Medical University (TD202008), the Postdoctoral Science Foundation of Xuzhou Medical University, the National Natural Science Foundation of China (81402765), and the Statistical Science Research Project from National Bureau of Statistics of China (2014LY112). The research of ZY was supported in part by the National Natural Science Foundation of China (81673272 and 81872712), the Natural Science Foundation of Shandong Province (ZR2019ZD02), and the Young Scholars Program of Shandong University (2016WLJH23). The research of SH was supported in part by the Social Development Project of Xuzhou City (KC19017). The research of TW was supported in part by the Social Development Project of Xuzhou City (KC20062). The research of LX was supported in part by the China Postdoctoral Science Foundation (2020M671607), the Research Initiation Foundation of Xuzhou Medical University (D2018002), and the National Natural Science Foundation of China (12001470).
Conflict of Interest
The authors declare that the research was conducted in the absence of any commercial or financial relationships that could be construed as a potential conflict of interest.
Acknowledgments
We thank the ALS GWAS consortium studies for making the summary data publicly available for us and are grateful of all the investigators and participants contributed to those studies. The data analyses in the present study were implemented with the high-performance computing cluster that was supported by the special central finance project of local universities for Xuzhou Medical University.
Supplementary Material
The Supplementary Material for this article can be found online at: https://www.frontiersin.org/articles/10.3389/fgene.2020.587243/full#supplementary-material
Footnotes
References
Akiyama, M., Ishigaki, K., Sakaue, S., Momozawa, Y., Horikoshi, M., Hirata, M., et al. (2019). Characterizing rare and low-frequency height-associated variants in the Japanese population. Nat. Commun. 10:4393. doi: 10.1038/s41467-019-12276-5
Al-Chalabi, A., Fang, F., Hanby, M. F., Leigh, P. N., Shaw, C. E., Ye, W., et al. (2010). An estimate of amyotrophic lateral sclerosis heritability using twin data. J. Neurol. Neurosurg. Psychiatry 81, 1324–1326. doi: 10.1136/jnnp.2010.207464
Arthur, K. C., Calvo, A., Price, T. R., Geiger, J. T., Chiò, A., and Traynor, B. J. (2016). Projected increase in amyotrophic lateral sclerosis from 2015 to 2040. Nat. Commun. 7:12408. doi: 10.1038/ncomms12408
Asimaki, A., Syrris, P., Wichter, T., Matthias, P., Saffitz, J. E., and McKenna, W. J. (2007). A novel dominant mutation in plakoglobin causes arrhythmogenic right ventricular cardiomyopathy. Am. J. Hum. Genet. 81, 964–973. doi: 10.1086/521633
Barbeira, A. N., Dickinson, S. P., Bonazzola, R., Zheng, J., Wheeler, H. E., Torres, J. M., et al. (2018). Exploring the phenotypic consequences of tissue specific gene expression variation inferred from GWAS summary statistics. Nat. Commun. 9:1825. doi: 10.1038/s41467-018-03621-1
Barbeira, A. N., Pividori, M., Zheng, J., Wheeler, H. E., Nicolae, D. L., and Im, H. K. (2019). Integrating predicted transcriptome from multiple tissues improves association detection. PLoS Genet. 15:e1007889. doi: 10.1371/journal.pgen.1007889
Barnett, I., Mukherjee, R., and Lin, X. (2017). The generalized higher criticism for testing SNP-set effects in genetic association studies. J. Am. Statist. Assoc. 112, 64–76. doi: 10.1080/01621459.2016.1192039
Benjamini, Y., and Hochberg, Y. (1995). Controlling the false discovery rate: a practical and powerful approach to multiple testing. J. Royal Statist. Soc. Ser. B 57, 289–300. doi: 10.1111/j.2517-6161.1995.tb02031.x
Benyamin, B., He, J., Zhao, Q., Gratten, J., Garton, F., Leo, P. J., et al. (2017). Cross-ethnic meta-analysis identifies association of the GPX3-TNIP1 locus with amyotrophic lateral sclerosis. Nat. Commun. 8:611.
Brown, M. B. (1975). 400: A method for combining non-independent, one-sides tests of significance. Biometrics 31, 987–992. doi: 10.2307/2529826
Byrne, S. (2012). Cognitive and clinical characteristics of patients with amyotrophic lateral sclerosis carrying a C9orf72 repeat expansion: a population-based cohort study. Lancet Neurol. 11, 232–240. doi: 10.1016/s1474-4422(12)70014-5
Calvo, A., Moglia, C., Lunetta, C., Marinou, K., Ticozzi, N., Ferrante, G. D., et al. (2017). Factors predicting survival in ALS: a multicenter Italian study. J. Neurol. 264, 54–63. doi: 10.1007/s00415-016-8313-y
Chen, C.-J., Chen, C.-M., Pai, T.-W., Chang, H.-T., and Hwang, C.-S. (2016). A genome-wide association study on amyotrophic lateral sclerosis in the Taiwanese Han population. Biomark. Med. 10, 597–611. doi: 10.2217/bmm.15.115
Chen, Y., Lin, Z., Chen, X., Cao, B., Wei, Q., Ou, R., et al. (2016). Large C9orf72 repeat expansions are seen in Chinese patients with sporadic amyotrophic lateral sclerosis. Neurobiol. Aging 38, .e215–.e217. doi: 10.1016/j.neurobiolaging.2015.11.016
Chio, A., Logroscino, G., Hardiman, O., Swingler, R., Mitchell, D., Beghi, E., et al. (2009). Prognostic factors in ALS: a critical review. Amyotr. Lateral Sclerosis 10, 310–323. doi: 10.3109/17482960802566824
Conneely, K. N., and Boehnke, M. (2007). So many correlated tests, so little time! rapid adjustment of p values for multiple correlated tests. Am. J. Hum. Genet. 81, 1158–1168. doi: 10.1086/522036
Cronin, S., Berger, S., Ding, J., Schymick, J. C., Washecka, N., Hernandez, D. G., et al. (2007). A genome-wide association study of sporadic ALS in a homogenous Irish population. Hum. Mol. Genet. 17, 768–774. doi: 10.1093/hmg/ddm361
Cronin, S., Tomik, B., Bradley, D. G., Slowik, A., and Hardiman, O. (2009). Screening for replication of genome-wide SNP associations in sporadic ALS. Eur. J. Hum. Genet. 17, 213–218. doi: 10.1038/ejhg.2008.194
De Ferrari, G. V., Chacon, M. A., Barria, M. I., Garrido, J. L., Godoy, J. A., Olivares, G., et al. (2003). Activation of Wnt signaling rescues neurodegeneration and behavioral impairments induced by beta-amyloid fibrils. Mol. Psychiatry 8, 195–208. doi: 10.1038/sj.mp.4001208
De Ferrari, G. V., and Moon, R. T. (2006). The ups and downs of Wnt signaling in prevalent neurological disorders. Oncogene 25, 7545–7553. doi: 10.1038/sj.onc.1210064
Dekker, A. M., Diekstra, F. P., Pulit, S. L., Tazelaar, G. H. P., van der Spek, R. A., van Rheenen, W., et al. (2019). Exome array analysis of rare and low frequency variants in amyotrophic lateral sclerosis. Sci. Rep. 9:5931. doi: 10.1038/s41598-019-42091-3
Deng, M., Wei, L., Zuo, X., Tian, Y., Xie, F., Hu, P., et al. (2013). Genome-wide association analyses in Han Chinese identify two new susceptibility loci for amyotrophic lateral sclerosis. Nat. Genet. 45, 697–700. doi: 10.1038/ng.2627
Desport, J., Preux, P., Truong, T., Vallat, J., Sautereau, D., and Couratier, P. (1999). Nutritional status is a prognostic factor for survival in ALS patients. Neurology 53, 1059–1059. doi: 10.1212/wnl.53.5.1059
Diekstra, F. P., Deerlin, V. M., Swieten, J. C., Al-Chalabi, A., Ludolph, A. C., Weishaupt, J. H., et al. (2014). C9orf72 and UNC13A are shared risk loci for amyotrophic lateral sclerosis and frontotemporal dementia: A genome-wide meta-analysis. Ann. Neurol. 76, 120–133.
Ellinghaus, D., Jostins, L., Spain, S. L., Cortes, A., Bethune, J., Han, B., et al. (2016). Analysis of five chronic inflammatory diseases identifies 27 new associations and highlights disease-specific patterns at shared loci. Nat. Genet. 48, 510–518. doi: 10.1038/ng.3528
Finucane, H. K., Reshef, Y. A., Anttila, V., Slowikowski, K., Gusev, A., Byrnes, A., et al. (2018). Heritability enrichment of specifically expressed genes identifies disease-relevant tissues and cell types. Nat. Genet. 50, 621–629. doi: 10.1038/s41588-018-0081-4
Fisher, R. A. (1934). Statistical Methods for Research Workers: Biological Monographs and Manuals, 5th Edn. Edinburgh: Oliver and Boyd Ltd.
Fogh, I., Ratti, A., Gellera, C., Lin, K., Tiloca, C., Moskvina, V., et al. (2013). A genome-wide association meta-analysis identifies a novel locus at 17q11. 2 associated with sporadic amyotrophic lateral sclerosis. Hum. Mol. Genet. 23, 2220–2231.
Fujita, Y., and Okamoto, K. (2005). Golgi apparatus of the motor neurons in patients with amyotrophic lateral sclerosis and in mice models of amyotrophic lateral sclerosis. Neuropathology 25, 388–394. doi: 10.1111/j.1440-1789.2005.00616.x
Garcia-Redondo, A. (2013). Analysis of the C9orf72 gene in patients with amyotrophic lateral sclerosis in Spain and different populations worldwide. Hum. Mutat. 34, 79–82.
Gaynor, S. M., Sun, R., Lin, X., and Quackenbush, J. (2019). Identification of differentially expressed gene sets using the Generalized Berk-Jones statistic. Bioinformatics 35, 4568–4576. doi: 10.1093/bioinformatics/btz277
Gladman, M., and Zinman, L. (2015). The economic impact of amyotrophic lateral sclerosis: a systematic review. Exp. Rev. Pharmacoecon. Outcomes Res. 15, 439–450. doi: 10.1586/14737167.2015.1039941
Graff, M., Scott, R. A., Justice, A. E., Young, K. L., Feitosa, M. F., Barata, L., et al. (2017). Genome-wide physical activity interactions in adiposity − A meta-analysis of 200,452 adults. PLoS Genet. 13:e1006528. doi: 10.1371/journal.pgen.1006528
GTEx Consortium (2015). The Genotype-Tissue Expression (GTEx) pilot analysis: multitissue gene regulation in humans. Science 348, 648–660. doi: 10.1126/science.1262110
GTEx Consortium (2017). Genetic effects on gene expression across human tissues. Nature 550, 204–213. doi: 10.1038/nature24277
Gudbjartsson, D. F., Walters, G. B., Thorleifsson, G., Stefansson, H., Halldorsson, B. V., Zusmanovich, P., et al. (2008). Many sequence variants affecting diversity of adult human height. Nat. Genet. 40, 609–615. doi: 10.1038/ng.122
Gusev, A., Ko, A., Shi, H., Bhatia, G., Chung, W., Penninx, B. W. J. H., et al. (2016). Integrative approaches for large-scale transcriptome-wide association studies. Nat. Genet. 48, 245–252. doi: 10.1038/ng.3506
Hao, X., Zeng, P., Zhang, S., and Zhou, X. (2018). Identifying and exploiting trait-relevant tissues with multiple functional annotations in genome-wide association studies. PLoS Genet. 14:e1007186. doi: 10.1371/journal.pgen.1007186
Harrison-Uy, S. J., and Pleasure, S. J. (2012). Wnt signaling and forebrain development. Cold Spring Harb. Perspect. Biol. 4:a008094. doi: 10.1101/cshperspect.a008094
He, M., Xu, M., Zhang, B., Liang, J., Chen, P., Lee, J.-Y., et al. (2015). Meta-analysis of genome-wide association studies of adult height in East Asians identifies 17 novel loci. Hum. Mol. Genet. 24, 1791–1800. doi: 10.1093/hmg/ddu583
Heard, N. A., and Rubin-Delanchy, P. (2018). Choosing between methods of combining p-values. Biometrika 105, 239–246. doi: 10.1093/biomet/asx076
Hu, Q., Xia, Y., Corda, S., Zweier, J. L., and Ziegelstein, R. C. (1998). Hydrogen peroxide decreases pHi in human aortic endothelial cells by inhibiting Na+/H+ exchange. Circ. Res. 83, 644–651. doi: 10.1161/01.res.83.6.644
Hu, Y., Li, M., Lu, Q., Weng, H., Wang, J., Zekavat, S. M., et al. (2019). A statistical framework for cross-tissue transcriptome-wide association analysis. Nat. Genet. 51, 568–576. doi: 10.1038/s41588-019-0345-7
Ille, F., and Sommer, L. (2005). Wnt signaling: multiple functions in neural development. Cell Mol. Life Sci. 62, 1100–1108. doi: 10.1007/s00018-005-4552-2
Inestrosa, N. C., and Arenas, E. (2010). Emerging roles of Wnts in the adult nervous system. Nat. Rev. Neurosci. 11, 77–86. doi: 10.1038/nrn2755
Infante, C., Ramos-Morales, F., Fedriani, C., Bornens, M., and Rios, R. M. (1999). GMAP-210, A cis-Golgi network-associated protein, is a minus end microtubule-binding protein. J. Cell Biol. 145, 83–98. doi: 10.1083/jcb.145.1.83
International Multiple Sclerosis Genetics Consortium (2013). Analysis of immune-related loci identifies 48 new susceptibility variants for multiple sclerosis. Nat. Genet. 45, 1353–1360. doi: 10.1038/ng.2770
Jawaid, A., Murthy, S. B., Wilson, A. M., Qureshi, S. U., Amro, M. J., Wheaton, M., et al. (2010). A decrease in body mass index is associated with faster progression of motor symptoms and shorter survival in ALS. Amyotr. Lateral Sclerosis 11, 542–548. doi: 10.3109/17482968.2010.482592
Justice, A. E., Winkler, T. W., Feitosa, M. F., Graff, M., Fisher, V. A., Young, K., et al. (2017). Genome-wide meta-analysis of 241,258 adults accounting for smoking behaviour identifies novel loci for obesity traits. Nat. Commun. 8:14977. doi: 10.1038/ncomms14977
Keller, M. F., Ferrucci, L., Singleton, A. B., Tienari, P. J., Laaksovirta, H., Restagno, G., et al. (2014). Genome-wide analysis of the heritability of amyotrophic lateral sclerosis. JAMA Neurol. 71, 1123–1134. doi: 10.1001/jamaneurol.2014.1184
Kiernan, M. C., Vucic, S., Cheah, B. C., Turner, M. R., Eisen, A., Hardiman, O., et al. (2011). Amyotrophic lateral sclerosis. Lancet 377, 942–955. doi: 10.1016/S0140-6736(10)61156-7
Kost, J. T., and McDermott, M. P. (2002). Combining dependent P-values. Statist. Prob. Lett. 60, 183–190. doi: 10.1016/S0167-7152(02)00310-3
Kwee, L. C., Liu, Y., Haynes, C., Gibson, J. R., Stone, A., Schichman, S. A., et al. (2012). A high-density genome-wide association screen of sporadic ALS in US veterans. PLoS One 7:e32768. doi: 10.1371/journal.pone.0032768
Laaksovirta, H., Peuralinna, T., Schymick, J. C., Scholz, S. W., Lai, S.-L., Myllykangas, L., et al. (2010). Chromosome 9p21 in amyotrophic lateral sclerosis in Finland: a genome-wide association study. Lancet Neurol. 9, 978–985. doi: 10.1016/s1474-4422(10)70184-8
Landers, J. E., Melki, J., Meininger, V., Glass, J. D., van den Berg, L. H., van Es, M. A., et al. (2009). Reduced expression of the Kinesin-Associated Protein 3 (KIFAP3) gene increases survival in sporadic amyotrophic lateral sclerosis. Proc. Natl. Acad. Sci. U.S.A. 106, 9004–9009.
Lango Allen, H., Estrada, K., Lettre, G., Berndt, S. I., Weedon, M. N., Rivadeneira, F., et al. (2010). Hundreds of variants clustered in genomic loci and biological pathways affect human height. Nature 467, 832–838.
Larkindale, J., Yang, W., Hogan, P. F., Simon, C. J., Zhang, Y., Jain, A., et al. (2014). Cost of illness for neuromuscular diseases in the United States. Muscle and Nerve 49, 431–438. doi: 10.1002/mus.23942
Lettre, G., Jackson, A. U., Gieger, C., Schumacher, F. R., Berndt, S. I., Sanna, S., et al. (2008). Identification of ten loci associated with height highlights new biological pathways in human growth. Nat. Genet. 40, 584–591. doi: 10.1038/ng.125
Li, Y. I., van de Geijn, B., Raj, A., Knowles, D. A., Petti, A. A., Golan, D., et al. (2016). RNA splicing is a primary link between genetic variation and disease. Science 352, 600–604. doi: 10.1126/science.aad9417
Liu, Y., Chen, S., Li, Z., Morrison, A. C., Boerwinkle, E., and Lin, X. (2019). ACAT: a fast and powerful p value combination method for rare-variant analysis in sequencing studies. Am. J. Hum. Genet. 104, 410–421. doi: 10.1016/j.ajhg.2019.01.002
Liu, Y., and Xie, J. (2019). Cauchy combination test: a powerful test with analytic p-value calculation under arbitrary dependency structures. J. Am. Statist. Assoc. 115, 393–402. doi: 10.1080/01621459.2018.1554485
Mancuso, N., Freund, M. K., Johnson, R., Shi, H., Kichaev, G., Gusev, A., et al. (2019). Probabilistic fine-mapping of transcriptome-wide association studies. Nat. Genet. 51, 675–682. doi: 10.1038/s41588-019-0367-1
Mancuso, N., Gayther, S., Gusev, A., Zheng, W., Penney, K. L., Kote-Jarai, Z., et al. (2018). Large-scale transcriptome-wide association study identifies new prostate cancer risk regions. Nat. Commun. 9:4079. doi: 10.1038/s41467-018-06302-1
Marin, B., Boumédiene, F., Logroscino, G., Couratier, P., Babron, M.-C., Leutenegger, A. L., et al. (2017). Variation in worldwide incidence of amyotrophic lateral sclerosis: a meta-analysis. Int. J. Epidemiol. 46, 57–74. doi: 10.1093/ije/dyw061
McLaughlin, R. L., Kenna, K. P., Vajda, A., Bede, P., Elamin, M., Cronin, S., et al. (2015). A second-generation Irish genome-wide association study for amyotrophic lateral sclerosis. Neurobiol. Aging 36, 1221.e7–1221.e13. doi: 10.1016/j.neurobiolaging.2014.08.030
McMahon, A., Malangone, C., Suveges, D., Sollis, E., Cunningham, F., Riat, H. S., et al. (2019). The NHGRI-EBI GWAS Catalog of published genome-wide association studies, targeted arrays and summary statistics 2019. Nucl. Acids Res. 47, D1005–D1012. doi: 10.1093/nar/gky1120
Mehta, P., Kaye, W., Raymond, J., Punjani, R., Larson, T., Cohen, J., et al. (2018). Prevalence of amyotrophic lateral sclerosis - United States, 2015. Morb. Mortal. Weekly Rep. 67, 1285–1289. doi: 10.15585/mmwr.mm6746a1
Nica, A. C., Montgomery, S. B., Dimas, A. S., Stranger, B. E., Beazley, C., Barroso, I., et al. (2010). Candidate causal regulatory effects by integration of expression QTLs with complex trait genetic associations. PLoS Genet. 6:e1000895. doi: 10.1371/journal.pgen.1000895
Nicolae, D. L., Gamazon, E., Zhang, W., Duan, S., Dolan, M. E., and Cox, N. J. (2010). Trait-associated SNPs are more likely to be eQTLs: annotation to enhance discovery from GWAS. PLoS Genet. 6:e1000888. doi: 10.1371/journal.pgen.1000888
Nicolas, A., Kenna, K. P., Renton, A. E., Ticozzi, N., Faghri, F., Chia, R., et al. (2018). Genome-wide Analyses Identify KIF5A as a Novel ALS Gene. Neuron 97, 1268–1283. doi: 10.1016/j.neuron.2018.02.027
O’Reilly, ÉJ., Wang, H., Weisskopf, M. G., Fitzgerald, K. C., Falcone, G., McCullough, M. L., et al. (2013). Premorbid body mass index and risk of amyotrophic lateral sclerosis. Amyotr. Lateral Sclerosis Front. Degen. 14, 205–211. doi: 10.3109/21678421.2012.735240
Orlowski, J., and Grinstein, S. (2004). Diversity of the mammalian sodium/proton exchanger SLC9 gene family. Pflugers Arch. 447, 549–565. doi: 10.1007/s00424-003-1110-3
Paganoni, S., Deng, J., Jaffa, M., Cudkowicz, M. E., and Wills, A.-M. (2011). Body mass index, not dyslipidemia, is an independent predictor of survival in amyotrophic lateral sclerosis. Muscle Nerve 44, 20–24. doi: 10.1002/mus.22114
Pasaniuc, B., and Price, A. L. (2016). Dissecting the genetics of complex traits using summary association statistics. Nat. Rev. Genet. 18, 117–127. doi: 10.1038/nrg.2016.142
Peter, R. S., Rosenbohm, A., Dupuis, L., Brehme, T., Kassubek, J., Rothenbacher, D., et al. (2017). Life course body mass index and risk and prognosis of amyotrophic lateral sclerosis: results from the ALS registry Swabia. Eur. J. Epidemiol. 32, 901–908. doi: 10.1007/s10654-017-0318-z
Poole, W., Gibbs, D. L., Shmulevich, I., Bernard, B., and Knijnenburg, T. A. (2016). Combining dependent P-values with an empirical adaptation of Brown’s method. Bioinformatics 32, i430–i436. doi: 10.1093/bioinformatics/btw438
Reich-Slotky, R., Andrews, J., Cheng, B., Buchsbaum, R., Levy, D., Kaufmann, P., et al. (2013). Body mass index (BMI) as predictor of ALSFRS-R score decline in ALS patients. Amyotr. Lateral Sclerosis Front. Degen. 14, 212–216. doi: 10.3109/21678421.2013.770028
Renton, A. E. (2011). A hexanucleotide repeat expansion in C9orf72 is the cause of chromosome 9p21-linked ALS-FTD. Neuron 72, 257–268.
Ryan, M., Heverin, M., McLaughlin, R. L., and Hardiman, O. (2019). Lifetime risk and heritability of amyotrophic lateral sclerosis. JAMA Neurol. 76, 1367–1374. doi: 10.1001/jamaneurol.2019.2044
Schymick, J. C., Scholz, S. W., Fung, H.-C., Britton, A., Arepalli, S., Gibbs, J. R., et al. (2007). Genome-wide genotyping in amyotrophic lateral sclerosis and neurologically normal controls: first stage analysis and public release of data. Lancet Neurol. 6, 322–328. doi: 10.1016/s1474-4422(07)70037-6
Shatunov, A., Mok, K., Newhouse, S., Weale, M. E., Smith, B., Vance, C., et al. (2010). Chromosome 9p21 in sporadic amyotrophic lateral sclerosis in the UK and seven other countries: a genome-wide association study. Lancet Neurol. 9, 986–994.
Shimizu, T., Nagaoka, U., Nakayama, Y., Kawata, A., Kugimoto, C., Kuroiwa, Y., et al. (2012). Reduction rate of body mass index predicts prognosis for survival in amyotrophic lateral sclerosis: a multicenter study in Japan. Amyotr. Lateral Sclerosis 13, 363–366. doi: 10.3109/17482968.2012.678366
Shungin, D., Winkler, T. W., Croteau-Chonka, D. C., Ferreira, T., Lockes, A. E., Maegi, R., et al. (2015). New genetic loci link adipose and insulin biology to body fat distribution. Nature 518, 187–196. doi: 10.1038/nature14132
Sonawane, A. R., Platig, J., Fagny, M., Chen, C.-Y., Paulson, J. N., Lopes-Ramos, C. M., et al. (2017). Understanding tissue-specific gene regulation. Cell Rep. 21, 1077–1088. doi: 10.1016/j.celrep.2017.10.001
Stuart, P. E., Nair, R. P., Ellinghaus, E., Ding, J., Tejasvi, T., and Gudjonsson, J. E. (2010). Genome-wide association analysis identifies three psoriasis susceptibility loci. Nat. Genet. 42, 1000–1004. doi: 10.1038/ng.693
Sun, R., Hui, S., Bader, G. D., Lin, X., and Kraft, P. (2019). Powerful gene set analysis in GWAS with the Generalized Berk-Jones statistic. PLoS Genet. 15:e1007530. doi: 10.1371/journal.pgen.1007530
Sun, R., and Lin, X. (2019). Genetic variant set-based tests using the generalized berk–jones statistic with application to a genome-wide association study of breast cancer. J. Am. Statist. Assoc. 115, 1079–1091. doi: 10.1080/01621459.2019.1660170
Tachmazidou, I., Suveges, D., Min, J. L., Ritchie, G. R. S., Steinberg, J., Walter, K., et al. (2017). Whole-genome sequencing coupled to imputation discovers genetic signals for anthropometric traits. Am. J. Hum. Genet. 100, 865–884. doi: 10.1016/j.ajhg.2017.04.014
The 1000 Genomes Project Consortium (2015). A global reference for human genetic variation. Nature 526, 68–74. doi: 10.1038/nature15393
The Alsgen Consortium (2013). Age of onset of amyotrophic lateral sclerosis is modulated by a locus on 1p34. 1. Neurobiol. Aging 34:e357.
Van Es, M. A., Van Vught, P. W., Blauw, H. M., Franke, L., Saris, C. G., Andersen, P. M., et al. (2007). ITPR2 as a susceptibility gene in sporadic amyotrophic lateral sclerosis: a genome-wide association study. Lancet Neurol. 6, 869–877.
Van Es, M. A., Van Vught, P. W., Blauw, H. M., Franke, L., Saris, C. G., Van Den Bosch, L., et al. (2008). Genetic variation in DPP6 is associated with susceptibility to amyotrophic lateral sclerosis. Nature Genetics 40, 29–31.
van Es, M. A., Veldink, J. H., Saris, C. G. J., Blauw, H. M., van Vught, P. W. J., Birve, A., et al. (2009). Genome-wide association study identifies 19p13.3 (UNC13A) and 9p21.2 as susceptibility loci for sporadic amyotrophic lateral sclerosis. Nat. Genet. 41, 1083–1087.
van Rheenen, W., Shatunov, A., Dekker, A. M., McLaughlin, R. L., Diekstra, F. P., Pulit, S. L., et al. (2016). Genome-wide association analyses identify new risk variants and the genetic architecture of amyotrophic lateral sclerosis. Nat. Genet. 48, 1043–1048. doi: 10.1038/ng.3622
Vazquez, M. C. (2008). Incidence and prevalence of amyotrophic lateral sclerosis in Uruguay: a population-based study. Neuroepidemiology 30, 105–111. doi: 10.1159/000120023
Wainberg, M., Sinnott-Armstrong, N., Mancuso, N., Barbeira, A. N., Knowles, D. A., Golan, D., et al. (2019). Opportunities and challenges for transcriptome-wide association studies. Nat. Genet. 51, 592–599. doi: 10.1038/s41588-019-0385-z
Wang, J., Thingholm, L. B., Skieceviciene, J., Rausch, P., Kummen, M., Hov, J. R., et al. (2016). Genome-wide association analysis identifies variation in vitamin D receptor and other host factors influencing the gut microbiota. Nat. Genet. 48, 1396–1406. doi: 10.1038/ng.3695
Wang, J., and Wynshaw-Boris, A. (2004). The canonical Wnt pathway in early mammalian embryogenesis and stem cell maintenance/differentiation. Curr. Opin. Genet. Dev. 14, 533–539. doi: 10.1016/j.gde.2004.07.013
Wen, X., Lee, Y., Luca, F., and Pique-Regi, R. (2016). Efficient integrative Multi-SNP association analysis via deterministic approximation of posteriors. Am. J. Hum. Genet. 98, 1114–1129. doi: 10.1016/j.ajhg.2016.03.029
Wood, A. R., Esko, T., Yang, J., Vedantam, S., Pers, T. H., Gustafsson, S., et al. (2014). Defining the role of common variation in the genomic and biological architecture of adult human height. Nat. Genet. 46, 1173–1186.
Wu, L., Shi, W., Long, J., Guo, X., Michailidou, K., Beesley, J., et al. (2018). A transcriptome-wide association study of 229,000 women identifies new candidate susceptibility genes for breast cancer. Nat. Genet. 50, 968–978. doi: 10.1038/s41588-018-0132-x
Wu, L., Wang, J., Cai, Q., Cavazos, T. B., Emami, N. C., Long, J., et al. (2019). Identification of novel susceptibility loci and genes for prostate cancer risk: a transcriptome-wide association study in over 140,000 european descendants. Cancer Res. 79, 3192–3204. doi: 10.1158/0008-5472.can-18-3536
Xie, T., Deng, L., Mei, P., Zhou, Y., Wang, B., Zhang, J., et al. (2014). A genome-wide association study combining pathway analysis for typical sporadic amyotrophic lateral sclerosis in Chinese Han populations. Neurobiol. Aging 35, 1778.e9–1778.e23.
Zeng, P., Wang, T., Zheng, J., and Zhou, X. (2019a). Causal association of type 2 diabetes with amyotrophic lateral sclerosis: new evidence from Mendelian randomization using GWAS summary statistics. BMC Medicine 17:225. doi: 10.1186/s12916-019-1448-9
Zeng, P., Yu, X., and Xu, H. (2019b). Association between premorbid body mass index and amyotrophic lateral sclerosis: causal inference through genetic approaches. Front. Neurol. 10:543. doi: 10.3389/fneur.2019.00543
Zeng, P., Zhao, Y., Qian, C., Zhang, L., Zhang, R., Gou, J., et al. (2015). Statistical analysis for genome-wide association study. J. Biomed. Res. 29, 285–297. doi: 10.7555/jbr.29.20140007
Zeng, P., and Zhou, X. (2017). Non-parametric genetic prediction of complex traits with latent Dirichlet process regression models. Nat. Commun. 8:456. doi: 10.1038/s41467-017-00470-2
Keywords: transcriptome-wide association study (TWAS), amyotrophic lateral sclerosis (ALS), genome-wide association studies (GWAS), brain tissue, type I error control
Citation: Xiao L, Yuan Z, Jin S, Wang T, Huang S and Zeng P (2020) Multiple-Tissue Integrative Transcriptome-Wide Association Studies Discovered New Genes Associated With Amyotrophic Lateral Sclerosis. Front. Genet. 11:587243. doi: 10.3389/fgene.2020.587243
Received: 25 July 2020; Accepted: 26 October 2020;
Published: 20 November 2020.
Edited by:
Yang Zhao, Nanjing Medical University, ChinaCopyright © 2020 Xiao, Yuan, Jin, Wang, Huang and Zeng. This is an open-access article distributed under the terms of the Creative Commons Attribution License (CC BY). The use, distribution or reproduction in other forums is permitted, provided the original author(s) and the copyright owner(s) are credited and that the original publication in this journal is cited, in accordance with accepted academic practice. No use, distribution or reproduction is permitted which does not comply with these terms.
*Correspondence: Ping Zeng, enBzdGF0QHh6aG11LmVkdS5jbg==
†These authors share first authorship