 Shuang Xia1†
 Xiaoyong Li
 Zena Huang
- 1Department of Cardiology, Guangdong Cardiovascular Institute, Guangdong Provincial Key Laboratory of Coronary Heart Disease Prevention, Guangdong Provincial People’s Hospital, Guangdong Academy of Medical Sciences, Guangzhou, China
- 2Department of Nephrology, The Third Affiliated Hospital of Guangzhou Medical University, Guangzhou, China
- 3Department of Medical Genetics, School of Basic Medical Sciences, Southern Medical University, Guangzhou, China
- 4Department of Surgery, The Third Affiliated Hospital of Guangzhou Medical University, Guangzhou, China
- 5Department of Pathology, The Third Affiliated Hospital of Guangzhou Medical University, Guangzhou, China
- 6Department of General Medicine, Guangdong Provincial Geriatrics Institute, Guangdong Provincial People’s Hospital, Guangdong Academy of Medical Sciences, Guangzhou, China
Background: Papillary renal cell carcinoma (PRCC), although the second-most common type of renal cell carcinoma, still lacks specific biomarkers for diagnosis, treatment, and prognosis. TopBP1-interacting checkpoint and replication regulator (TICRR) is a DNA replication initiation regulator upregulated in various cancers. We aimed to evaluate the role of TICRR in PRCC tumorigenesis and prognosis.
Methods: Based on the Kidney Renal Papillary cell carcinoma Project (KIRP) on The Cancer Genome Atlas (TCGA) database, we determined the expression of TICRR using the Wilcoxon rank sum test. The biological functions of TICRR were evaluated using the Metascape database and Gene Set Enrichment Analysis (GSEA). The association between TICRR and immune cell infiltration was investigated by single sample GSEA. Logistic analysis was applied to study the correlation between TICRR expression and clinicopathological characteristics. Finally, Cox regression analysis, Kaplan–Meier analysis, and nomograms were used to determine the predictive value of TICRR on clinical outcomes in PRCC patients.
Results: TICRR expression was significantly elevated in PRCC tumors (P < 0.001). Functional annotation indicated enrichment with negative regulation of cell division, cell cycle, and corresponding pathways in the high TICRR expression phenotype. High TICRR expression in PRCC was associated with female sex, younger age, and worse clinical stages. Cox regression analysis revealed that TICRR was a risk factor for overall survival [hazard ratio (HR): 2.80, P = 0.002], progression-free interval (HR: 2.86, P < 0.001), and disease-specific survival (HR: 7.03, P < 0.001), especially in patients with male sex, age below 60 years, clinical stages II–IV and clinical T stage T1–T2.
Conclusion: Increased TICRR expression in PRCC might play a role in tumorigenesis by regulating the cell cycle and has prognostic value for clinical outcomes.
Introduction
Renal cell carcinoma (RCC) is a life-threatening cancer worldwide, ranking sixth among the most commonly diagnosed cancers in men and 10th in women (Siegel et al., 2018). Papillary RCC (PRCC) is the second most common type of RCC, accounting for nearly 18% of RCC (Srigley et al., 2013). In addition, it is the most common histological subtype in pediatric RCC and has been reported in 18% of dialysis patients (Morabito et al., 2010). However, diagnosis, treatment, and prognosis of PRCC are now mostly based on histological features, whose subtyping remains unsatisfactory (Fernandes and Lopes, 2015). Recent studies have introduced several novel biomarkers for RCC diagnosis and prognosis, such as urine aquaporin-1 and perilipin-2 (Farber et al., 2017; Cao et al., 2018; Song et al., 2019). However, these studies were mostly carried out in patients with rough RCC or clear cell RCC, lacking specific result for PRCC. An immunohistochemical marker α-methylacyl coenzyme A racemase was used for identifying PRCC (Alshenawy, 2015), while it was unrelated with PRCC prognosis. Several mutated genes were proved to be associated with PRCC diagnosis and treatment, including MET, NF2, SETD2, and Nrf2 pathway genes. Unfortunately, they were not sensitive enough, as they were only found in about 10 to 15% of PRCC (Akhtar et al., 2019). Therefore, it is urgent to search for a more convincing and suitable biomarker for PRCC.
TopBP1-interacting checkpoint and replication regulator (TICRR), also known as Treslin, is a critical DNA replication initiation regulator mediated by cyclin-dependent kinases and a DNA damage checkpoint (Boos et al., 2011). Biologically, TICRR regulates the cell cycle via determining S-phase progression from the expression level to epigenetic control (Charrasse et al., 2017; Maya-Mendoza et al., 2018) and thus promotes DNA replication. Overexpression of TICRR has been observed in several cancers, such as breast invasive carcinoma and liver hepatocellular carcinoma (Yu et al., 2019). It is associated with tumorigenesis, resistance to chemotherapy, and poor clinical outcomes (Yu et al., 2019). However, the potential role and underlying mechanism of TICRR in PRCC is not clear yet.
Using the RNA sequencing and clinical data of PRCC patients retrieved from The Cancer Genome Atlas (TCGA) database, we carried out a bioinformatics analysis to identify the significance of TICRR in PRCC tumorigenesis and prognosis. We observed an overexpression of TICRR in PRCC and investigated its potential role in PRCC tumorigenesis. Next, we performed a correlation analysis between TICRR and several clinicopathological characteristics. Finally, we identified the diagnostic and prognostic values of TICRR. This study provides novel insight into the underlying mechanisms of PRCC tumorigenesis and revealed TICRR as a potential diagnostic and prognostic biomarker in PRCC.
Materials and Methods
Data Processing and Ethics Statement
We downloaded high-throughput sequencing RNA data [fragments per kilobase per million (FPKM) format] and corresponding clinicopathological information from the Kidney Renal Papillary cell carcinoma Project (KIRP) on the TCGA database1. Excluding three patients with incomplete clinicopathological information, a total of 288 PRCC patients were enrolled. RNA sequencing data were transformed from FPKM format to transcripts per million reads for this study. As the TCGA database is open to the public under specific guidelines, it confirms that all written informed consents were obtained before data collection.
Differentially Expressed Genes in Papillary Renal Cell Carcinoma Tumors
In total, 288 PRCC patients were separated into high- and low-TICRR expression groups according to TICRR median value. The R package “DESeq2”(Love et al., 2014) was used to identify differentially expressed genes (DEGs) between the two groups by a two-tailed hypothetical test based on the negative binomial generalized linear models, where the log-fold change larger than 1.5 and an adjusted P-value less than 0.05 were set as thresholds. The R packages “pheatmap” (Kolde, 2019) and “EnhancedVolcano” (Blighe, 2019) were applied to present results as heatmaps and volcano plots.
Functional Annotation of TICRR-Associated Differentially Expressed Genes in Papillary Renal Cell Carcinoma Tumors
The identified DEGs were then processed for functional annotation on the Metascape database2 and online tool (Zhou et al., 2019). Minimum counts larger than 3, enrichment factors larger than 1.5, and a P-value less than 0.01 were set as analysis thresholds. Further, the R package “clusterProfiler” (Yu et al., 2012) was utilized for the Gene Set Enrichment Analysis (GSEA) (Subramanian et al., 2005) of the DEGs in the two groups. In GSEA, C2: curated gene sets from MSigDB collections were selected as reference gene sets. In total, 404 clusters were identified; clusters with a false discovery rate (FDR) less than 0.25 and P-value less than 0.05 were identified as significant. Protein–protein interaction (PPI) networks were investigated based on STRING database3 (Szklarczyk et al., 2019) and visualized using Cytoscape software (v3.7.1) (Shannon et al., 2003).
Association of TICRR and Immune Cell Infiltration in Papillary Renal Cell Carcinoma Tumors
First, we used the single sample GSEA method from the R package “GSVA” (Hänzelmann et al., 2013) to present infiltration enrichment of 24 common immune cells, including dendritic cells (DCs), immature DCs (iDCs), activated DCs (aDCs), plasmacytoid DCs (pDCs), T cells, T helper (Th) cells, type 1 Th cells (Th1), type 2 Th cells (Th2), type 17 Th cells (Th17), regulatory T cells (Treg), T gamma delta (Tgd), T central memory (Tcm), T effector memory (Tem), T follicular helper (Tfh), CD8 + T cells, B cells, neutrophils, macrophages, cytotoxic cells, mast cells, eosinophils, natural killer (NK) cells, NK 56- cells, and NK 56 + cells. Next, the association between TICRR expression and immune cell infiltration was evaluated by Spearman’s analysis, and the infiltration levels of immune cells were compared for high- and low-TICRR expression groups by Wilcoxon rank sum test.
Correlation Analyses for TICRR Expression and Clinicopathological Characteristics of Papillary Renal Cell Carcinoma Patients
Clinicopathological characteristics were compared for high- and low-TICRR expression groups using the Wilcoxon rank sum test (continuous variables) or Pearson’s chi-square test (rank variables). The correlation between TICRR expression and clinicopathological characteristics was evaluated by logistic analysis.
Clinical Significance of TICRR Expression in Papillary Renal Cell Carcinoma
TICRR expression was compared between PRCC tumors and pericarcinous tissues by receiver operating characteristic (ROC) analysis to test the predictive value of TICRR for PRCC diagnosis. Information on PRCC patients’ clinical outcome was obtained from a published study (Liu et al., 2018), including overall survival, progression-free interval, and disease-specific survival. Kaplan–Meier (K-M) analysis, univariate, and multivariate Cox regression analysis were employed for prognosis analysis. The R package “randomForest” (Svetnik et al., 2003) was used for random forest regression. The R package “rms” (Harrell, 2020) was used to construct nomograms and calibration plots. The R package “forestplot” (Max Gordon, 2020) was applied for the clinicopathological subgroup study. The above statistical analyses were all carried out by R (v4.0.0), with P-values less than 0.05 considered significant.
Results
Expression Profiles of TICRR in Different Cancers and Related Differentially Expressed Genes in Papillary Renal Cell Carcinoma
Based on TCGA database, we determined the expression of TICRR mRNA in different cancers. As shown in Figure 1A, among 33 cancer types, the TICRR was significantly highly expressed in 19 cancers, especially in tumors located in gastrointestinal and urogenital tracts. More specifically, TICRR expression was much higher in PRCC tumors than in pericarcinous tissues (P < 0.001, Figure 1B). Interestingly, in none of the investigated cancer profiles was TICRR expression significantly decreased.
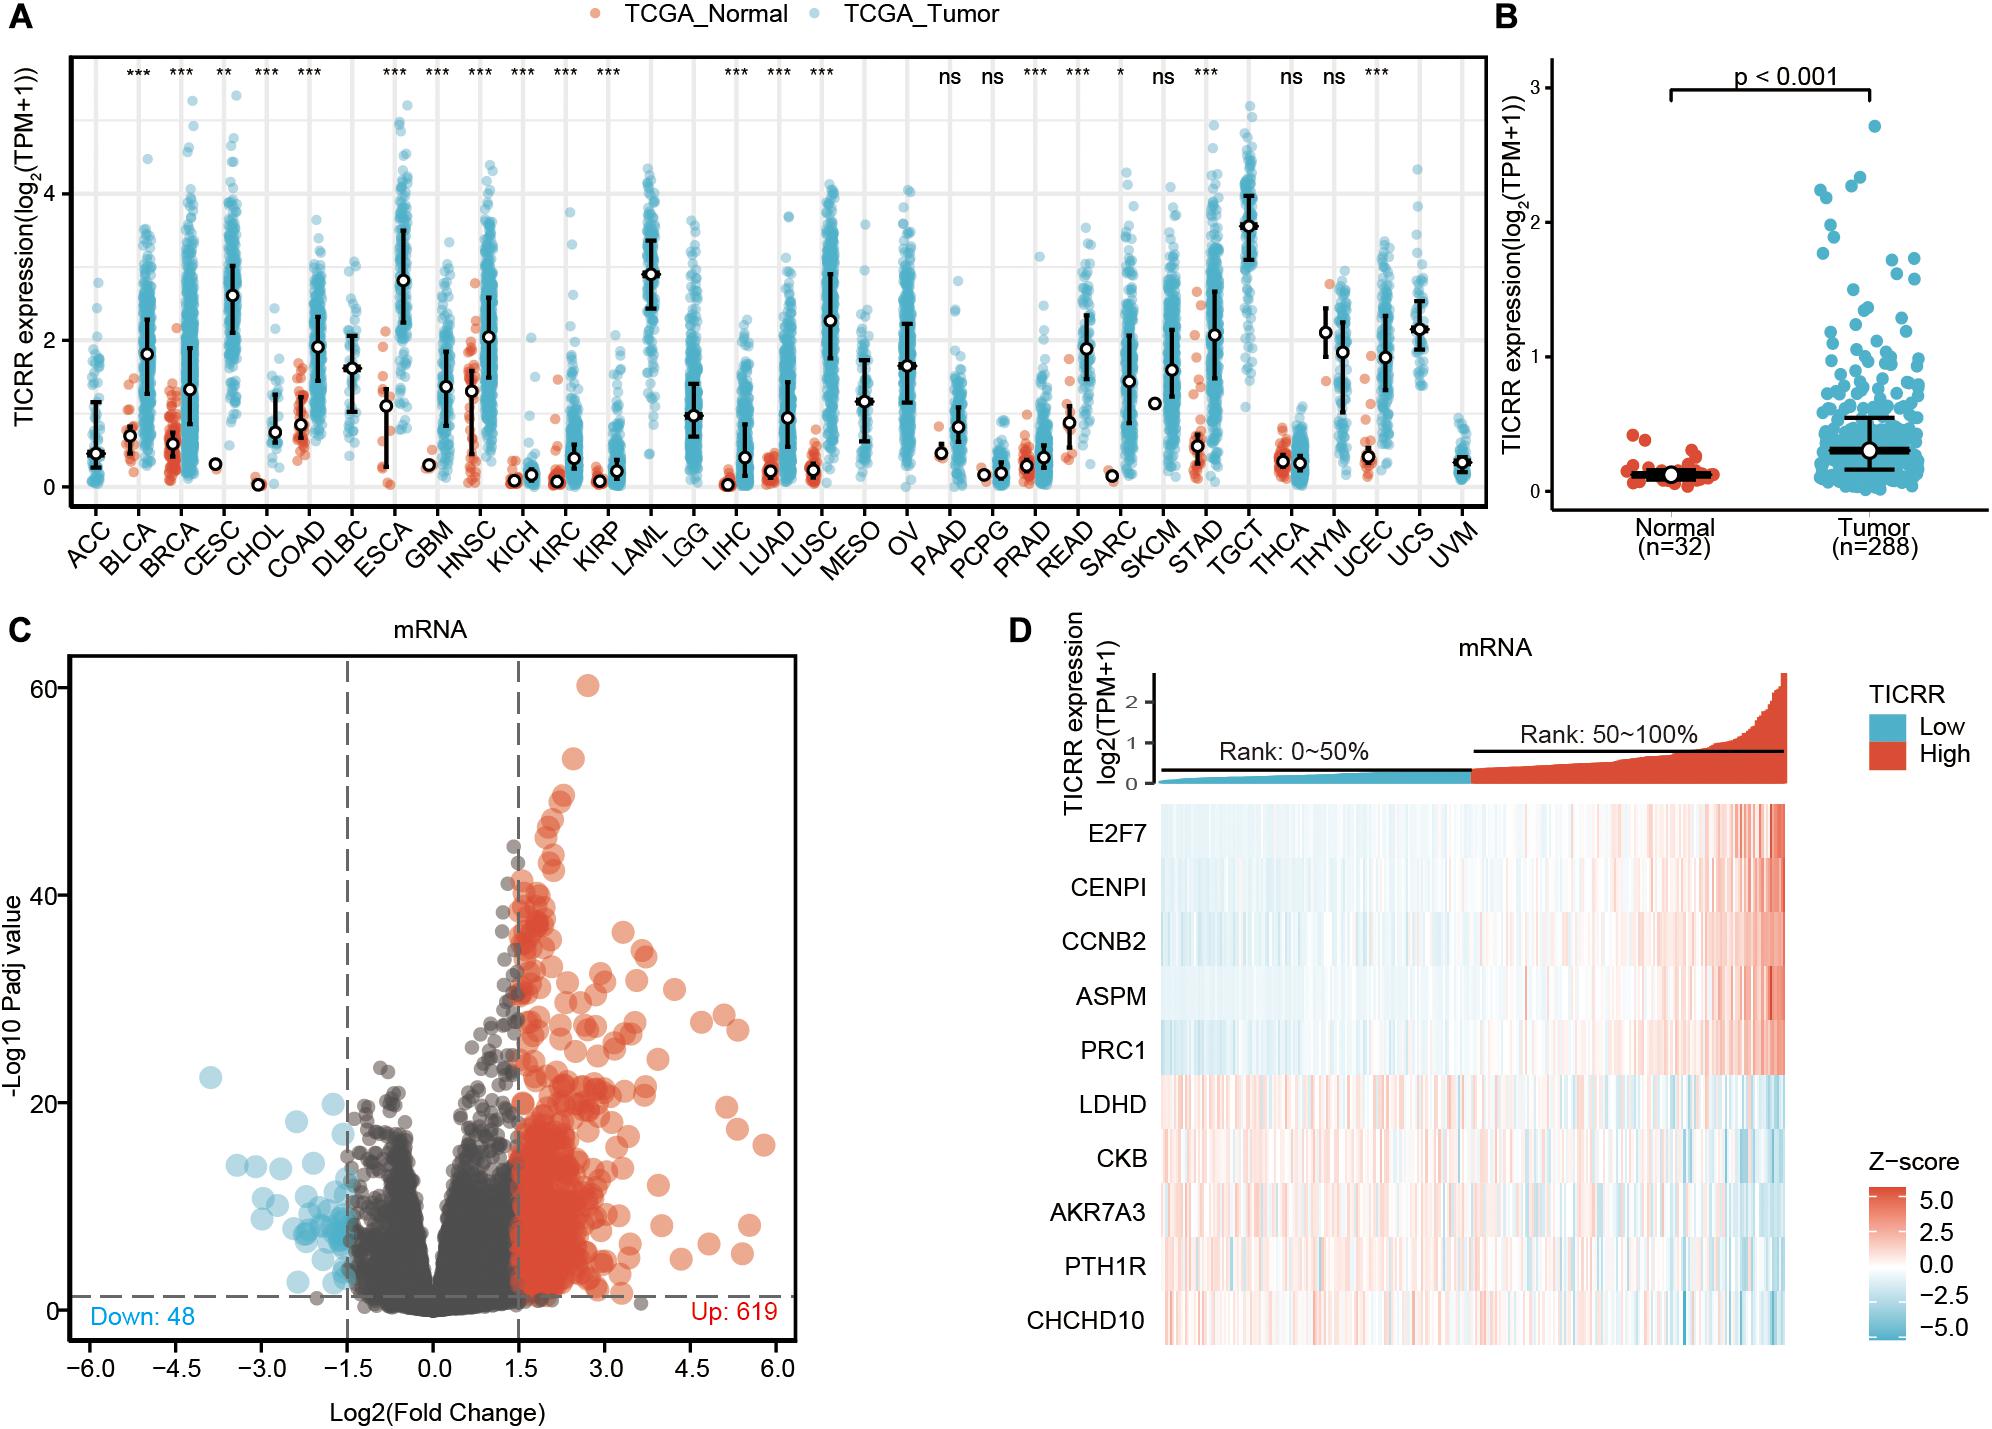
Figure 1. Differential mRNA expression profiles in papillary renal cell carcinoma (PRCC) patients stratified by TICRR levels. (A) The comparison of TICRR expression between tumor and pericarcinous tissue in different types of cancers based on TCGA database. ns, P ≥ 0.05; *P < 0.05; **P < 0.01; ***P < 0.001. (B) TICRR expression is higher in PRCC tumors than pericarcinous tissue. Based on the median TICRR level, 288 PRCC patients from The Cancer Genome Atlas –Kidney Renal Papillary cell carcinoma Project (TCGA-KIRP) were stratified into high- and low-TICRR expression groups. Shown are expression profiles of mRNA in two groups; and data are presented by volcano plots (C) and heatmaps (D).
Based on the median TICRR expression in PRCC tumors, 288 PRCC patients were stratified into two groups, high- and low-TICRR expression groups. We next compared mRNA, miRNA, and lncRNA expression between the two groups. Finally, 667 mRNAs (619 upregulated and 48 downregulated, Figure 1C), 2 miRNAs (2 upregulated, Supplementary Figure 1), and 341 lncRNAs (316 upregulated and 25 downregulated, Supplementary Figure 1) were recognized as DEGs (absolute value of fold change >1.5, P < 0.05) in the high-TICRR group. Representative DEGs were also illustrated by heatmaps (Figure 1D and Supplementary Figure 1).
Functional Annotation of TICRR-Associated Differentially Expressed Genes in Papillary Renal Cell Carcinoma Tumors
In order to evaluate the function of TICRR-associated DEGs in PRCC patients, the software “Metascape” was applied. As presented in Figures 2A–C and Supplementary Table 1, we found that several PRCC-related pathways were enriched, including epithelial cell differentiation (GO: 0030855, P < 0.001, enrichment factor = 2.654, FDR = 0.037), urogenital system development (GO: 0001655, P < 0.001, enrichment factor = 3.448, FDR = 0.141), and negative regulation of cell division (GO: 0051782, P = 0.001, enrichment factor = 15.802, FDR = 0.266). Moreover, the GSEA showed TICRR-associated DEGs significantly enriched in cell proliferation related clusters (Figures 2D–K), such as mitotic cell cycle [normalized enrichment score (NES) = 1.510, adjusted P = 0.022, FDR = 0.018], cyclin events during G2 to M transition (NES = 1.912, adjusted P = 0.022, FDR = 0.018), mitotic metaphase and anaphase (NES = 1.524, adjusted P = 0.022, FDR = 0.018), and mitotic prometaphase (NES = 1.576, adjusted P = 0.022, FDR = 0.018). TICRR-associated DEGs were also enriched in cancer pathways (Figure 2L), especially the cell cycle-related Hedgehog signaling pathway (Figure 2M). More interestingly, TICRR-associated DEGs were associated with the activity of the MET gene (Figures 2N,O), which is usually involved in oncogenesis. We also constructed a PPI network for DEGs (Supplementary Figure 2), where the TICRR served as the hub gene related to another eight genes.
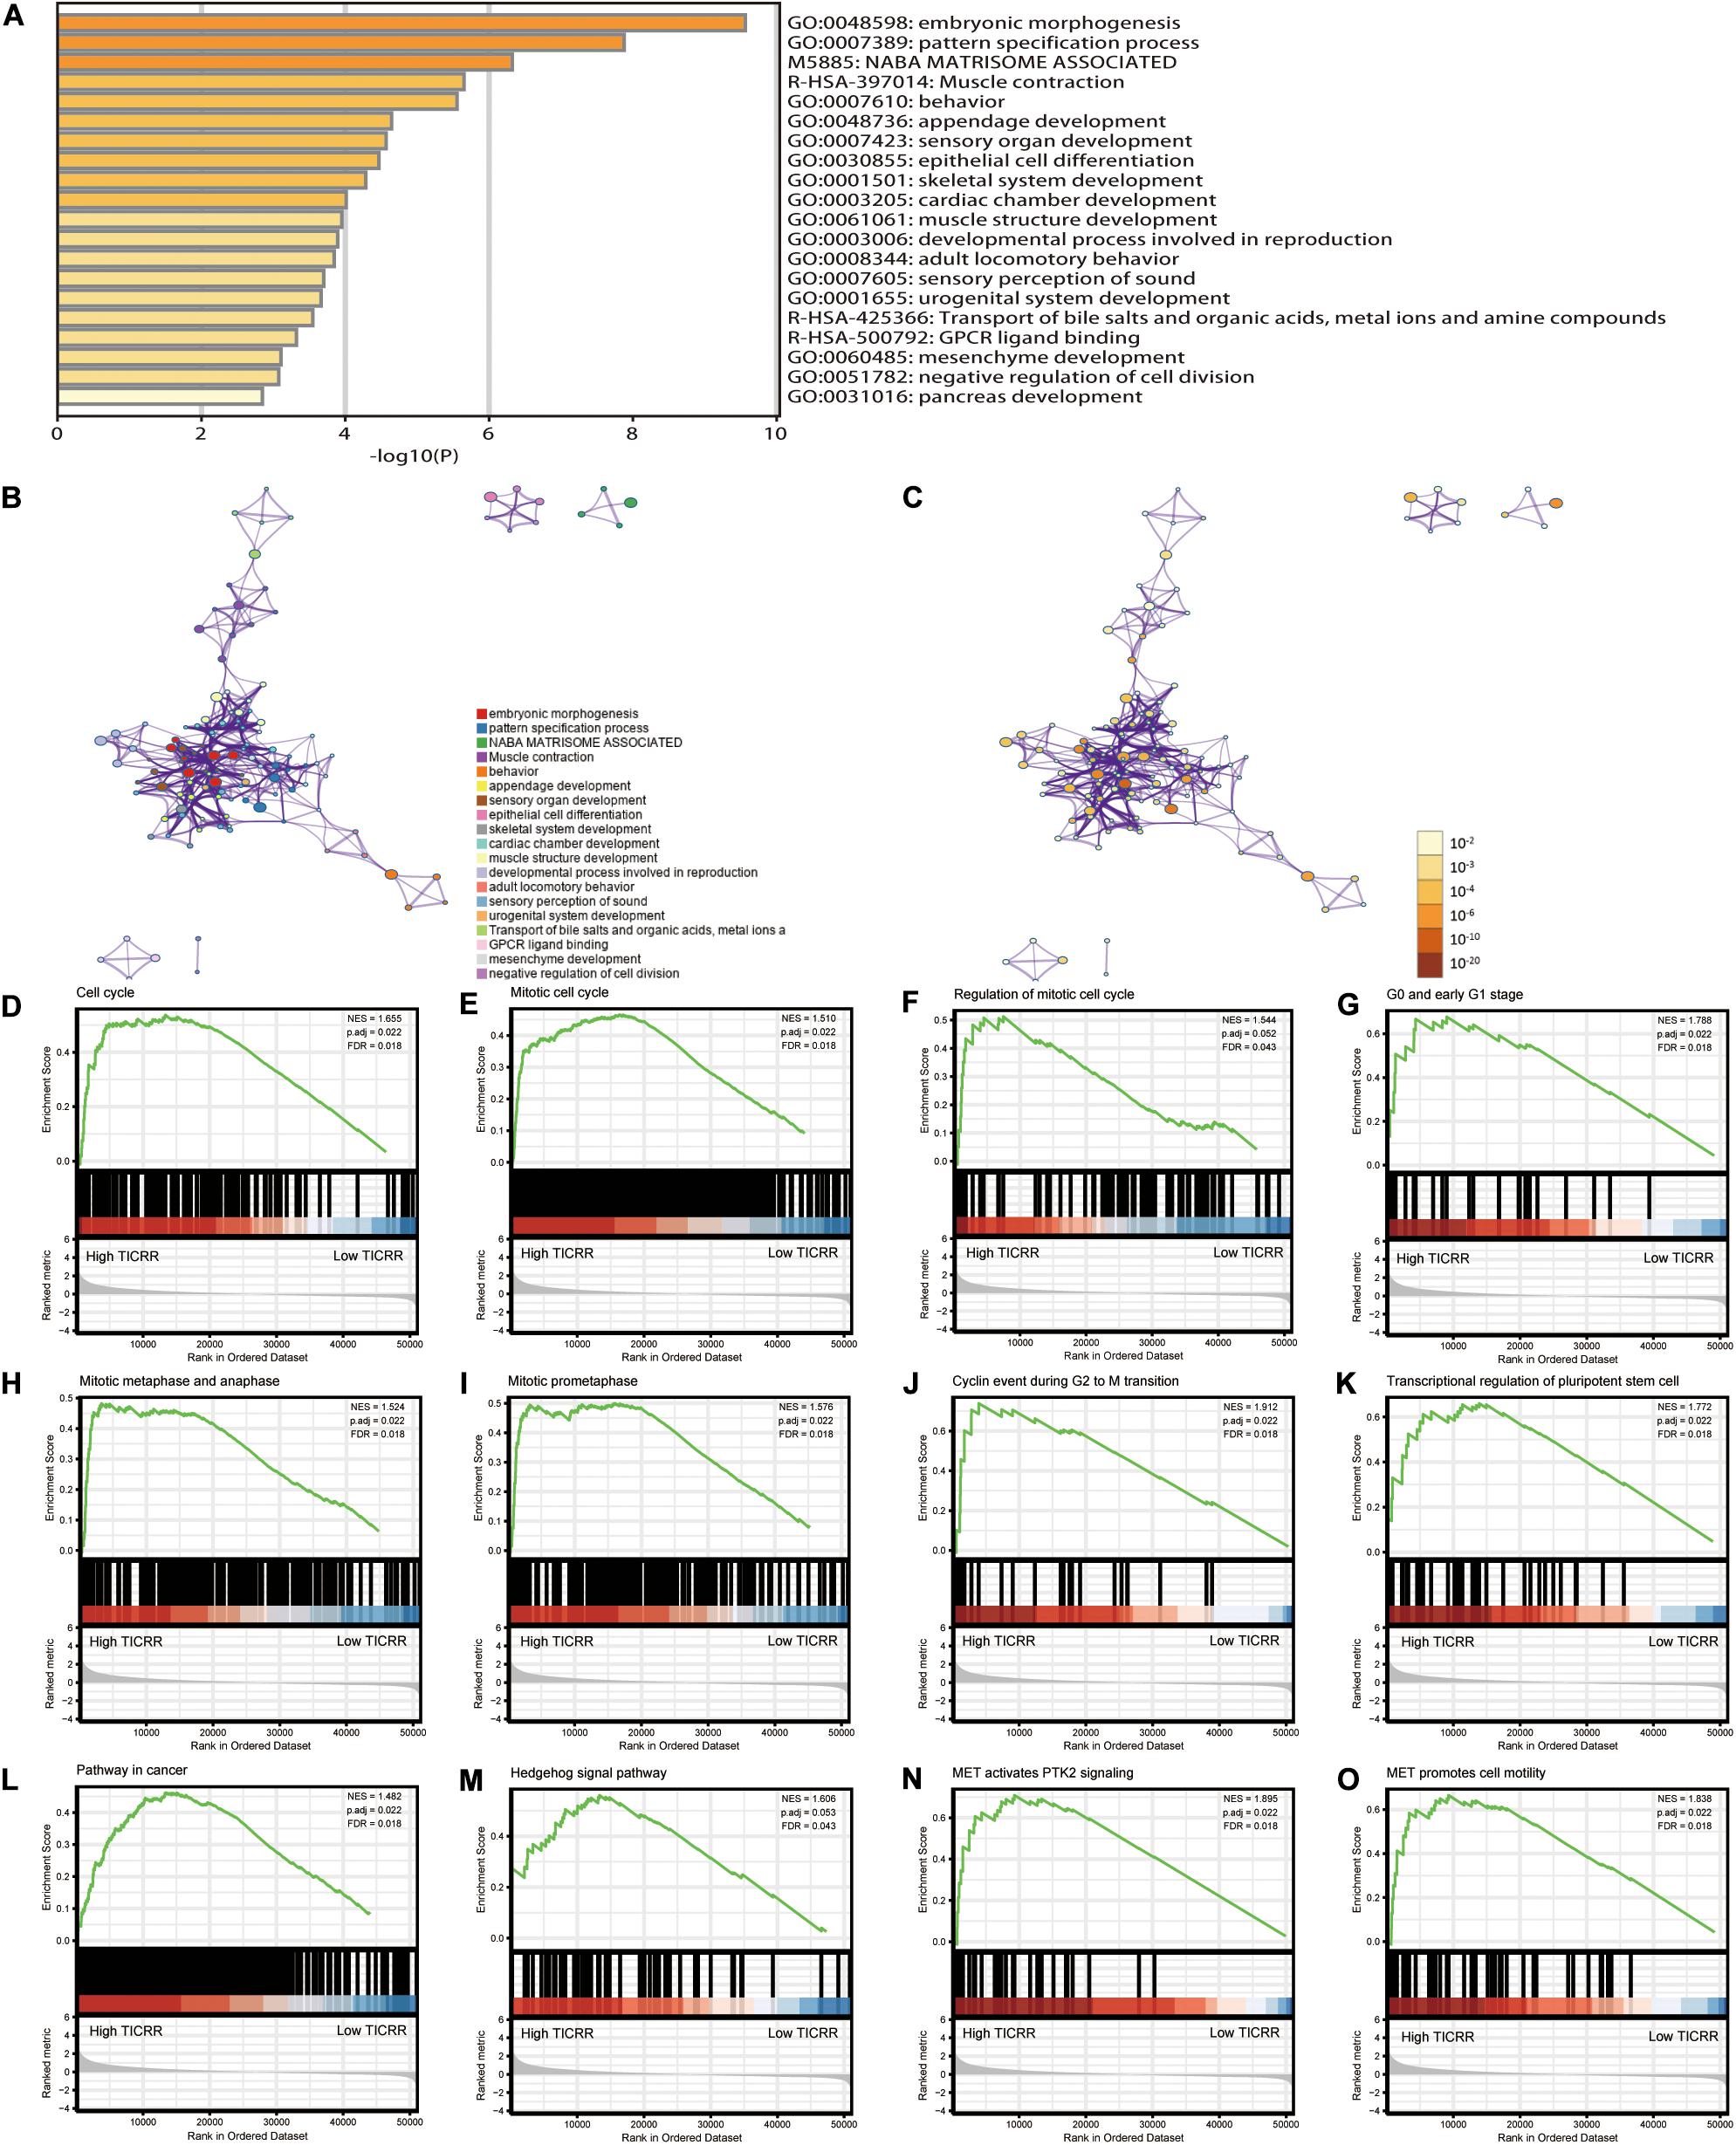
Figure 2. Functional annotation of differentially expressed genes (DEGs) in papillary renal cell carcinoma (PRCC) patients with distinct TICRR levels. According to the Metascape database, 691 differentially expressed mRNAs between high- and low-TICRR expression groups were used for functional annotation. All statistically enriched terms were identified and then hierarchically clustered into a tree (A) based on the threshold of kappa score as 0.3. Representative terms from the cluster were converted into a network layout (B). The size of a node is proportional to the number of input genes that fall into that term, and the respective color represents its cluster identity. Terms with a similarity score >0.3 are linked by an edge (the thickness of the edge represents the similarity score). The same enrichment network presents nodes colored by the P-value (C). (D–O) Representative Gene Set Enrichment Analysis of differentially expressed mRNAs between high- and low-TICRR expression groups.
Association of TICRR and Immune Cell Infiltration in Papillary Renal Cell Carcinoma Tumors
Infiltration of 24 immune cell types in PRCC was determined using the ssGSEA method first, and subsequently the association between TICRR and immune cell infiltration was investigated by Spearman’s analysis. As shown in Figure 3A, Tcm (R = 0.317, P < 0.001), Th cells (R = 0.317, P < 0.001), and NK cells (R = 0.180, P = 0.002) were all positively correlated with TICRR expression. However, DCs (R = −0.231, P < 0.001), macrophages (R = −0.233, P < 0.001), neutrophils (R = −0.235, P < 0.001), and B cells (R = −0.160, P = 0.007) showed a negative association with TICRR. More specifically, we evaluated the infiltration levels of six most relevant immune cells—DCs (Figure 3B), neutrophils (Figure 3C), macrophages (Figure 3D), Th2 cells (Figure 3E), Th cells (Figure 3F), and Tcm (Figure 3G)—in distinct TICRR groups, which showed results consistent with those in Figure 3A.
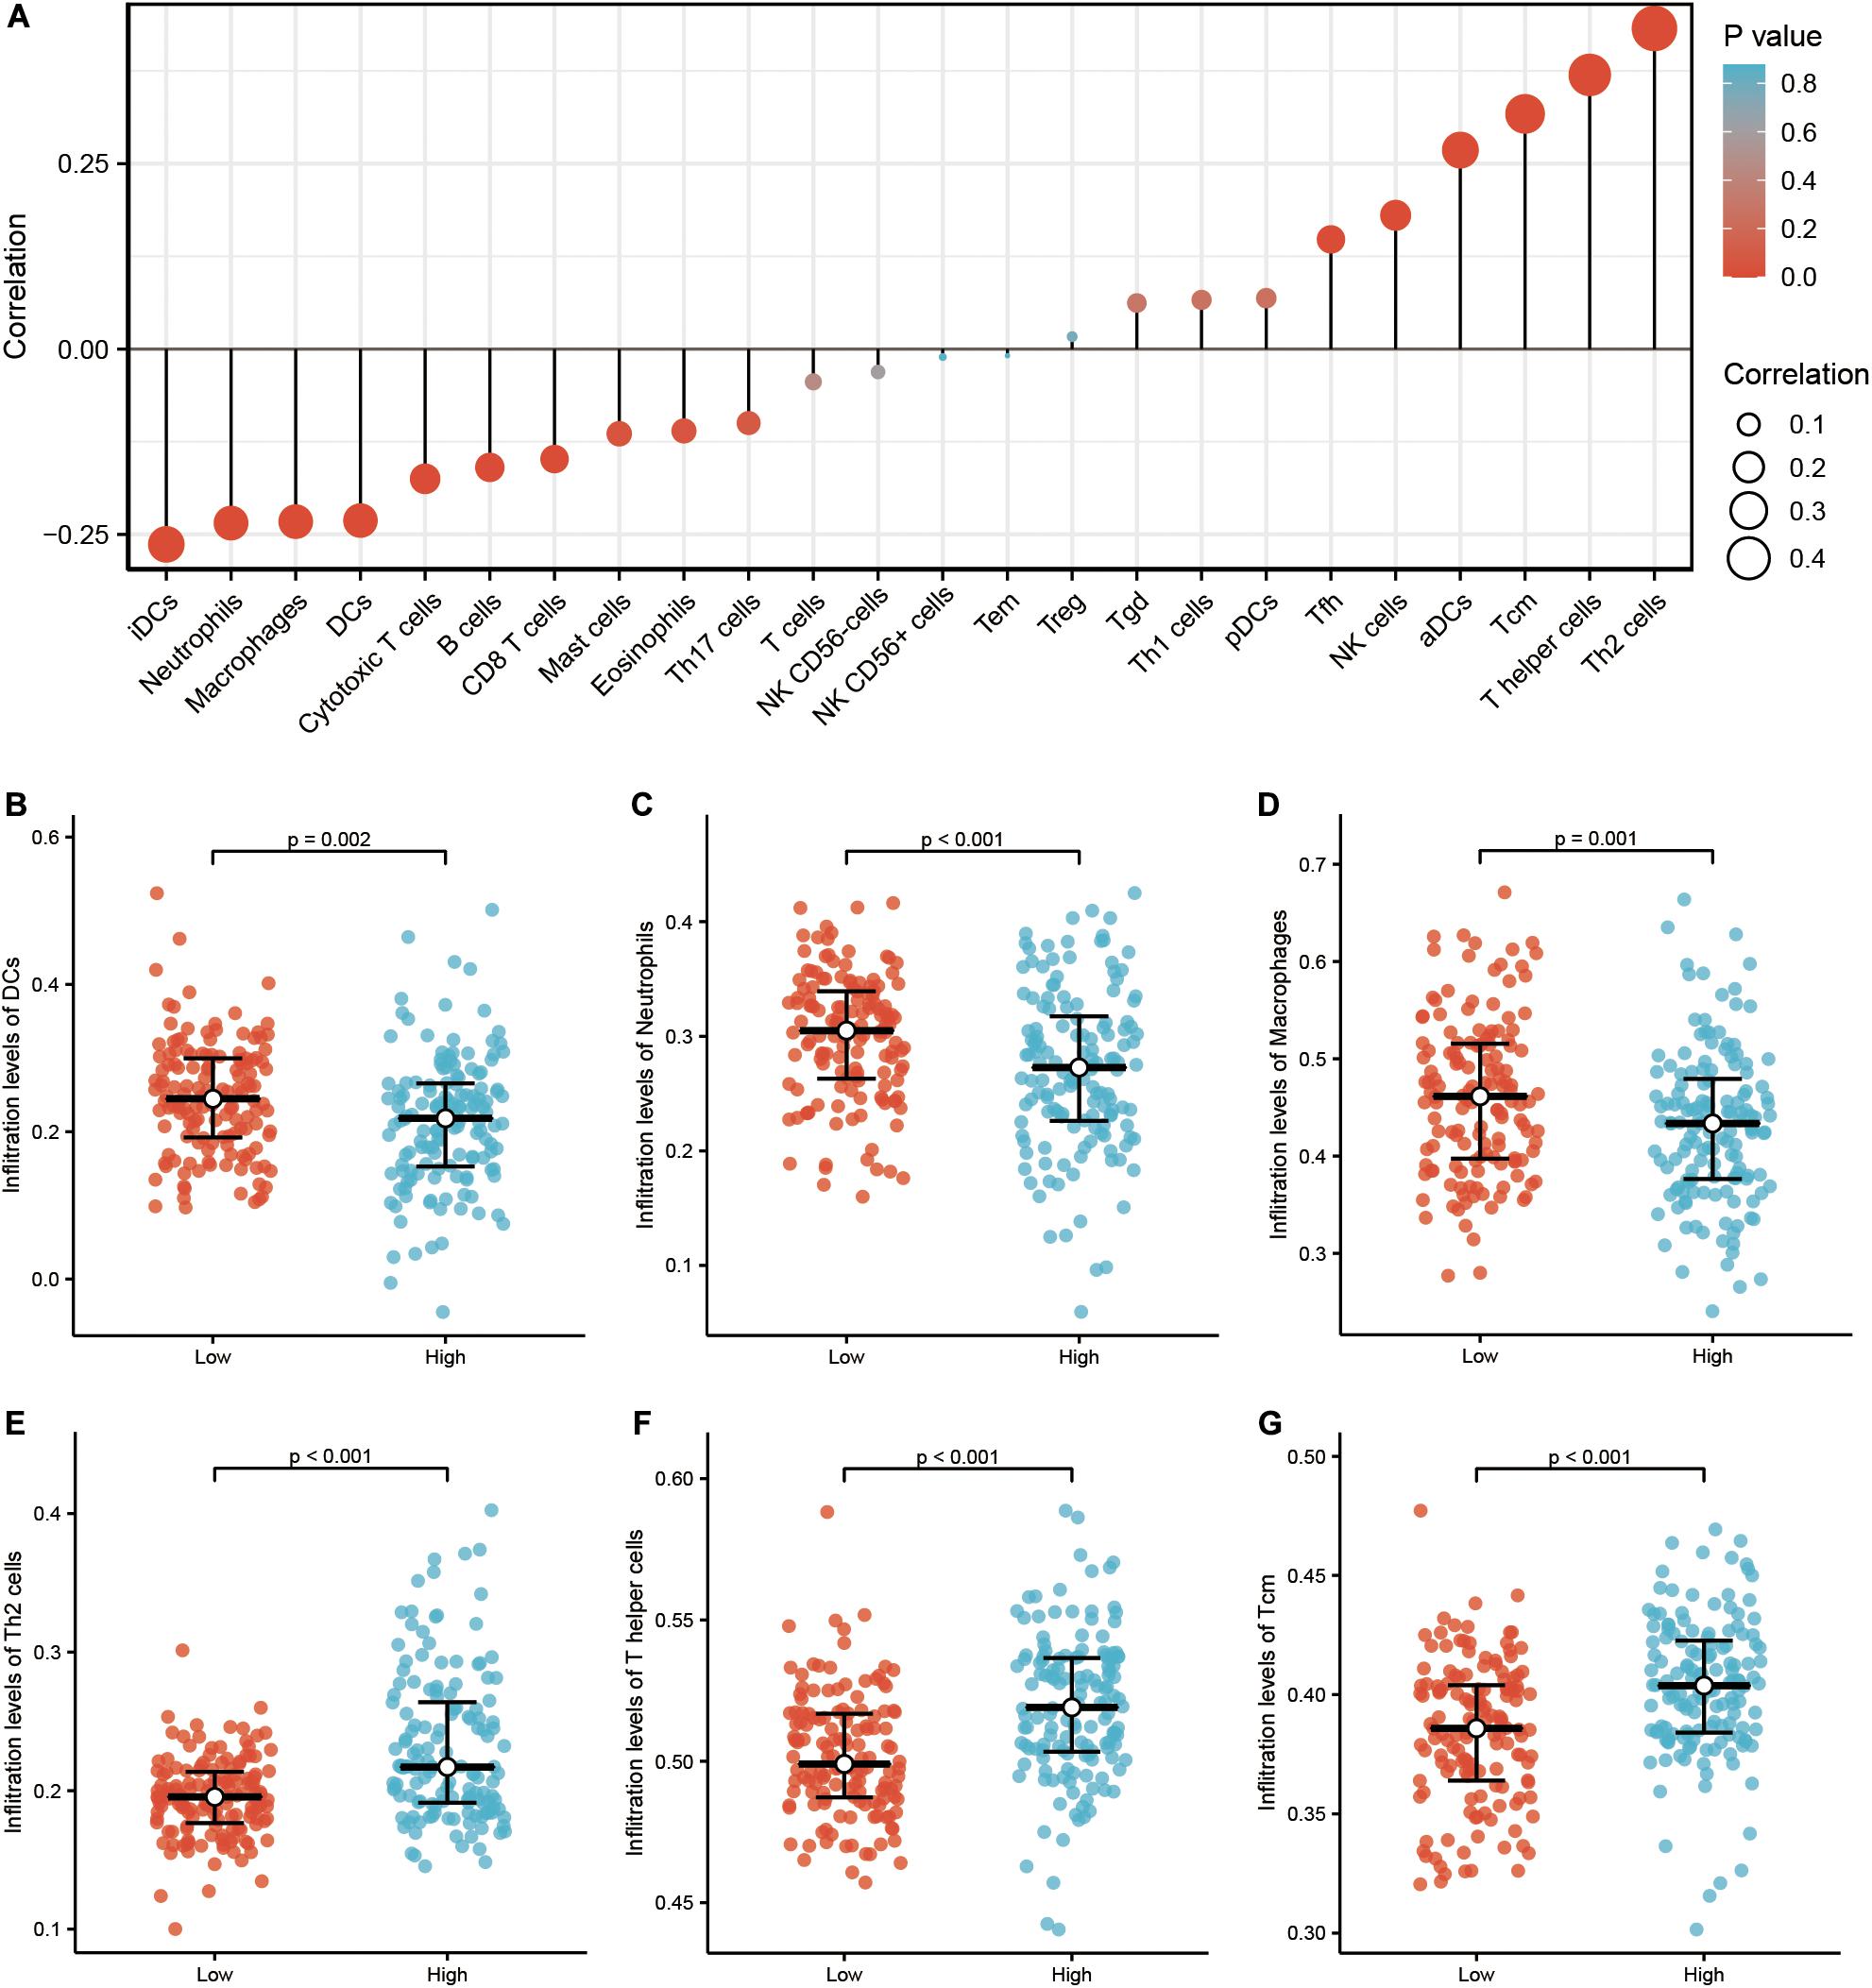
Figure 3. Correlation of immune cell infiltration and TICRR expression in papillary renal cell carcinoma (PRCC) patients. (A) Relationships among infiltration levels of 24 immune cell types and TICRR expression profiles by Spearman’s analysis. Shown is the comparison of infiltration levels of most correlated immune cells, including dendritic cells (B), neutrophils (C), macrophages (D), type 2 T helper cells (Th2) cells (E), Th cells (F), and Tcm memory cells (G) between high- and low-TICRR expression groups. DCs, dendritic cells; aDCs, activated DCs; iDCs, immature DCs; pDCs, plasmacytoid DCs; Th, T helper cells; Th1, type 1 Th cells; Th2, type 2 Th cells; Th17, type 17 Th cells; Treg, regulatory T cells; Tgd, T gamma delta; Tcm, T central memory; Tem, T effector memory; Tfh, T follicular helper; NK, natural killer.
Association of TICRR Expression and Clinicopathological Characteristics in Papillary Renal Cell Carcinoma Patients
We investigated the clinicopathological characteristics of PRCC patients with differential TICRR expression, as shown in Table 1. Compared with the low-TICRR group, patients in the high-TICRR group manifested a higher proportion of female sex, younger age, worse clinical stages, and more severe T and M stages. However, there was no significant difference in the distribution of clinical T stages, serum calcium concentration, hemoglobin level, or MET gene mutational status between two groups.
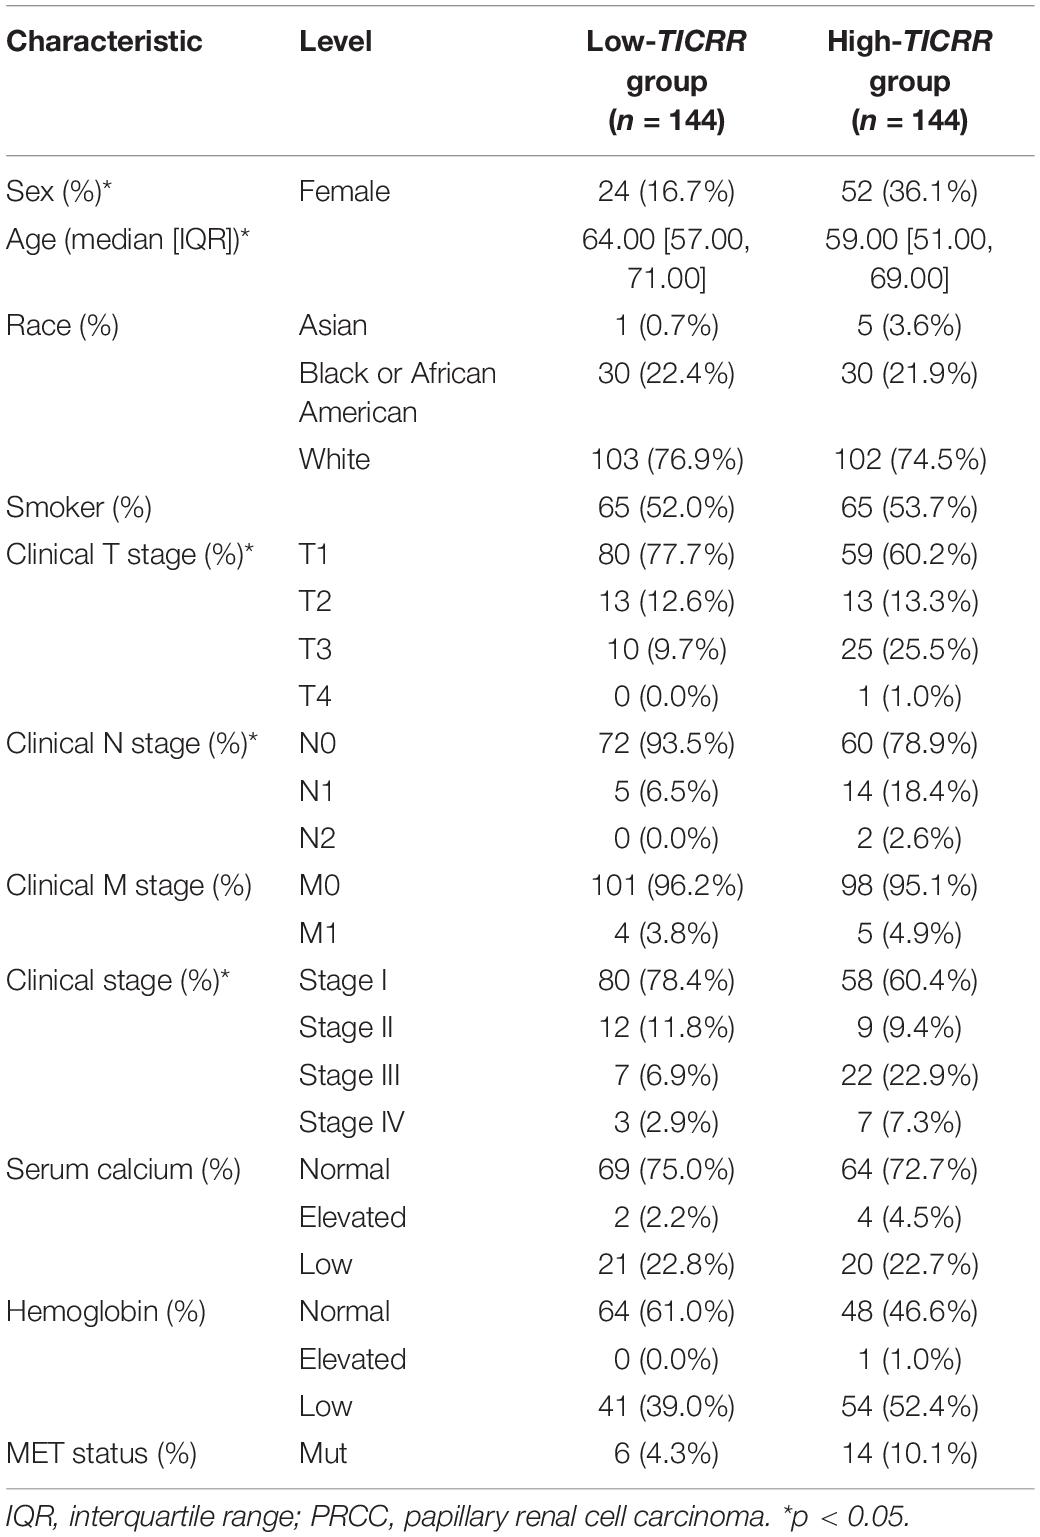
Table 1. Clinicopathological characteristics of PRCC patients with differential TICRR expression.
Further, we analyzed TICRR expression in patients with different clinicopathological characteristics. TICRR expression was significantly elevated in patients of female sex (Figure 4A), age below 60 years (Figure 4B), abnormal hemoglobin level (Figure 4C), clinical stages III and IV (Figure 4D), T stages T3 and T4 (Figure 4E), and N stages N1 and N2 (Figure 4F). As shown in Table 1, patients with different M stages (Figure 4G) and MET mutational status (Figure 4H) both shared similar TICRR expression levels. We also utilized logistics analysis to determine the correlation between TICRR expression and clinicopathological characteristics (Table 2). We found prominently positive correlations of TICRR expression with clinical stage (including T and N stages), hemoglobin, and female sex.
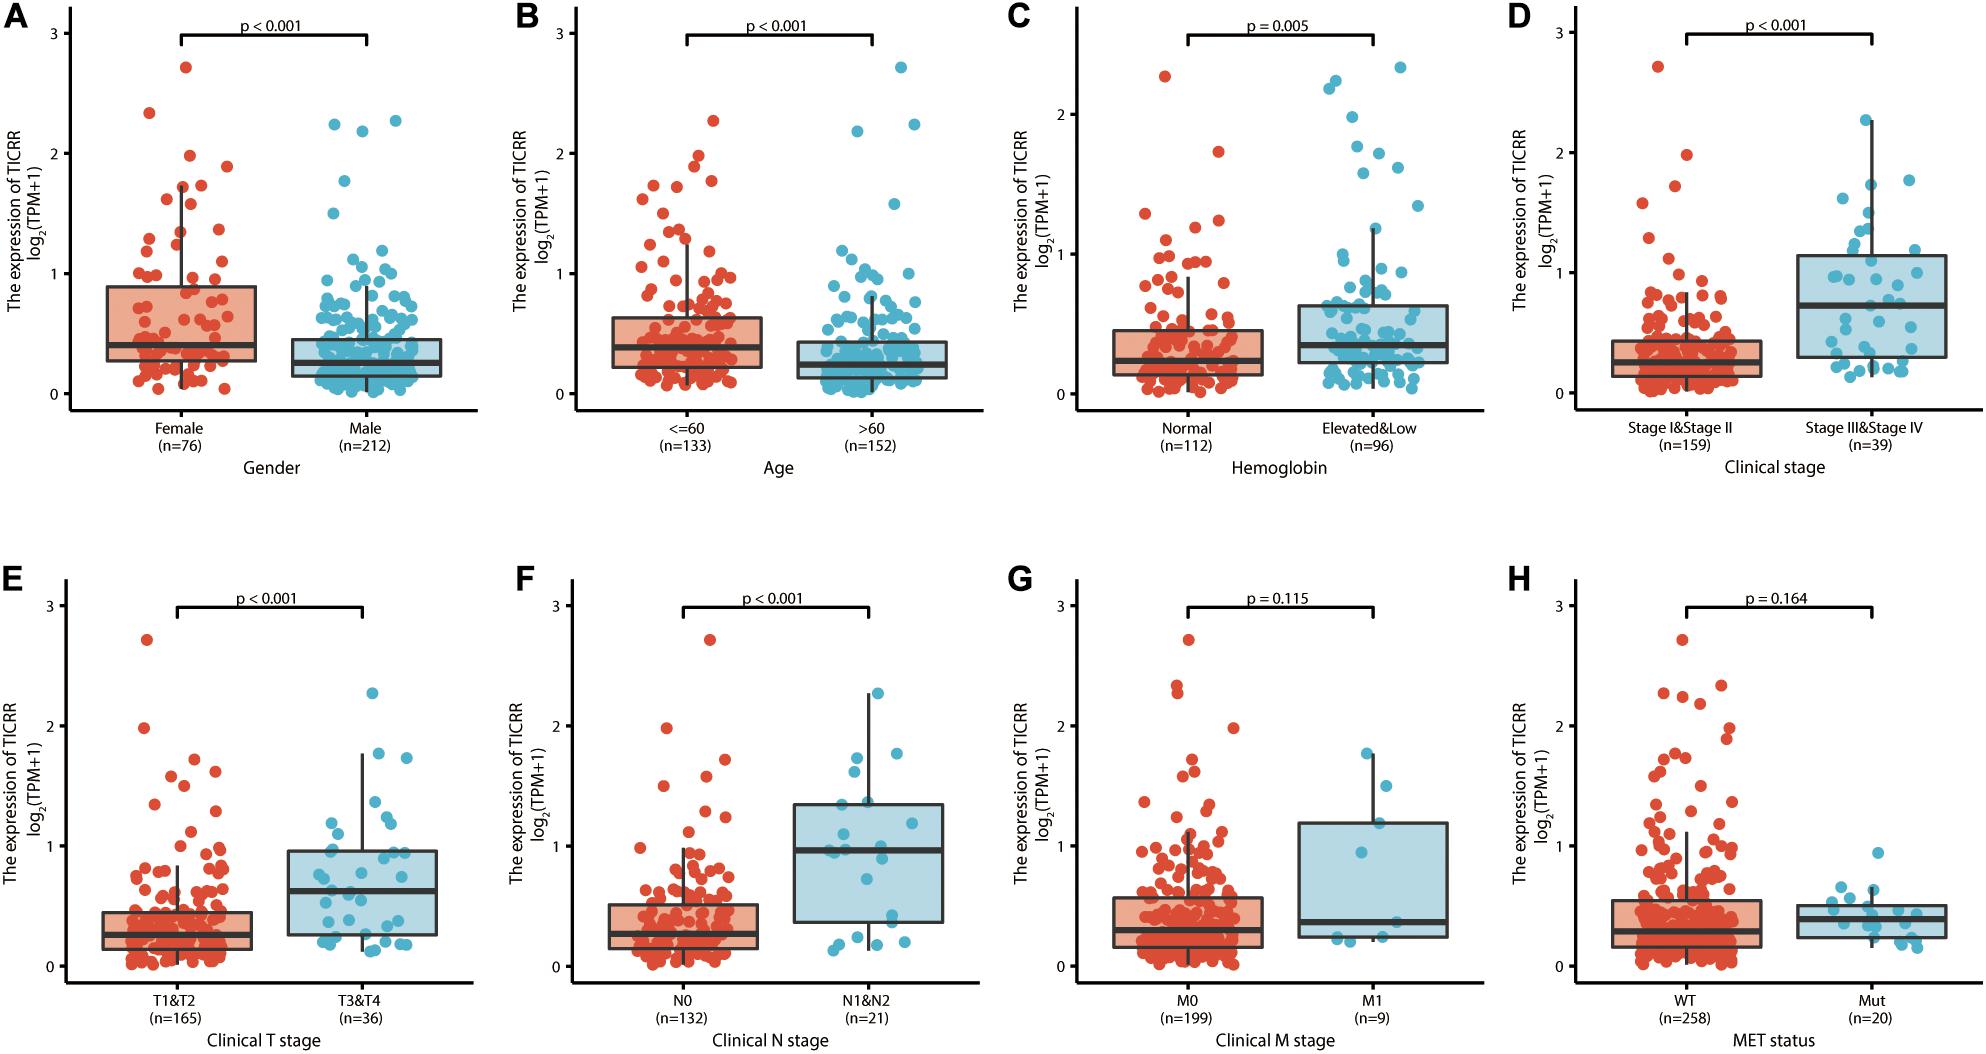
Figure 4. TICRR expression is associated with clinicopathological characteristics in papillary renal cell carcinoma (PRCC) patients. The Wilcoxon rank sum test was applied to analyze the association of TICRR expression with sex (A), age (B), hemoglobin level (C), clinical stage (D), clinical T stage (E), clinical N stage (F), clinical M stage (G), and MET status (H).
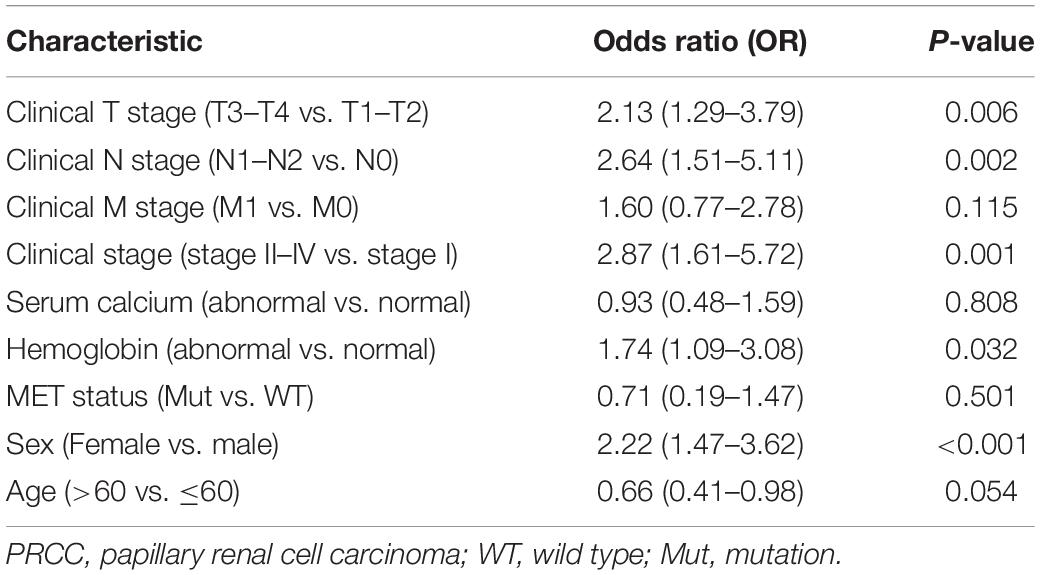
Table 2. Logistic regression analysis of association between clinicopathological characteristics and TICRR expression in PRCC patients.
Predictive Value of TICRR for Papillary Renal Cell Carcinoma Diagnosis and Prognosis
In order to explore the clinical benefits of TICRR evaluation, we used a ROC curve to demonstrate its value on discriminating PRCC diagnosis. As the area under the curve (AUC) was 0.807, TICRR showed significant high sensitivity and specificity for PRCC diagnosis (Figure 5A). Next, K-M analyses were applied to verify the prediction of TICRR on clinical outcomes. As shown in Figures 5B–D, overall survival [hazard ratio (HR): 2.80, P = 0.002), progression-free interval (HR: 2.86, P < 0.001), and disease-specific survival (HR: 7.03, P < 0.001) for high-TICRR groups were all statistically worse than those for the low-TICRR group.
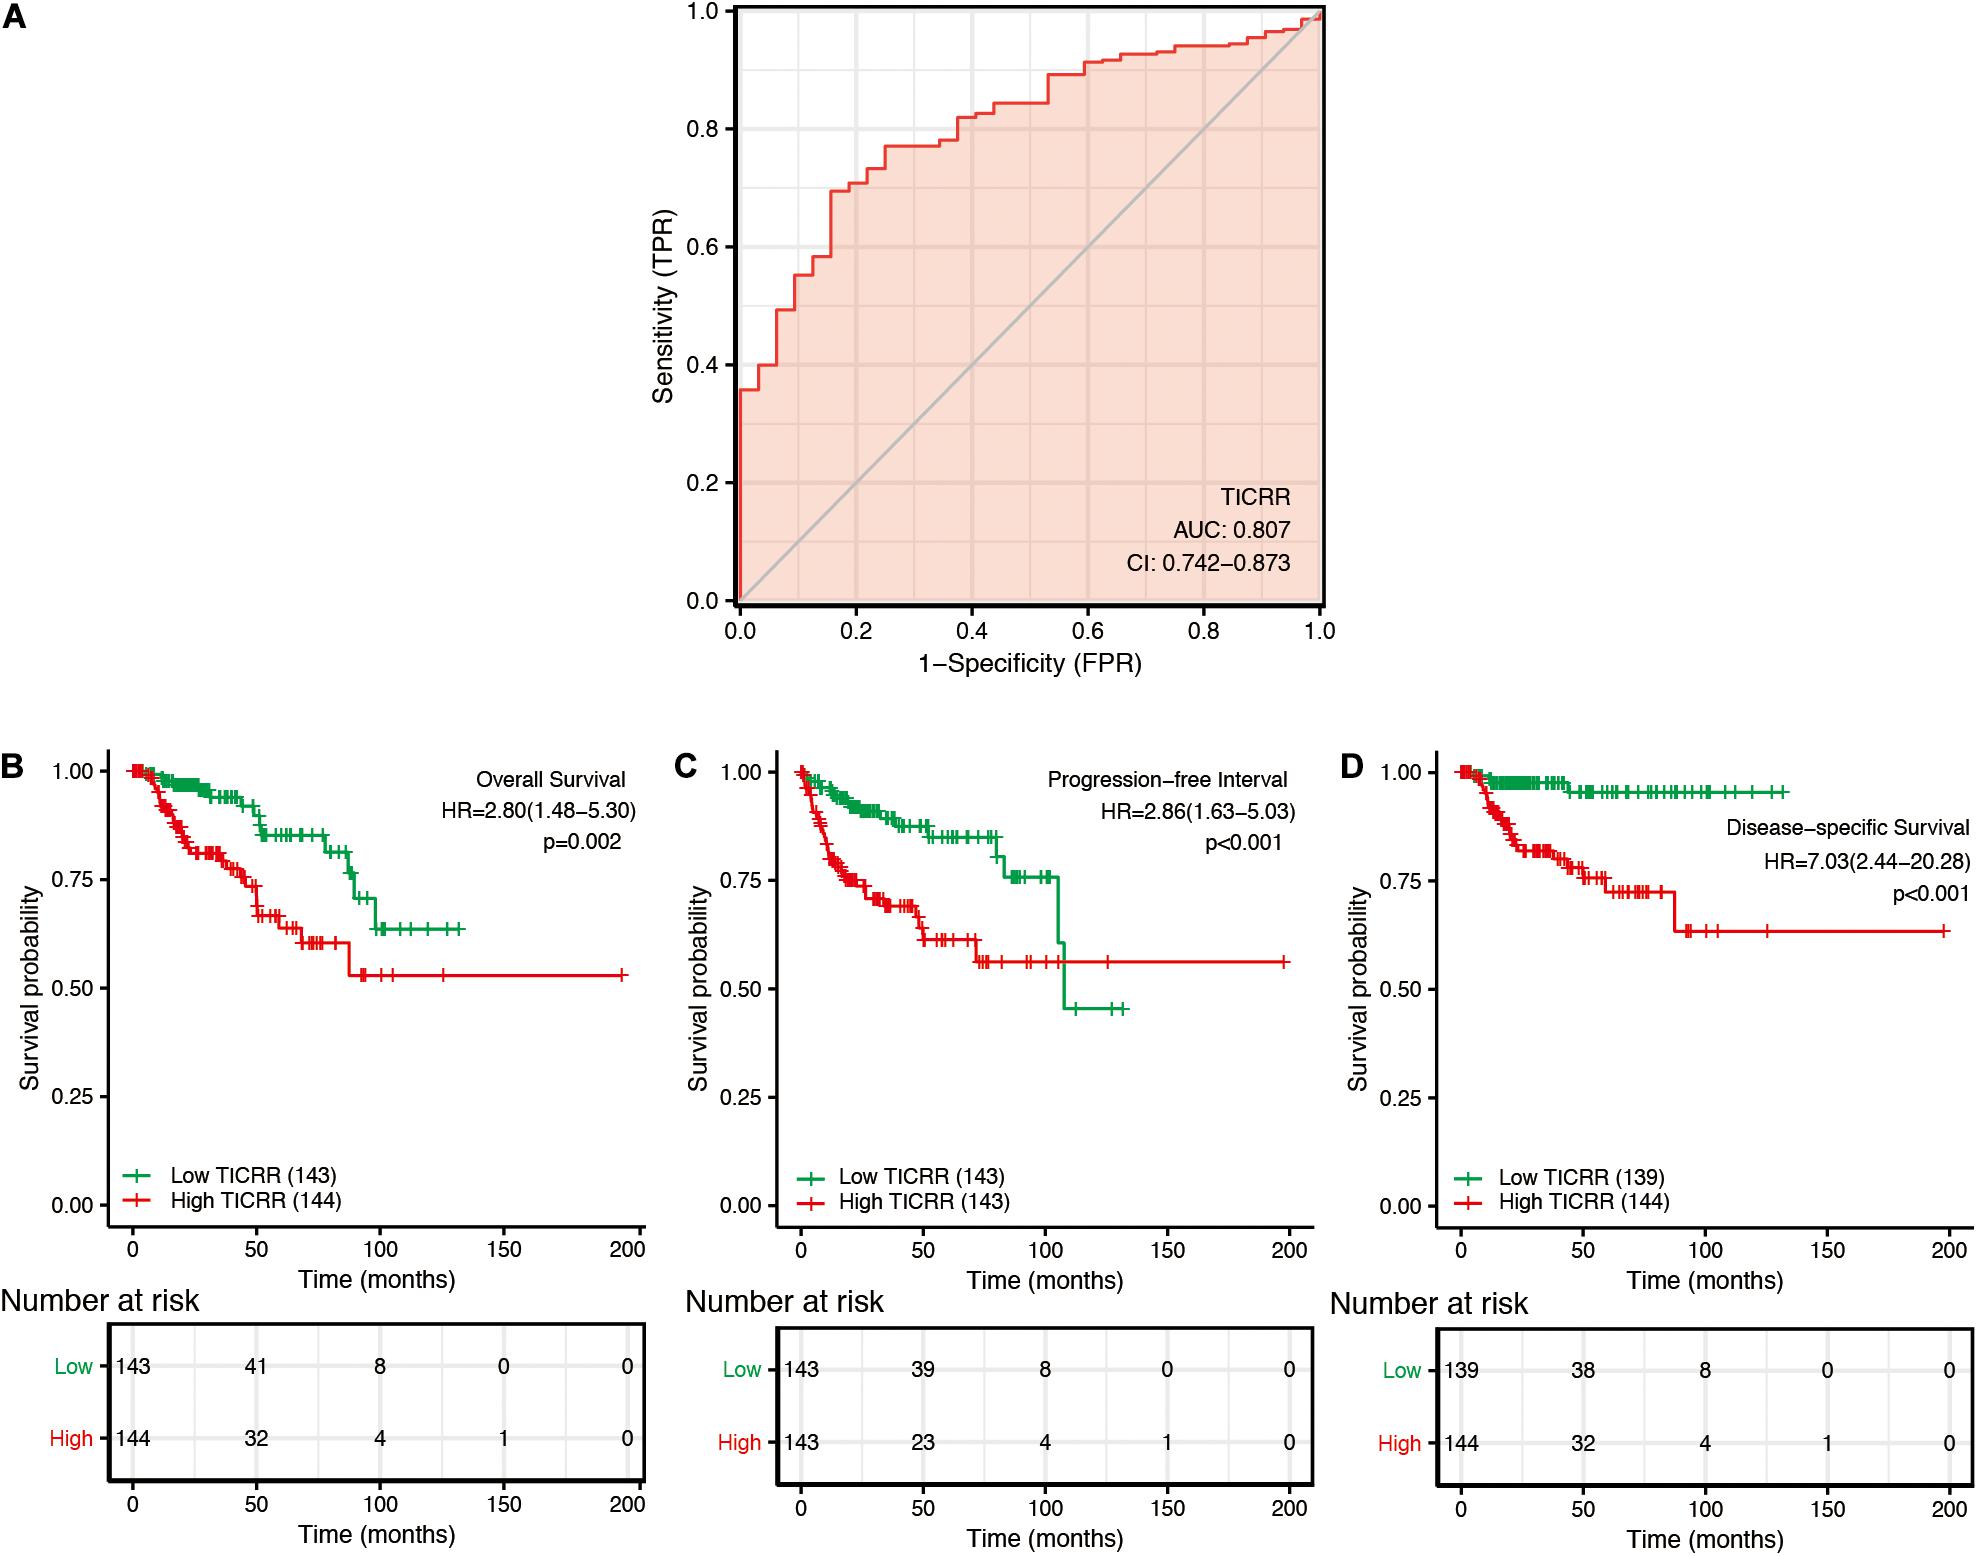
Figure 5. Predictive value of TICRR expression for diagnosis and clinical outcomes in papillary renal cell carcinoma (PRCC) patients. (A) Receiver operating characteristic (ROC) curve analysis evaluating the performance of TICRR for PRCC diagnosis. Shown are the Kaplan–Meier analyses comparing overall survival (B), progression-free interval (C), and disease-specific survival (D) between high- and low-TICRR expression groups.
Moreover, we performed a multivariate Cox regression analysis to further evaluate the predictive value of TICRR on clinical outcomes. As shown in Table 3, TICRR expression was an independent risk factor for overall survival (HR: 3.862, P = 0.036) and disease-specific survival (HR: 4.705, P = 0.039) in multivariate Cox regression, although it did not provide any significant predictive ability for progression-free interval. Conversely, clinical stage, especially clinical N and M stages, also showed predictive advantages for clinical outcomes in multivariate Cox regression analyses. In order to evaluate the importance of each predictive factor for clinical outcomes, we carried out a random forest analysis to predict overall survival. The random forest model reached an overall percentage accuracy of 86.8%. As shown in Supplementary Figure 3, TICRR expression ranked second among the most important predictors of overall survival in PRCC patients.
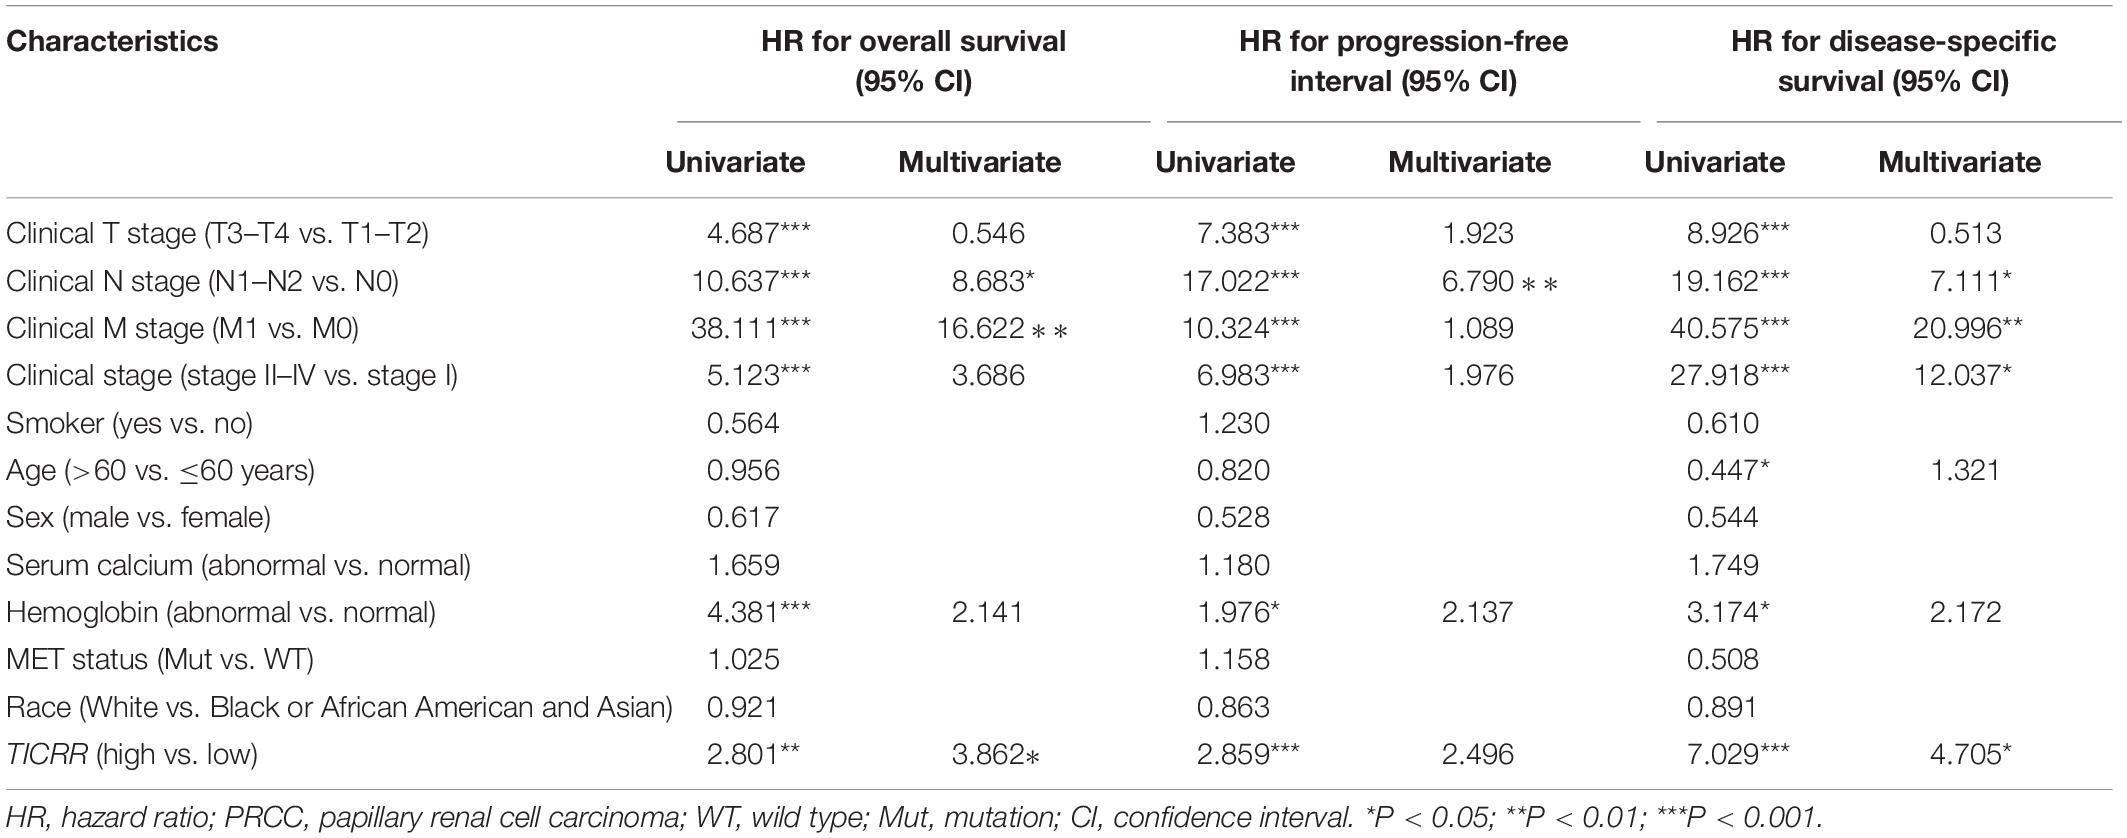
Table 3. Cox regression analysis for clinical outcomes in PRCC patients.
All the statistically significant prognostic factors in each multivariate Cox regression analysis were then used to construct a prognostic nomogram, and a calibration curve was drawn to test the efficiency of the nomogram. Clinical N and M stages, as well as TICRR, were included in the nomogram to predict overall survival, which had a C-index of 0.892 (Figure 6A). Clinical N and TICRR were included in a nomogram constructed to predict progression-free interval, which had a C-index of 0.787 (Figure 6C). Clinical stage, clinical N and M stages, and TICRR were used to construct a predictive nomogram for disease-specific survival, which had a C-index of 0.931 (Figure 6E). The calibration curves all presented desirable prediction of the three nomograms for the 1-, 3-, and 5-year clinical outcomes, with the exception of the 1-year prediction for overall survival, which was slightly underestimated (Figures 6B,D,F).
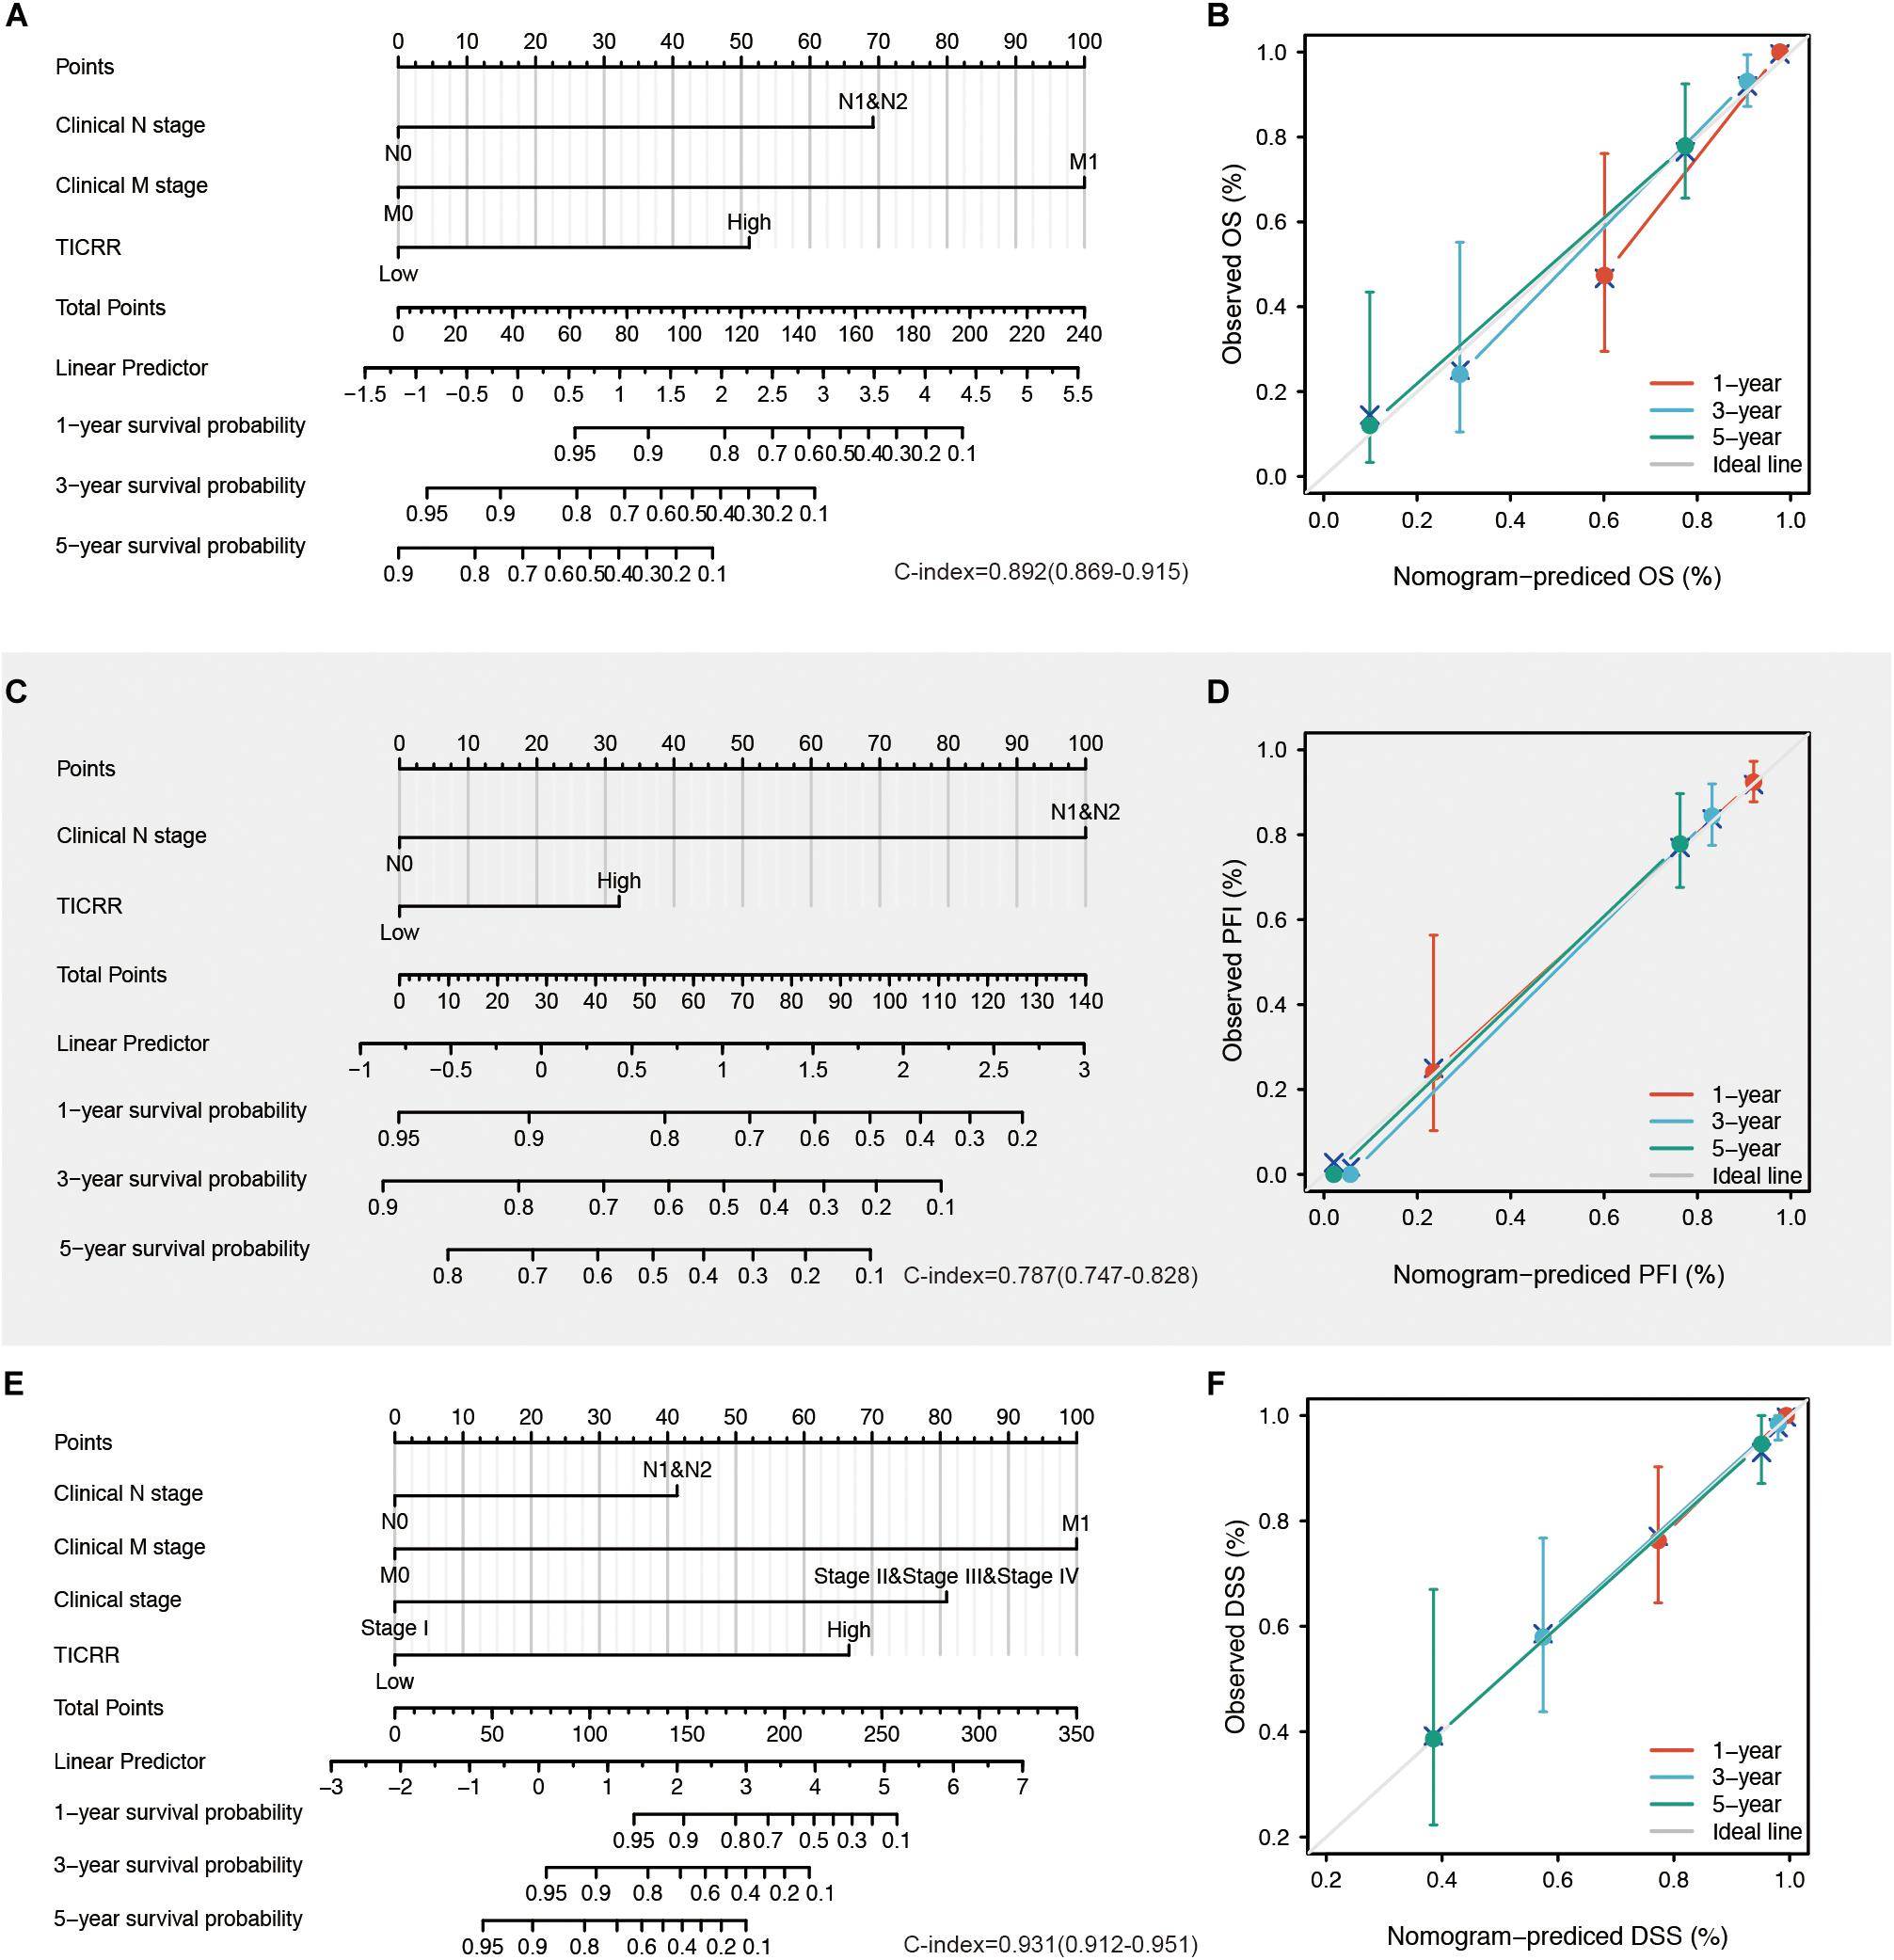
Figure 6. Construction and validation of nomograms based on TICRR expression. Shown are the nomograms constructed to establish TICRR expression-based risk scoring models for 1-, 3-, and 5-year overall survival (A), progression-free interval (C), and disease-specific survival (E). Calibration plots validating the efficiency of nomograms for overall survival (B), progression-free interval (D), and disease-specific survival (F). OS, overall survival; PFI, progression-free interval; DSS, disease-specific survival.
Prognostic Performance of TICRR in the Papillary Renal Cell Carcinoma Clinicopathological Subgroups
Next, we attempted to determine the predictive value of TICRR for clinical outcomes in several clinicopathological subgroups. We carried out Cox regression analyses in specific subgroups (Table 4). The results were also presented as forest plots (Figure 7). As shown in the forest plot in Figure 7A, TICRR was a significant risk factor for overall survival in patients of male sex (HR = 2.386, P = 0.019), age below 60 years (HR = 12.615, P = 0.014), clinical stage II–IV (HR = 3.740, P = 0.019), clinical T stages T1 and T2 (HR = 4.038, P = 0.009), clinical N0 stage (HR = 3.030, P = 0.048), clinical M0 stage (HR = 3.795, P = 0.002), and wild-type MET gene status (HR = 2.892, P = 0.002). Similar observations occurred for progression-free interval (Figure 7B) and disease-specific survival (Figure 7C). As there were few patients with clinical M1 stage (9 patients, occupying 4% of the sample) and MET mutation (20 patients, 7% of the sample), the subgroup analyses for clinical M1 stage and MET mutational status could not be performed. We also presented K-M analyses for clinical outcomes (overall survival, progression-free interval, and disease-specific survival) in the following four representative subgroups: male sex, age below 60 years, clinical stages II–IV, and T stages T1 and T2 (Figure 8). All the results demonstrated significantly better clinical outcomes in the low-TICRR expression groups.
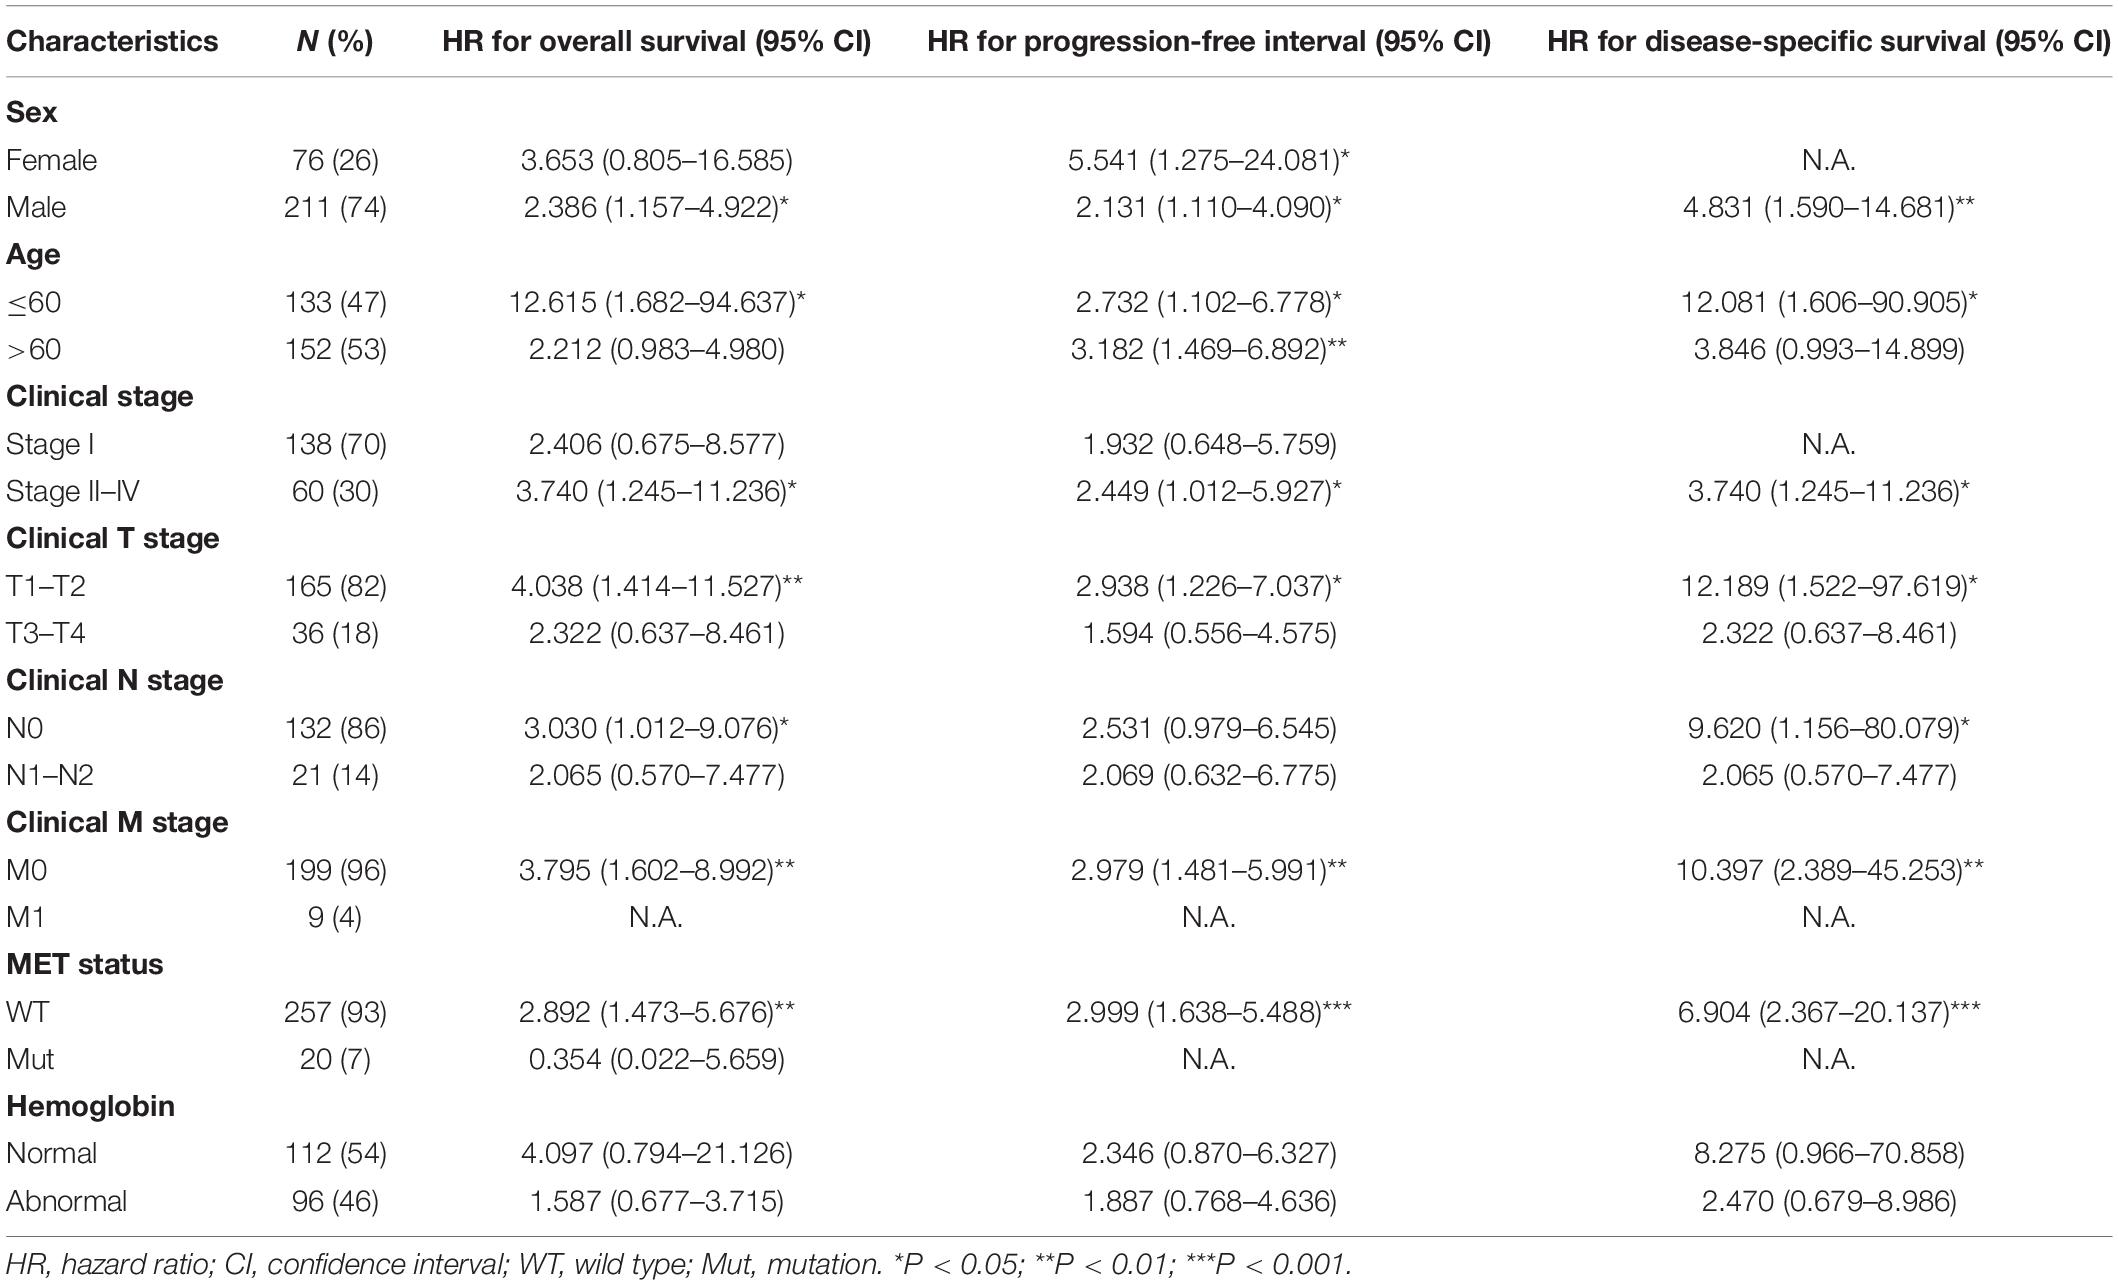
Table 4. Prognostic performance of TICRR on clinical outcomes in PRCC patient subgroups by Cox regression analysis.
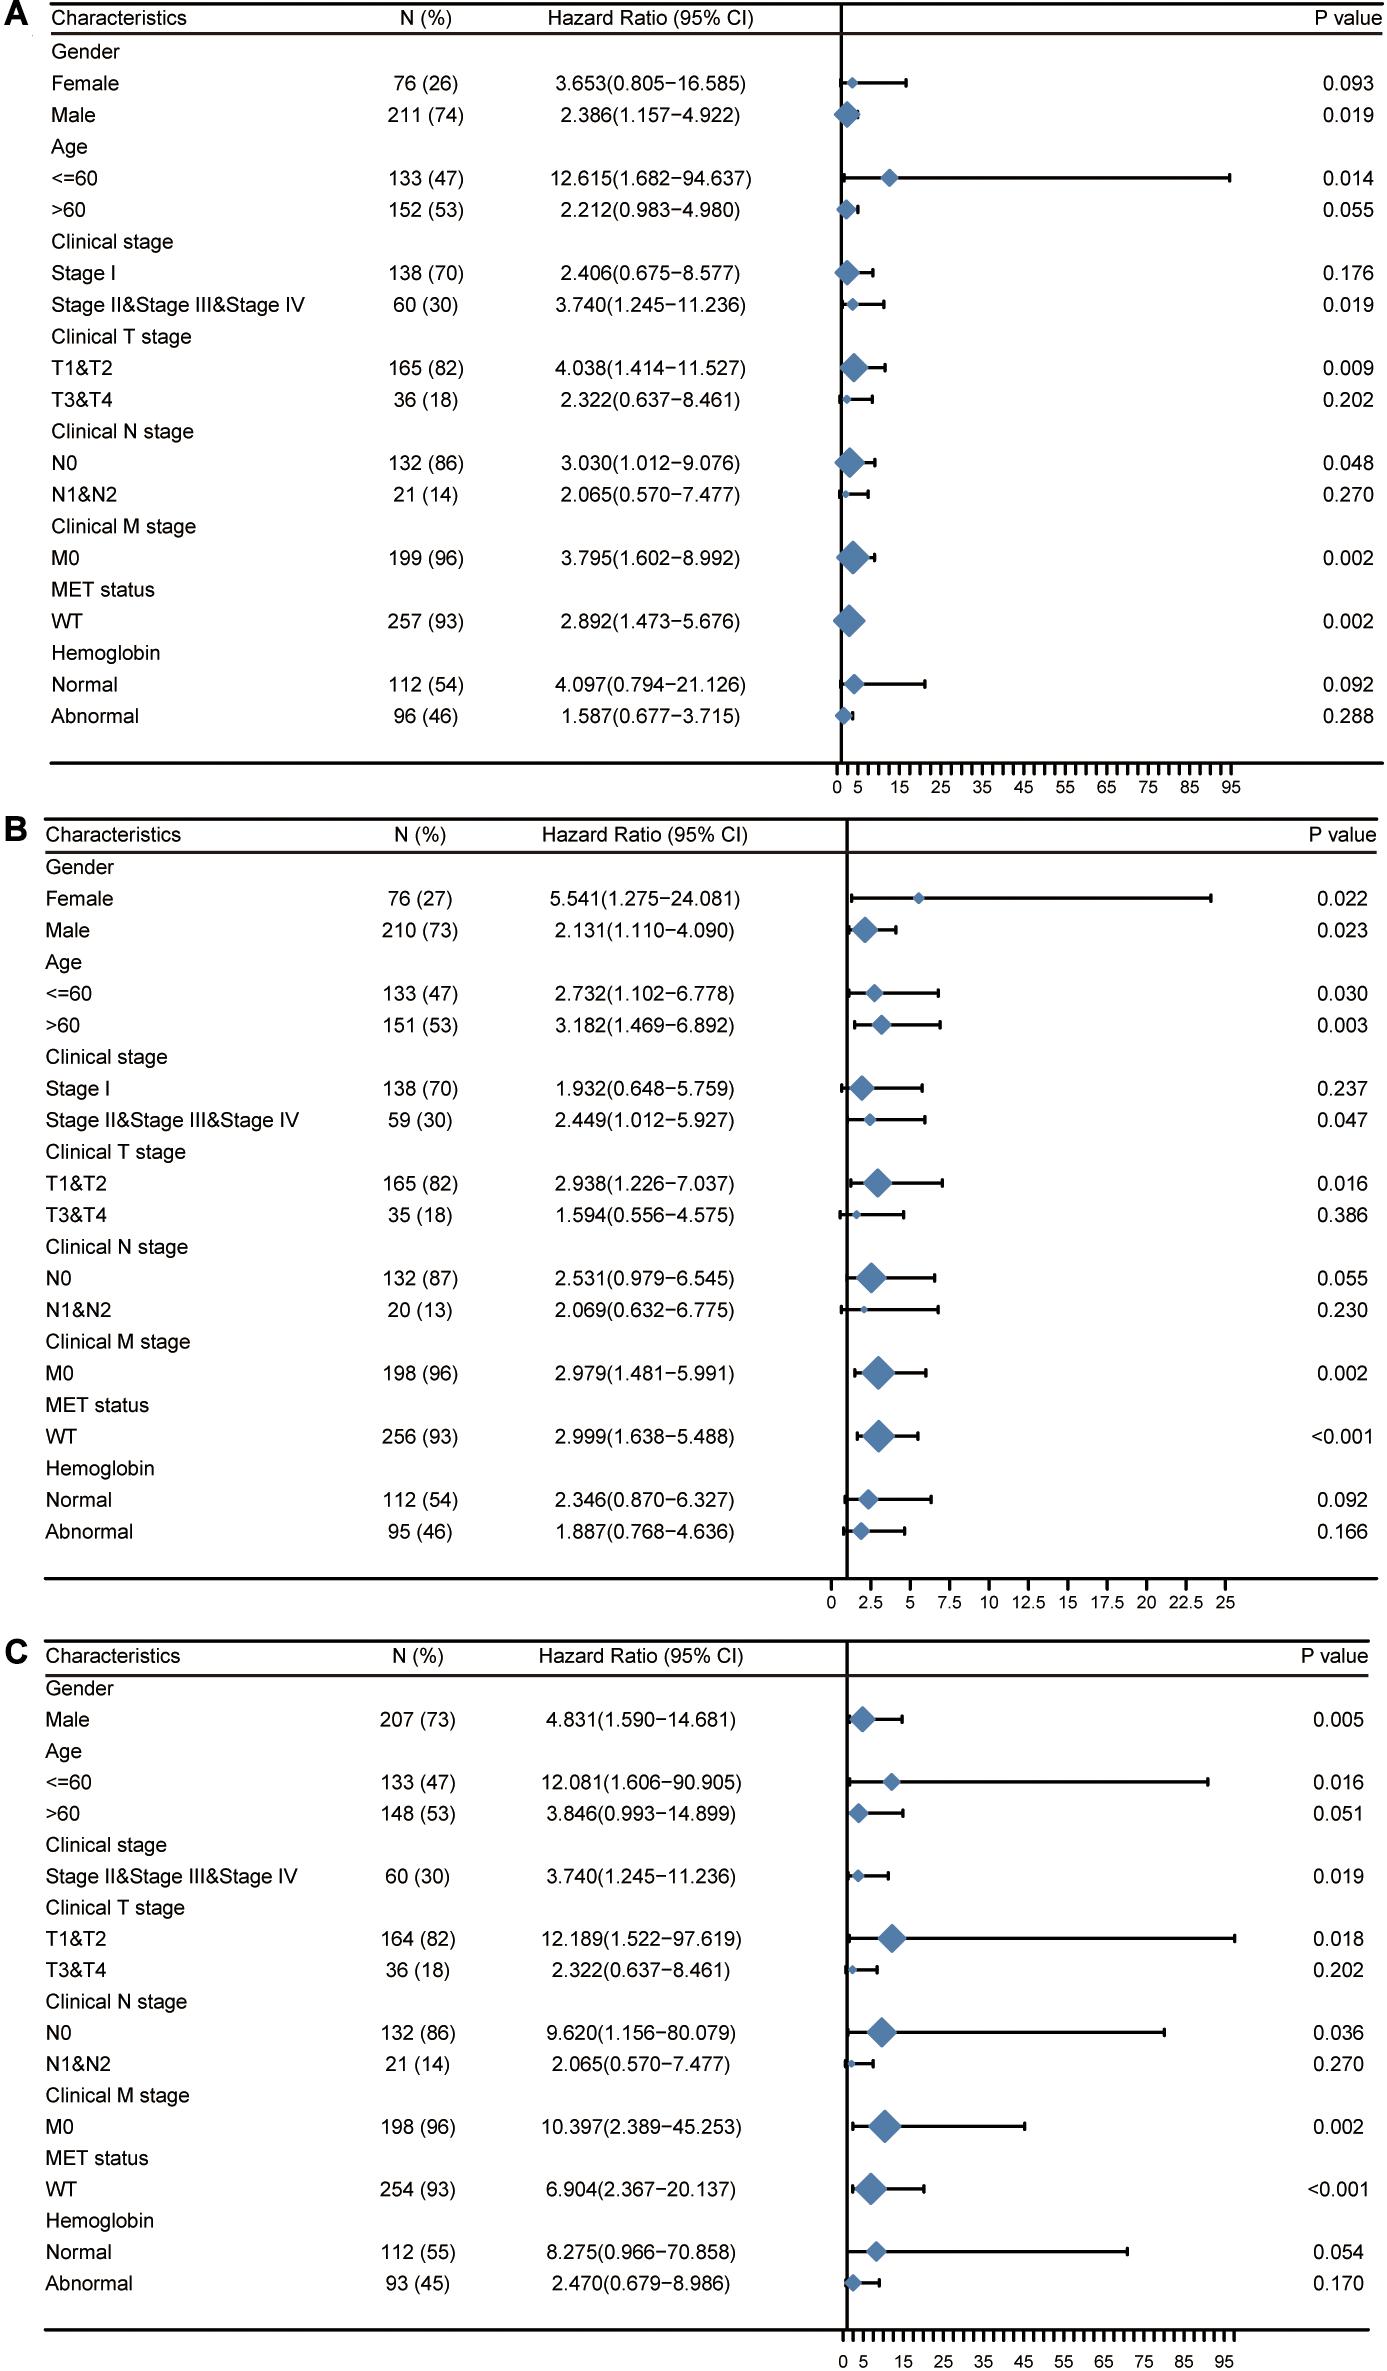
Figure 7. Prognostic performance of TICRR on clinical outcomes in different papillary renal cell carcinoma (PRCC) patient subgroups. Patients were divided into different subgroups according to sex, age, clinical stage, clinical TNM stage, MET status, and hemoglobin level. For each subgroup, the prognostic performance of TICRR on overall survival (A), progression-free interval (B), and disease-specific survival (C) were evaluated by Cox regression, and the results are presented as hazard ratio. The bar represents the 95% confidence interval of hazard ratio, the diamond’s size represents the significance of TICRR’s performance.
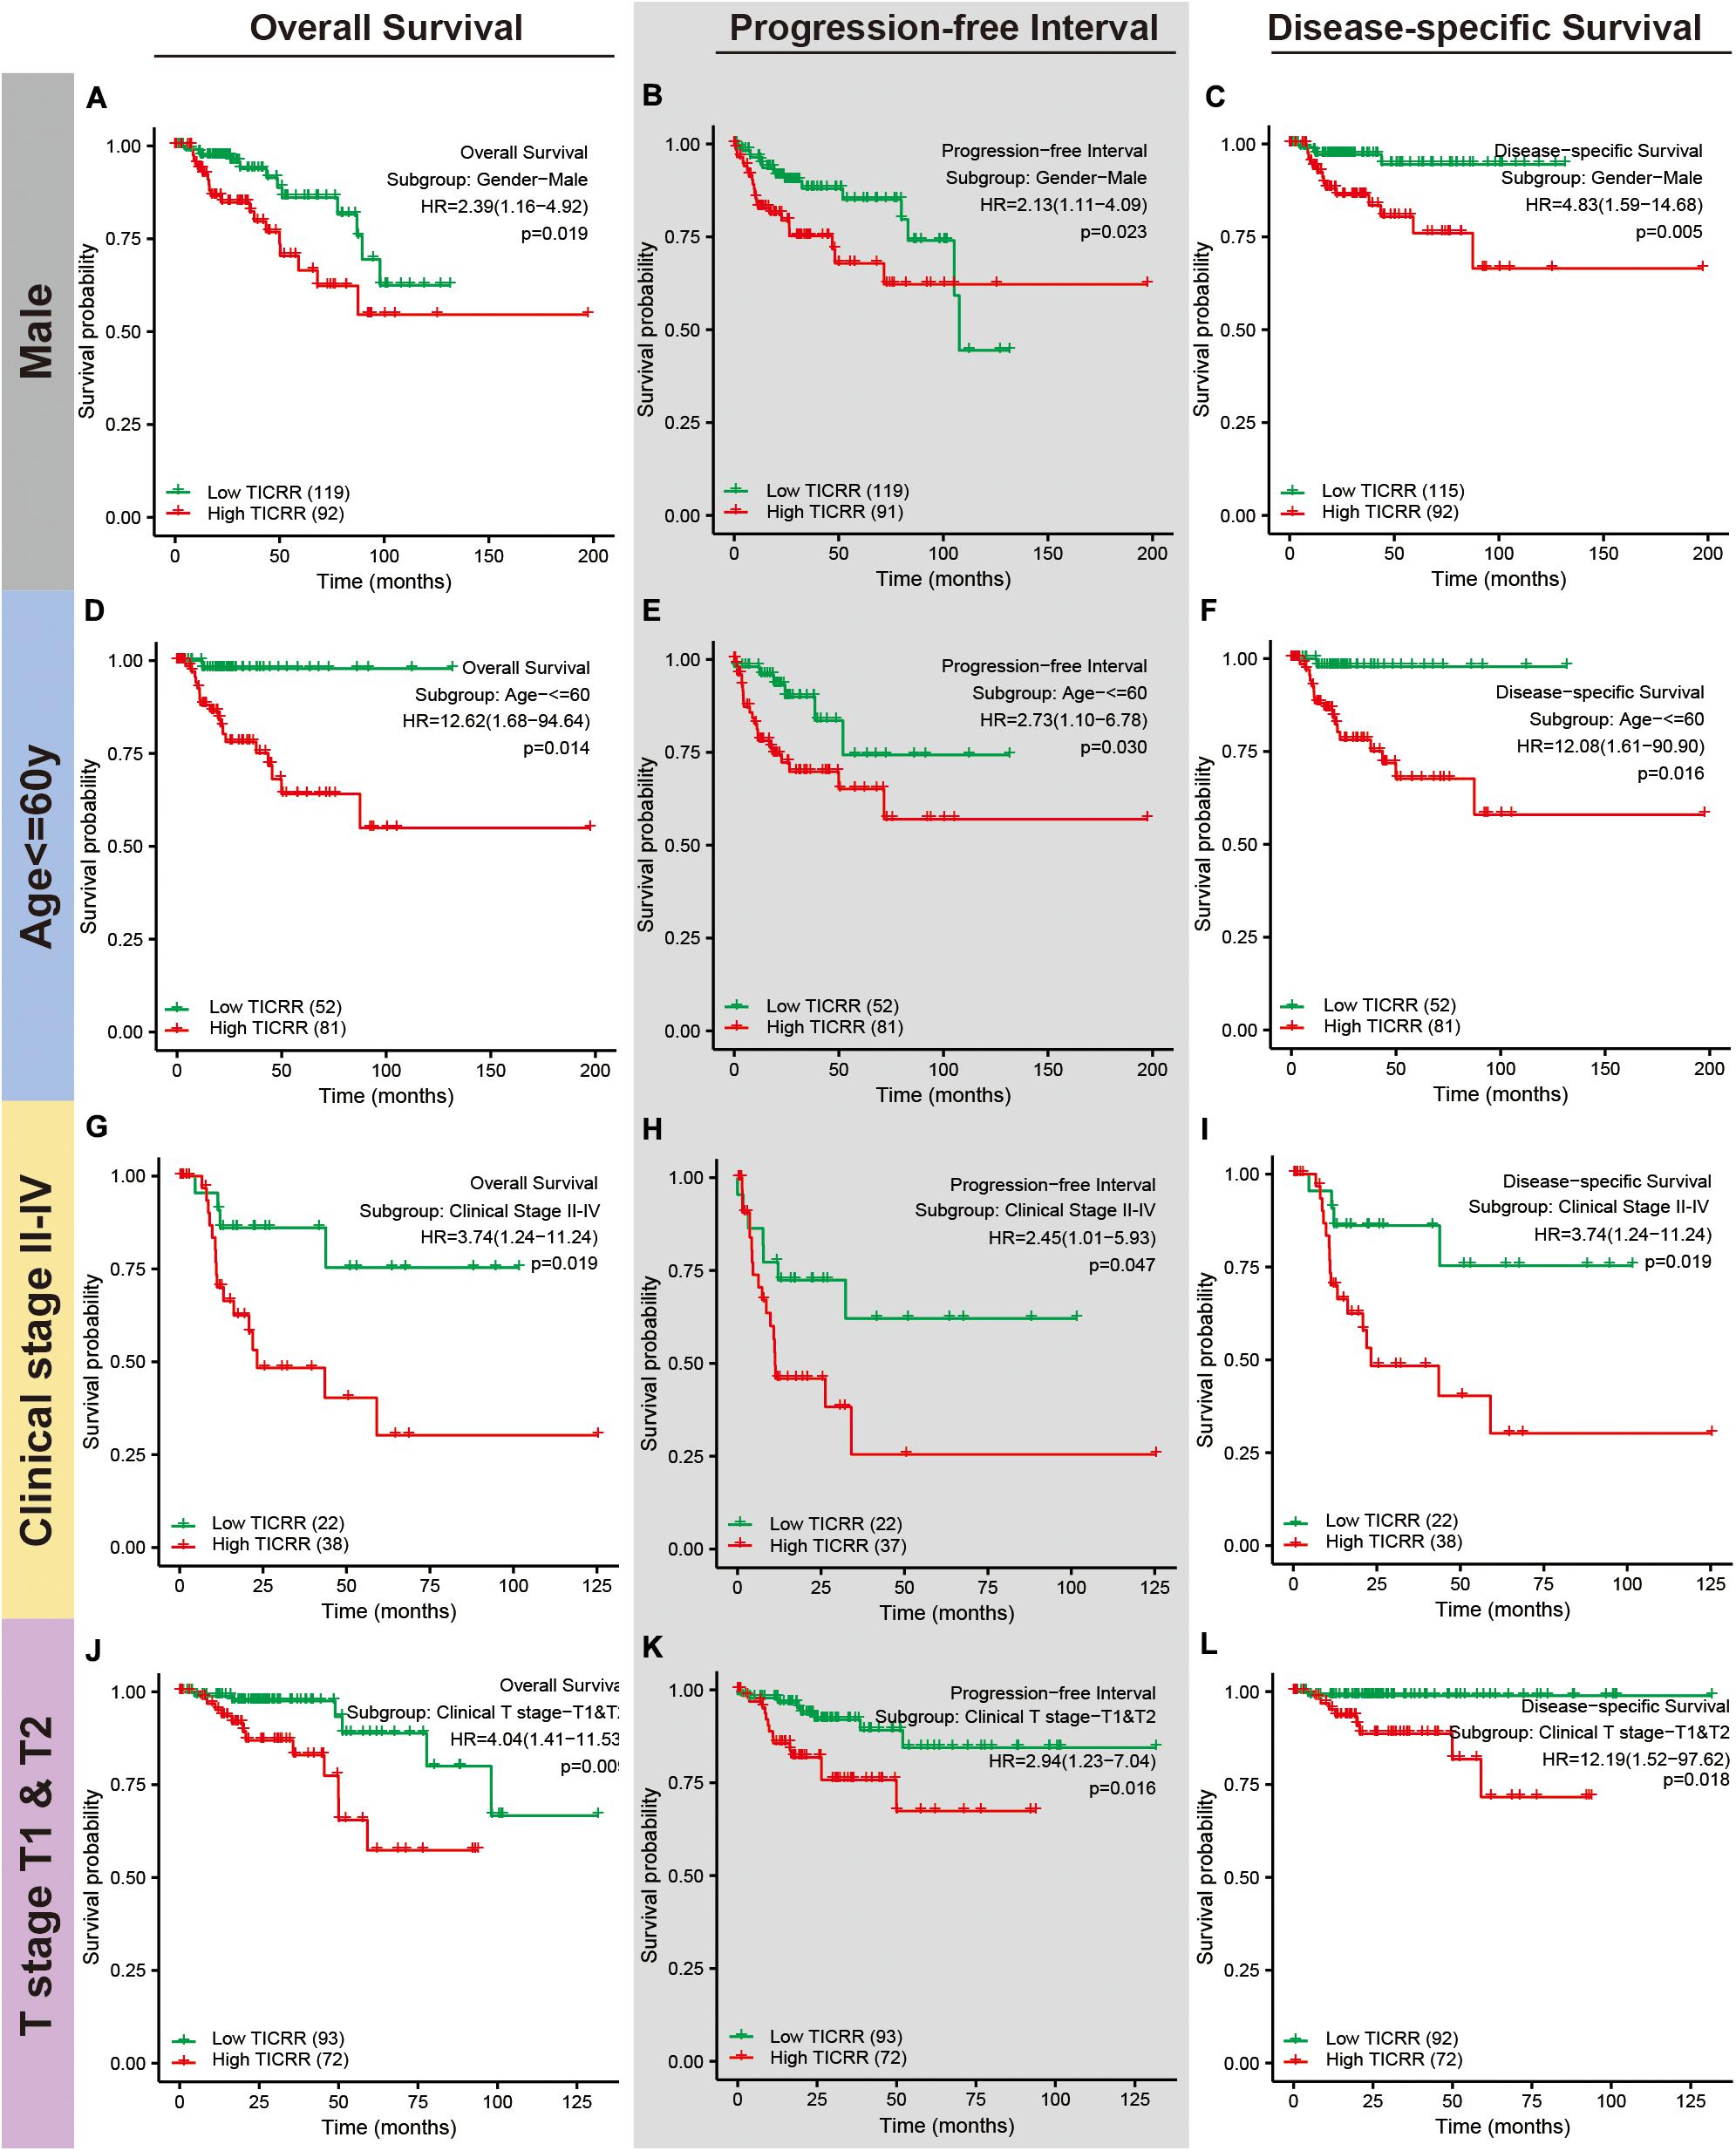
Figure 8. Distinct clinical outcomes based on TICRR expression in papillary renal cell carcinoma (PRCC) patient subgroups. Kaplan–Meier analysis showing the comparison of overall survival (A,D,G,J), progression-free interval (B,E,H,K), and disease-specific survival (C,F,I,L) between high- and low-TICRR expression groups in several PRCC patient subgroups, including male sex (A–C), age below 60 years (D–F), clinical stage II–IV (G–I), and T stages T1–T2 (J–L).
Discussion
In the present study, we focused on expression profiles, clinicopathological associations, and the clinical significance of a DNA replication initiation regulator, TICRR, in PRCC by analyzing datasets from the TCGA-KIRP. We observed prominent increased TICRR expression in PRCC tumors. DEGs related to higher TICRR levels were specifically enriched in cell cycle- and MET-associated pathways. We also revealed a marked association of TICRR expression with sex, age, and clinical stages in PRCC patients. Finally, we determined the predictive value of TICRR for overall survival, progression-free interval, and disease-specific survival in PRCC patients, especially in those of male sex, age below 60 years, and clinical stages II–IV and T stages T1–T2.
Uncontrollable DNA replication and thus cell proliferation are an essential mechanism in tumorigenesis. As a critical DNA replication regulator, TICRR plays an important role in several solid cancers (Yu et al., 2019). In our study, we found that TICRR was significantly elevated in several urogenital cancers, including PRCC, chromophobe renal carcinoma, renal clear cell carcinoma, bladder urothelial carcinoma, cervical squamous cell carcinoma, and in endocervical adenocarcinoma. Moreover, TICRR was also upregulated in tumors of other organs, such as breast invasive carcinoma, colon adenocarcinoma, and glioblastoma multiforme. Thus, TICRR may be a crucial hub gene in tumorigenesis.
Further, we attempted to describe the potential functions and mechanisms involving TICRR in PRCC. Based on results from previous studies (Bruck and Kaplan, 2015; Bruck et al., 2015), TICRR coordinates the assembly and activation of the eukaryotic replication fork helicase, which further unwinds double-stranded DNA and initiates DNA replication. In our study, based on functional annotation of TICRR-associated DEGs, epithelial cell differentiation and urogenital system development were closely associated with TICRR expression. Moreover, TICRR was associated with negative regulation of cell division. Based on additional GSEA, several cell cycle-related events were enriched in the high-TICRR group. The above data all provided evidence that TICRR functions as a critical DNA replication initiation regulator in PRCC. In a different study focusing on breast cancer, TICRR showed a similar effect on tumorigenesis, as silencing of TICRR significantly inhibited DNA replication, arrested cell cycle progression, and activated DNA damage (Yu et al., 2019). More interestingly, we found that patients in the high-TICRR group more frequently harbored MET mutations, which represents an appealing drug target given its prevalence in PRCC. The functional annotation analysis revealed that higher TICRR levels were associated with increased pathophysiological activity of the MET gene. Therefore, TICRR expression might be of great importance in PRCC tumorigenesis by affecting MET status and function.
We also revealed an underlying relationship between TICRR expression and immune cell infiltration. TICRR expression was negatively correlated with DCs, macrophages, and neutrophils. As the most effective antigen presenting cells, DCs activate CD 8 + T cells by cross-priming and further initiate anti-tumor immunity (Fu and Jiang, 2018). In the following immune response, neutrophils and macrophages work together against tumors (Qu et al., 2018). Moreover, neutrophils proved to be associated with better prognosis in different cancers (Donskov, 2013). Therefore, overexpressed TICRR seemed to dampen tumor immunity, help cancer cells escape from elimination, and finally accelerate tumorigenesis. On the other hand, we found a significantly positive correlation between TICRR expression and Tcm infiltration. Tumor-infiltrated Tcm cells have been reported in multiple cancers (Beckhove et al., 2004), which often exhibit dysfunctional phenotypes correlating with cancer progression (Reading et al., 2018). It can be explained that excessive neoantigen exposure caused functionally altered Tcm cells that skewed the anti-tumor response toward non-responsiveness (Merad et al., 2013).
Another issue of interest was the clinical significance of TICRR in PRCC. The ROC curve for TICRR discrimination of PRCC diagnosis had an AUC of 0.807, strongly suggesting that TICRR was a convincing biomarker for PRCC diagnosis. Moreover, we demonstrated that higher TICRR expression was correlated with several clinicopathological characteristics: female sex, younger age, abnormal hemoglobin, and worse clinical stages. As most of the above characteristics were risk factors for survival in PRCC patients (Fernandes and Lopes, 2015; Peng et al., 2018), we proposed TICRR as a marker for poor survival in PRCC. According to further Cox regression analyses and nomograms, TICRR presented satisfactory performance on clinical outcomes in PRCC. Patients with higher TICRR levels showed strikingly worse overall survival, progression-free interval, and disease-specific survival. This prognostic value of TICRR seemed to be more prominent in patients with specific features: male sex, age below 60 years, and clinical stages II–IV and T stages T1–T2. Using an online tool LOGpc (Long-term Outcome and Gene Expression Profiling Database of pan-cancers)4, TICRR was proved to be associated with lower overall survival in other tumors, such as renal clear cell carcinoma (Xie et al., 2019a), adrenocortical carcinoma (Xie et al., 2019b), breast invasive carcinoma (Yan et al., 2019), and lung cancer (Yan et al., 2020). The universal upregulation and predictive performance of TICRR indicated a possibility that it could represent a common prognostic biomarker for these cancer types.
Although we uncovered a potential mechanism for TICRR activity in PRCC tumorigenesis and its predictive value in PRCC clinical outcomes, our study still presented several limitations. First, because of the incomplete information about treatments and corresponding responses, we could not evaluate a specific role for TICRR in PRCC treatment. Second, we mainly focused on the RNA sequencing data from the TCGA database; thus, we were unable to provide information on relative protein levels or downstream pathways involving TICRR. Thus, these will remain areas for further in vivo and in vitro studies concentrating on the direct mechanism of TICRR activity in PRCC.
Conclusion
Increased TICRR expression in PRCC might play a role in tumorigenesis by regulating cell cycle and exhibiting prognostic value for clinical outcomes. This study sheds light on TICRR as a potential therapeutic target for PRCC.
Data Availability Statement
Publicly available datasets were analyzed in this study. This data can be found here: https://portal.gdc.cancer.gov/.
Ethics Statement
All the data were collected and downloaded from TCGA database. As TCGA database is open to the public under specific guidelines, it is confirmed that all written informed consents were achieved. The patients/participants provided their written informed consent to participate in this study.
Author Contributions
SX and YL: project investigation. XT: methodology. JL: writing–original draft. XL: writing–review and editing. ZH: project administration and supervision. All authors contributed to the article and approved the submitted version.
Funding
This study was supported by the Natural Science Foundation of Guangdong Province (No. 2018A030310016), Guangdong Provincial Medical Science Foundation (No. A2018110), and the Lab Opening-up Project for college students of Guangzhou Medical University.
Conflict of Interest
The authors declare that the research was conducted in the absence of any commercial or financial relationships that could be construed as a potential conflict of interest.
Supplementary Material
The Supplementary Material for this article can be found online at: https://www.frontiersin.org/articles/10.3389/fgene.2020.605378/full#supplementary-material
Supplementary Figure 1 | Differential non-coding RNA expression profiles in PRCC patients stratified by TICRR levels. Expression profiles of miRNAs (A,C) and lncRNAs (B,D) in two groups are presented by volcano plots (A,B) and heatmaps (C,D).
Supplementary Figure 2 | Protein-protein interaction networks of DEGs in PRCC patients with high- and low-TICRR expression levels. Based on the 691 differentially expressed mRNAs between high- and low- TICRR expression groups, we analyzed interactions using the STRING database, where the interaction threshold was set as 0.4. The line represents protein-protein interactions. The darker the filling color, the more mRNA interactions.
Supplementary Figure 3 | Mean decrease Gini plot for important indexes associated with overall survival in PRCC patients. The random forest model was used to rank significant indexes, enrolling age, sex, smoking history, serum calcium level, hemoglobin level, TMN stage, clinical stage, and TICRR expression.
Supplementary Table 1 | Top 20 clusters in pathway and process enrichment analysis of DEGs in PRCC patients with distinct TICRR levels.
Footnotes
- ^ https://portal.gdc.cancer.gov/
- ^ http://metascape.org
- ^ http://string-db.org
- ^ http://bioinfo.henu.edu.cn/DatabaseList.jsp
References
Akhtar, M., Al-Bozom, I. A., and Al Hussain, T. (2019). Papillary renal cell carcinoma (PRCC): an Update. Adv. Anat. Pathol. 26, 124–132. doi: 10.1097/pap.0000000000000220
Alshenawy, H. A. (2015). Immunohistochemical panel for differentiating renal cell carcinoma with clear and papillary features. Pathol. Oncol. Res. 21, 893–899. doi: 10.1007/s12253-015-9898-7
Beckhove, P., Feuerer, M., Dolenc, M., Schuetz, F., Choi, C., Sommerfeldt, N., et al. (2004). Specifically activated memory T cell subsets from cancer patients recognize and reject xenotransplanted autologous tumors. J. Clin. Invest. 114, 67–76. doi: 10.1172/jci20278
Blighe, K. (2019). EnhancedVolcano: Publication-Ready Volcano Plots With Enhanced Colouring and Labeling.
Boos, D., Sanchez-Pulido, L., Rappas, M., Pearl, L. H., Oliver, A. W., Ponting, C. P., et al. (2011). Regulation of DNA replication through Sld3-Dpb11 interaction is conserved from yeast to humans. Curr. Biol. 21, 1152–1157. doi: 10.1016/j.cub.2011.05.057
Bruck, I., and Kaplan, D. L. (2015). Conserved mechanism for coordinating replication fork helicase assembly with phosphorylation of the helicase. Proc. Natl. Acad. Sci. U.S.A. 112, 11223–11228. doi: 10.1073/pnas.1509608112
Bruck, I., Perez-Arnaiz, P., Colbert, M. K., and Kaplan, D. L. (2015). Insights into the initiation of eukaryotic DNA replication. Nucleus 6, 449–454. doi: 10.1080/19491034.2015.1115938
Cao, Q., Ruan, H., Wang, K., Song, Z., Bao, L., Xu, T., et al. (2018). Overexpression of PLIN2 is a prognostic marker and attenuates tumor progression in clear cell renal cell carcinoma. Int. J. Oncol. 53, 137–147. doi: 10.3892/ijo.2018.4384
Charrasse, S., Gharbi-Ayachi, A., Burgess, A., Vera, J., Hached, K., Raynaud, P., et al. (2017). Ensa controls S-phase length by modulating Treslin levels. Nat. Commun. 8:206. doi: 10.1038/s41467-017-00339-4
Donskov, F. (2013). Immunomonitoring and prognostic relevance of neutrophils in clinical trials. Semin. Cancer Biol. 23, 200–207. doi: 10.1016/j.semcancer.2013.02.001
Farber, N. J., Kim, C. J., Modi, P. K., Hon, J. D., Sadimin, E. T., and Singer, E. A. (2017). Renal cell carcinoma: the search for a reliable biomarker. Transl. Cancer Res. 6, 620–632. doi: 10.21037/tcr.2017.05.19
Fernandes, D. S., and Lopes, J. M. (2015). Pathology, therapy and prognosis of papillary renal carcinoma. Future Oncol. 11, 121–132. doi: 10.2217/fon.14.133
Fu, C., and Jiang, A. (2018). Dendritic cells and CD8 T Cell immunity in tumor microenvironment. Front. Immunol. 9:3059. doi: 10.3389/fimmu.2018.03059
Hänzelmann, S., Castelo, R., and Guinney, J. (2013). GSVA: gene set variation analysis for microarray and RNA-seq data. BMC Bioinformatics 14:7. doi: 10.1186/1471-2105-14-7
Liu, J., Lichtenberg, T., Hoadley, K. A., Poisson, L. M., Lazar, A. J., Cherniack, A. D., et al. (2018). An integrated TCGA pan-cancer clinical data resource to drive high-quality survival outcome analytics. Cell 173, 400.e11–416.e11. doi: 10.1016/j.cell.2018.02.052
Love, M. I., Huber, W., and Anders, S. (2014). Moderated estimation of fold change and dispersion for RNA-seq data with DESeq2. Genome Biol. 15:550. doi: 10.1186/s13059-014-0550-8
Maya-Mendoza, A., Moudry, P., Merchut-Maya, J. M., Lee, M., Strauss, R., and Bartek, J. (2018). High speed of fork progression induces DNA replication stress and genomic instability. Nature 559, 279–284. doi: 10.1038/s41586-018-0261-5
Merad, M., Sathe, P., Helft, J., Miller, J., and Mortha, A. (2013). The dendritic cell lineage: ontogeny and function of dendritic cells and their subsets in the steady state and the inflamed setting. Annu. Rev. Immunol. 31, 563–604. doi: 10.1146/annurev-immunol-020711-074950
Morabito, R. A., Talug, C., Zaslau, S., and Kandzari, S. (2010). Asymptomatic advanced pediatric papillary renal cell carcinoma presenting as a pulmonary embolus. Urology 76, 153–155. doi: 10.1016/j.urology.2009.09.016
Peng, D., Zhang, C. J., Tang, Q., Zhang, L., Yang, K. W., Yu, X. T., et al. (2018). Prognostic significance of the combination of preoperative hemoglobin and albumin levels and lymphocyte and platelet counts (HALP) in patients with renal cell carcinoma after nephrectomy. BMC Urol. 18:20. doi: 10.1186/s12894-018-0333-8
Qu, X., Tang, Y., and Hua, S. (2018). Immunological approaches towards cancer and inflammation: a cross talk. Front. Immunol. 9:563. doi: 10.3389/fimmu.2018.00563
Reading, J. L., Gálvez-Cancino, F., Swanton, C., Lladser, A., Peggs, K. S., and Quezada, S. A. (2018). The function and dysfunction of memory CD8(+) T cells in tumor immunity. Immunol. Rev. 283, 194–212. doi: 10.1111/imr.12657
Shannon, P., Markiel, A., Ozier, O., Baliga, N. S., Wang, J. T., Ramage, D., et al. (2003). Cytoscape: a software environment for integrated models of biomolecular interaction networks. Genome Res. 13, 2498–2504. doi: 10.1101/gr.1239303
Siegel, R. L., Miller, K. D., and Jemal, A. (2018). Cancer statistics, 2018. CA Cancer J. Clin. 68, 7–30. doi: 10.3322/caac.21442
Song, J., Liu, Y. D., Su, J., Yuan, D., Sun, F., and Zhu, J. (2019). Systematic analysis of alternative splicing signature unveils prognostic predictor for kidney renal clear cell carcinoma. J. Cell. Physiol. 234, 22753–22764. doi: 10.1002/jcp.28840
Srigley, J. R., Delahunt, B., Eble, J. N., Egevad, L., Epstein, J. I., Grignon, D., et al. (2013). The International Society of Urological Pathology (ISUP) Vancouver Classification of Renal Neoplasia. Am. J. Surg. Pathol. 37, 1469–1489. doi: 10.1097/PAS.0b013e318299f2d1
Subramanian, A., Tamayo, P., Mootha, V. K., Mukherjee, S., Ebert, B. L., Gillette, M. A., et al. (2005). Gene set enrichment analysis: a knowledge-based approach for interpreting genome-wide expression profiles. Proc. Natl. Acad. Sci. U.S.A. 102, 15545–15550. doi: 10.1073/pnas.0506580102
Svetnik, V., Liaw, A., Tong, C., Culberson, J. C., Sheridan, R. P., and Feuston, B. P. (2003). Random forest: a classification and regression tool for compound classification and QSAR modeling. J. Chem. Inf. Comput. Sci. 43, 1947–1958. doi: 10.1021/ci034160g
Szklarczyk, D., Gable, A. L., Lyon, D., Junge, A., Wyder, S., Huerta-Cepas, J., et al. (2019). STRING v11: protein-protein association networks with increased coverage, supporting functional discovery in genome-wide experimental datasets. Nucleic Acids Res. 47, D607–D613. doi: 10.1093/nar/gky1131
Xie, L., Wang, Q., Dang, Y., Ge, L., Sun, X., Li, N., et al. (2019a). OSkirc: a web tool for identifying prognostic biomarkers in kidney renal clear cell carcinoma. Future Oncol. 15, 3103–3110. doi: 10.2217/fon-2019-0296
Xie, L., Wang, Q., Nan, F., Ge, L., Dang, Y., Sun, X., et al. (2019b). OSacc: gene expression-based survival analysis web tool for adrenocortical carcinoma. Cancer Manag. Res. 11, 9145–9152. doi: 10.2147/cmar.S215586
Yan, Z., Wang, Q., Lu, Z., Sun, X., Song, P., Dang, Y., et al. (2020). OSluca: an interactive web server to evaluate prognostic biomarkers for lung cancer. Front. Genet. 11:420. doi: 10.3389/fgene.2020.00420
Yan, Z., Wang, Q., Sun, X., Ban, B., Lu, Z., Dang, Y., et al. (2019). OSbrca: a web server for breast cancer prognostic biomarker investigation with massive data from tens of cohorts. Front. Oncol. 9:1349. doi: 10.3389/fonc.2019.01349
Yu, G., Wang, L. G., Han, Y., and He, Q. Y. (2012). clusterProfiler: an R package for comparing biological themes among gene clusters. Omics 16, 284–287. doi: 10.1089/omi.2011.0118
Yu, Q., Pu, S. Y., Wu, H., Chen, X. Q., Jiang, J. J., Gu, K. S., et al. (2019). TICRR contributes to tumorigenesis through accelerating DNA replication in Cancers. Front. Oncol. 9:516. doi: 10.3389/fonc.2019.00516
Keywords: TICRR, papillary renal cell carcinoma, clinical outcome, Treslin, immune infiltration
Citation: Xia S, Lin Y, Lin J, Li X, Tan X and Huang Z (2021) Increased Expression of TICRR Predicts Poor Clinical Outcomes: A Potential Therapeutic Target for Papillary Renal Cell Carcinoma. Front. Genet. 11:605378. doi: 10.3389/fgene.2020.605378
Received: 12 September 2020; Accepted: 07 December 2020;
Published: 11 January 2021.
Edited by:
Yanni Sun, City University of Hong Kong, Hong KongReviewed by:
Xiangqian Guo, Henan University, ChinaKa-Chun Wong, City University of Hong Kong, Hong Kong
Copyright © 2021 Xia, Lin, Lin, Li, Tan and Huang. This is an open-access article distributed under the terms of the Creative Commons Attribution License (CC BY). The use, distribution or reproduction in other forums is permitted, provided the original author(s) and the copyright owner(s) are credited and that the original publication in this journal is cited, in accordance with accepted academic practice. No use, distribution or reproduction is permitted which does not comply with these terms.
*Correspondence: Zena Huang, NTA2NjQ3MTY4QHFxLmNvbQ==
†These authors have contributed equally to this work