 Antonia Noce1
 Saber Qanbari1
 Rayner González-Prendes2
 Julia Brenmoehl1
 María Gracia Luigi-Sierra3Michael Theerkorn4Marc-André Fiege5Heike Pilz6Adrian Bota7
 Livia Vidu8Csaba Horwath9László Haraszthy10Pencho Penchev11Yordanka Ilieva11Tzonka Peeva11Wolfgang Lüpcke12René Krawczynski13
 Klaus Wimmers1Manfred Thiele14
 Andreas Hoeflich1*
- 1Leibniz-Institute for Farm Animal Biology, Dummerstorf, Germany
- 2Animal Breeding and Genomics Group, Wageningen University & Research, Wageningen, Netherland
- 3Department of Animal Genetics, Center for Research in Agricultural Genomics, Campus Universitat Autonoma de Barcelona, Bellaterra, Spain
- 4Hof am Meer GmBH, Stadland, Germany
- 5Gut Darss, GmbH & Co. KG, Born, Germany
- 6Wiesenburger Land eG, Wiesenburg, Germany
- 7Research and Development Station for Buffalos Şercaia, Şercaia, Romania
- 8University of Agronomic Sciences and Veterinary Medicine of Bucharest, Bucharest, Romania
- 9Comuna Baciu sat Mera, Cluj, Romania
- 10Pro Vértes, Csákvár, Hungary
- 11Bulgarian National Association for Development of Buffalo Breeding, Shumen, Bulgaria
- 12Higher School in Agribusiness and Development of Regions, Agricultural University Plovdiv, Tarnovo, Bulgaria
- 13Energiequelle GmbH, Zossen, Germany
- 14German Buffalo Association, Penig, Germany
This is the first study to explore the genetic diversity and population structure of domestic water buffalo (Bubalus bubalis) in Germany and their potential relations to herds in other parts of Europe or worldwide. To this end, animals from different herds in Germany, Bulgaria, Romania, and Hungary were genotyped and compared to genotypes from other populations with worldwide distribution and open to the public. The pilot study analyzed population structure, phylogenetic tree, and inbreeding events in our samples. In buffalos from Germany, a mixed genetic make-up with contributions from Bulgaria (Murrah breed), Romania, and Italy was found. All in all, a high degree of genetic diversity was identified in European buffalos, and a novel genotype was described in Hungarian buffalos by this study. We demonstrate that European buffalos stand out from other buffalo populations worldwide, supporting the idea that buffalos have not completely disappeared from the European continent during the late Pleistocene. The high genetic diversity in European buffalos seems to be an excellent prerequisite for the establishment of local breeds characterized by unique traits and features. This study may also be considered as an initial step on the way to genome characterization for the sustainable development of the buffalo economy in Germany and other parts of Europe in the future.
Introduction
Water buffalo (Bubalus bubalis) is a multipurpose animal, producing meat, milk, leather products, and dung. In developing countries, buffalos are used as draught animals, providing more than 40% of farm labor (Borghese, 2005). Due to their wallowing behavior, buffalos are less susceptible to ectoparasites and related diseases and suitable for grazing in the swamps (Michelizzi et al., 2010). Buffalos are also more efficient in the digestion process due to their longer rumen and produce a lower average of methane emission (Moss et al., 2000; Kawashima et al., 2006; Calabró et al., 2013). Compared to cattle, the buffalo is less selective for feed quality (Michelizzi et al., 2010) and longer living, granting husbandry at lower costs and with less frequent animal turnover (Borghese, 2005; Hegde, 2019; Hoffman and Valencak, 2020). Buffalo meat is a rich source of proteins, fatty acids as omega 3-6 fatty acids, iron, and characterized by lower concentrations of cholesterol if compared to cattle (Roth and Myers, 2004). Milk from buffalo contains biliverdin, bioactive pentasaccharides, and gangliosides, which are not present in bovine milk (Abd El-Salam and El-Shibiny, 2011) and more fat in total but lower cholesterol compared to the cattle. Buffalo milk is further characterized by higher protein content and big casein micelles; both features are related to the higher yields of cheese produced from the same amounts of buffalo versus dairy cow milk (Zicarelli, 2004; Martini et al., 2018).
The domestic water buffalo is classified into two major categories: swamp buffalo (Bubalus bubalis carabanensis, 2n = 48) and river buffalo (Bubalus bubalis bubali, 2n = 50). While their taxonomical status is still being debated, B. bubalis is supposed to be descended from Indian wild buffalo (Bubalus arnee) domesticated ≈5,000 years ago (Cockrill, 1984). Nevertheless, the origin of the two subspecies into which water buffalo are divided is still the object of study (Colli et al., 2018b), especially to solve the debate about the occurrence of a single versus two separate domestication events (Lau et al., 1998; Kierstein et al., 2004; Kumar et al., 2007).
Little is known about the history, genetic diversity, and performance of European buffalo populations. The presence of water buffalo in Europe is dated from the Pleistocene until the warm period before the last Eem-Interglacial (≈125,000 years ago), when buffalos were also present in Central Europe (Zahariev et al., 1986; Alexiev, 1998). Although hunting (Martin, 1984) and climatic changes, particularly during the late Pleistocene (Lima-Ribeiro and Diniz-Filho, 2017), temporarily or locally displaced and shrank the European buffalo populations, the presence of refugial regions in Southern and Eastern Europe may have prevented the extinction of the Bubalus species from the European continent (Krawczynski, 2010). The presence of buffalos in South-Eastern Europe during the early Neolithikum (9,000–7,000 BC) was suggested (Bökönyi, 1957) but generally dismissed (Bartosiewicz, 1999). Based on bone finds in Austria dated to the Atlantikum (7,000–4,000 BC), other authors have also discussed the presence of buffalos during the Holocene (beginning 12,000 BC) (Pucher, 1988). However, defined criteria for the unambiguous distinction of members from the Bovini tribus (in particular, Bos versus Bubalus) have been lacking until now (Pucher, 1988). According to Haarmann (2011), the ancient Greeks have used different terms for aurochs (Bos primigenius), wisent (Bos bonasus), and buffalo (Bubalus sp.). This linguistic approach supports the hitherto controversial bone finds from the same area at about the same time. It is unclear whether water buffalos repopulated Europe after the ice age or whether they survived in refugial areas. Because rock reliefs, dated back to ≈16,000 BC in France, clearly display buffalos (Krawczynski, 2013). This, in fact, would be an indication that water buffalos in Europe survived the ice age.
Domesticated water buffalos in Europe are referenced during the centuries VI–XII C.E. (Maymone, 1942; Alexiev, 1998) and had been settled in Italy, Bulgaria, Romania, and all the other Balkan countries, where they have been preserved and bred for centuries until today (Ferrara, 1964). European buffalos are river type (Borghese, 2011). The Balkans (East Europe) are an essential point of the river buffalo’s historical migration route. Riverine buffalo moved to Southwestern Asia from the Indian domestication area, reached Egypt and Turkey, and arrived in East Europe and Italy during the seventh century (Zeuner, 1963; Clutton-Brock, 1999). Some animals likely returned then to Egypt, Turkey, and Bulgaria with Crusaders returning, and spread into the other Balkan regions during the 12th century (Ferrara, 1964; Borghese, 2005). Since 1980 buffalos have also been introduced to Germany, France, Spain, Portugal, Luxembourg, The Netherlands, Switzerland, and other parts of Europe. Nowadays, the only officially recognized breeds in Europe are the Mediterranean Italian buffalo and the Bulgarian Murrah. Selecting animals for milk traits was initiated in Italy. Crossing with other populations was avoided; a herd book with animals, performance, and morphological traits was established to maintain its unique genetic identity (Iannuzzi and Di Meo, 2009). The primary purpose was the production and marketing of milk and milk derivatives such as mozzarella cheese, one of the “pasta filata” cheeses known worldwide (Zicarelli, 2001).
While local Bulgarian buffalos were a significant European Mediterranean population raised for draft power, meat, and milk purposes, they started to be crossed with Murrah breed since 1972, mainly to improve their performance for milk production. A selection program was initiated to develop a typical Bulgarian Murrah breed for milk with high butterfat content (Borghese, 2005; Borghese and Moioli, 2016).
In Germany, 7,614 buffalos, spread over 16 different regions, are recorded for the year 2020 by an internal communication from the German Buffalo Breeder’s Association. The development of the single nucleotide polymorphism (SNP) genotyping assay specific for river buffalo (Iamartino et al., 2017), Axiom® Buffalo Genotyping Array 90K from Affymetrix, now enables genome analysis of this comparably novel farm animal species and could be useful for the initiation of genetic selection in German buffalo. A subsequent release of the first assembly of the water buffalo genome (Low et al., 2019) further enabled researchers to expand their knowledge about this on a molecular scale. In this study, we sought to explore the genetic diversity and structure of domestic water buffalo populations in Germany and Eastern Europe.
Materials and Methods
Ethics Statement
All sampling occurred as part of commercial buffalo breeding programs and strictly adhered to national and international laws.
Samples Collection, DNA Purification, and Genotyping
Ear tag test samples from 285 female and male buffalos were collected randomly from ten farms during the years 2018 and 2019. Importantly, all breeders were asked to provide samples from unrelated animals. The farms are distributed in Central and Eastern Europe (Figure 1), as listed in Table 1. DNeasy Blood & Tissue Kit (Qiagen, Germany) was used to extract genomic DNA according to the instructions of the manufacturer. Purification and concentration of DNA were measured with a NanoDrop2000 before the normalization to the required concentration (30 ng/μL). The quality control and genotyping using the Axiom® Buffalo Genotyping Array 90K from Affymetrix1 were performed by ATLAS Biolabs GmbH (Berlin, Germany). Allele calling was carried out using Axiom Analysis Suite software V4.0.1 (Applied Biosystems by Thermo Fisher Scientific) following the pipeline for Affymetrix Axiom genotyping workflow (Nicolazzi et al., 2014) and using the last version of buffalo genome assembly (UOA_WB_1) as the reference (Low et al., 2019).
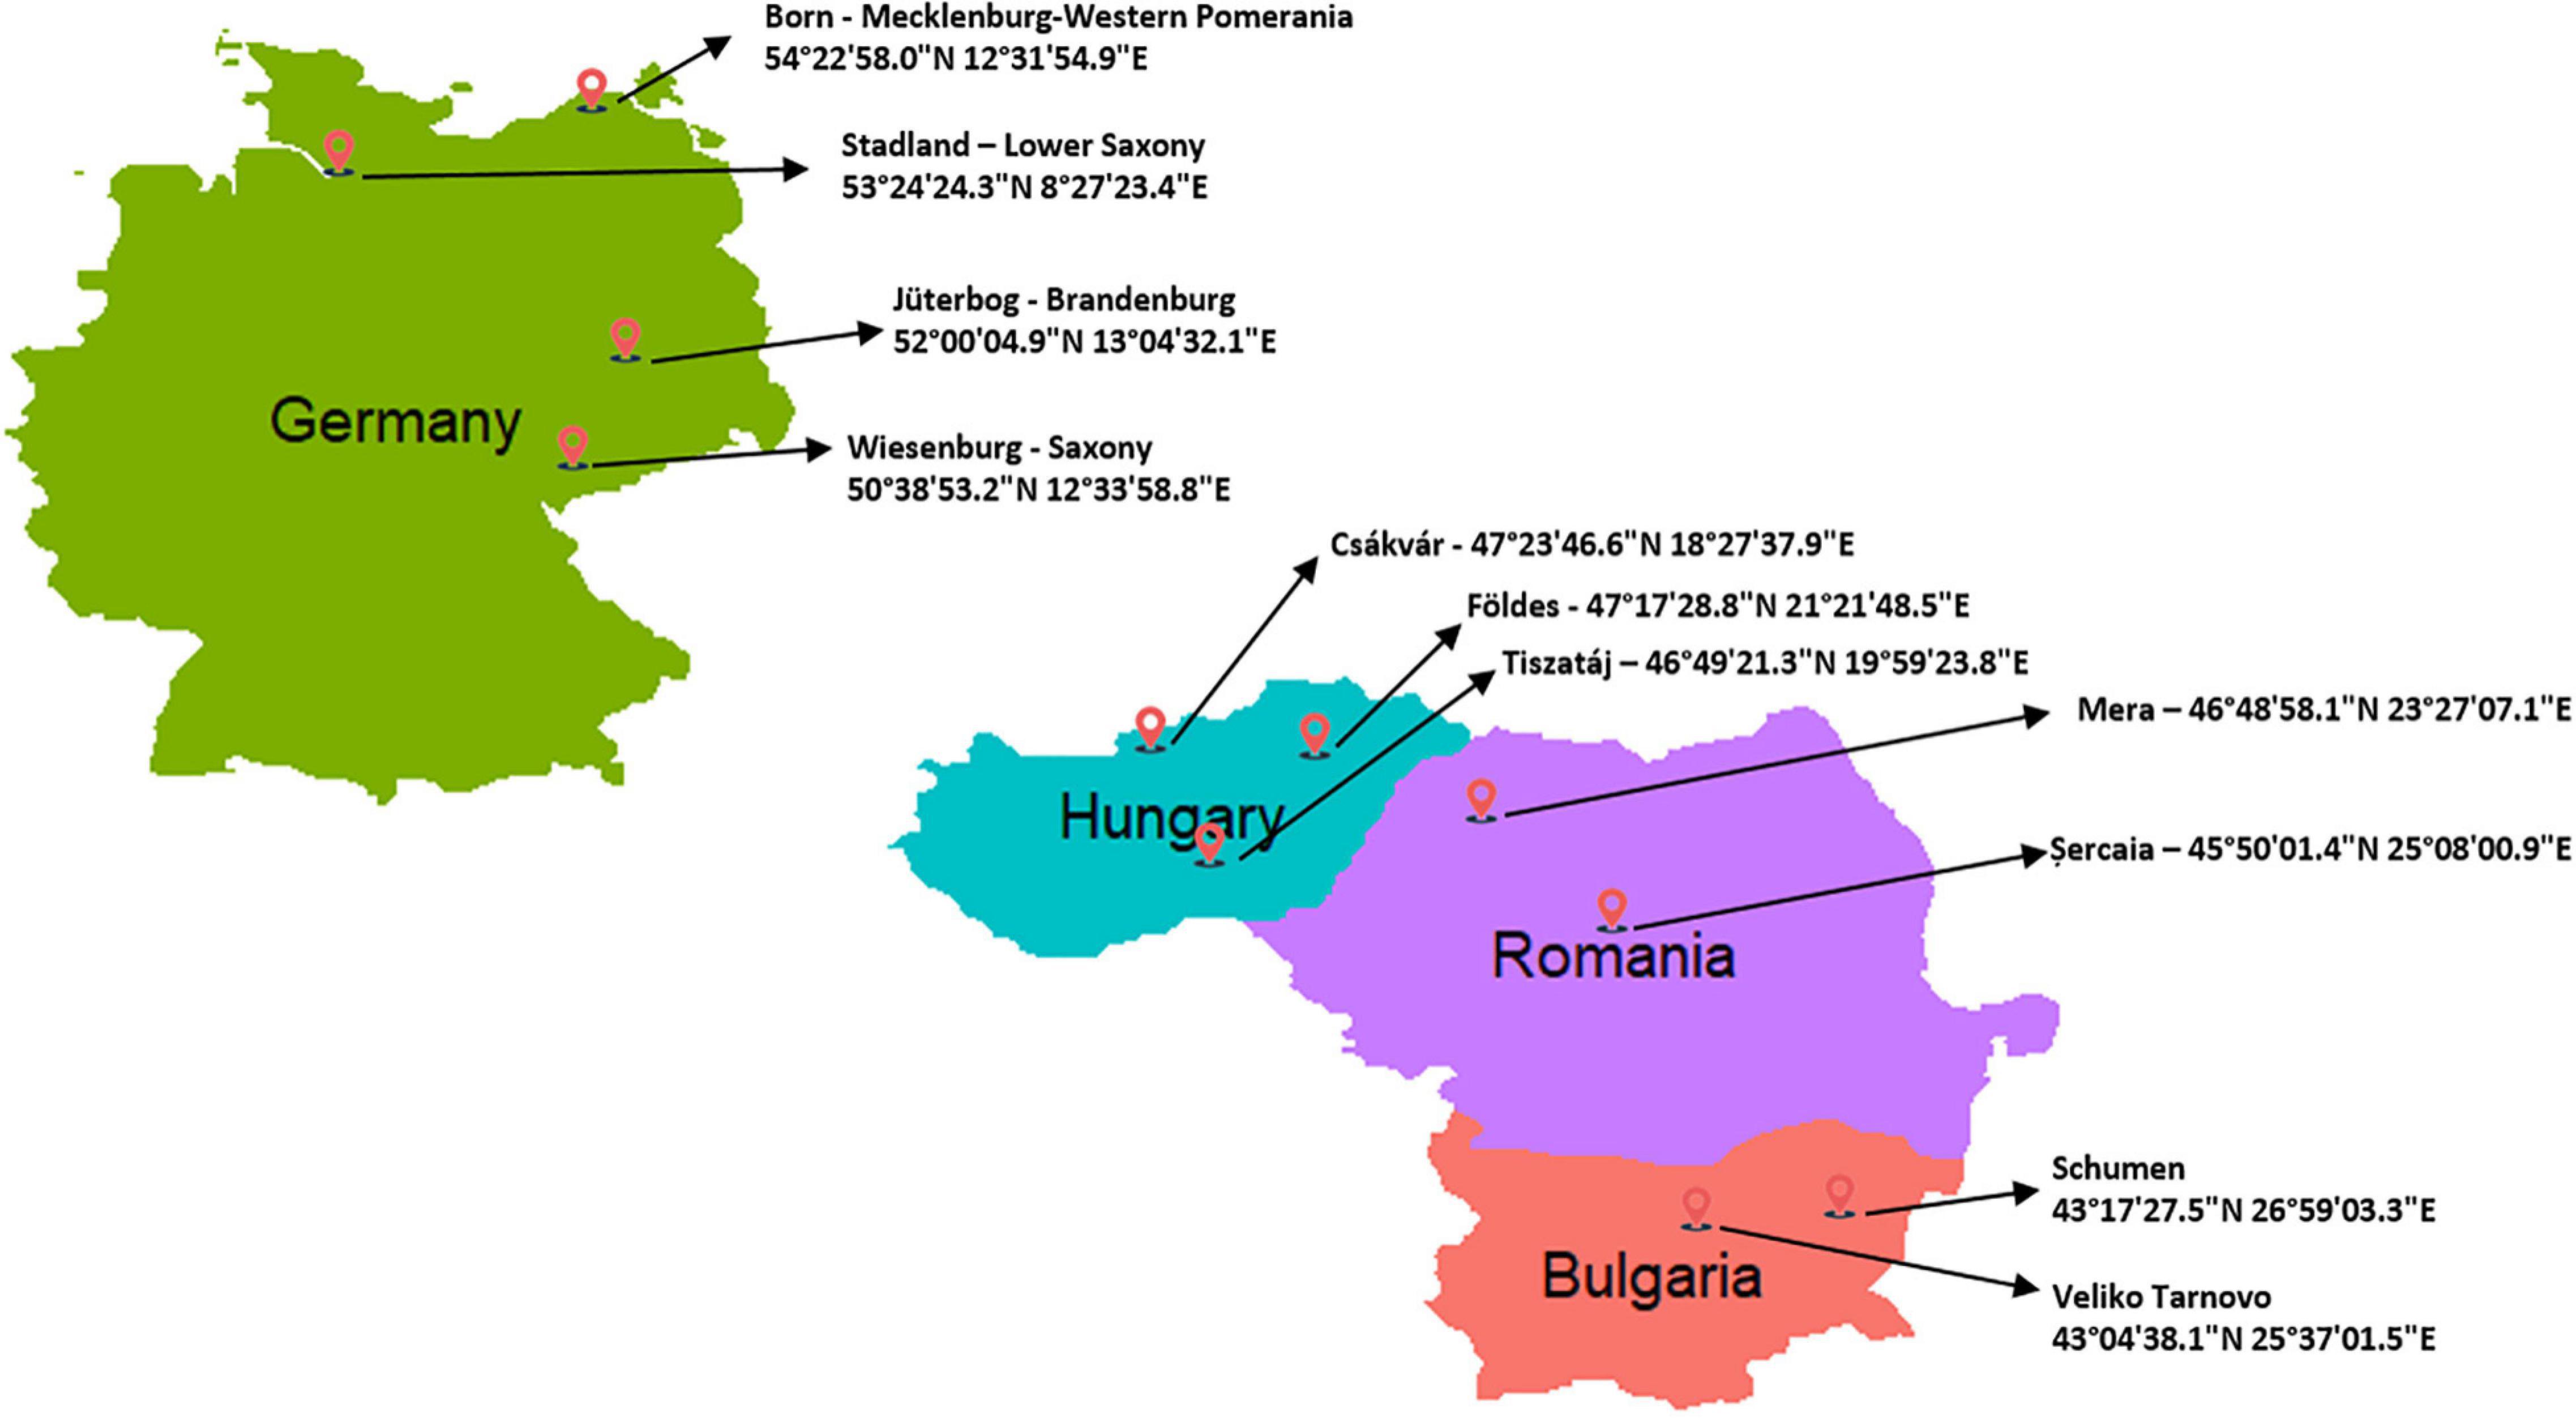
Figure 1. Geographic map showing the locations with specific coordinates the buffalo samples were collected from, genotyped in the current study. The number of samples for each location are reported in Table 1.
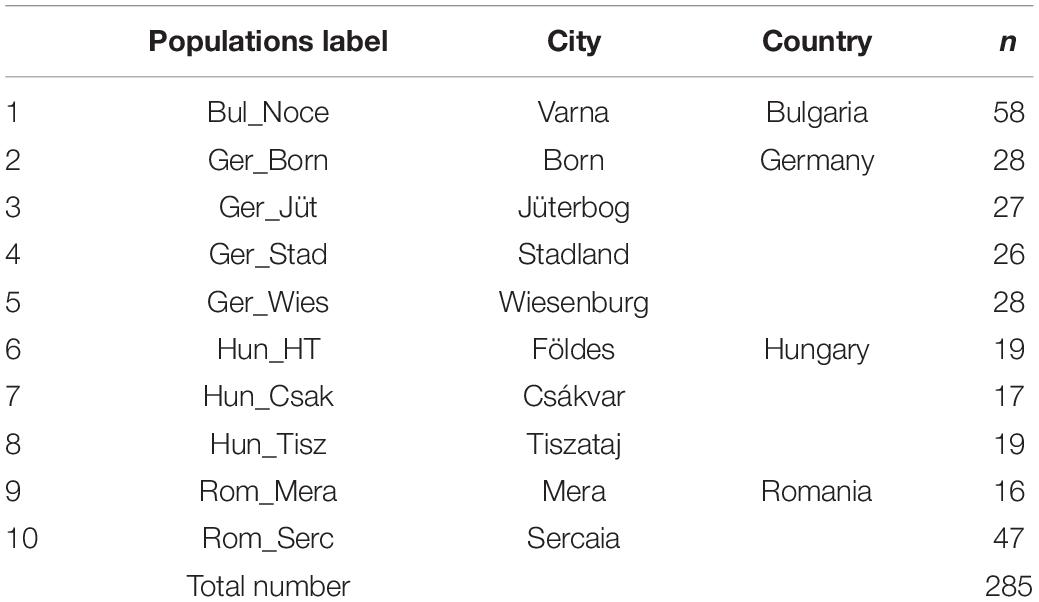
Table 1. River buffalo populations analyzed in the present study (n: samples per population).
Datasets Updating and Merging
We retrieved previously reported datasets from Colli et al. (2018a) and Deng et al. (2019a) available in the Dryad Repository (Table 2).2 To solve the incongruity between the marker positions when merging genotypes, we retained only those SNPs that were common in the three data sets. We further removed SNPs which mapped on sexual and mitochondrial bases, as well as those with unknown chromosome coordinates to perform an autosomal analysis. The remaining panel of 36,759 SNPs was then updated to the last version of the water buffalo genome (UOA_WB_1) through the commands –update-map, –update-chr, –update-alleles of PLINK V1.7 software (Purcell et al., 2007). The three datasets were then merged using the merge module in PLINK. Individually, the quality control filters were applied to remove variants with a minor allele frequency lower than 0.05 or a rate of missing genotyping >10%. The final dataset consisted of 36,014 SNPs and 477 individuals to perform the subsequent genetic population and structure analyses (Supplementary Table 1).
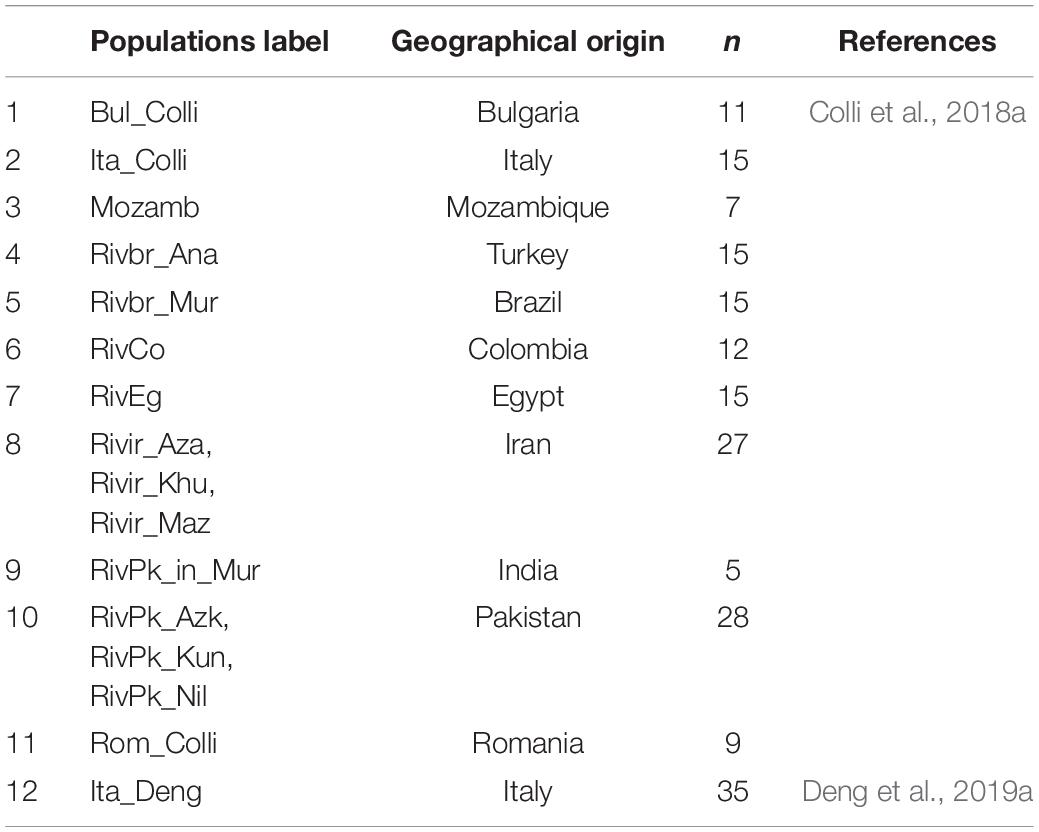
Table 2. Populations of buffalo with publicly available genotype data included in the present genome analysis (n: samples per population).
Genetic Relationship and Population Structure
A multidimensional scaling (MDS) analysis was performed to explore the genetic relationship between four different buffalo populations. To this end, a symmetric matrix of the identity-by-state (IBS) distances, for all pairs of individuals, was generated in PLINK V1.7 software (Purcell et al., 2007) based on the proportion of alleles shared and visualized using ggplot R package (Wickham, 2016). Observed (Ho) and Expected (He) heterozygosity for ten buffalo populations genotyped in this study (Bulgaria, Germany, Hungary, and Romania) were also estimated using PLINK V1.7 (Purcell et al., 2007). The maximum-likelihood approach was used to estimate the population structure through ADMIXTURE V1.3 Software (Alexander et al., 2009) with default parameters. This software modulates the probability of the observed genotypes considering the ancestry proportion and population allele frequencies. The best number of clusters (K-value) is estimated by the model as that reporting the lower cross-validation error. As an additional approach for the analysis of the population structure, a phylogenetic tree was built using the R package APE (Paradis and Schliep, 2019) based on computed Wright’s Fixation Index (FST) (Wright, 1965) matrix obtained with Arlequin 3.5 (Excoffier and Lischer, 2010).
Run of Homozygosity
Analysis of run of homozygosity (ROH) was exclusively conducted on Central and East Europe buffalo populations genotyped in this study (Table 1) and based on a panel of 61,813 autosomal SNPs available after the application of quality control filters, described above, to eliminate sexual, mitochondrial, and unknown chromosome coordinate SNPs, as well as those with a minor allele frequency lower than 0.01 and rate of missing genotyping >10%. The detection of ROH was performed using PLINK V1.7 (Purcell et al., 2007), a sliding window of 1,000 kb was designed to detect regions matching the following parameters: minimum size of 50 SNPs (–homozyg-snp 50), minimum density of SNPs of 1 SNP every 100 kb (–homozyg-density 100). We allowed one heterozygous SNP (–homozyg-window-het 1), a distance of homozygosity SNPs within the window of 250 kb (–homozyg-gap 250), and two missing SNPs (–homozyg-window-missing 2) per ROH. The identified ROH were cataloged in four categories according to its length: 1–5 Mb, 5–15 Mb, 15–30 Mb, and >30 Mb. Afterward, from ROH, we also calculated the inbreeding coefficient (FROH) using R package “DetectRUN” (Biscarini et al., 2018) and applying the formula:
ΣLROH is the sum of the length of ROH for each individual, and Lgenome is the length of the genome analyzed, which was around 2.65 Gb in buffalo.
The frequency of occurrence of SNPs into an ROH was analyzed, identifying the genomic regions most commonly associated with ROH. Regions were selected containing the top 1% of most common ROH-associated SNPs (ROH hotspots or ROH islands) (Purfield et al., 2017; Mastrangelo et al., 2018). Graphical visualization was performed using R package qqman (Turner, 2014) by constructing Manhattan plots. For the identification of genomic regions associated with ROH hotspots, we used NCBI map viewer of the water buffalo UOA_WB_1. Functional annotation was performed by the use of DAVID V6.8 (Huang et al., 2009) and PANTHER (Thomas et al., 2003) software. The analysis pipeline applied in this study is provided as a flow chart (Figure 2).
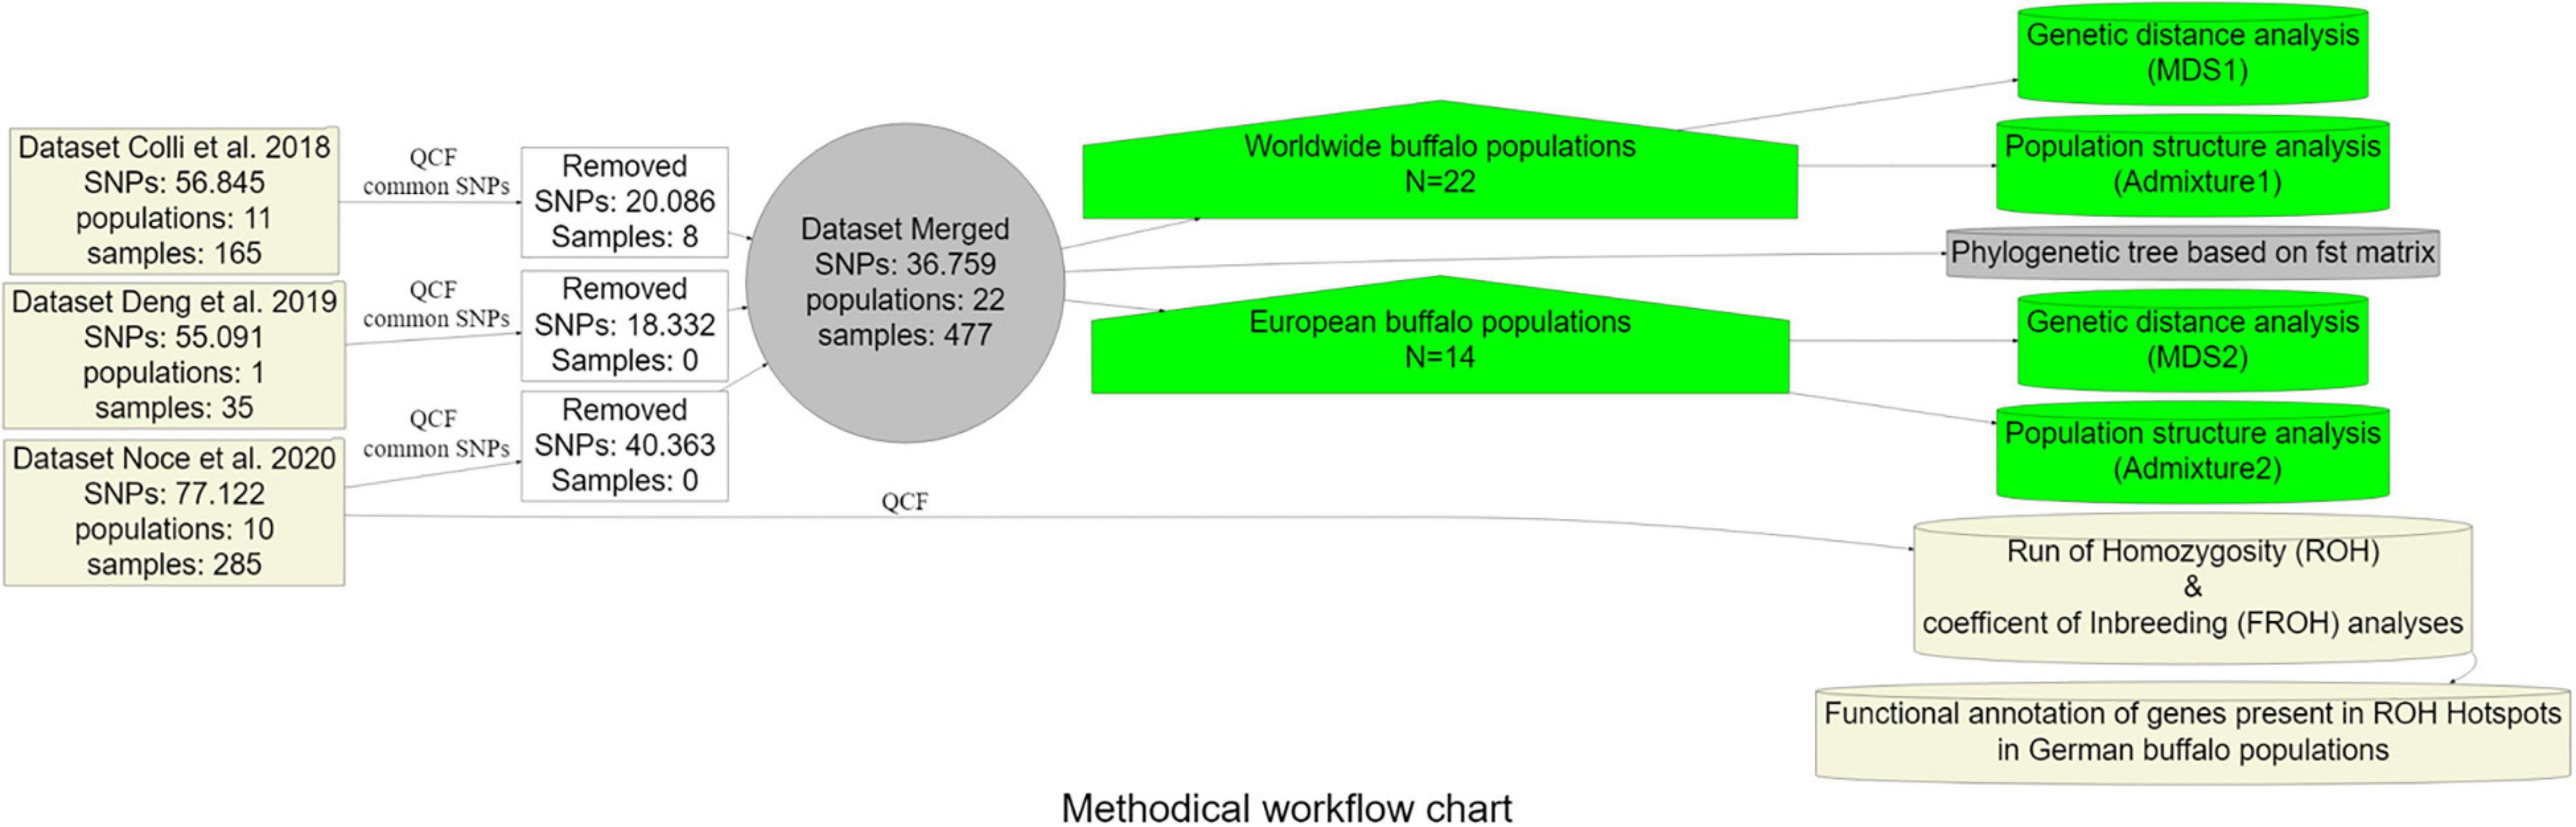
Figure 2. Methodical workflow chart summarizing the analysis pipeline followed in the current study. QCF = Quality control filters (MAF < 0.05, -geno 0.01, -mind 0.01).
Results
Analysis of Genetic Diversity and Population Structure
The MDS plot (Figure 3A) of 22 buffalo populations (Tables 1, 2) with different geographic distributions revealed a clear separation of European buffalo from other populations distributed worldwide. Indian-Pakistan and Latino-American buffalos were presented in a single cluster together with Bulgarian Murrah buffalos as the only exception of a European population. Four different groups could be distinguished in the rest of the European population: the Hungarian cluster, which included all three farms, the Romanian cluster, which showed one farm separated from the others (Rom_Serc), the Italian cluster, which included samples from Mozambique, and a German cluster from Brandenburg (Ger_Jüt), which was separated from the other populations. The remaining animals from Germany were mixed and scattered between Romanian and Italian populations. The admixture analysis carried out on genetic information from 22 buffalo populations available with global distribution (Figure 3B) revealed a higher diversity among European populations than groups from India, Pakistan, the Middle East, and Latin America. K = 4 evidenced that the Bulgarian buffalos form the only European population that shared a high average of alleles with the non-European groups. The Romanian group showed mixed ancestry, except for Rom_Serc. Low admixture levels were found in the Hungarian group. A high admixture of buffalo was found in all German farms, noticeably with a different structure in the buffalo from Brandenburg (Ger_Jüt). In Figure 4, we aimed to focus on the relative genetic distance and structure exclusively among European populations (N = 14). The MDS plot (Figure 4A) showed that after excluding Mozambique buffalos, the Italian samples were presented as a more homogenous and distinct cluster. The same appeared for the two Bulgarian populations. Furthermore, animals from two German farms (Lower Saxony – Ger_Stad, Mecklenburg-Western Pomerania – Ger_Born) had relations to the Italian cluster, while animals from Saxony (Ger_Wies) appeared to be related more closely to the Romanian buffalos. Buffalos from Brandenburg (Ger_Jüt) could be positioned closer to the Bulgarian cluster. From K = 6 of admixture analysis including exclusively European populations (Figure 4B), three principal components were distinguished in Central and Southeast Europe: the Mediterranean pattern, including Italian and German populations, the Hungarian-Romanian, and the Bulgarian ones. Buffalos from farms in Germany displayed several mixed components, Lower Saxony buffalos (G_Stad) had a higher proportion of Italian Mediterranean background compared to herds in Mecklenburg-Western Pomerania (G_Born) and Saxony (G_Wies). Saxonian buffalos (G_Wies) showed a consistent portion of alleles from Romania, while the comparison at K = 4 and 6 revealed that buffalos from Brandenburg (G_Jüt) mainly contained Bulgarian genetic background.
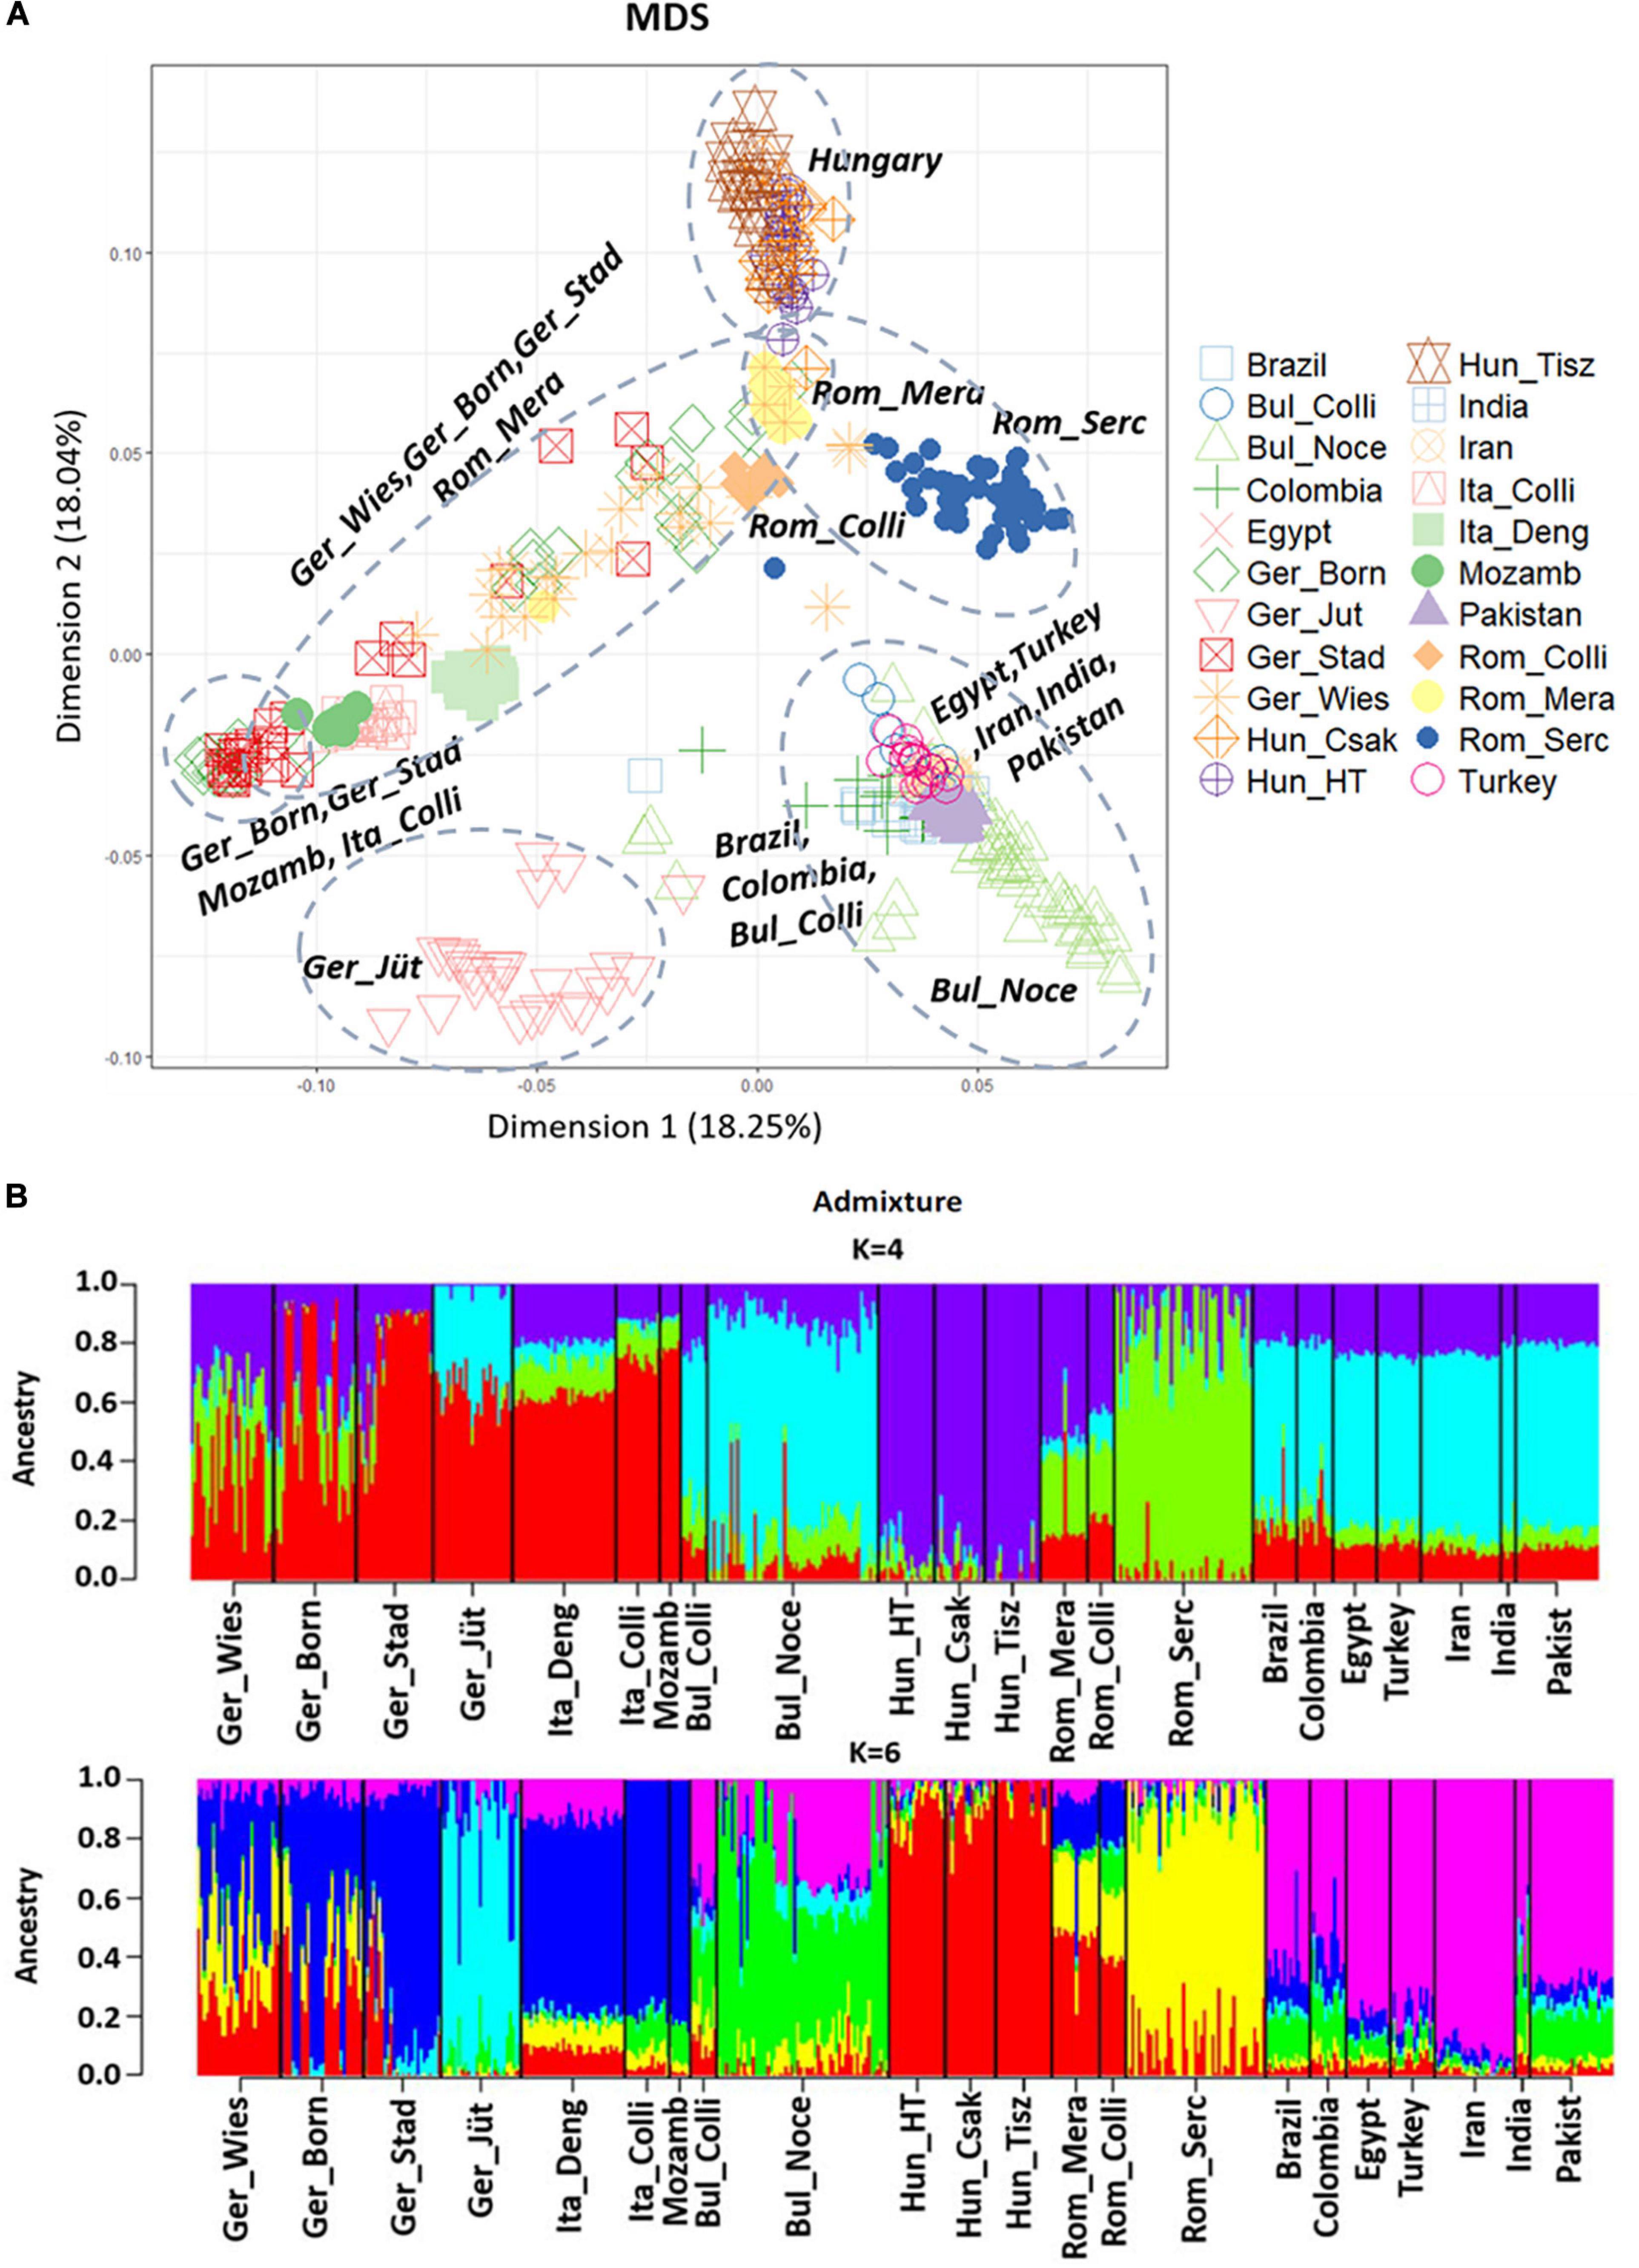
Figure 3. (A) Multi-Dimensional Scaling (MDS) plot based on genome-wide identity-by-state pairwise inferred with PLINK V1.7, including 36.014 SNPs from 477 individuals. This plot shows the genetic distance between all the 22 populations analyzed worldwide and published in part (Colli et al., 2018a; Deng et al., 2019a). The percentage of variances captured for each dimension is reported in brackets. The dashed circles mark the populations that cluster together. (B) Admixture analysis results at K = 4 and 6, including 22 buffalo populations worldwide. K values indicate the number of ancestries estimation (clusters), K = 6 was the best fitting solution for the lowest cross-validation error reported (CV = 0.61856). Populations are divided by a vertical black line, and it is partitioned into K colored segments that represent the population’s estimated membership fractions in K clusters. The 22 populations are localized in Germany (Ger_Wies, Wiesenburg, n = 28: Ger_Born, Born, n = 28; Ger_Stad, Stadland, n = 26; Ger_Jüt, Jüterbog, n = 27), Italy (Ita_Deng according to Deng et al., 2019a, n = 35; Ita_Colli according to Colli et al., 2018a, n = 15), Mozambique (Mozamb according to Colli et al., 2018a, n = 7), Bulgaria (Bul_Colli according to Colli et al., 2018a, n = 11), Bulgaria (Bul_Noce, n = 58), Hungary (Hun_HT, Földes, n = 19; Hun_Csak, Csákvar, n = 17; Hun_Tisz, Tiszataj, n = 19), Romania (Rom_Colli according to Colli et al., 2018a, n = 9; Rom_Mera, Mera, n = 16; Rom_Serc, Sercaia, n = 47), and also according to Colli et al., 2018a: Brazil (n = 15), Colombia (n = 12), Egypt (n = 15), Turkey (n = 15), Iran (n = 27), India (n = 5), and Pakistan (n = 28). Population labels and the number of individuals of both analyses are reported in Tables 1, 2.
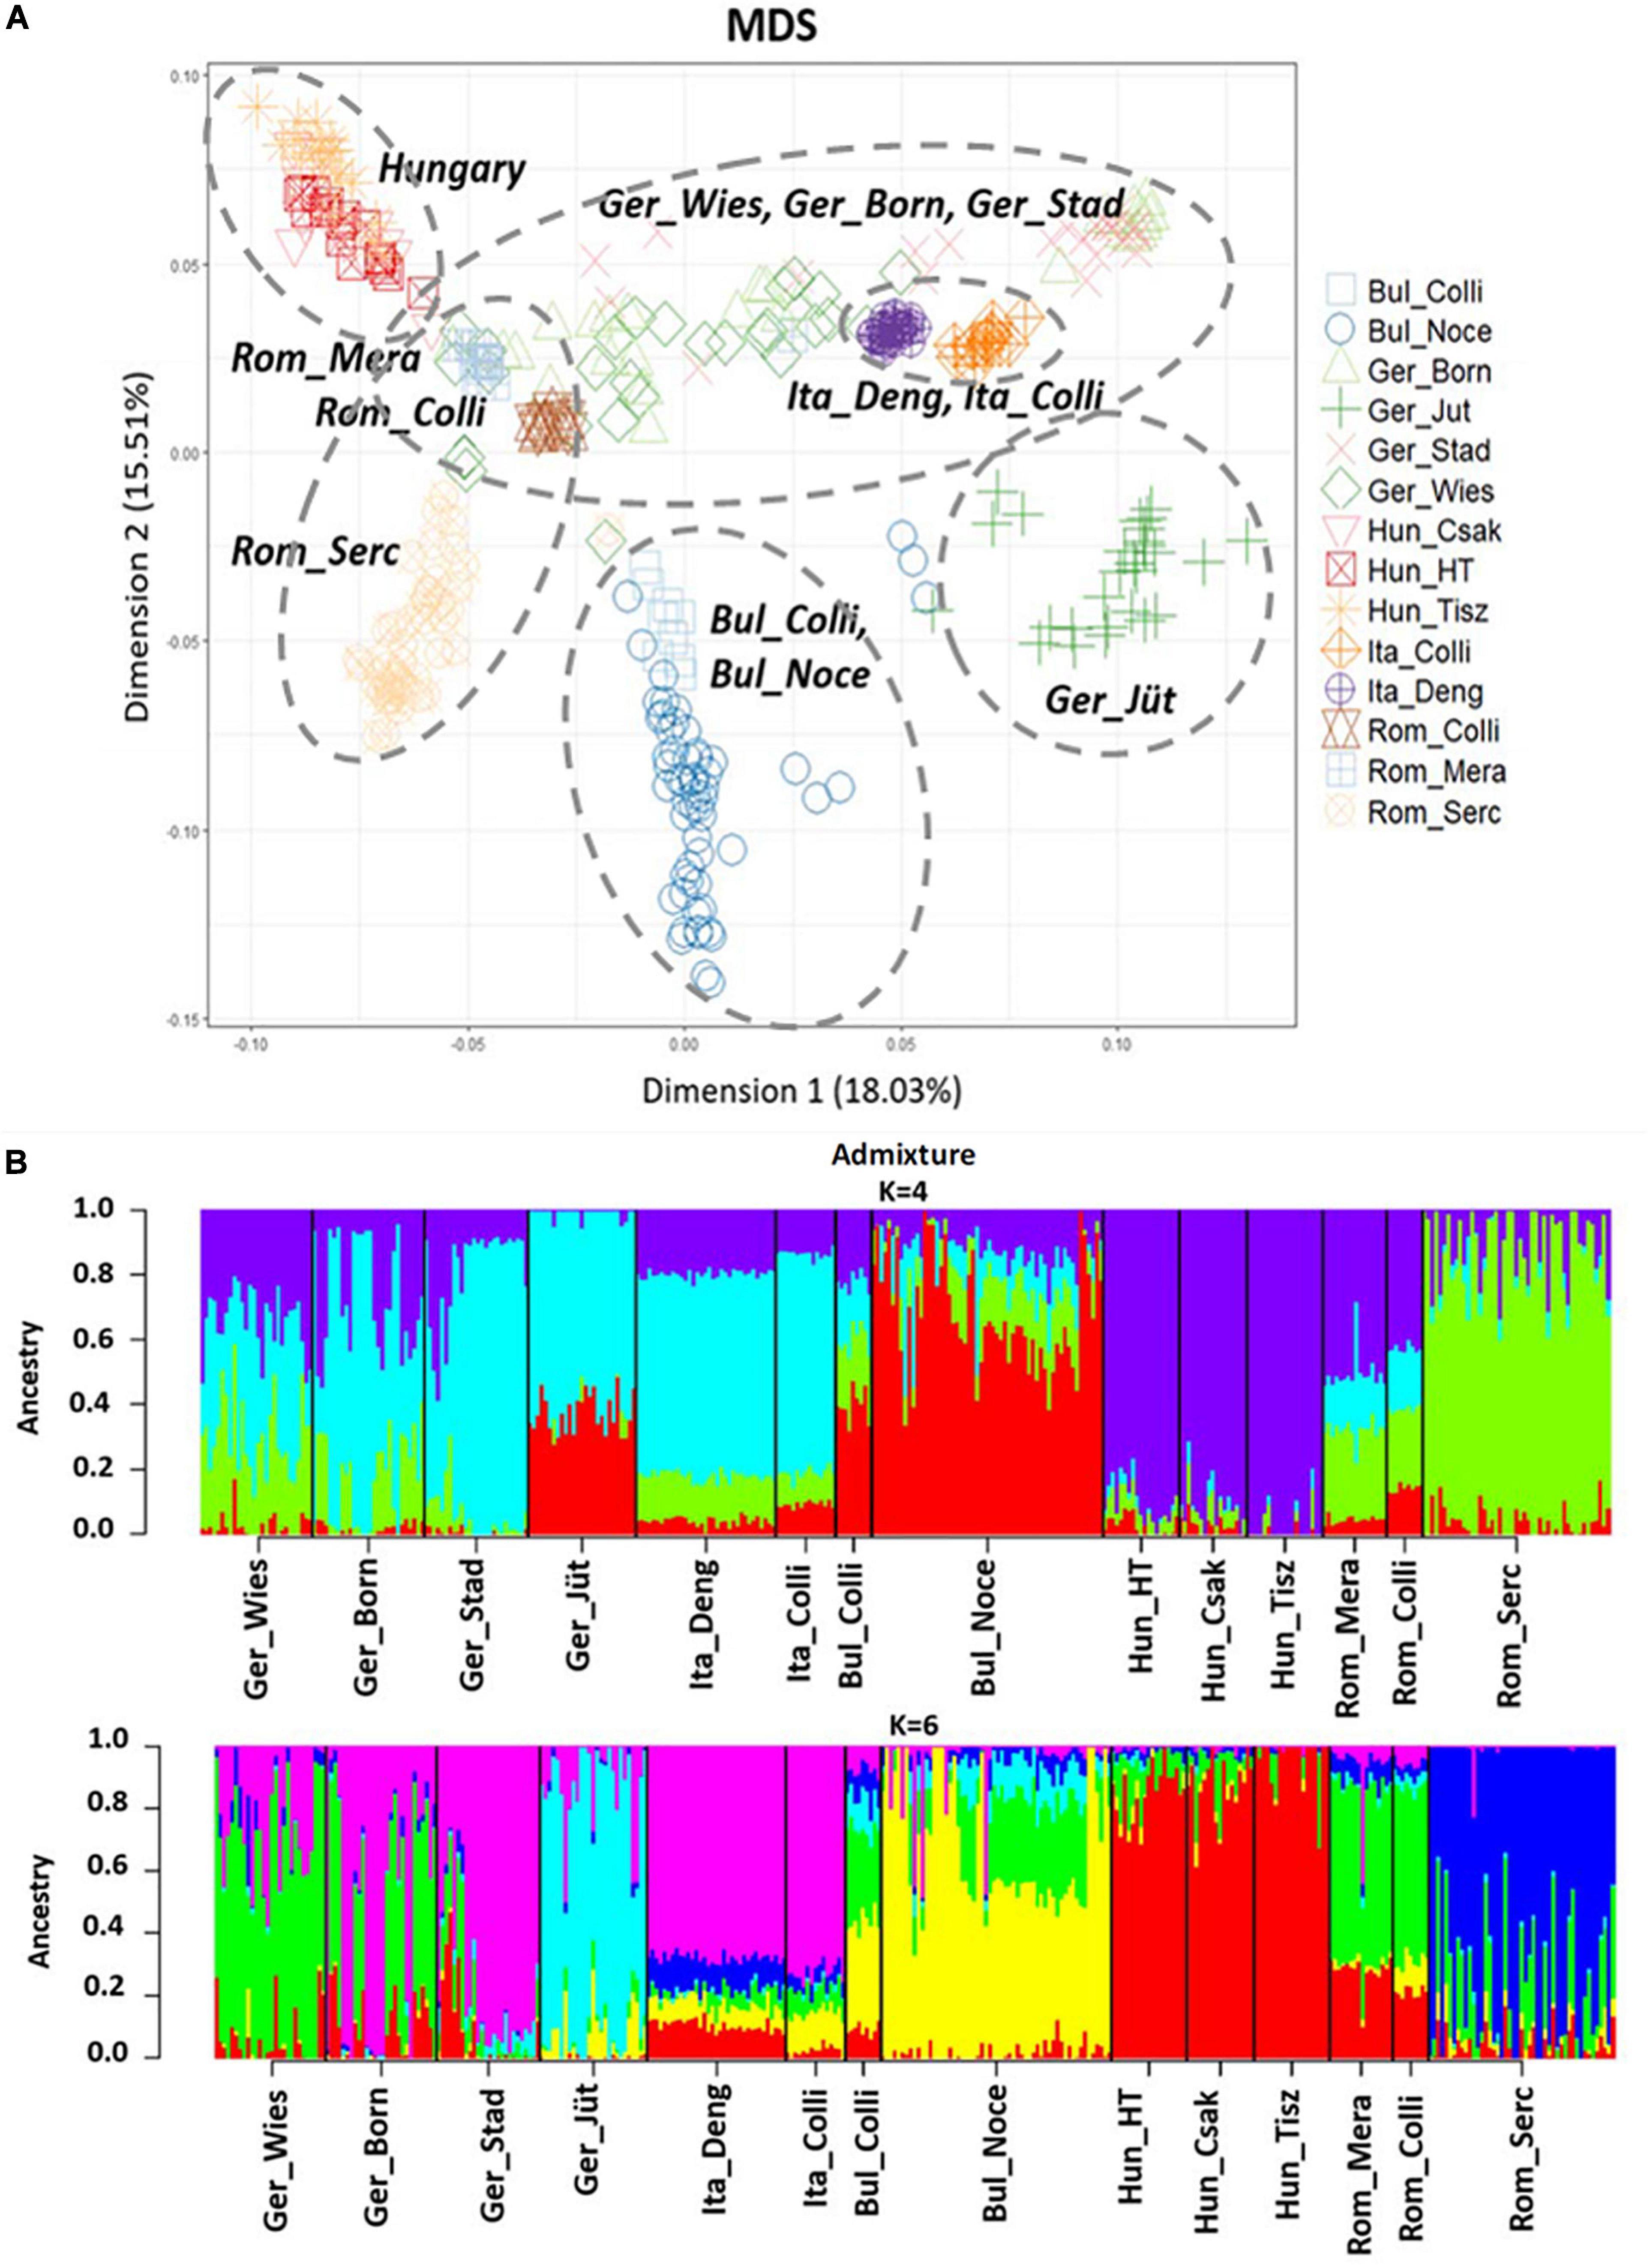
Figure 4. (A) Multidimensional scaling (MDS) plot based on European buffalo populations available in this work. The dashed circles mark the populations that cluster together. (B) Admixture analysis results at K = 4 and 6 exclusively in European buffalo populations. K = 6 was the best fitting solution for the lowest cross-validation error reported (CV = 0.59712). Abbreviations and sample numbers are specified in Figure 3.
The results of the heterozygosity metric ranged from Bulgaria to Hungary (Hung_Csak, Hung_Tisz) with 0.41–0.35 for observed values (Ho) and 0.40–0.35/0.32 for expected values (He), respectively. Similar heterozygosity values were found in the Hungarian and Romanian samples, lowest in relation to the other population groups (from 0.35 to 0.38 Ho and from 0.32 to 0.36 He), while German buffalos had the highest values of diversity, after the Bulgarian buffalo population, between groups, and within its group (Table 3). To support the interpretation of the Admixture and MDS analyses, we also measured the population differentiation due to genetic structure by an FST pairwise distance analysis of 36,014 SNPs in all individuals of 22 populations distributed worldwide. The phylogenetic tree based on the FST index matrix (Supplementary Table 2) was consistent with the Admixture analysis (Figure 5). Two principal groups defined the difference between the Italian Mediterranean and the Murrah breeds. Along with the Italian group, Mozambique and three German herds, including Mecklenburg-Western Pomerania (Ger_Born), Lower Saxony (Ger_Stad), and Brandenburg (Ger_Jüt) clustered, while Brandenburg formed a separate branch. In the second group, Murrah breeds from Pakistan and India clustered with Latino America, Middle East, and Bulgarian samples. Hungarian and Romanian buffalos stood out, while animals from Saxony (Ger_Wies) grouped with animals from Romanian clusters.
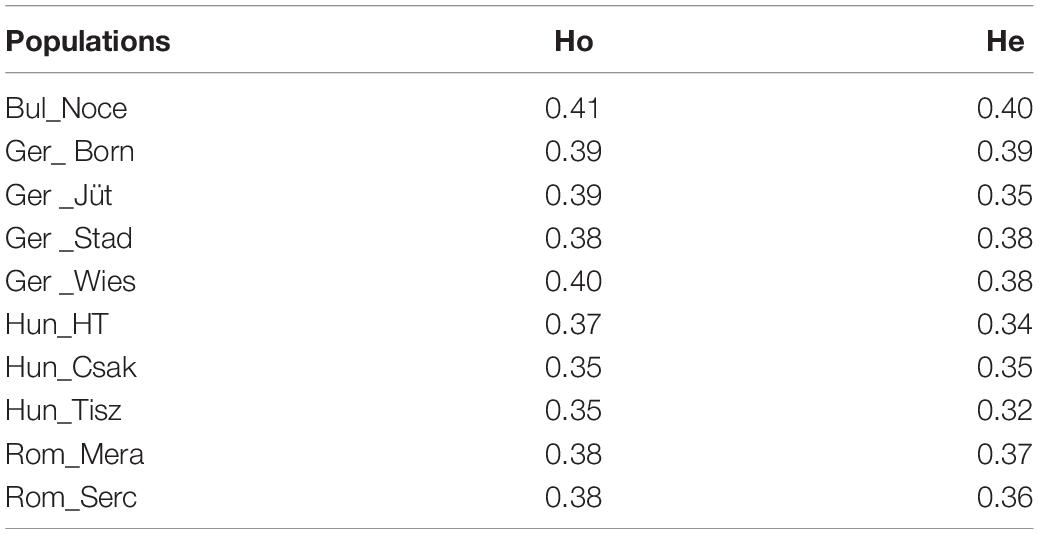
Table 3. Observed (Ho) and expected (He) heterozygosity of buffalo populations de novo genotyped distributed in Bulgaria, Germany, Hungary, and Romania (abbreviations are defined in Table 1).
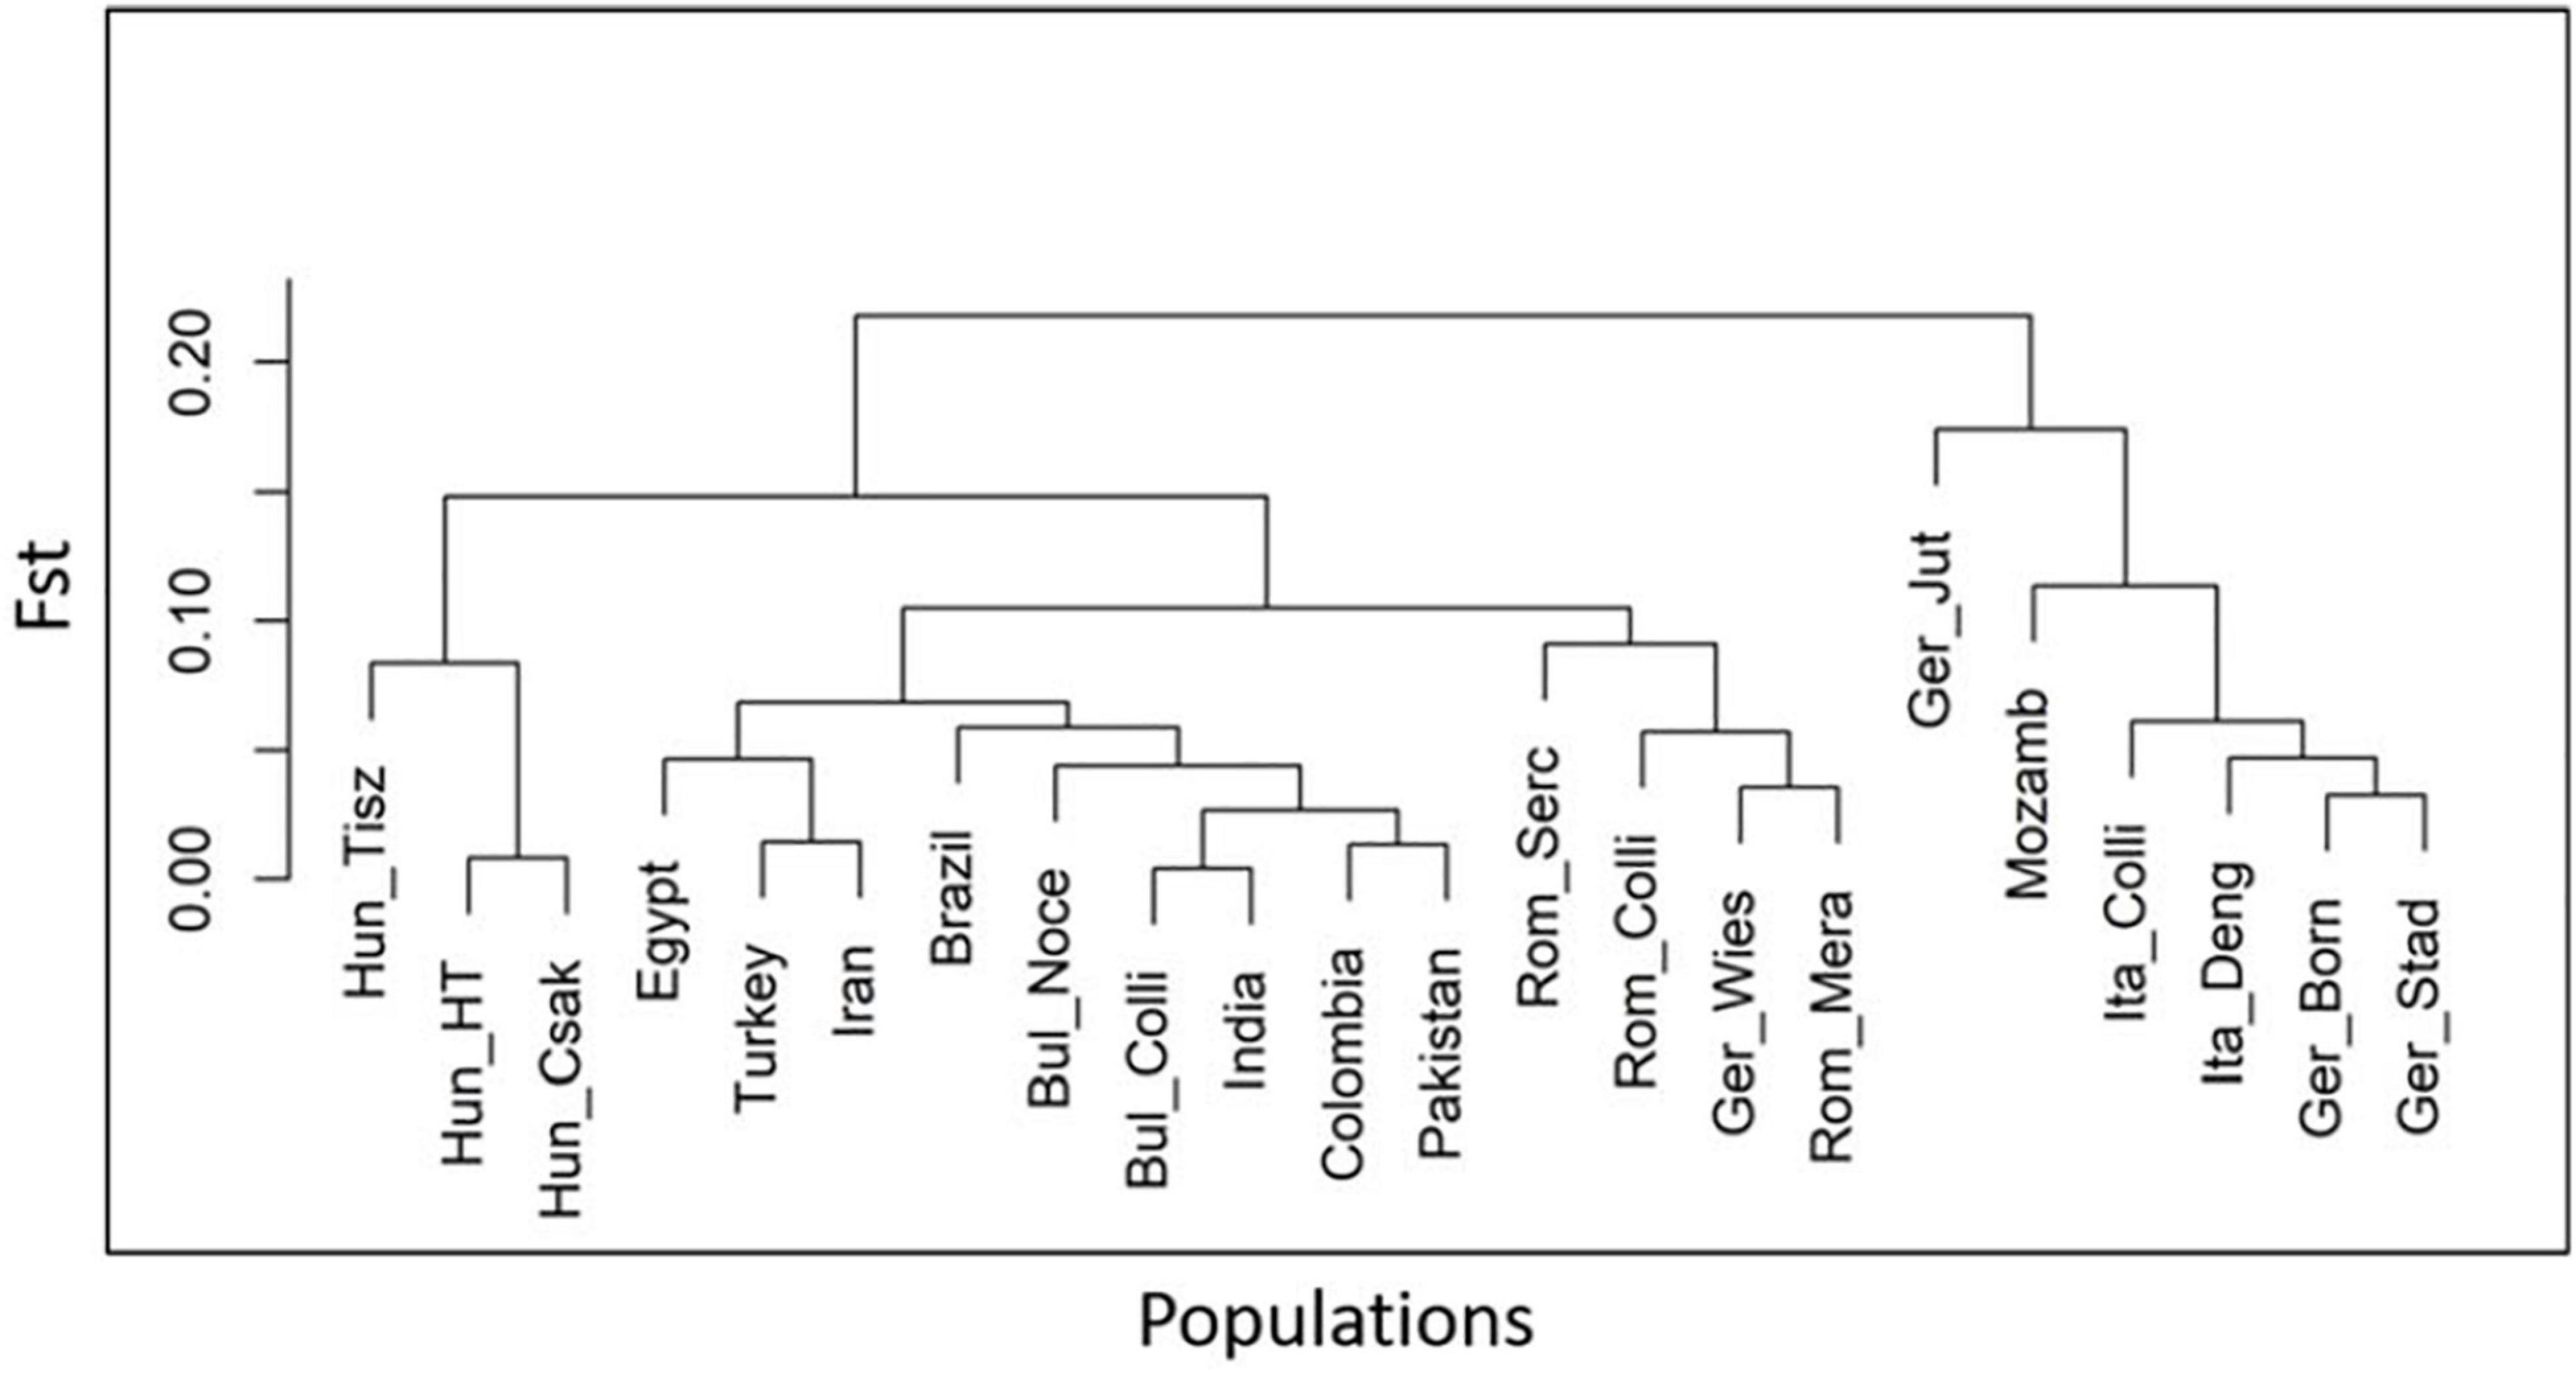
Figure 5. Phylogenetic tree indicating the genetic distance of 22 buffalo populations, analyzed and published in part (Colli et al., 2018a; Deng et al., 2019a), with worldwide distributions based on the fixation index (FST) matrix obtained from 36,014 SNPs in 477 individuals using Arlequine software. Abbreviations and sample numbers are specified in Figure 3.
Run of Homozygosity
In order to make better use of all information and to learn about the demographic past and/or recent history of the buffalo populations of Central and Southeast Europe, we performed an ROH analysis based on 285 samples genotyped in this study (Table 1), for which a panel of 61,813 autosomal SNPs was available (Figure 6). We found 10,797 ROH regions distributed in four categories (0–5, 5–15, 15–30, >30 Mb) with patterns different for each population. Among German buffalos, Ger_Born had the highest average of ROH in 0–5 Mb size category, indicative of ancient inbreeding, which decreased in all the other categories. Ger_Jüt showed the opposite trend, with the highest average in the long ROH category (>30 Mb), suggestive of the small effective population size and more recent inbreeding. The highest average of both short and long ROH categories was found in Ger_Stad. Buffalos from Saxony (Ger_Wies) showed an average of ROH quite similar in all categories except a decrease in the 5–15 Mb category. Figure 7 displays an average inbreeding coefficient calculated from the individual sum of ROH tracts per population, and in Table 4, the corresponding values are reported. The Bulgarian buffalo population had the lowest average of homozygosity in the genome (116.93 Mb) and, consequently, the lowest level of inbreeding (FROH = 0.047). Romanian samples from Mera village had 185.31 Mb of the genome in ROH with an FROH of 0.074, lower than the second farm (Rom_Serc) with 252.31 Mb and FROH 0.102. The buffalo population in Mera (Rom_Mera) is distributed in smaller herds from multiple private farms. The second Romanian population (Rom_Serc) studied here is located in Sercaia and is managed by the Institute of Research and Development for Buffalo Breeding. Buffalos from Sercaia were characterized by ancient inbreeding, showing the highest proportion of ROH in the category 5–15 Mb. These values are in agreement with the results presented in Figure 6, where both Romanian buffalo populations presented a different trend of ROH categories. Hungarian buffalos had high ROH in their genome and high inbreeding due to a small population size reflected in the different values within the farms Csákvar (Hun_Csak) and Tiszataj (Hun_Tisz) with the highest FROH (0.144 and 0.173), Földes (Hun_HT) with lower FROH (0.121). The different values of FROH obtained within the German group were an indication of the high variability between farms (Table 4).
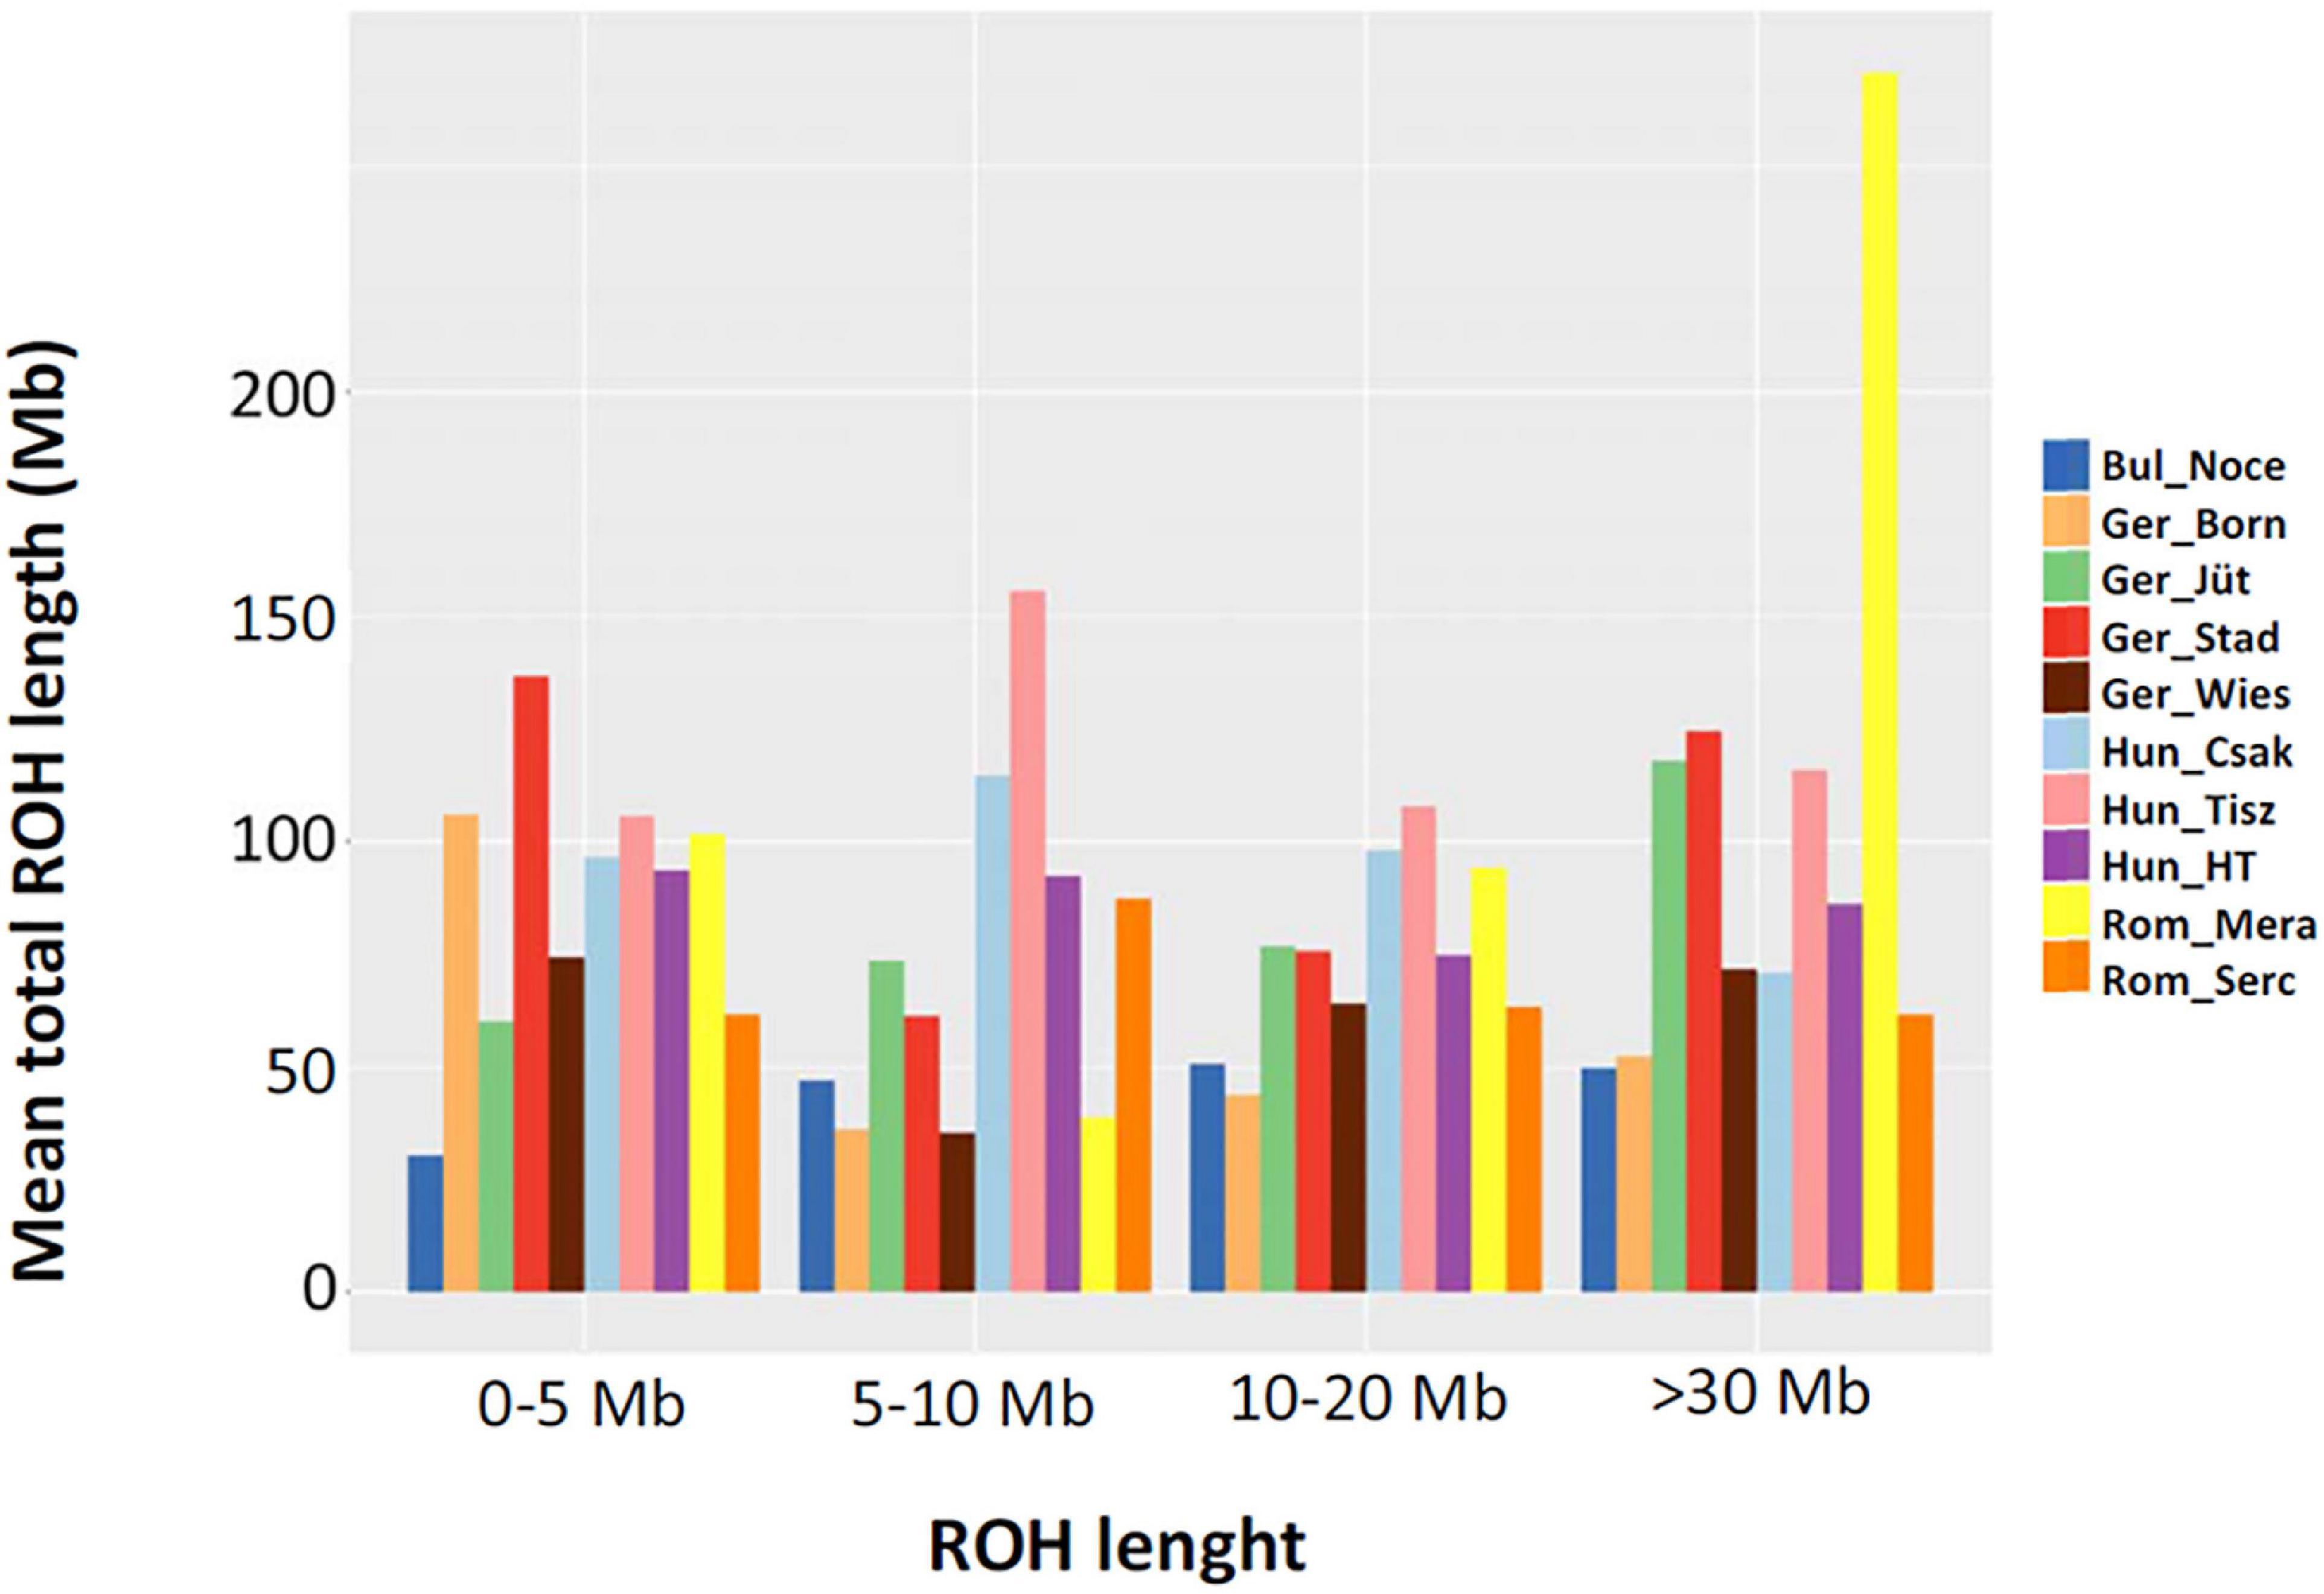
Figure 6. The mean sum of runs of homozygosity (ROH) per population within each ROH length category in samples collected from buffalos in Bulgaria (Bul_Noce), Romania (Rom_Mera, Rom_Serc), Hungary (Hun_Csak, Hun_Tisz, Hun_HT), and Germany (Ger_Born, Ger_Jüt, Ger_Stad, Ger_Wies). Data include 61,813 SNPs genotyped in 285 samples (Mb: megabase); all other abbreviations and sample numbers are specified in Figure 3.
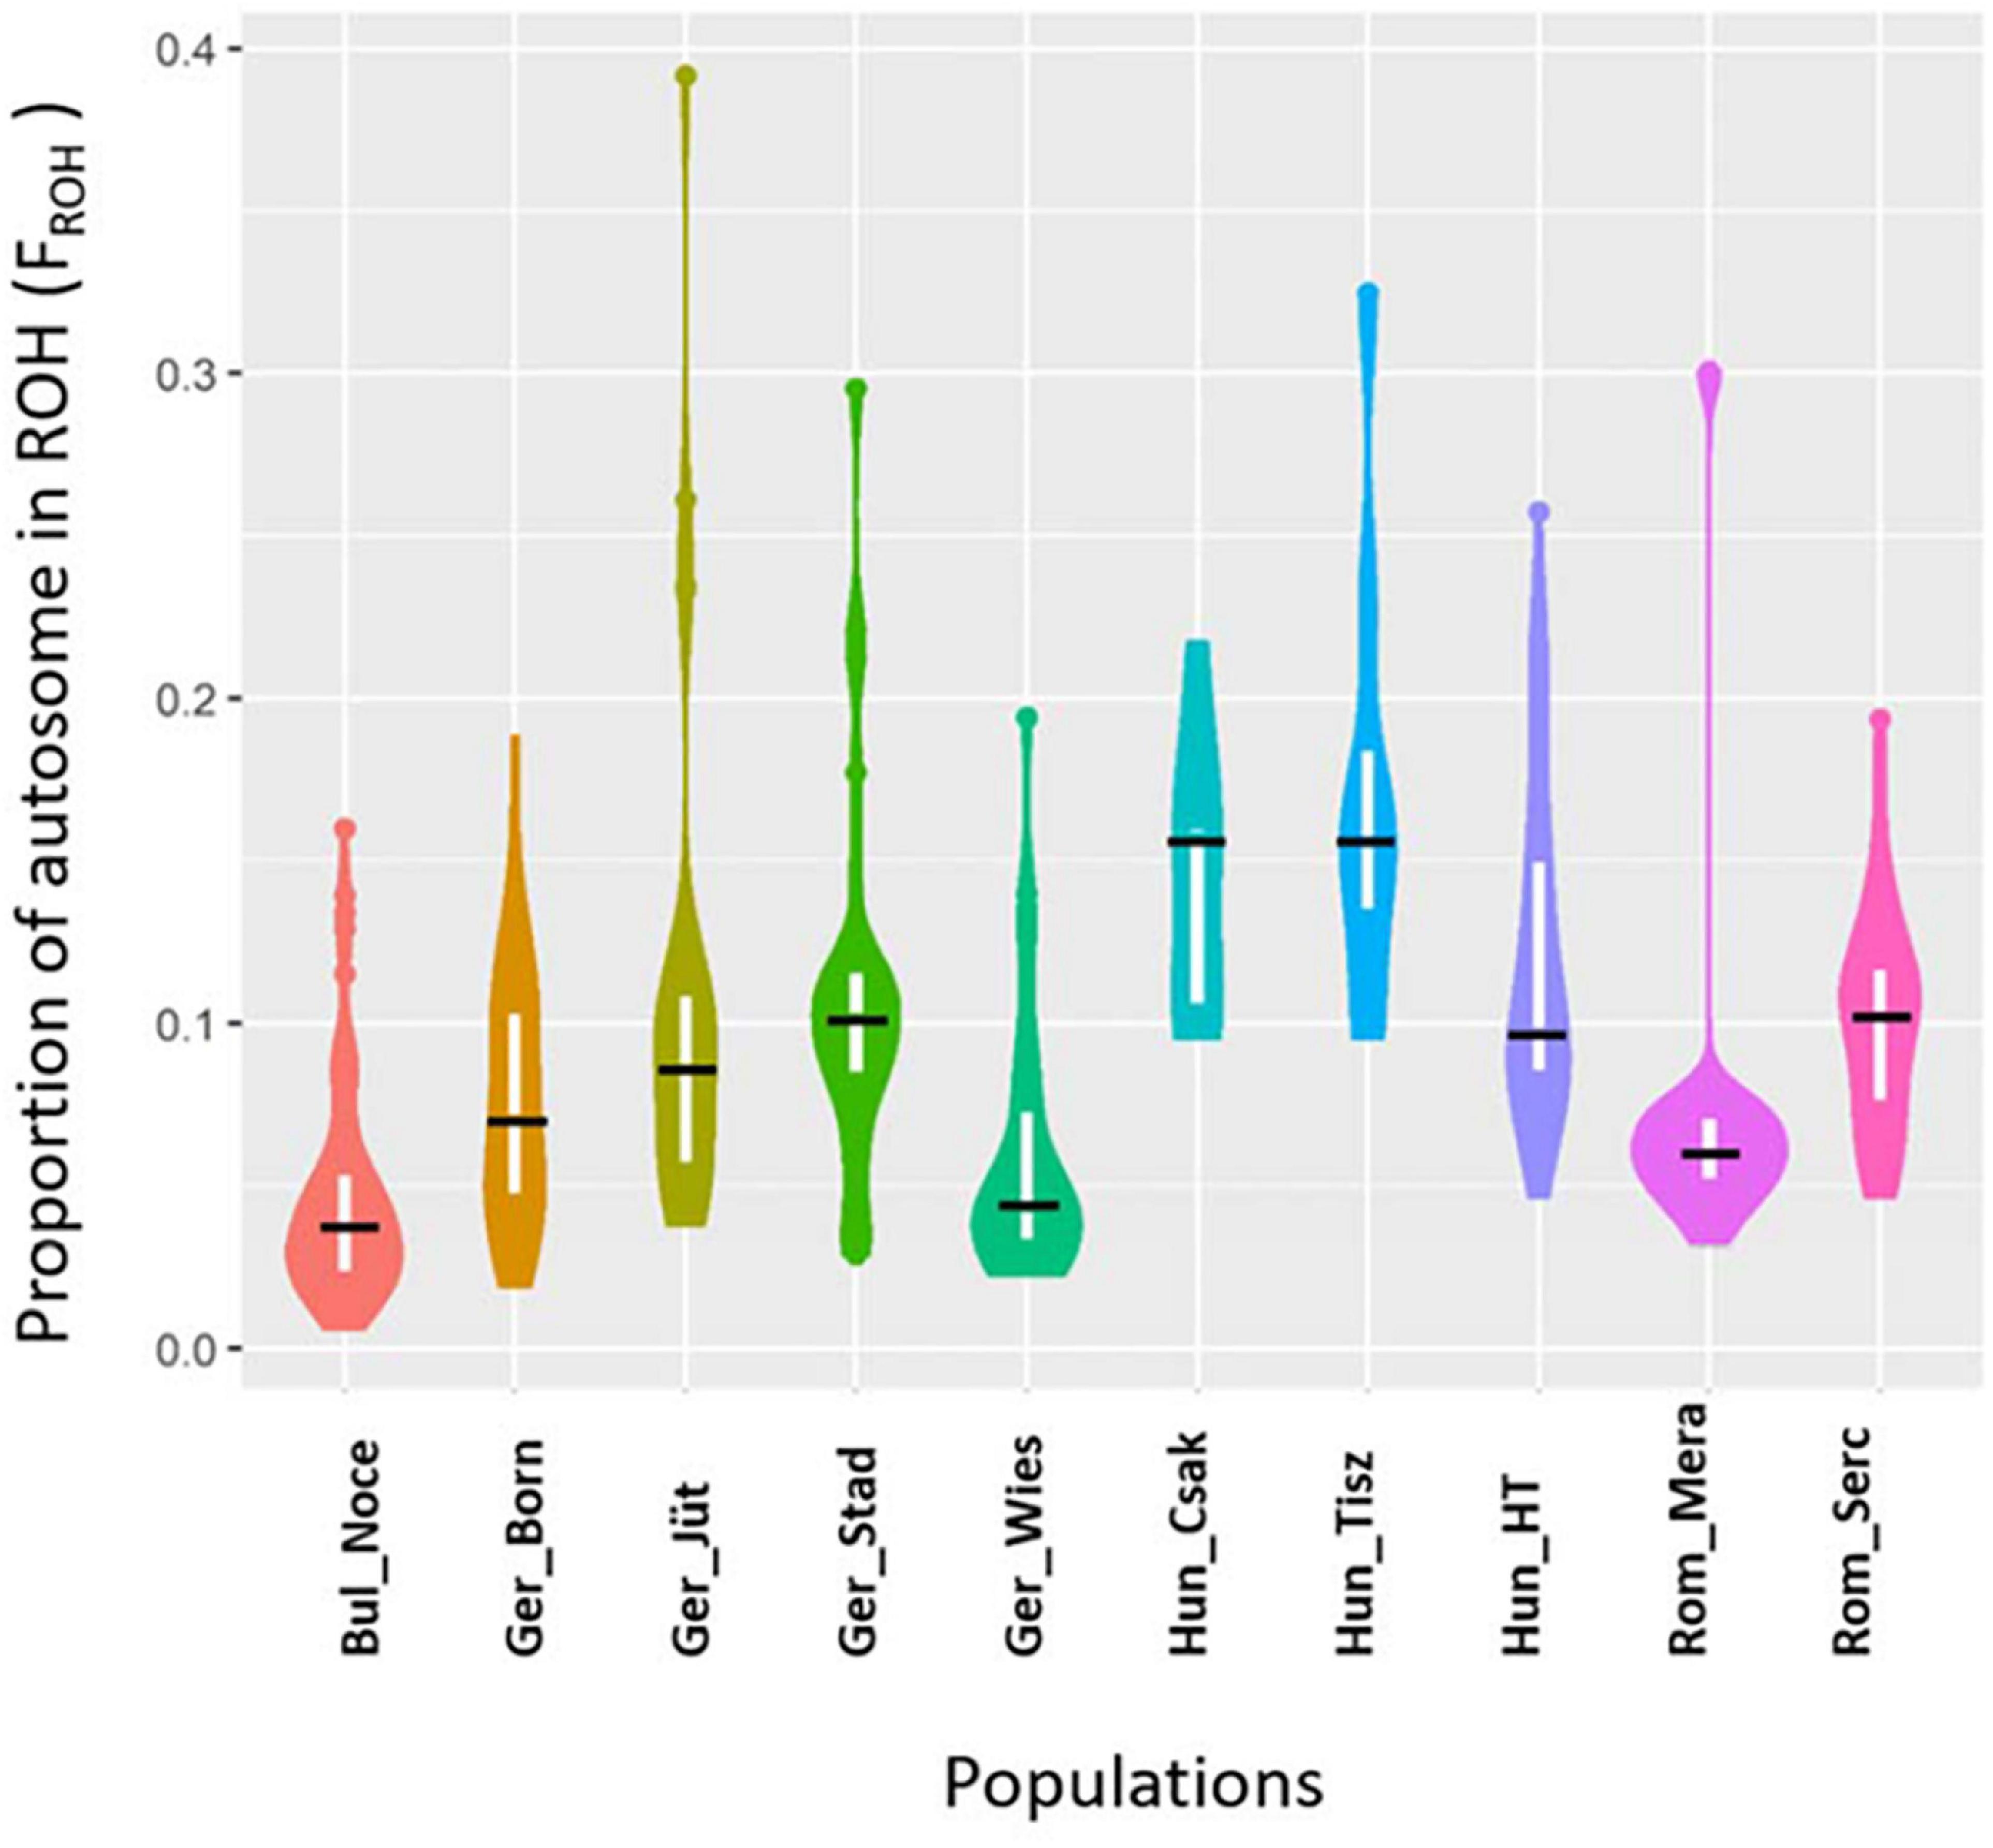
Figure 7. Violin Plot reporting the proportion of autosome covered in run of homozygosity (ROH) aka Genomic inbreeding coefficients (FROH) in Buffalo populations from Bulgaria (Bul_Noce), Romania (Rom_Mera, Rom_Serc), Hungary (Hun_Csak, Hun_Tisz, Hun_HT), and Germany (Ger_Born, Ger_Jüt, Ger_Stad, Ger_Wies). The black line indicates the median of FROH within the breed. Abbreviations and sample numbers are specified in Figure 3.
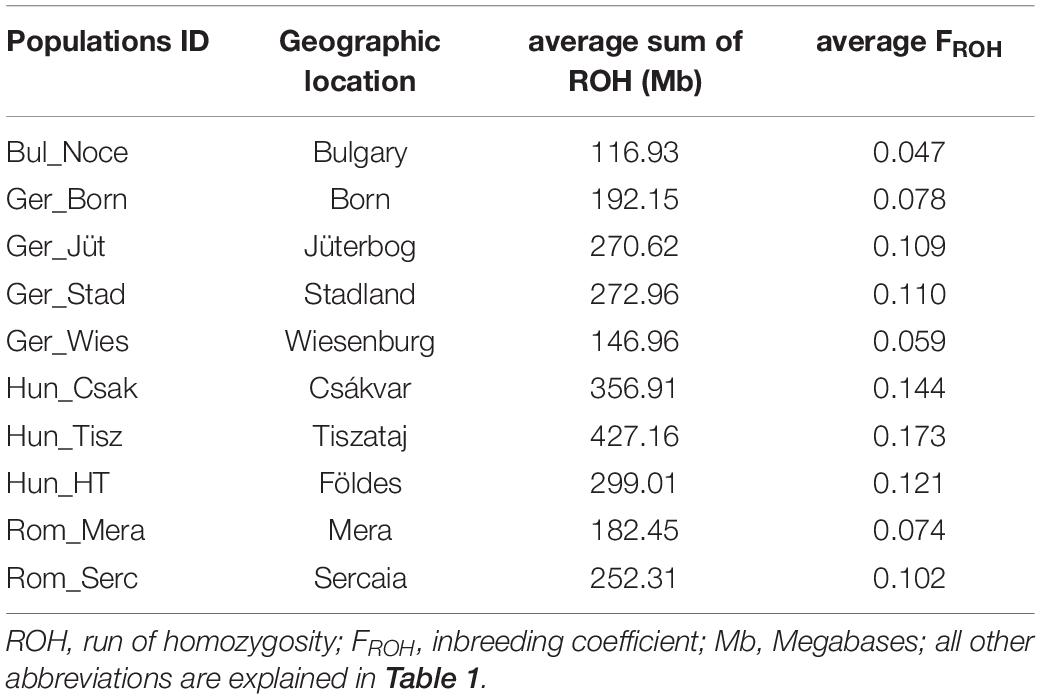
Table 4. Averages of individuals ROH in the genome and coefficient of FROH per population.
Localizing ROH Hotspots and Gene Set Enrichment Analyses
In order to detect the ROH hotspots, Manhattan plots were built to identify genomic regions frequently associated with ROH (Figure 8) and the SNP locus with the highest frequency (%) in those ROH (Table 5) for each German buffalo population. The thresholds to define the regions containing the top 1% of most common ROH-associated SNPs (ROH hotspots or ROH islands) were 0.38, 0.37, 0.42, and 0.29 for Mecklenburg-Western Pomerania, Brandenburg, Lower Saxony, and Saxony, respectively. With their genomic coordinates and after functional annotation (Supplementary Table 3), we were able to reveal potential candidate genes under directional selection among the different populations (Table 6 and Figure 9). We then examined genes co-localized with the ROH hotspots to identify candidate genes present in potential genomic regions that have undergone selection in each population, and where no significant (P ≤ 0.05) enrichment was found. All the hotspot SNPs in each population were in the short ROH length, likely suggestive of ancient inbreeding or selection events (Table 5). The populations from Brandenburg (Ger_jüt) and Lower Saxony (Ger_Stad) had similar levels of inbreeding, as also found for the populations from Mecklenburg-Western Pomerania (Ger_Born) and Saxony (Ger_Wies; Table 4). The distribution of hotspot SNPs were different in every population (Figures 8A–D), indicative of no directional selection in the groups. The highest number of genes co-localized with ROH regions were found in Saxony (83) and Lower Saxony (78), followed by Brandenburg (56) and Mecklenburg-Western Pomerania (53) (Tables 5, 6 and Figure 9) involving 11–16 biological processes (Figure 10). In particular, only in buffalos from Saxony we identified genes essential for the immune system (Il18bp, Rhog), and mammalian autophagy (Atg16l2) in chromosome 16 with 26, 21, and 15 hotspots SNPs, respectively.
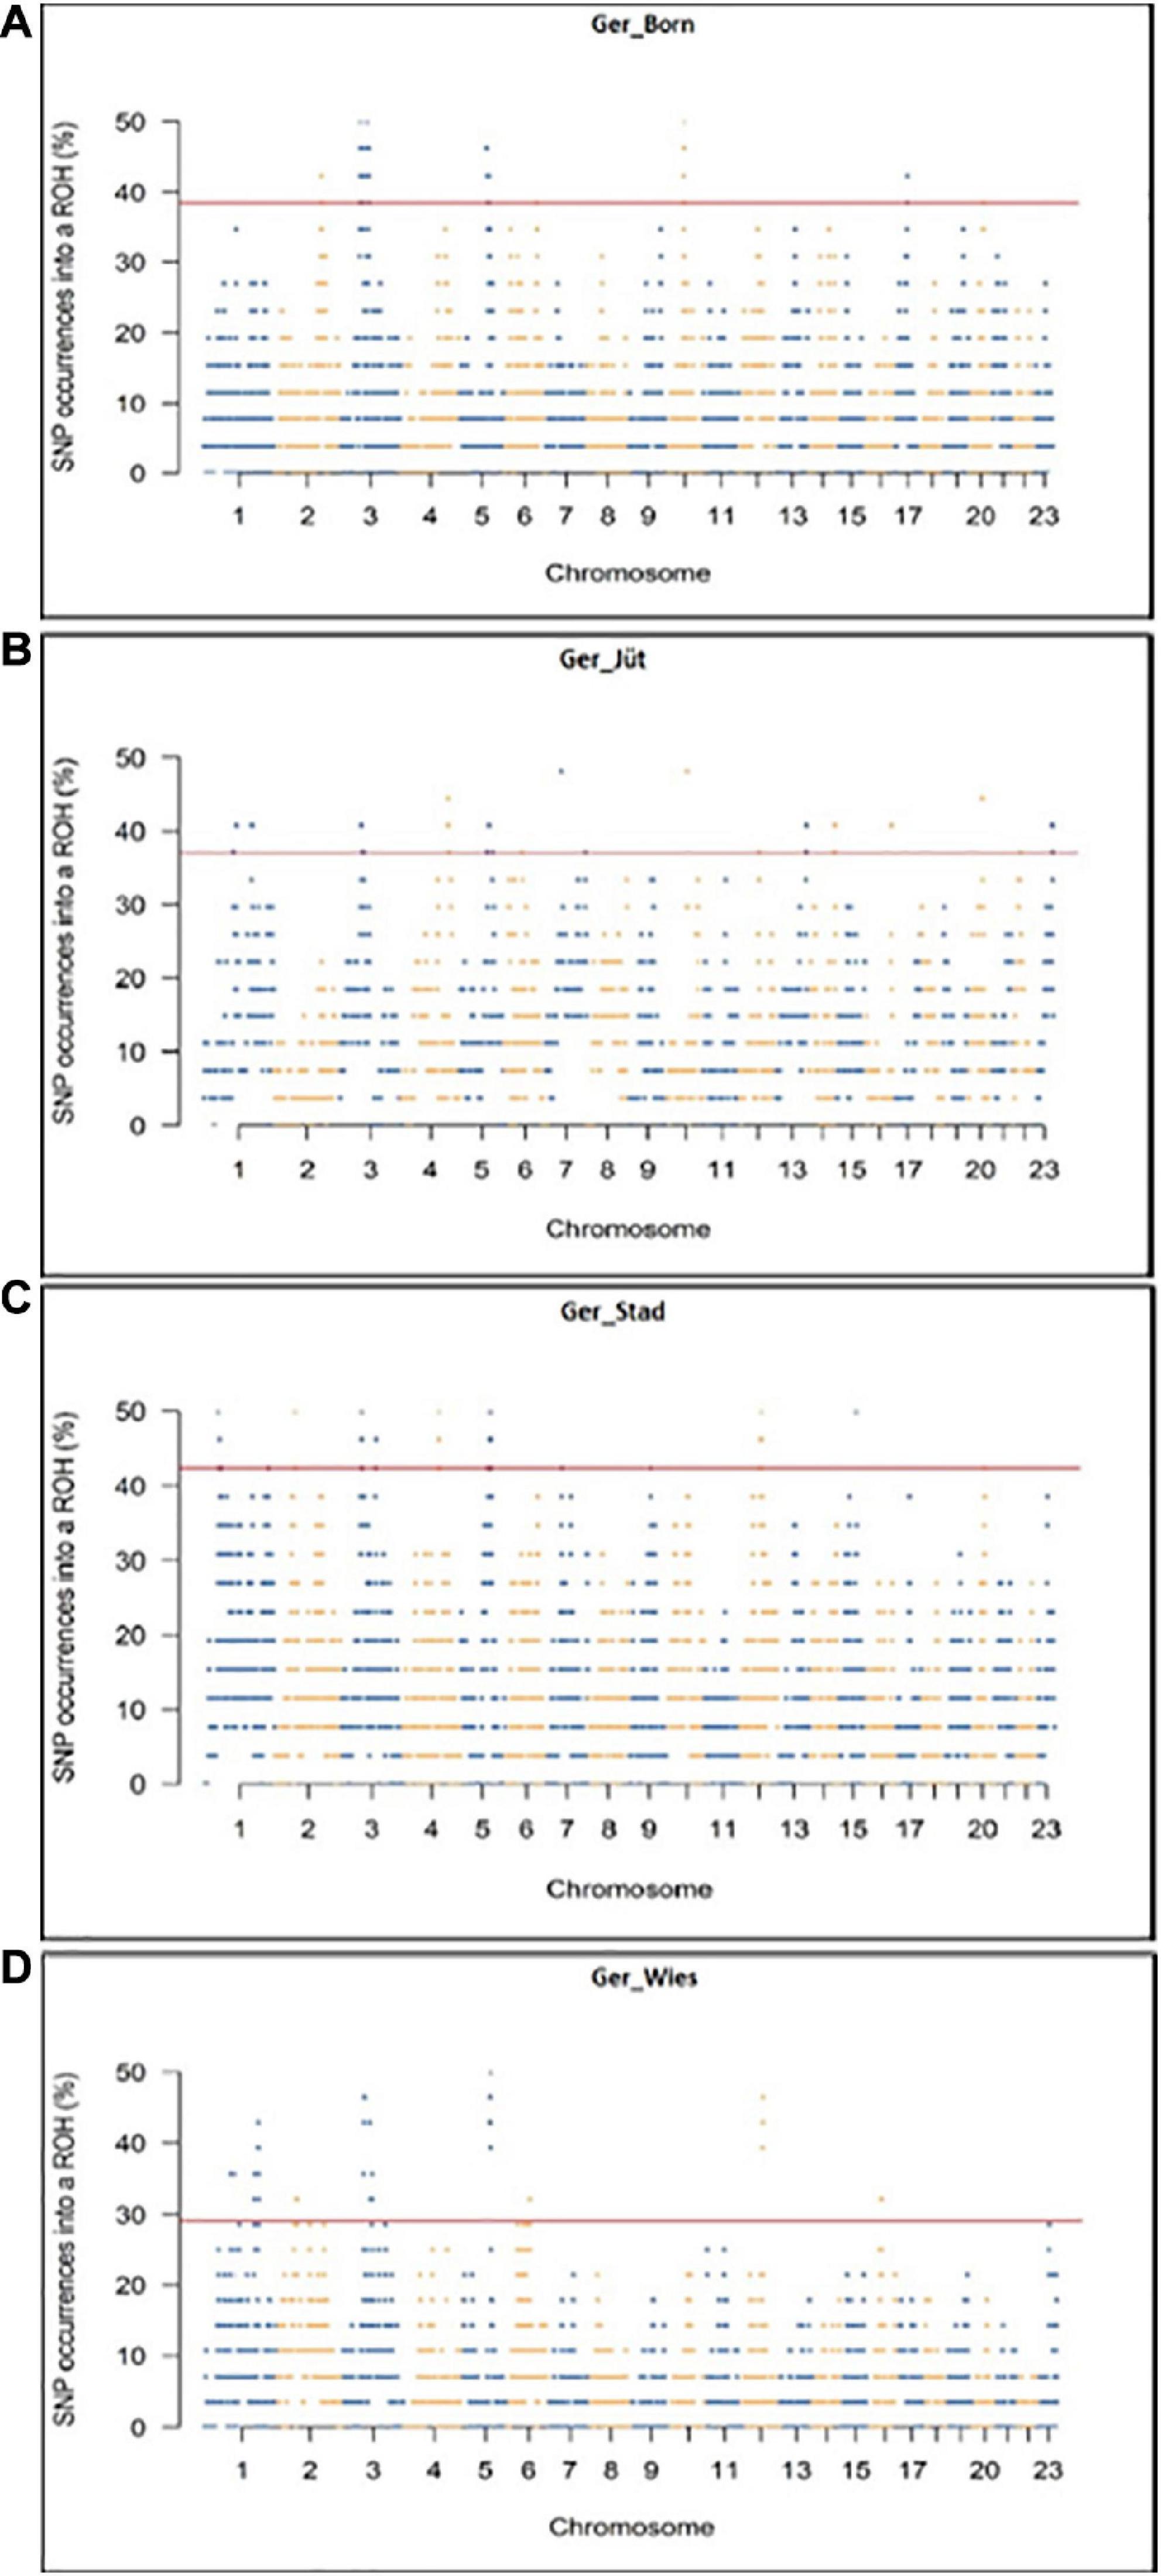
Figure 8. Genomic distribution of ROH islands in German buffalo samples. The x-axis represents the SNP genomic coordinate chromosome-wise, and the y-axis visualizes the frequency (%) of overlapping ROH shared among individuals. The red line indicates the threshold to define the regions containing the top 1% of most common ROH-associated SNPs (ROH hotspots or ROH islands). Populations are presented as (A) Mecklenburg-Western Pomerania (Ger_Born), (B) Brandenburg (Ger_Jüt), (C) Lower Saxony (Ger_Stad), and (D) Saxony (Ger_Wies). Abbreviations and sample numbers are specified in Figure 3.
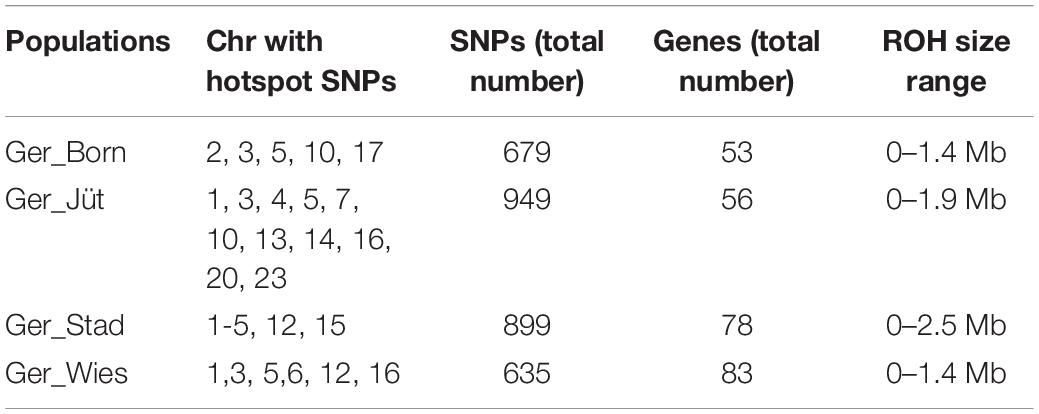
Table 5. Number of significant SNPs in ROH regions, genomic distribution, and genes mapped in the same regions for each German buffalo population analyzed in this work (Chr: chomosome).
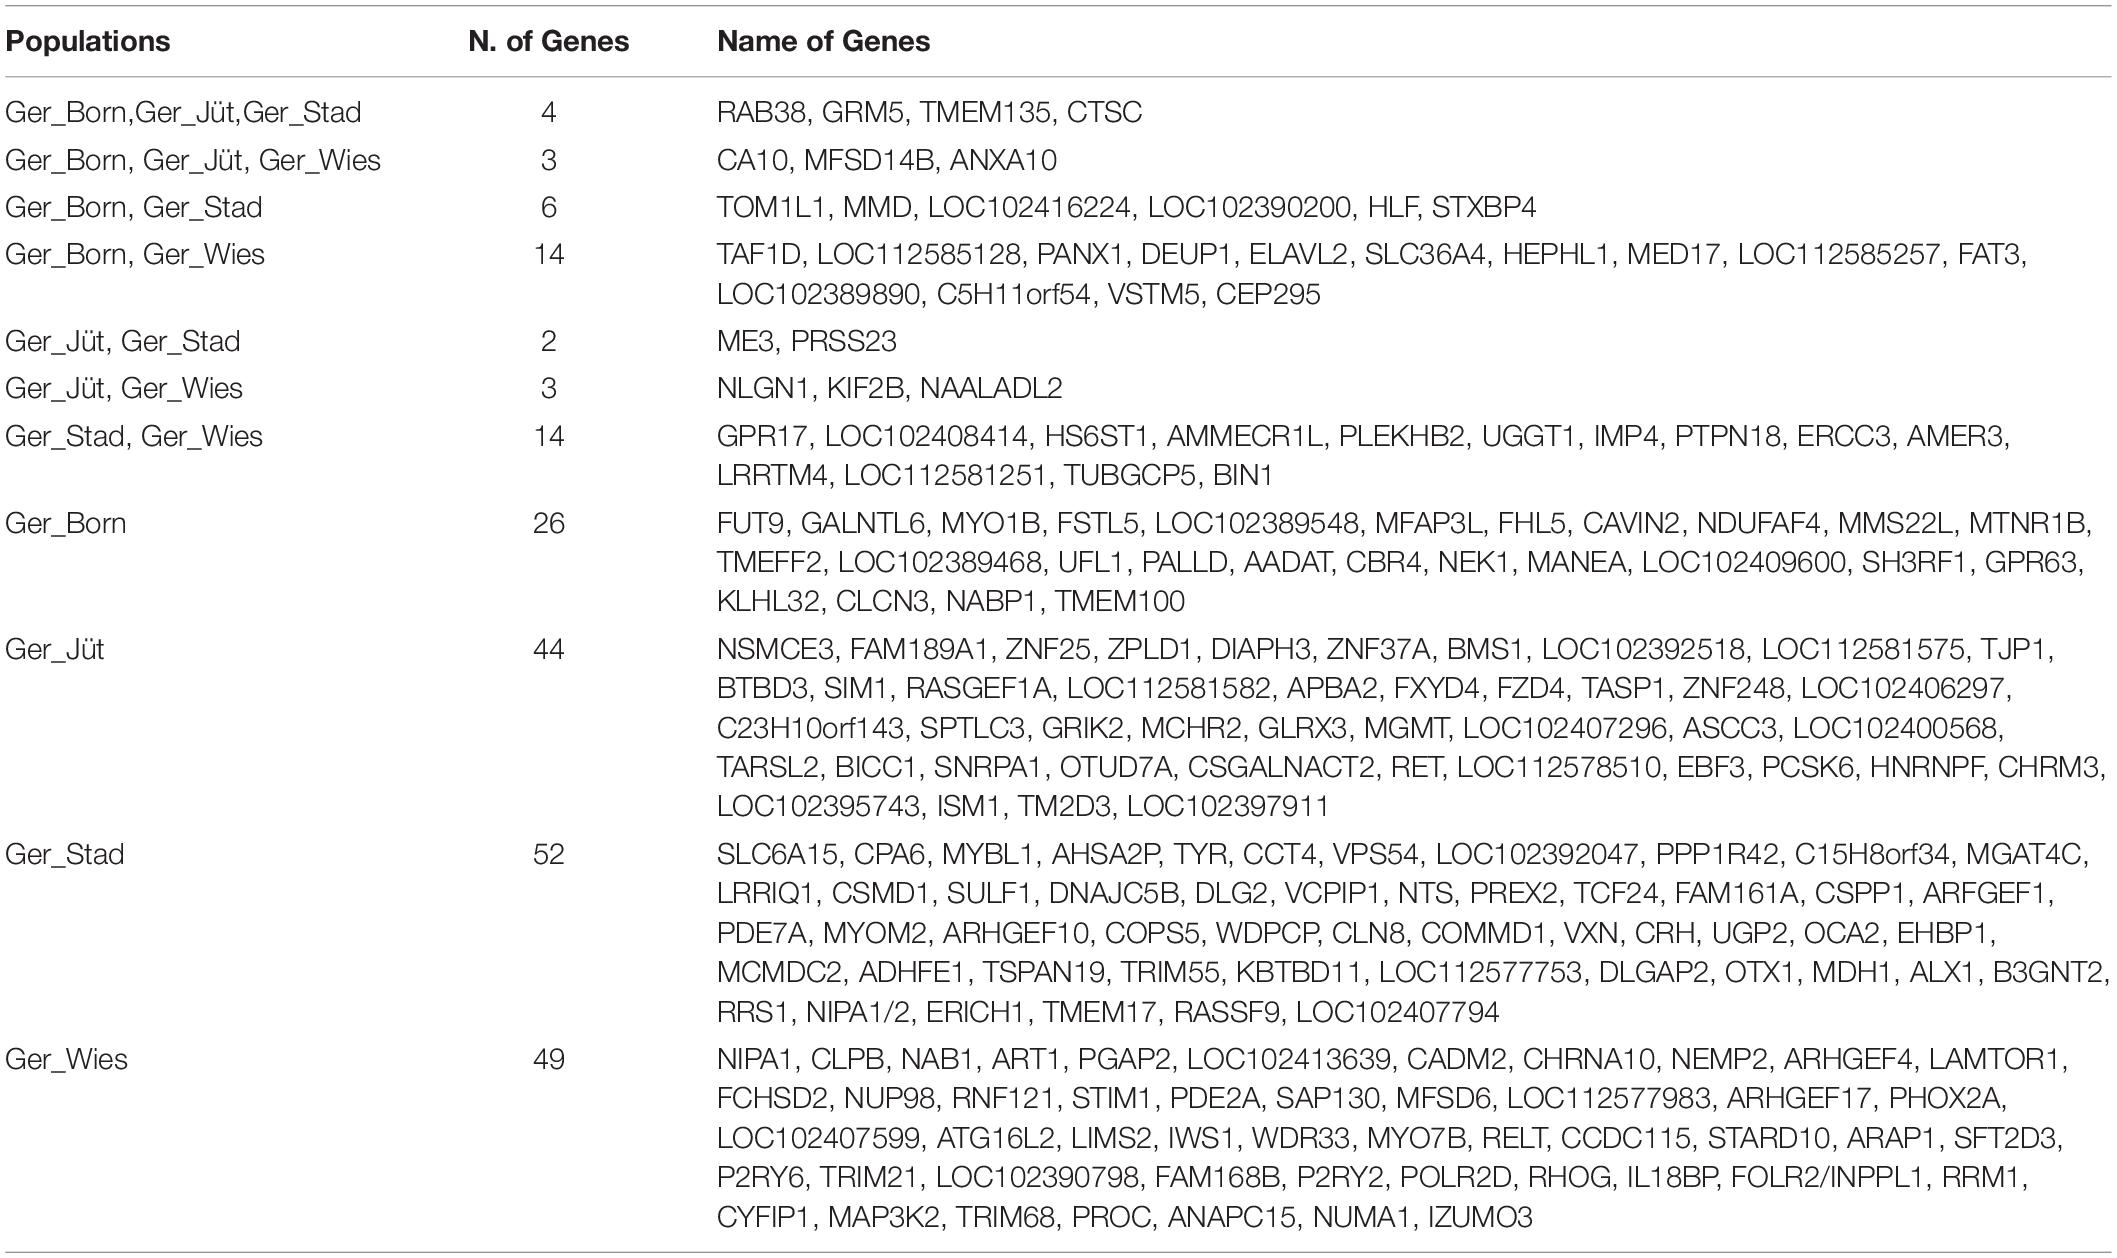
Table 6. Shared and unique genes overlapping ROH regions with the highest frequency SNPs in the German populations.
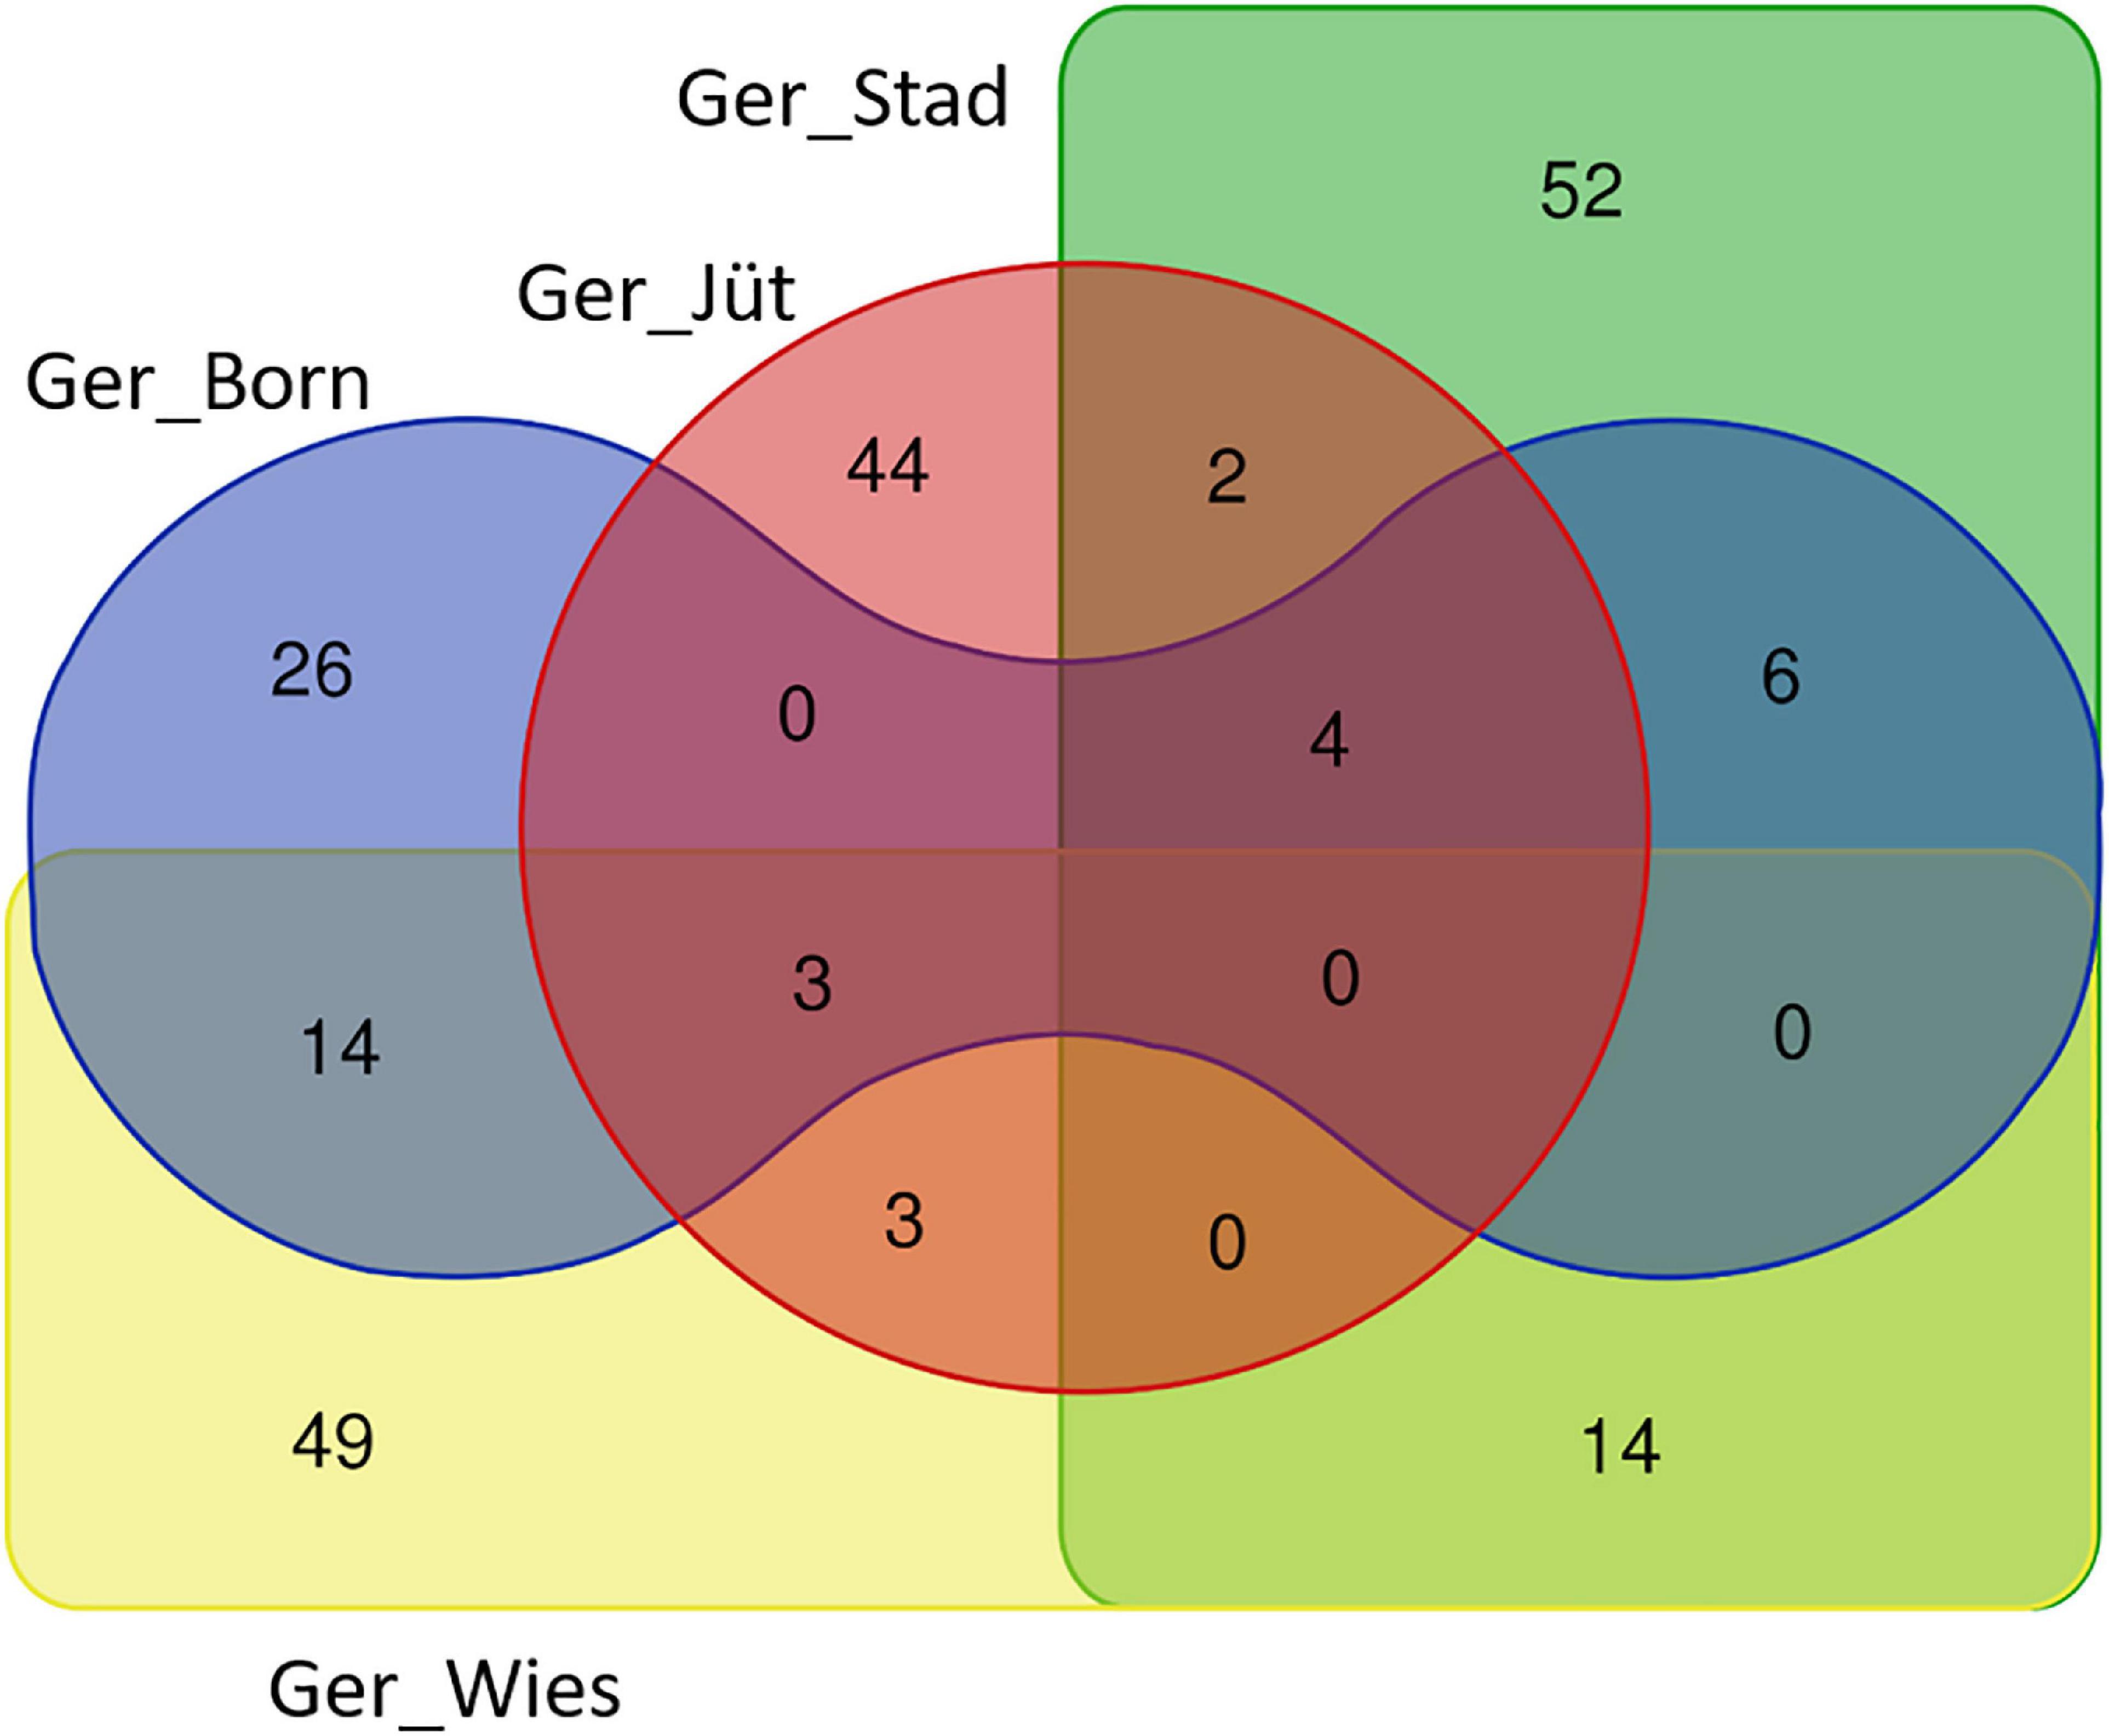
Figure 9. Venn diagram reporting the number of common and unique genes present in overlapping ROH regions with the highest frequency SNPs in different buffalo populations from Germany (gene names are referred by Table 6).
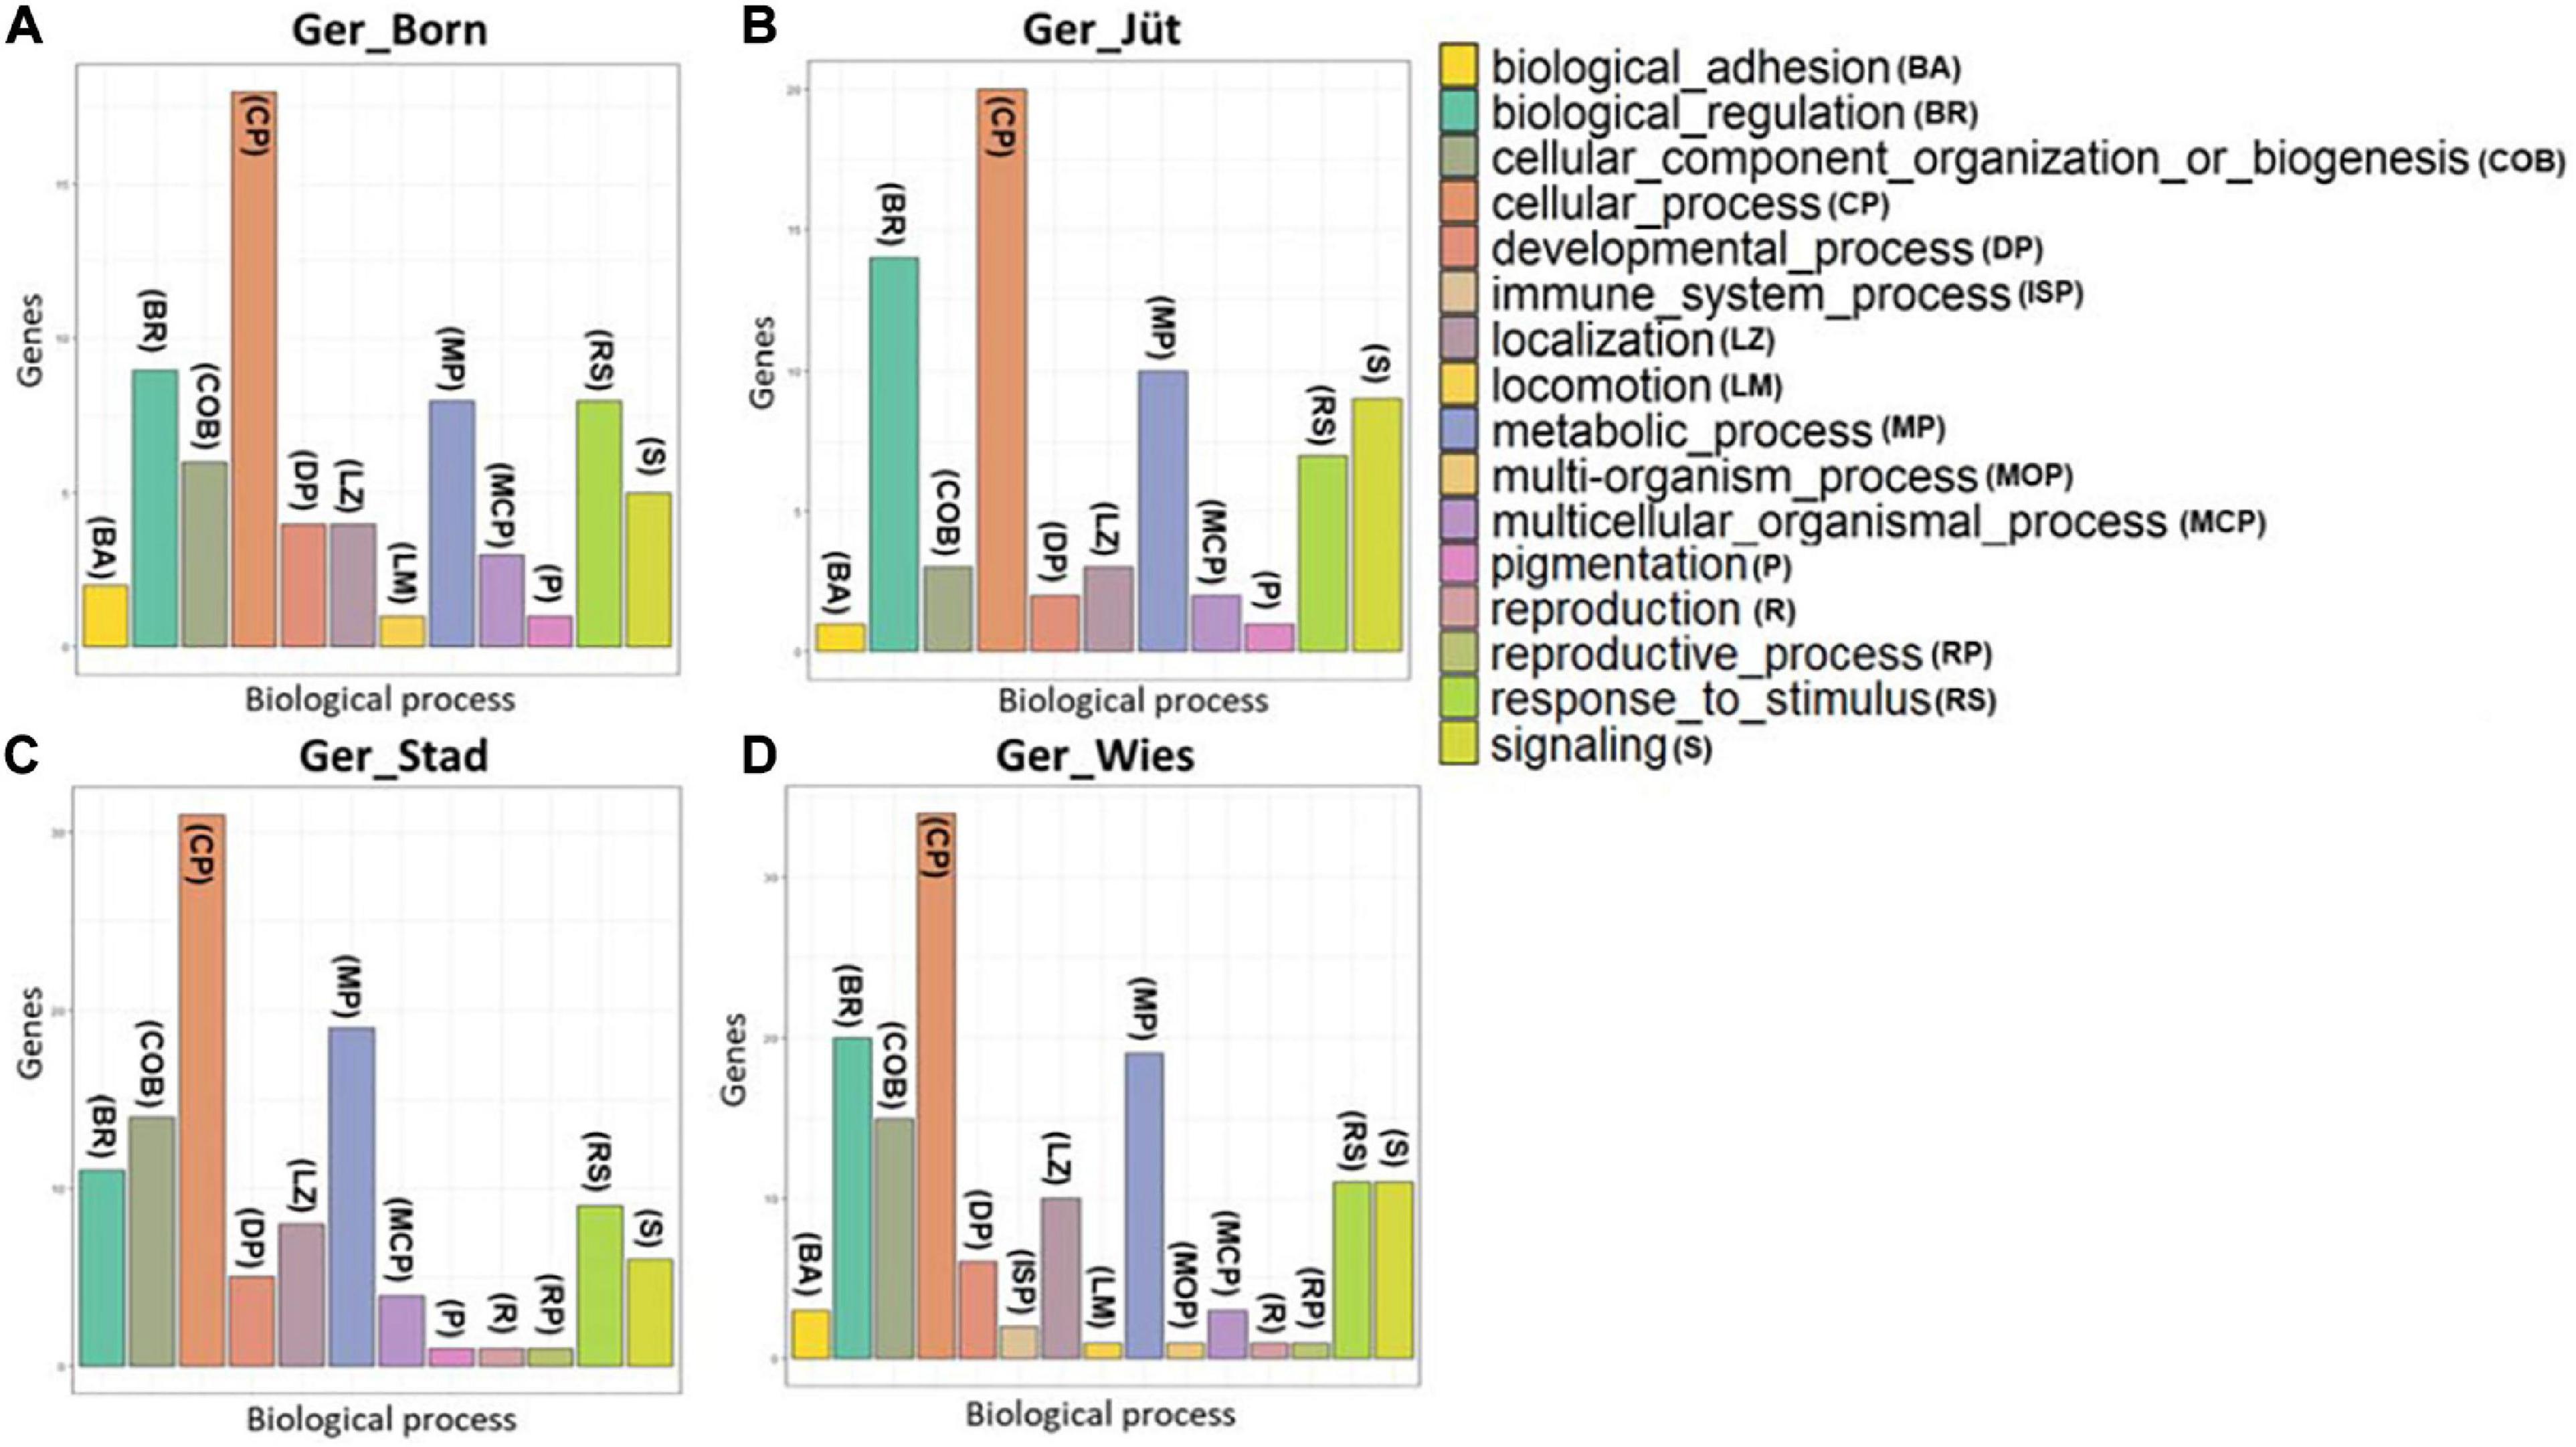
Figure 10. Classification of genes with hotspot SNPs in ROH genome regions. Populations are presented as (A) Mecklenburg-Western Pomerania (Ger_Born), (B) Brandenburg (Ger_Jüt), (C) Lower Saxony (Ger_Stad), (D) Saxony (Ger_Wies). Abbreviations and sample numbers are specified in Figure 3.
Discussion
European Buffalos Stand Out From Others
This is the first study aimed to explore the genetic background of German buffalos in relation to other European populations (Colli et al., 2018a; Deng et al., 2019a). Our knowledge about the genetic relationships of European breeds, especially in Central Europe and Germany are still poor. A recent study from Colli et al. (2018b) reported a high genetic variability within Eastern European populations and identified recognizable traces of Indo-Pakistani background in the genome of Mediterranean buffalo (Colli et al., 2018b). Here, we compared 22 populations worldwide. The separation between Murrah (India-Pakistan, Latino America, and the Middle East) and Mediterranean (European populations) breeds was clearly evident. European buffalo populations are characterized by higher genetic diversity than the Murrah breeds, which is related to their shorter distance from the place of domestication. This could be a consequence of the natural buffalo repopulation in Europe after the Ice Age or by the distribution of domesticated buffalo by different routes (Bartosiewicz, 1999). Admixture analysis revealed that European and non-European populations do not share the same gene pool. Only Bulgarian Murrah buffalos were profoundly different from the other European animals. In K = 4, a large amount of alleles were common with Murrah breeds from India-Pakistan but not in K = 6 (Figure 3B), indicating the development of a different genetic background. In fact, the values of observed and expected heterozygosity (He = 0.40) were comparable to those previously reported by Colli et al. (2018b) in Murrah breeds from India-Pakistan, underlining their similarity and indicating an isolate-breaking effect, the mixing of previously isolated populations. From the data provided here, we have strong evidence that European buffalos stand out from other buffalo populations worldwide. We may thus assume ancient origins of European buffalos (excluding Bulgaria), supporting the idea of Krawczynski (2010) postulating that buffalos did not wholly disappear from the European continent during the late Pleistocene.
Different Genotypes in European Buffalos and a Novel One in Hungary
Four clear clusters could be distinguished in the MDS plot when including samples from five European countries only, representing the geographical distribution of Bulgarian, Hungarian, Romanian, and the Italian population. German populations, however, were mixed and located in between the Italian and Romanian groups. In the Romanian cluster, samples collected from the National breeding facility (Rom_Serc) were separated from the other farm located in a former Hungarian village (Mera), now part of Romania. The origin of Romanian buffalo is still unclear. According to Borghese, it is a Mediterranean type adapted to the cold climate and local environment and is classified as a Mediterranean Carpathian breed (Borghese, 2005). Because of the massive decrease of their population size during the last 20 years, they are nowadays in an endangered status, distributed in small farms in some villages, and almost 98% in Transylvania used for local food production and draft strength (Matiuti et al., 2020). Our results revealed that Mera buffalos (Rom_Mera), which were distributed in multiple smaller familiar farms, were characterized by a mixture of the Italian Mediterranean, Hungarian, and Bulgarian genetic background, while buffalos from the National breeding facility (Rom_Serc) have a defined genotype. In this national breed, a higher level of FROH was found than in Mera buffalos. Moreover, the Mera herds (0.074) showed the highest proportion of long size ROH that confirms the small population size but is also indicative of recent inbreeding events. It may be due to the application of selection programs and the sign of environmental adaptation of the Mediterranean Carpathian buffalo in Rom_Serc population, while in Mera the animals are less subjected to predefined or joint selection programs. According to Karpati (1997), Mediterranean buffalos were introduced to Hungary, by the Turks, during the 16th century. The animals are distributed in small private farms used for family husbandry but mainly kept in national parks as a protected reserve (Borghese, 2005). In the MDS plot, the Hungarian cluster, including three populations (Földes, Csákvar, and Tiszataj), showed a lower admixture with Balkan populations (Figure 4B). The comparably high level of inbreeding coefficient and a high proportion of ROH, especially in short length, is indicative of ancient inbreeding events in Hungarian buffalos. Notably, the genetic background in Hungarian buffalo is comparably homogenous compared to all genotypes published before or presented here and may represent a valuable resource for local economy or breeding programs worldwide in the future. Clearly, and maybe as a surprise, the genetic background in Hungarian buffalo is different from the population in Mera, which represents a former Hungarian village. In all three Hungarian farms included in this study, the buffalos are used for meat production only and serve particularly for the establishment of local marketing together with other regional products. Under current natural breeding, there is no selection for milk production at present in the herds included, which may explain the lack of recent inbreeding. Bulgarian Murrah buffalos, instead, had the lowest proportion of ROH in each length category and the lowest FROH values between Central and East European populations. Indeed, the Bulgarian is the biggest population analyzed in this study, and the samples were collected from two different locations, which also could be related to comparably low levels of inbreeding. In the German populations, genomic relationships with Bulgarian Murrah, Italian Mediterranean breeds, and Romanian genetics were identified. Buffalos in Germany had the highest observed and expected heterozygosity values within all Central Eastern European populations studied here. The observed genetic diversity is a significant factor for their potential adaptation to the local environment and provides a valuable substrate for an upcoming selection program. Drift rather than mutation has likely created this variability due to the short period in generations and the relatively small effective population sizes (Wang, 2005). Buffalos from Brandenburg (Ger_Jüt) stood out from all other German populations studied here. As the only German population, clear genetic relations to Bulgarian buffalos can be postulated for the Jüterbog herd. In fact, part of the Bulgarian Murrah’s gene pool that was visible in the admixture at K = 4, and disappeared at K = 6, is likely an effect of genetic drift after isolation over time. The Brandenburg buffalo herd showed the highest deviation of heterozygosity values, with He being lower than Ho, suggesting Hardy-Weinberg disequilibrium and inbreeding (Mayo, 2008). The higher values of inbreeding with an increasing trend of ROH average from short to long size may further suggest recent inbreeding and isolation without any admixture since the introduction of the buffalos in Germany.
Overlapping ROH Signals in German Buffalo Genome
The control of inbreeding in a population is necessary to avoid depression of phenotype traits (Ouborg et al., 2010; Fontanesi et al., 2015). Considering that ROH regions are not randomly present in the genome (McQuillan et al., 2008), the detection of the genomic regions frequently covered with ROH is useful. This helps to understand whether they influence any quantitative trait, especially in a population of small population size, such as local breeds (Biscarini et al., 2015). The negative effect of inbreeding depression in milk production has been reported in Egyptian (Khattab and Kawthar, 2007), South Iranian (Mirhabibi et al., 2007), and Brazilian buffalo populations (Santana et al., 2011). We found several differences among German buffalo populations in ROH analysis in terms of the number of hotspot SNPs, candidate genes in the same genomic coordinates, and biological processes in which they could be involved. In the Brandenburg (Ger_Jüt) population, the most distinguished, with a high level of inbreeding, we found the highest number of hotspot SNPs (949), distributed over 11 chromosomes and concerned only 57 genes involved in 11 biological processes. While Saxony buffalos (Ger_Wies), the population with the lowest inbreeding level and the lowest number of hotspot SNPs (635), showed their distribution limited to 6 chromosomes but to 83 genes involved in 15 biological processes. Overlapping ROH signals affecting genes involved in the immune system (Il18bp, Rhog) and autophagy (Atg16l2) were only found in Saxony. It is reported that the gene Atg16l2 (autophagy related 16 like 2) influences the adaptation of the immune system to the recovery from mastitis in Danish Holstein cattle (Welderufael et al., 2018). From these very initial interpretations of the potential effects of local selection for functional traits, we may get an idea of how genomic selection could be used to improve animal health and performance in the future. Certainly, additional studies of gene expression, metabolism, or animal health are needed to link SNP markers with particular phenotypes. We are aware of the limitations of our study. Only four different farms in Germany are included that represent less than 15% of the German buffalo population. Moreover, the selection of farms in Eastern Europe was based on potential familiar relationships and can be seen as a start only. For German and other European countries, higher coverage, including more herds and additional countries to further exploit the full setting of genetic diversity in Europe, and an in-depth analysis of signatures of past selection combining several metrics together with ROH is required. Finally, in the genotyping array designed for buffalo, only 30% of SNPs from European breeds (Italian Mediterranean) have been included, which could be a further limitation to obtain genomic information about European buffalo populations. Accordingly, we may initiate new genome sequencing initiatives to develop more informative SNP arrays to improve further functional genome analysis and genome-based selection in European buffalo.
Conclusion
This work aimed to contribute to an improved understanding of Central and Southeast European buffalo populations from a genomic perspective. We defined the genetic characteristics of European buffalo populations in Romania, Bulgaria, and Hungary. Together with the Italian Mediterranean breed, these populations contribute to the high degree of genetic diversity of European buffalos. Incidentally, we may have genetic evidence for a novel or original Hungarian breed, characterized by outmost uniformity in three different farms with no clear relations to any other genotype described so far. Since all farms are in the close neighborhood, follow-on studies may help to unravel the origin of the Hungarian population. This novel genetic identity found in Hungarian buffalos thus adds one additional specific breed to the existing genetic diversity in Europe, which so far consisted only of the Italian Mediterranean, Bulgarian Murrah, and Romanian genetics.
This is the first genetic characterization of buffalos in Germany, where farming started only about 40 years ago and therefore is in its infancy. We have identified familiar relations to all genotypes identified in European buffalos so far with the exception of Hungary. Importantly and based only on a comparably small number of herds, a diverse genetic make-up is available in European and German buffalos, which can be seen as an excellent prerequisite for the development of Buffalo-based bioeconomy in Europe based on local breeds characterized by unique features.
Data Availability Statement
Our data set has been uploaded in the Dryad Repository, https://datadryad.org/stash/share/eT_rs3441UHCMlN4qpbRi8u6sFPHdX-ZtDPuVS5TpSI and https://datadryad.org/resource/doi:10.5061/dryad.h0cc7.
Ethics Statement
Ethical review and approval was not required for the animal study because sampling occurred as part of livestock breeding programs which are granted by international law and therefore are not reviewed by ethical committees. Written informed consent was obtained from the owners for the participation of their animals in this study.
Author Contributions
AN, KW, and AH conceived the project and designed the experiments. AN performed the laboratory part. AN, SQ, RG-P, and ML-S performed the data analysis. AN, SQ, RG-B, JB, RK, and AH contributed to the interpretation of results and wrote the manuscript. MiT, M-AF, HP, AB, LV, CH, LH, PP, YI, TP, WL, MaT, and AH collected or provided samples and contributed to data production. All authors read, made corrections, and approved the final version of the manuscript.
Conflict of Interest
M-AF, MiT, HP, and RK are employed by the companies Gut Darss GmbH & Co., Hof am Meer GmBH, Wiesenburger Land eG, and Energiequelle GmbH, respectively.
The remaining authors declare that the research was conducted in the absence of any commercial or financial relationships that could be construed as a potential conflict of interest.
Acknowledgments
This study would not have been possible without the help of many buffalo breeders. We express our gratitude to Family Henrion (Bobalis Agrargesellschaft mbH in Jüterbog), Dr. Möhring (Gut Darss GmbH & Co. KG in Born), the staff in Stadland (Hof am Meer, Stadland/Norderschwei), and all helpers from Wiesenburger Land eG in Wiesenburg. We further want to thank the managers and helpers in Hungary: Mr. Mihály Bodnár, Tiszatáj Fundation (H- 4450 Tiszalök Rákóczi u. 14), Mr. Levente Viszló Pro Vértes Fundation (H-8083 Csákvár, Kenderesi u. Geszner ház), and Mrs. Gabriella Bona Bihar Fundation (H-4177, Földes Kálóháti Tanya), the staff in Sercaia (Romania) and all the families in Mera (Romania) that supported our project. Furthermore, the local support in Bulgaria is thanked here. Finally, we would like to thank Dr. Taina Figueiredo Cardoso for helpful advice when performing genetic diversity analyses.
Supplementary Material
The Supplementary Material for this article can be found online at: https://www.frontiersin.org/articles/10.3389/fgene.2020.610353/full#supplementary-material
Supplementary Table 1 | A descriptive summary of three SNP panels used in this study.
Supplementary Table 2 | Wright’s Fixation Index (FST) matrix computed with 36,014 SNPs in 22 buffalo populations.
Supplementary Table 3 | List of potential candidate genes and relative functional annotation found in ROH hotspots region in German buffalo populations: (a) Mecklenburg-Western Pomerania, (b) Brandenburg, (c) Lower Saxony, (d) Saxony.
Footnotes
- ^ http://www.affymetrix.com
- ^ https://datadryad.org/resource/doi:10.5061/dryad.h0cc7; https://doi.org/10.5061/dryad.310pf05
References
Abd El-Salam, M. H, and El-Shibiny, S. (2011). A comprehensive review on the composition and propertiesof buffalo milk. Dairy Sci. Technol. 91, 663–699. doi: 10.1007/s13594-011-0029-2
Alexander, D. H., Novembre, J., and Lange, K. (2009). Fast model-based estimation of ancestry in unrelated individuals. Genome Res. 19, 1655–1664. doi: 10.1101/gr.094052.109
Bartosiewicz, L. (1999). “The emergence of holocene faunas in the carpathian basin: a review,” in The Holocene History of the European Vertebrate Fauna, Ed. N. Benecke, (Rahden: Modern Aspects of Research) 6, 73–90.
Biscarini, F., Cozzi, P., Gaspa, G., and Marras, G. (2018). detectRUNS: Detect Runs of Homozygosity and Runs of Heterozygosity in Diploid Genomes. Available at: http://orca.cf.ac.uk/id/eprint/108906 (accessed March 16, 2020).
Biscarini, F., Nicolazzi, E. L., Stella, A., Boettcher, P. J., and Gandini, G. (2015). Challenges and opportunities in genetic improvement of local livestock breeds. Front. Genet. 6:33. doi: 10.3389/fgene.2015.00033
Borghese, A. (2011). Situation and perspectives of buffalo in the World. Europe and Macedonia. Mac. J. Anim. Sci. 1, 281–296.
Borghese, A., and Moioli, B. (2016). Buffalo Breeds and Management Systems. Northern Greece: Animal Production Research Institute.
Calabró, S., Infascelli, F., Tudisco, R., Musco, N., Grossi, M., Monastra, G., et al. (2013). Estimation of in vitro methane production in buffalo and cow. Buffalo Bull. 32, 924–927.
Clutton-Brock, J. (1999). A Natural History of Domesticated Mammals. Cambridge: Cambridge University Press, 238.
Cockrill, W. R. (1984). “Water buffalo,” in Evolution of Domesticated Animals, ed. I. L. Mason, (London: Longman), 52–63.
Colli, L., Milanesi, M., Vajana, E., Iamartino, D., Bomba, L., Puglisi, F., et al. (2018b). New insights on water buffalo genomic diversity and post-domestication migration routes from medium density SNP chip data. Front. Genet. 9:53. doi: 10.3389/fgene.2018.00053
Colli, L., Milanesi, M., Vajana, E., Iamartino, D., Bomba, L., Puglisi, F., et al. (2018a). Data From: New insights on Water Buffalo Genomic Diversity and Post-Domestication Migration Routes from Medium Density SNP Chip Data, Philadelphia, PA: Dryad. doi: 10.5061/dryad.h0cc7
Deng, T., Aixin, L., Jiajia, L., Guohua, H., Tingzh, Y., Shenhe, L., et al. (2019a). Data From: Genome-wide SNP Data Revealed the Extent of Linkage Disequilibrium, Persistence of Phase and Effective Population Size in Purebred and Crossbred Buffalo Populations, Philadelphia, PA: Dryad. doi: 10.5061/dryad.310pf05
Deng, T., Liang, A., Liu, J., Hua, G., Ye, T., Liu, S., et al. (2019b). Genome-Wide SNP data revealed the extent of linkage disequilibrium, persistence of phase and effective population size in purebred and crossbred buffalo populations. Front. Genet. 9:688. doi: 10.3389/fgene.2018.00688
Excoffier, L., and Lischer, H. E. L. (2010). Arlequin suite ver 3.5: a new series of programs to perform population genetics analyses under Linux and Windows. Mol. Ecol. Resour. 10, 564–567. doi: 10.1111/j.1755-0998.2010.02847.x
Ferrara, B. (1964). The present situation of buffalo breeding in Italy. Acta Med. Vet. Napoli. 10, 325–355.
Fontanesi, L., Scotti, E., Samore, A. B., Bagnato, A., and Russo, V. (2015). Association of 20 candidate gene markers with milk production and composition traits in sires of Reggiana breed, a local dairy cattle population. Livest. Sci. 176, 14–21. doi: 10.1016/j.livsci.2015.03.022
Haarmann, H. (2011). Das Rätsel der Donauzivilisation: Die Entdeckung der ältesten Hochkultur Europas. Munich: C. H. Beck Verlag, 1–286.
Hegde, N. G. (2019). Buffalo husbandry for sustainable development of small farmers in india and other developing countries. Asian J. Res. Anim. Vet. Sci. 3, 1–20.
Hoffman, J. M., and Valencak, T. G. (2020). A short life on the farm: aging and longevity in agricultural, large-bodied mammals. Geroscience 42, 909–922. doi: 10.1007/s11357-020-00190-4
Huang, D. W., Sherman, B. T., and Lempicki, R. A. (2009). Systematic and integrative analysis of large gene lists using DAVID bioinformatics resources. Nat. Protoc. 4, 44–57. doi: 10.1038/nprot.2008.211
Iamartino, D., Nicolazzi, E. L., Van Tassell, C. P., Reecy, J. M., Fritz-Waters, E. R., Koltes, J. E., et al. (2017). Design and validation of a 90K SNP genotyping assay for the water buffalo (Bubalus bubalis). PLoS One 12:e0185220. doi: 10.1371/journal.pone.0185220
Iannuzzi, L., and Di Meo, G. (2009). “Water buffalo,” in Genome Mapping and Genomics in Domestic Animals, eds N. E. Cockett and C. Kole, (Germany: Springer-Verlag).
Kawashima, T., Sumamal, W., Pholsen, P., Chaithiang, R., and Kurihara, M. (2006). Comparative study on energy and nitrogen metabolisms between Brahman cattle and swamp buffalo fed with low quality diet. JARQ 40, 183–188. doi: 10.6090/jarq.40.183
Khattab, A. S., and Kawthar, A. M. (2007). Inbreeding and it is effects on some productive and reproductive traits in a herd of Egyptian buffalos. Ital. J. Anim. Sci. 6, 275–278. doi: 10.4081/ijas.2007.s2.275
Kierstein, G., Vallinoto, M., Silva, A., Schneider, M. P., Iannuzzi, L., and Brenig, B. (2004). Analysis of mitochondrial D-loop region casts new light on domestic water buffalo (Bubalus bubalis) phylogeny. Mol. Phylogenet. Evol. 30, 308–324. doi: 10.1016/s1055-7903(03)00221-5
Krawczynski, R. (2010). “Zur historischen verbreitung des wasserbüffel (Bubalus Bubalis L., 1758) in Eropa,” in Wasserbüffel in Der Landschaftspflege ed. J. Hoffman, R. Krawczynski, and H. G. Wagner, (Lexxion: Tagungsband), 17–26. doi: 10.1111/j.1439-0507.1988.tb03852.x
Krawczynski, R. (2013). “Die potentiell natürliche megafauna Europas,” in Nationalpark-Jahrbuch Unteres Odertal 9 Nationalparkstiftung Unteres Odertal, ed. A. Vössing, (Schwedt: Schloss Criewen), 29–40.
Kumar, S., Nagarajan, M., Sandhu, J. S., Kumar, N., Behl, V., and Nishanth, G. (2007). Mitochondrial DNA analyses of Indian water buffalo support a distinct genetic origin of river and swamp buffalo. Anim. Genet. 38, 227–232. doi: 10.1111/j.1365-2052.2007.01602.x
Lau, C. H., Drinkwater, R. D., Yusoff, K., Tan, S. G., Hetzel, D. J., and Barker, J. S. (1998). Genetic diversity of Asian water buffalo (Bubalus bubalis): mitochondrial DNA D-loop and cytochrome b sequence variation. Anim. Genet. 29, 253–264. doi: 10.1046/j.1365-2052.1998.00309.x
Lima-Ribeiro, M. S., and Diniz-Filho, J. A. F. (2017). Climate change, human overkill, and the extinction of megafauna: a macroecological approach based on pattern-oriented modelling. Evol. Ecol. Res. 18, 97–121.
Low, W. Y., Tearle, R., Bickhart, D. M., Rosen, B. D., Kingan, S. B., Swale, T., et al. (2019). Chromosome-level assembly of the water buffalo genome surpasses human and goat genomes in sequence contiguity. Nat. Commun. 10:260.
Martin, P. S. (1984). “Prehistoric overkill: the global model,” in Quaternary Extinctions: A Prehistoric Revolution, eds P. S. Martin and R. G. Klein, (Tucson: University of Arizona Press), 354–403.
Martini, M., Altomonte, I., and Salari, F. (2018). Native milk fat globule size and its influence on the natural creaming properties of buffalo milk. Buffalo Bull. 37, 481–488.
Mastrangelo, S., Sardina, M. T., Tolone, M., Di Gerlando, R., Sutera, A. M., Fontanesi, L., et al. (2018). Genome-wide identification of runs of homozygosity islands and associated genes in local dairy cattle breeds. Animal 12, 2480–2488. doi: 10.1017/s1751731118000629
Matiuti, M., Matiuti, C. L., Garleac, C., and Hutu, I. (2020). Particularities of buffalo breeding in Romania. One Health Int. J. 6, 1–5.
Mayo, O. (2008). A century of hardy–weinberg equilibrium. Twin Res. Hum. Genet. 11, 249–256. doi: 10.1375/twin.11.3.249
McQuillan, R., Leutenegger, A. L., Abdel-Rahman, R., Franklin, C. S., Pericic, M., Barac-Lauc, L., et al. (2008). Runs of homozygosity in European populations. Am. J. Hum. Genet. 83, 359–372.
Michelizzi, V. N., Dodson, M. V., Pan, Z., Amaral, M. E., Michal, J. J., McLean, D. J., et al. (2010). Water buffalo genome science comes of age. Int. J. Biol. Sci. 6, 333–349. doi: 10.7150/ijbs.6.333
Mirhabibi, S., Manafiazar, G., Qaravisi, S., and Mahmoodi, B. (2007). Inbreeding and its effect on some productive traits in buffalos of South Iran. Ital. J. Anim. Sci. 6, 372–374. doi: 10.4081/ijas.2007.s2.372
Moss, A. R., Jouany, J. P., and Newbold, J. (2000). Methane production by ruminants: its contribution to global warming. Ann. De Zootech. 49, 231–253. doi: 10.1051/animres:2000119
Nicolazzi, E. L., Iamartino, D., and Williams, J. L. (2014). AffyPipe: an open-source pipeline for Affymetrix Axiom genotyping workflow. Bioinformatics 30, 3118–3119. doi: 10.1093/bioinformatics/btu486
Ouborg, N. J., Pertoldi, C., Loeschcke, V., Bijlsma, R., and Hedrick, P. W. (2010). Conservation genetics in transition to conservation genomics. Trends Genet. 26, 177–187. doi: 10.1016/j.tig.2010.01.001
Paradis, E., and Schliep, K. (2019). ape 5.0: an environment for modern phylogenetics and evolutionary analyses in R. Bioinformatics 35, 526–528. doi: 10.1093/bioinformatics/bty633
Pucher, E. V. (1988). Erstnachweis des Europäischen Wildesels (Equus hydruntinus Regalia, 1907) im Holozän Österreichs. Ann. Naturhist. Mus. Wien 92/B, 31–48.
Purcell, S., Neale, B., Todd-Brown, K., Thomas, L., Ferreira, M. A., Bender, D., et al. (2007). PLINK: a tool set for whole-genome association and population-based linkage analyses. Am. J. Human Genet. 81, 559–575.
Purfield, D. C., McParland, S., Wall, E., and Berry, D. P. (2017). The distribution of runs of homozygosity and selection signatures in six commercial meat sheep breeds. PLoS One 12:e0176780. doi: 10.1371/journal.pone.0176780
Roth, J., and Myers, P. (2004). Bubalus Bubalis. Avaliable online at: http://animaldiversity.ummz.umich.edu/site/accounts/information/Bubalus_bubalis.html (accessed April 20, 2012).
Santana, M. L. Jr., Aspilcueta-Borquis, R. R., Bignardi, A. B., Albuquerque, L. G., and Tonhati, H. (2011). Population structure and effects of inbreeding on milk yield and quality of Murrah buffalos. J. Dairy Sci. 94, 5204–5211. doi: 10.3168/jds.2011-4377
Thomas, P. D., Campbell, M. J., Kejariwal, A., Mi, H. Y., Karlak, B., Daverman, R., et al. (2003). PANTHER: a library of protein families and subfamilies indexed by function. Genome Res. 13, 2129–2141. doi: 10.1101/gr.772403
Turner, S. D. (2014). qqman: an R package for visualizing GWAS results using Q-Q and manhattan plots. bioRxiv [Preprint] doi: 10.1101/005165 [Preprint],
Wang, J. (2005). Estimation of effective population sizes from data on genetic markers. Philos. Trans. R. Soc. Lond. Ser. B Biol. Sci. 360, 1395–1409. doi: 10.1098/rstb.2005.1682
Welderufael, B. G., Løvendahl, P., de Koning, D.-J., Janss, L. L. G., and Fikse, W. F. (2018). Genome-wide association study for susceptibility to and recoverability from mastitis in danish holstein cows. Front. Genet. 9:141. doi: 10.3389/fgene.2018.00141
Wright, S. (1965). The interpretation of population-structure by F-statistics with special regard to systems of mating. Evolution 19, 395–420. doi: 10.1111/j.1558-5646.1965.tb01731.x
Zahariev, Z. I., Aleksiyev, A., and Nikolova, S. D. (1986). Morphological and Genetics Survey of Water Buffalos. Bivali: Zemizdat.
Zicarelli, L. (2001). La bufala Mediterranea Italiana: esempio di una razza autoctona in espansione. Sci. Tecn. Latt. Cas. 52, 279–284.
Keywords: Bubalus bubalis, European populations, genotyping, genetic diversity, population structure, run of homozygosity
Citation: Noce A, Qanbari S, González-Prendes R, Brenmoehl J, Luigi-Sierra MG, Theerkorn M, Fiege M-A, Pilz H, Bota A, Vidu L, Horwath C, Haraszthy L, Penchev P, Ilieva Y, Peeva T, Lüpcke W, Krawczynski R, Wimmers K, Thiele M and Hoeflich A (2021) Genetic Diversity of Bubalus bubalis in Germany and Global Relations of Its Genetic Background. Front. Genet. 11:610353. doi: 10.3389/fgene.2020.610353
Received: 25 September 2020; Accepted: 30 November 2020;
Published: 22 January 2021.
Edited by:
Muniyandi Nagarajan, Central University of Kerala, IndiaReviewed by:
Tingxian Deng, Institute of Buffalo (CAAS), ChinaLiguo Yang, Huazhong Agricultural University, China
Copyright © 2021 Noce, Qanbari, González-Prendes, Brenmoehl, Luigi-Sierra, Theerkorn, Fiege, Pilz, Bota, Vidu, Horwath, Haraszthy, Penchev, Ilieva, Peeva, Lüpcke, Krawczynski, Wimmers, Thiele and Hoeflich. This is an open-access article distributed under the terms of the Creative Commons Attribution License (CC BY). The use, distribution or reproduction in other forums is permitted, provided the original author(s) and the copyright owner(s) are credited and that the original publication in this journal is cited, in accordance with accepted academic practice. No use, distribution or reproduction is permitted which does not comply with these terms.
*Correspondence: Andreas Hoeflich, aG9lZmxpY2hAZmJuLWR1bW1lcnN0b3JmLmRl