 Cunling Jia
 Ying Bai
 Jianan Liu
 Wentao Cai
 Lei Liu
 Yanghua He
 Jiuzhou Song
- 1College of Animal Science and Technology, Northwest A&F University, Yangling, China
- 2Department of Animal & Avian Science, University of Maryland, College Park, MD, United States
- 3Research Centre for Animal Genome, Agricultural Genome Institute at Shenzhen, Chinese Academy of Agricultural Science, Shenzhen, China
- 4Department of Human Nutrition, Food and Animal Sciences, College of Tropical Agriculture and Human Resources, University of Hawaii, Manoa, HI, United States
Beef cattle raised under grass-fed and grain-fed have many differences, including metabolic efficiency and meat quality. To investigate these two regimens' intrinsic influence on beef cattle, we used high-throughput sequencing and metabolomics analyses to explore differentially expressed genes (DEGs) and metabolimic networks in the liver. A total of 200 DEGs, 76 differentially expressed miRNAs (DEmiRNAs), and two differentially expressed lncRNAs (DElncRNAs) were detected between regimen groups. Metabolic processes and pathways enriched functional genes including target genes of miRNAs and lncRNAs. We found that many genes were involved in energy, retinol and cholesterol metabolism, and bile acid synthesis. Combined with metabolites such as low glucose concentration, high cholesterol concentration, and increased primary bile acid concentration, these genes were mainly responsible for lowering intramuscular fat, low cholesterol, and yellow meat in grass-fed cattle. Additionally, we identified two lncRNAs and eight DEGs as potential competing endogenous RNAs (ceRNAs) to bind miRNAs by the interaction network analysis. These results revealed that the effects of two feeding regimens on beef cattle were mainly induced by gene expression changes in metabolic pathways mediated via lncRNAs, miRNAs, and ceRNAs, and contents of metabolites in the liver. It may provide a clue on feeding regimens inducing the metabolic regulations.
Introduction
Feeding regimens of beef cattle influence meat quality, growth rate, greenhouse emission, and animal welfare. Many studies reported the characteristic differences of beef cattle between grass-fed and grain-fed including the fat acid compositions, intramuscular fat and cholesterol contents, tenderness and flavor in the muscle (Sithyphone et al., 2011; Orime et al., 2012; Zhao et al., 2012; Li et al., 2015a,b; Carrillo et al., 2016; Berger et al., 2018; Mapato and Wanapat, 2018; Holman et al., 2019; Puzio et al., 2019). For grass-fed beef cattle, the growth rate reaching to market weight is slower than that of grain-fed (Cheung and McMahon, 2017), the intramuscular fat and cholesterol content are also low (Dunne et al., 2009) in beef, but omega-3: omega-6 fatty acids and CLA contents are high (Pavan and Duckett, 2013; Lobato et al., 2014). Meat intake from grass-fed cattle for an adult will significantly increase consumers' long-chain omega-3 PUFA content of plasma and platelet (McAfee et al., 2011), which will reduce the risk of coronary heart disease and resist thrombotic and inflammatory diseases (Mozaffarian et al., 2005). Besides, the grass-fed regimen can also improve animal welfare, eliminate risks of bovine spongiform encephalopathy (Lobato et al., 2014), and decrease carbon footprints (Lynch, 2019).
What is the molecular mechanism of inducing these differences between the two regimens? We had previously analyzed the possible mechanism based on transcriptome and metabolomics in the rumen (Li et al., 2015b), spleen (Li et al., 2015a), and muscle (Carrillo et al., 2016). Many identified differentially expressed genes (DEGs) were associated with a lower total fat and a higher omega-3/omega-6 ratio (Carrillo et al., 2016) in grass-fed cattle. Moreover, some other DEGs were associated with substance transport, organ and organism development in the rumen (Li et al., 2015b), with increasing immunity in the spleen (Li et al., 2015a), and with less stress for grass-fed cattle (Carrillo et al., 2016). Under two feeding regimens, the diet structure is different. A grass-fed diet has lower non-fibrous carbohydrates (NFC) and higher Neutral Detergent Fiber (NDF) than a grain-fed diet. Besides, the rearing environment and management patterns are also different. All these may induce metabolic differences in organisms and organs. As a result, there are many other characteristics for beef cattle under two regimens.
As an essential metabolic organ, the liver can detoxify various metabolites and produce biochemicals necessary for digestion. It also involves many functions such as bile production and excretion, cholesterol metabolism, hormones excretion, metabolism of fats, proteins, and carbohydrates (Mitra and Metcalf, 2009). At present, it is unclear how two feeding regimens affect the biological processes in the liver.
The changes in nutrition or/and environment can modify gene expression, involving epigenetic regulation. Although its precise role is difficult to be established because of multiple interactions between dietary components and other epigenetic regulators (Dauncey, 2012; Jiménez-Chillarón et al., 2012), it is worthy to mine the relationship between dietary regulating genes and epigenetic regulators.
So far, we have known different non-coding RNAs (ncRNAs) are involved in epigenetics processes. For example, long non-coding RNA (lncRNA) is an ncRNA class with more than 200 nucleotides in length. In mammalian genomes, plenty of lncRNAs are engaged in different biological processes through diverse mechanisms, including the function as scaffolds, decoys or signals, regulation of gene expression in cis, or trans antisense interference (Kung et al., 2013). MicroRNA (miRNA) is also a type of ncRNAs with 18–25 nucleotides in length. It binds to the complementary sequence mainly in the 3'UTR of target mRNA and thereby regulates gene expression (Bartel, 2004; Winter et al., 2009). Previous studies reported that the expression of miRNAs and lncRNAs correlated with diet and lifestyle (Palmer et al., 2014; Slattery et al., 2017; Silva and van Booven, 2018). LncRNAs can act as molecular sponges of miRNAs through microRNA response elements (MREs) and function as a competing endogenous RNA (ceRNA) to protect mRNA (Ebert et al., 2007; Tay et al., 2014). The coding and noncoding RNA can interact with each other through MREs and form large-scale regulatory networks across the transcriptome, which will make sense to uncover the mechanism of biology phenomenon (Salmena et al., 2011).
In this study, we hypothesize that different metabolisms exist in the liver associated with beef cattle's characteristic differences under two feeding regimens. To test it, we performed transcriptome analyses in the liver and metabolomics analyses in blood to identify functional genes, pathways, and metabolites and construct a regulatory network. We believe these results would provide a deep insight into the metabolic mechanisms and benefit the beef industry to produce healthier and higher quality beef.
Materials and Methods
Ethics Approval
All experiments were conducted using procedures approved by the Institute of Animal Care and Use Committee at the University of Maryland.
Animals and Samples Collection
Liver samples of Wye Angus steer under grass-fed and grain-fed were collected when they reached market weight (the average final weights and ages were 459.6 ± 35.87 kg, 14 months old for the grain-fed steers and 471.1 ± 36.49 kg, 21 months old for grass-fed steers). Before slaughtering, 10 ml of whole blood from the jugular vein was collected in EDTA tubes and directly stored at −80°C for metabolite measurement. After killing, six individuals' liver samples located at lobus hepatis sinister from the grass-fed and grain-fed group (each group of three individuals) were collected, immediately frozen in dry ice, returned to the laboratory, and frozen at −80°C for farther analyses. Since this population has been closed for more than 70 years, all individuals have a similar genetic background. The diet composes of grass-fed (mainly including alfalfa, hay, or grass pasture) or grain-fed (mainly including corn silage, shelled corn, soybean, and minerals, etc.), and feeding regimens were the same as the description from Carrillo et al. (2016). The diet nutrition components of grass-fed and grain-fed cattle were different: soluble protein 28 and 47%, respectively, the ratio of non-fiber carbohydrates and neutral detergent fiber (NFC: NDF) 0.33 and 1.59, starch 0.2 and 35.6%, total digestible nutrients 60 and 73%, net energy (for milk, maintain, and gain) 1.42 and 2.07 Mcal/lb based on the dry mess (Carrillo et al., 2016).
Library Preparation and High-Throughput Sequencing for mRNA and miRNA
According to the manual instruction, total RNA was extracted and purified from liver samples using the RNAeasy® Plus Mini Kit (Qiagen, Valencia, CA). The concentration of RNA was accessed by a Nanodrop ND-2000 spectrophotometer (Thermo Fisher Scientific, DE, USA). The RNA integrity (RIN) was checked by the Bioanalyzer 2100 system (Agilent Technologies, CA, USA), and RIN was more than 7.0. The cDNA libraries were built using the NEBNext® Ultra™ RNA Library Prep Kit for Illumina® (NEB, USA). The Agilent Bioanalyzer 2100 system was used to measure the libraries' quality for RNA-seq from each sample of grass-fed cattle and grain-fed cattle. Each library was sequenced in 50 bp reads length using the Illumina® HiSeq 2000 platform (Williams et al., 2014; Hrdlickova et al., 2017).
Small RNA with 18–30 nt was obtained from the total RNA, and adapter ligation and RT-PCR were carried out to construct small RNA libraries for six liver samples of grass-fed and grain-fed cattle using TruseqTM Small RNA sample prep kit according to the protocols (Lagos-Quintana et al., 2001). These libraries were sequenced with 50 bp single-end reads on an Illumina HiSeq 2000 platform.
Reads Quality Control, Alignment, and Annotation
Raw reads were processed by removing adapters and low-quality reads using FastQC (Version 0.11.5) (Andrews and Fast, 2010) to perform quality control. For RNA-seq, reads after filtered and trimmed by Trimmomatic-0.36 (Bolger et al., 2014) were mapped to Bos taurus reference genome (ARS-UCD1.2) using Hisat2-2.1.0 (Kim et al., 2019). Small RNA reads with low quality and length <17 or >25 after deleting adapters were removed. Reads were mapped to Bos taurus reference genome (ARS-UCD1.2). The known miRNAs were identified based on the miRBase 22.0 (http://www.mirbase.org/) database using miRDeep2 software (Friedländer et al., 2012).
Identification of DEGs and DEmiRNAs, and Prediction of DEmiRNAs Targets
DEGs were analyzed using cuffdiff (Trapnell et al., 2012), and DEmiRNAs were identified by the EdgeR package in R software (Robinson et al., 2010). Genes with a false discovery rate (FDR) <0.1 were identified as DEGs and DEmiRNAs. We used TargetScan version7.2 (Agarwal et al., 2015) and miRanda (v3.3a) (score cutoff ≥ 140, energy cutoff ≤ -15 kcal/mol, scaling: 4) (Enright et al., 2003) to predict conserved miRNA target sites on the mRNAs. For further analysis, we used common miRNA-targets from both software.
Mining lncRNA From RNA-seq Data
Based on the Bos taurus reference genome (ARS-UCD1.2) annotated 9,626 lncRNAs (Refseq), we used cuffdiff to calculate fragments per kilobase of exon model per million mapped fragments values and identified possibly DElncRNAs in a grass-fed group vs. grain-fed group from RNA-seq data. To explore the function of lncRNAs, we predicted the target genes of lncRNAs in cis- and trans-regulation. The cis-regulation targets of lncRNAs were searched within 100 kb down-stream and up-stream of DElncRNAs. The potential targets of lncRNA in trans-regulation were predicted by calculating the correlation coefficients between lncRNAs and mRNAs. When Spearman correlation coefficients were more than 0.9, DElncRNA-mRNA pairs were regarded as candidate coexpression gene pairs.
Bioinformatics Analysis of DEGs, Targets of DEmiRNAs and Coexpression Genes of DElncRNAs
We used the online STRING tools (http://string-db.org/) for the Gene Ontology enrichment and KEGG pathways analysis of DEGs, targets of DEmiRNAs, and coexpression genes of DElncRNAs. All enrichment results with FDR <0.05 were deemed to be significant.
Construction Interaction Network of DElncRNAs, DEmiRNAs, and DEGs
The conserved MREs were predicted in DElncRNAs using miRanda (v3.3a) (Enright et al., 2003). Based on the obtained DEmiRNAs-DEGs, DElncRNAs-DEGs, and DElncRNAs-DEmiRNAs pairs, we constructed an interaction network. The regulatory network was visualized by using the Cytoscape 3.5.0 (http://www.cytoscape.org/).
Validation of DEGs, DEmiRNAs, and DElncRNAs Expression by Real-Time PCR
We randomly selected six DEGs, six DEmiRNAs, and all DElncRNAs to validate transcriptome sequence reliability using reverse transcription real-time PCR (RT-qPCR). The RT-qPCR primers were designed using Primer Premier 5.0 (http://downloads.fyxm.net/Primer-Premier-101178.html) for DEGs and DElncRNAs. For DEmiRNAs, stem-loop primers were designed for RT-qPCR analysis. All primers were synthesized by Integrated DNA Technologies, Inc., USA. Total RNA of each sample was extracted using the RNAeasy® Plus Mini Kit (Qiagen, Valencia, CA), and 1 μg total RNA was reversely transcribed to cDNA using the QuantiTect® Reverse Transcription Kit (Qiagen, Valencia, CA) for DEGs and DElncRNAs, and using the Taqman MicroRNA Reverse Transcription kit and specific stem-loop RT primers for DEmiRNAs according to manufacturer's instructions. The RT-qPCR was performed using BIORAD iQ™ SYBR® Green Supermix (BIO-RAD, USA) on the BIORAD iQ5 Real-time PCR Detection System. The 10 μl PCR reaction volume included 100 ng RT product, 5 μl 2 × iQ™ SYBR Green supermix, 300 nM forward primers, and 300 nM reverse primer (for all miRNA, using universal reverse primer), and the rest was RNase-free water. We chose GAPDH for mRNA and lncRNA and U6 for miRNA as the endogenous control genes. We performed three technical replicates for each sample, and included negative controls without a template. Fold-changes of mRNA, miRNA, and lncRNA expression were calculated using the 2−ΔΔCT method (Livak and Schmittgen, 2001).
Metabolomics Measure and Analysis
Whole blood samples from 16 individuals (8 samples for each group) were submitted to Metabolon Inc. (Durham, NC, USA) for metabolomic analysis. The extracted samples using Metabolon's standard solvent extraction method were split into equal parts for analysis on the GC/MS and UPLC/MS/MS platforms (Kennedy et al., 2013). Automated comparisons detected the samples' biochemical molecules to the Metabolon's reference library (326 compounds of known identity), and MS/MS patterns of thousands of commercially available purified standard biochemicals tested using the Metabolon's mass spectrometry platform. The combination of chromatographic properties and mass spectra indicated a match to a specific metabolite. The biochemical component's measured method in samples for GC/MS and UPLC/MS/MS was same as described before (Carrillo et al., 2016).
Statistical Analysis
In metabolomics analysis, following median scaling, imputation of missing values (if any) with the minimum observed value for each compound, and log transformation median scaled data, Welch's two-sample t-test was used to identify biochemicals that differed significantly between experimental groups. A statistical significance criterion was set at P < 0.05. The q-value was estimated to take into account the multiple comparisons. Statistical analyses were performed with the R program (http://cran.r-project.org/).
Results
Expression Profile of mRNAs in the Liver From Grass-Fed and Grain-Fed Cattle
To characterize the differences of beef cattle under two regimens, the transcriptomes of the liver were analyzed. A total of 17,900,957 and 20,929,124 clean reads were left for grass-fed and grain-fed groups, respectively. An average of 90% clean reads was mapped to the Bos taurus reference genome (Supplementary Table 1). Based on FDR's criterion below 0.1, a total of 200 DEGs were found. Among these, 100 genes were up-regulated and 100 genes were down-regulated in a grass-fed group compared with a grain-fed group (Supplementary Table 2).
Functional Analysis of DEGs
In the liver, DEGs from grass-fed vs. grain-fed group were enriched to 150 biological processes (BPs), 24 cellular components (CCs), five molecular functions (MFs), 11 KEGG pathways (FDR < 0.05) (Supplementary Table 3). Significant GO terms and KEGG pathways were mainly involved in negative regulation of the metabolic process, regulation of catalytic activity, oxidation-reduction process, and metabolic pathway (Figure 1).
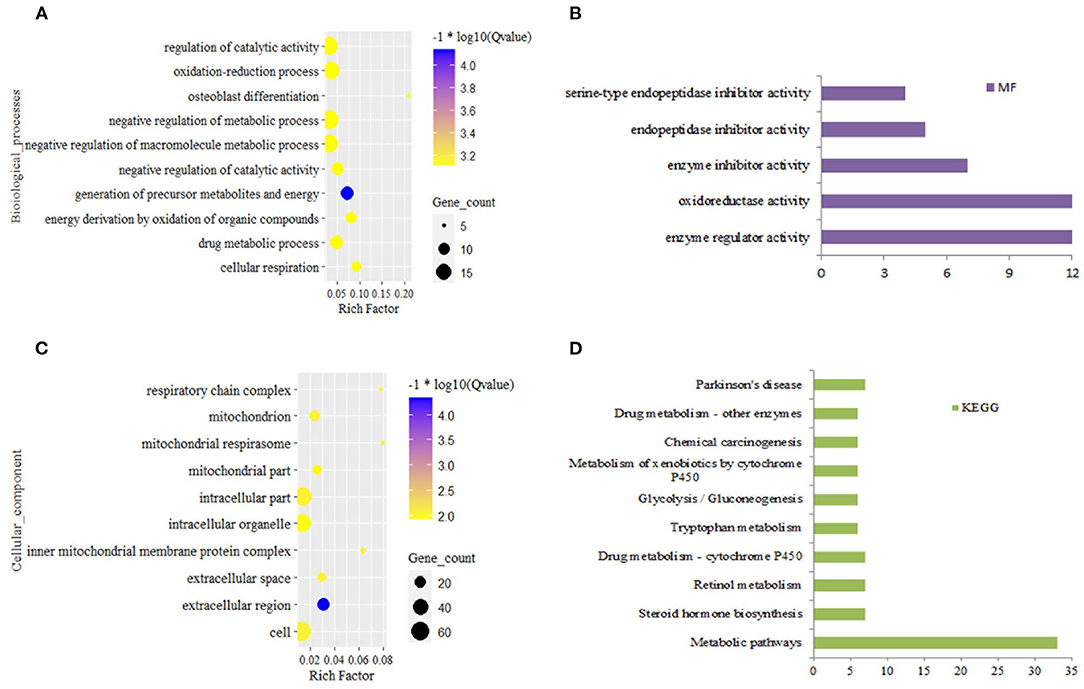
Figure 1. Top 10 significantly enriched function for differential expression gene in grass-fed vs. grain-fed. Biological process (A), molecular function (B), cellular component (C), and KEGG pathways (D).
Global miRNA Expression Pattern in the Liver From Grass-Fed and Grain-Fed Cattle
The small RNA libraries were constructed from six individual liver samples collected from grass-fed and grain-fed cattle. In total, 54.94 and 54.55 million raw reads were obtained from grass-fed and grain-fed groups, respectively. After filtering the low-quality sequences, 44.38 and 37.42 million clean reads in grass-fed and grain-fed groups were used for further analysis. For grass-fed and grain-fed groups, 57.7 and 48.37% of the cleaned reads were successfully mapped. Known miRNAs were identified based on miRBase 22.0 (http://www.mirbase.org/) using the miRDeep2 software (Friedländer et al., 2012). A total of 445 known mature miRNAs (with count >2 at least two individuals) were detected. After the difference of miRNA expression between grass-fed and grain-fed cattle were analyzed, a total of 76 known mature DEmiRNAs (FDR < 0.1) were found. Among these, 64 down-regulated miRNAs and 12 up-regulated miRNAs were detected in grass-fed vs. grain-fed group (Figure 2, Supplementary Table 4).
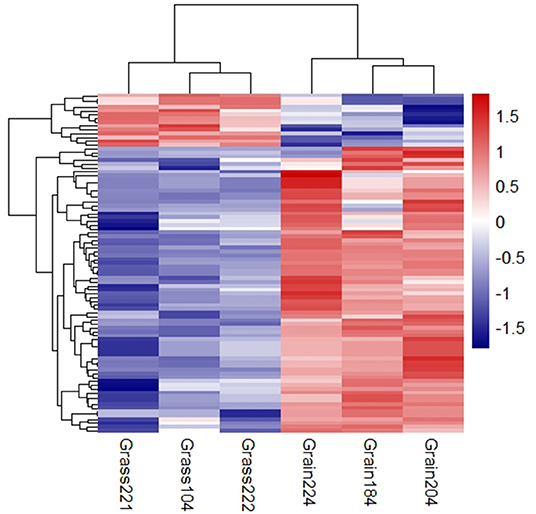
Figure 2. Cluster analysis of differential expression miRNAs in grass-fed vs. grain-fed. On the top-right of the figure, the color difference represents the relative abundance.
Functional Annotation of DEmiRNAs Targets
A total of 374 DEmiRNAs-DEGs pairs with the reverse relationship were obtained. Functional analysis showed target DEGs of down-regulated DEmiRNAs were enriched to 64 BPs, one MF, and five KEGG pathways. Still, target DEGs of up-regulated miRNAs were only enriched to one MF, two CCs, and no BP and KEGG pathway (FDR < 0.05) (Figure 3; Supplementary Table 5). We found that the target DEGs were mainly enriched to the regulation of macromolecule metabolic process,response to stimulus and metabolic pathways.
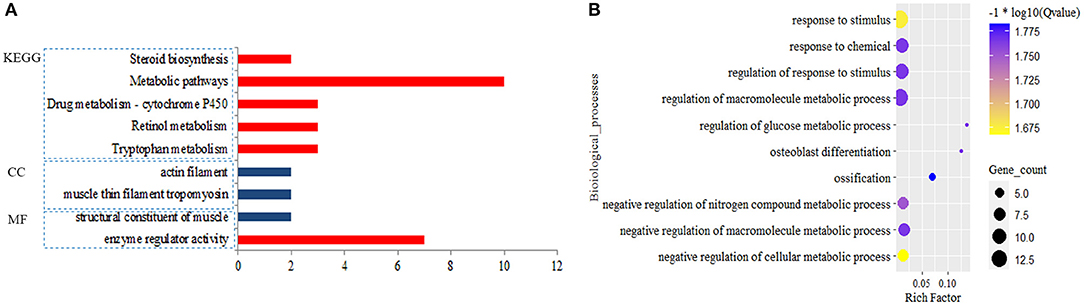
Figure 3. Significantly enriched function for the target genes of differential expression miRNAs (DEmiRNAs). Blue pillar represented the enrichment from down-regulated target genes and red pillar from up-regulated target genes by DEmiRNAs (A); Biological process (B).
Identification and Functional Analysis of Differential Expressed lncRNAs
Based on annotated Bos taurus reference genome, we identified two differentially expressed lncRNAs (DElncRNAs) i.e., lnc_ENSBTAT00000076705 and lnc_ENSBTAT00000068696 in liver from RNA-seq data. They were up-regulated in the grass-fed group compared with the grain-fed group. The lnc_ENSBTAT00000076705 was co-located with eight genes (PTGDR2, MS4A10, CCDC86, TMEM109, TMEM132A, SLC15A3, PRPF19, CD6), and lnc_ENSBTAT00000068696 was co-located only with one gene (AGPS) within a 100 kb window up-stream or down-stream of DElncRNAs through cis analysis. Still, all these co-located genes were no significant difference between grass-fed group and grain-fed group. We also performed a coexpression analysis by calculating the expression correlation coefficients between lncRNAs and mRNAs. A total of 141 DElncRNA-mRNA pairs were detected (|r| > 0.9) (Supplementary Table 6). The potiential regulated DEGs enriched to 192 BPs, 9 MFs, 34 CCs, and 15 KEGG pathways (FDR < 0.05) (Supplementary Figure 1; Supplementary Table 7). These coexpression DEGs were also mainly enriched to metabolic processes and pathways.
Construction of DElncRNAs, DEmiRNAs, and DEGs Interaction Networks in Metabolism
The relationship between DElncRNA and DEmiRNA was predicted by miRanda software. As a result, two lncRNAs were related to 11 miRNAs (Supplementary Table 8). Based on the above results of function enrichments, the metabolic processes and pathways were the focus. In order to clarify the metabolic regulating relationship, we constructed an interaction network from DEGs, DElncRNAs, and DEmiRNAs with 114 nodes and 193 edges using Cytoscape (http://www.cytoscape.org/) (Figure 4). We found two lncRNAs, eight DEGs including 24-dehydrocholesterol reductase (DHCR24), sterol-C5-desaturase (SC5D), glycine amidinotransferase (GATM), sulfotransferase family 1B member 1 (SULT1B1), C-C motif chemokine ligand 3 (CCL3), recombination signal binding protein for Iimmunoglobulin kappa J region (RBPJ), IGFBP3, mitochondrial transcription elongation factor (TEFM), and seven DEmiRNAs (bta-miR-1248, bta-miR-1434-3p, bta-miR-708, bta-miR-677, bta-miR-150,bta-miR-2484, and bta-miR-2332) formed ceRNA regulatory networks of lncRNAs-miRNAs-mRNAs (nodes with red edge in Figure 4).
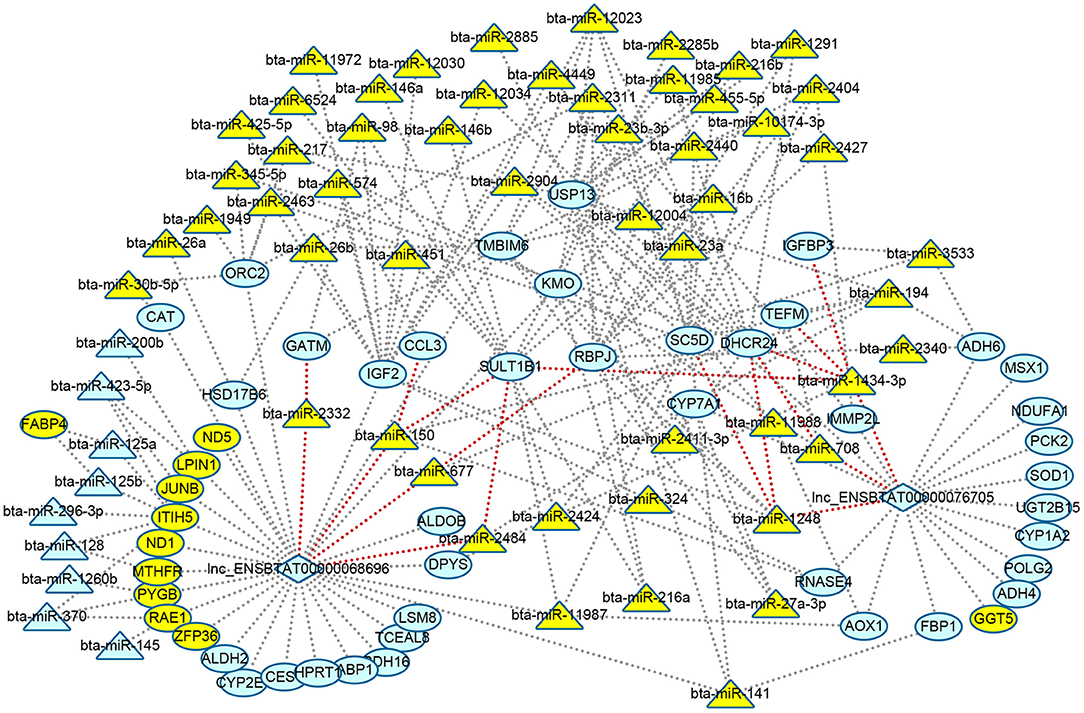
Figure 4. Visualizing regulatory networks of metabolic processes and pathways in liver for grass-fed vs. grain-fed group. Blue represented RNAs up-regulated; green represented RNAs down-regulated; triangle represented miRNAs; circle represented differential expression genes; diamond represented lncRNAs; and red lines represented the edge of lncRNA-miRNA-mRNA network.
Validation of DEGs, DEmiRNAs, and DElncRNAs by RT-qPCR
In the present study, RT-qPCR analysis was performed in six DEGs, six DEmiRNA with random selection, and two DElncRNAs. Primers were designed for RT-qPCR analysis (Supplementary Table 9). We confirmed the expression consistency between the RT-qPCR results and RNA-seq data from the grass-fed and grain-fed group (Figure 5).
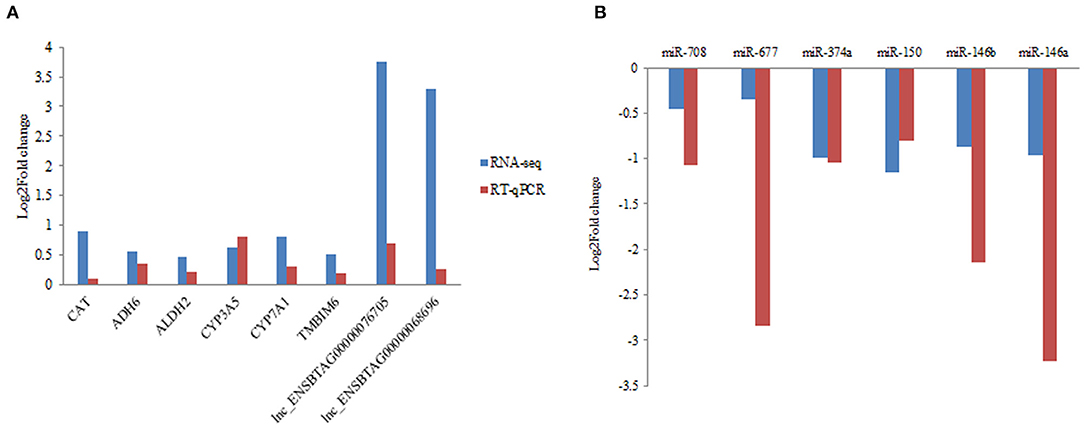
Figure 5. Validation of differentially expressed mRNA, miRNA, and lncRNA by RT-qPCR in liver samples. (A) The quantification of mRNA and lncRNA in liver from grass-fed vs. grain-fed groups. (B) The quantification of miRNA in liver from grass-fed vs. grain-fed group.
Carbohydrate, Cholesterol, Bile Acid, and Other Metabolites Changes Related to Energy Metabolism in Blood From Metabolomics Analysis
Metabolomics analysis was performed by GC/MS and UPLC/MS/MS. We found the glucose, pyruvate, and lactate concentrations in the carbohydrate metabolism pathway were significantly lower in the grass-fed group than that of the grain-fed group (P < 0.05) (Table 1). The related metabolites to tricarboxylic acid cycle (TCA) like alpha-ketoglutarate, succinylcarnitine and succinate, and oxidative phosphorylation like pyrophosphate were also significantly lower in the grass-fed group than that of the grain-fed group (P < 0.05) (Table 1). However, fructose and the mixed isobar were significantly higher in the grass-fed group than that of the grain-fed group (P < 0.05) (Table 1).
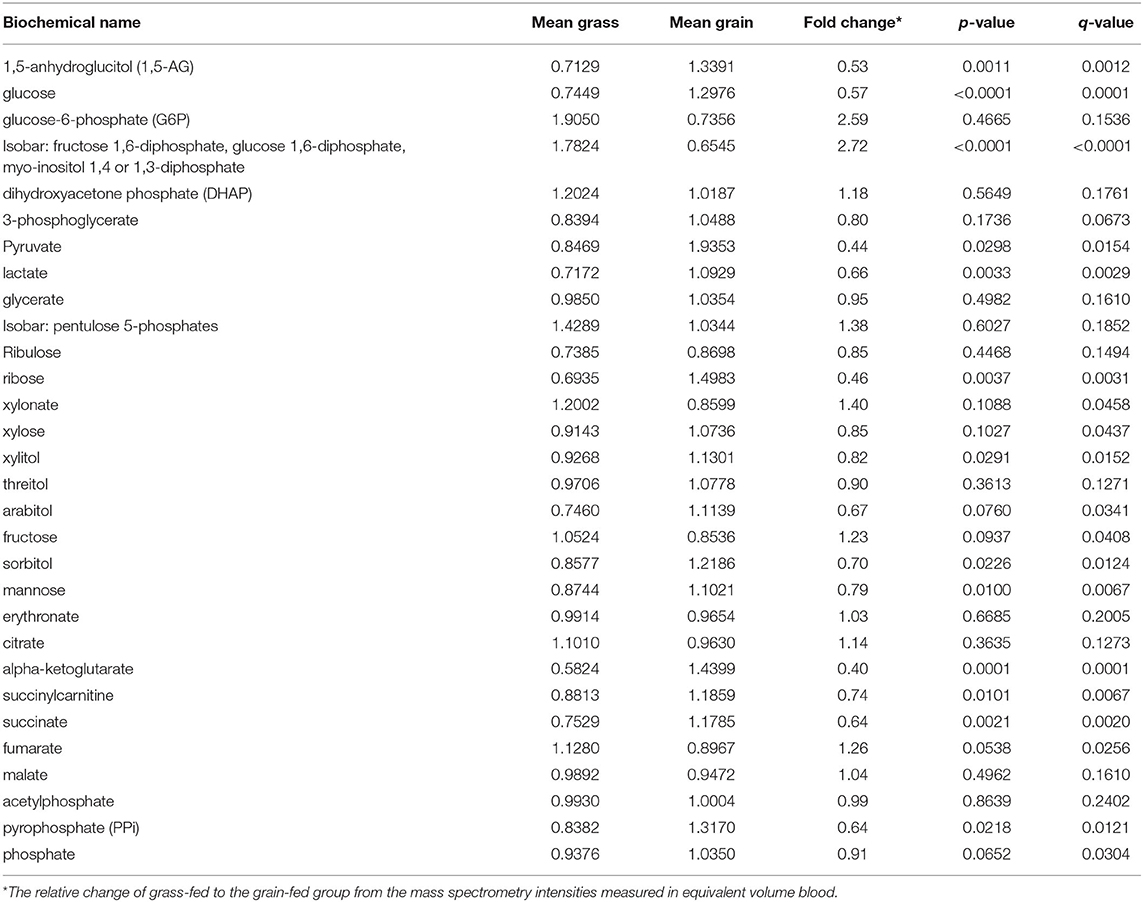
Table 1. Differences between carbohydrate and other energy metabolites in blood between grass-fed and grain-fed beef cattle.
The concentrations of sterol, primary and second bile acid metabolites in blood from grass-fed and grain-fed groups were shown in Table 2. The concentrations of cholesterol, beta-sitosterol, glycocholate and glycochenodeoxycholate (primary bile acid), and 7-ketodeoxycholate (second bile acid) in blood from the grass-fed group were significantly higher than that of the grain-fed group (P < 0.05).
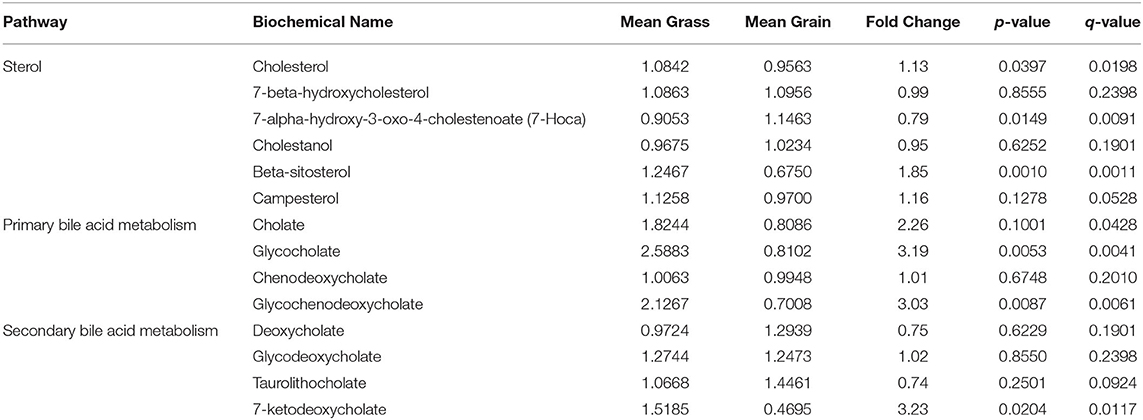
Table 2. Changes of cholesterol and bile acid concentrations in blood from grass-fed and grain-fed beef cattle.
Discussion
The liver, as a vital organ, involved in a series of metabolic and homeostatic functions (Berg et al., 2002), removal of waste products and detoxification (Moubarak and Rosenkrans, 2000), bile acid synthesis (Vessey et al., 1977), and hormone secretion (Rao et al., 1979). Our studies indicated that many mRNAs and ncRNAs expression in liver and metabolite levels in the blood of beef cattle are different under two feeding regimens, which suggested the complexity of metabolic regulation.
For pastures, the most limiting nutrient factor is energy sources. In our study, the diet in the grass-fed group had more structural carbohydrates, and the ratio of NFC and NDF was lower than that of the grain-fed group. Glucose is an energy carrier rarely absorbed from the small intestine, especially for ruminants feeding high roughage (like grass-fed) compared with that of feeding high grain diet (like grain-fed) (McAllan and Smith, 1974). According to the metabolomics analysis results, blood glucose, pyruvate, and lactate in the grass-fed group were lower than that of the grain-fed group (Table 1). Moreover, the concentrates of metabolites from TCA and pentose pathways were also low in the grass-fed group. All these indicated that there was a demand trend of glucose for homeostasis in the grass-fed group. Our data supported the previous study that the highly expressed proteins in the low feed efficiency group were enriched glycolysis/gluconeogenesis and fatty acids degradation pathway (Fonseca et al., 2019). In our study, glycolysis, gluconeogenesis, and fatty acids degradation genes included aldolase, fructose-bisphosphate B (ALDOB), phosphoenolpyruvate carboxykinase 2 (PCK2), fructose-1,6-bisphosphatase 1 (FBP1), alcohol dehydrogenase 4 (ADH4), ADH6, and acetaldehyde dehydrogenase 2 (ALDH2), which were up-regulated in the grass-fed group (Figure 1 and Supplementary Tables 3, 4). Aldolase B is encoded by the ALDOB gene, a key enzyme for fructose metabolism, and preferentially expressed in the liver. It catalyzes the specific and reversible cleavage of fructose-1,6-bisphosphate and fructose-1-phosphate into dihydroxyacetone phosphate and d-glyceraldehyde-3-phosphate, or d-glyceraldehyde for gluconeogenesis and glycolysis (Devuyst and Igarashi, 2018). Fructose-1,6-bisphosphatase 1 encoded by the FBP1 gene catalyzes the hydrolysis of fructose 1,6-bisphosphate to fructose 6-phosphate, acting as a rate-limiting enzyme in gluconeogenesis (Granner and Pilkis, 1990). Isozymes M of phosphoenolpyruvate carboxykinase is encoded by the PCK2 gene, which catalyzes oxaloacetate conversion to phosphoenolpyruvate, the rate-limiting step in the metabolic pathway that produces glucose from lactate and other precursors derived from the citric acid cycle (Beale et al., 2007). It indicated that grass-fed cattle needed to mobilize the genes in the liver related to glycolysis/gluconeogenesis, fatty acids degradation, and amino acid metabolism pathways to meet the energy demand. In the KEGG pathways, seven genes were enriched to retinol metabolism, including ADH4, ADH6, aldehyde oxidase 1 (AOX1), cytochrome P450 family one subfamily A member 2 (CYP1A2), hydroxysteroid (17-beta) dehydrogenase 6 (HSD17B6), retinol dehydrogenase 16 (RDH16), UDP glucuronosyltransferase family two-member B15 (UGT2B15) (Figure 6 and Supplementary Table 4). Beef cattle fed high forage rations have more yellow carcass fat than that of concentrate-fed counterparts (Daley et al., 2010), caused by carotenoids from forages. Carotenes (mainly β-carotene) are precursors of retinol (Vitamin A), which is essential for healthy vision, bone growth, reproduction, cell division, and cell differentiation (Scott et al., 1994). Diets based on grass can elevate precursors for Vitamin A, so beef from grass-fed steers is rich in vitamin A (Descalzo et al., 2005), which are healthy for people.
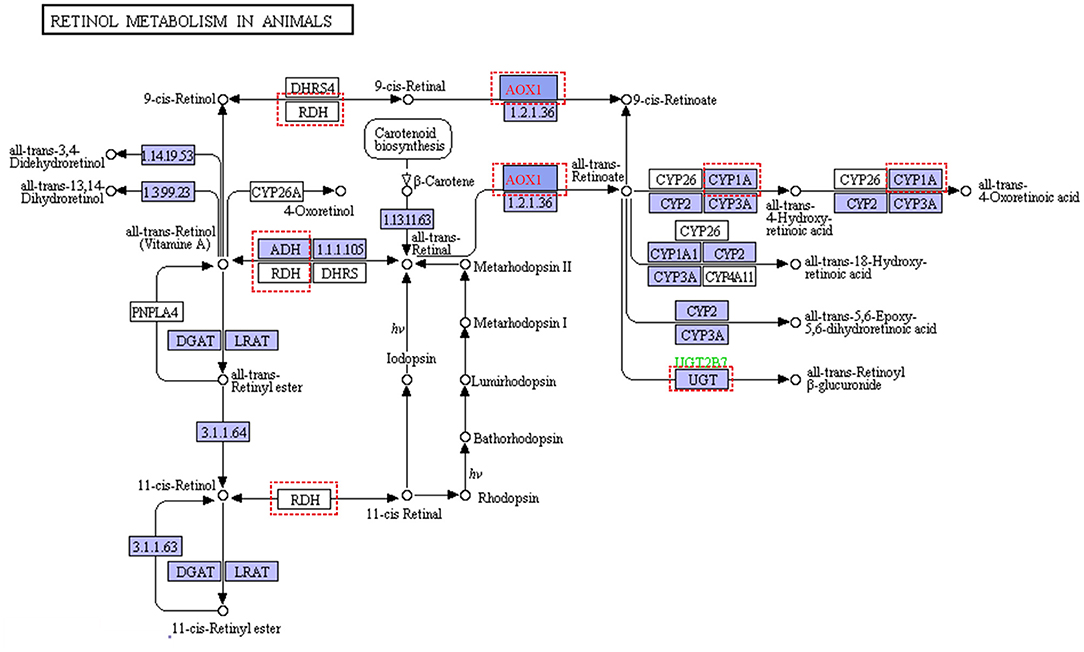
Figure 6. Retinol metabolism in animal (https://www.genome.jp/kegg-bin/show_pathway?ec00830+1.2.3.1). Red dashed represented differential expression genes in liver from grass-fed cattle.
Besides, we found cytochrome P450 family 7 subfamily A member 1 (CYP7A1), DHCR24, and SC5D related to steroid biosynthesis (Supplementary Tables 3, 4) in the liver from the grass-fed group attended in cholesterol and bile acid synthesis. No matter the Bloch pathway or Kandutsch-Russell pathway, both DHCR24 and SC5D are involved (Bae and Paik, 1997). SC5D, encoded by the SC5D gene, catalyzes the conversion of lathosterol (Kandutsch-Russell pathway) or 24-dehydrolathosterol (Bloch pathway) into 7-dehydrocholesterol or 7-dehydrodesmosterol, which is the precursor for the synthesis of cholesterol. DHCR24, encoded by the DHCR24 gene, is the final enzyme of the cholesterol biosynthetic Bloch pathway, and in Kandutsch-Russell pathway catalyzes the conversion of lanosterol to 24,25 dihydro lanosterol (Bae and Paik, 1997). Since cholesterol synthesis is an energetically expensive process, cooperativity would ensure that critical genes must be strongly activated to commit to cholesterol synthesis (Zerenturk et al., 2012). Impaired SC5D or DHCR24 activity leads to a deficiency of cholesterol (Jiang et al., 2010; Muse et al., 2018). In this study, according to the results from the metabolomic analysis, cholesterol concentration in blood was higher for the grass-fed group than that of the grain-fed group (Table 2). Previous studies reported that beef's cholesterol content from grass/forage-fed was lower than that of grain-finished cattle (Rule et al., 2002). Steers with low feed efficiency had increased bloodstream pools of cholesterol (Montanholi et al., 2017). The concentration of cholesterol is dynamic in the liver and blood. Besides, bile acid synthesis is also recognized as a primary output pathway of cholesterol from the body (Liepa et al., 1978). This study found that CYP7A1 encoding cholesterol 7-hydroxylase was up-regulated in the liver from the grass-fed group (Supplementary Table 4). CYP7A1 is a rate-limiting enzyme of the classic pathway of bile acid synthesis (Chiang and Ferrell, 2018). It catalyzes cholesterol to form primary bile acid: cholic (CA) and chenodeoxycholic acid (CDCA), and their conjugates Tauro(glycol)cholic acid (T(G)CA) and Tauro(glycol) chenodeoxycholic acid (T(G)CDCA), which are actively transported into bile and become part of the circulating bile acid pool. In the small intestine, T(G)CA and T(G)CDCA are converted to secondary bile acids: deoxycholic acid (DCA) and Lithocholic acid (LCA), respectively (Chiang, 2013). The classic pathway of bile acid is predominant for ruminants (Sheriha et al., 1968). From our metabolomic results, the contents of GCA and GCDCA (belonged to primary bile acid) in blood from the grass-fed group were significantly higher than that of the grain-fed group (Table 2). Still, the concentration of secondary bile acids and conjugates (DCA and GDCA) showed no difference in blood between the two groups. Previous reports, both in ruminant and human studies, showed that diet composition could affect the bile acid types (Sheriha et al., 1968; Madden, 2003). When a high fiber diet is consumed, there is a greater excretion of bile acids in feces, thus less can reach the liver for re-secretion. Reversely, for a less-fiber diet, because of dehydroxylation transited to DCA slowly in the colon, the secondary bile acid is reabsorbed and inhibits the production of primary bile acid (Sheriha et al., 1968; Madden, 2003). Recently, bile acids have been discovered as regulatory molecules. Enterohepatic circulation of bile acids plays a central role in the regulation of bile acids synthesis, fatty acid, lipid, and lipoprotein synthesis, as well as glucose metabolism in the liver (Kullak-Ublick et al., 2004). Besides, vitamin A also affected bile acid synthesis by regulating CYP7A1 expression (Schmidt et al., 2010). Meanwhile, bile acids can promote the intestinal absorption of lipid-soluble vitamins including vitamin A. Between vitamin A metabolism and bile acid synthesis, there is a negative feedback regulatory relationship.
Like diet, nutrients, environment, and management, many factors can alter gene expression by epigenetic modulations (Tarallo et al., 2014; Law and Holland, 2018). Though the number of samples was relatively small, our data provided initial analysis on epigenetic regulation mechanism. The results still showed some valuable information. Noncoding RNAs like miRNAs and lncRNAs were one of the modification components of gene expression regulation. In the present study, we identified 76 DEmiRNAs (Figure 2, Supplementary Table 6) and two DElncRNAs in the grass-fed vs. grain-fed group. In the metabolic processes and pathways networks, we found many genes were regulated by one or many miRNAs and lncRNAs (Figure 4). CYP7A1 was regulated by three miRNAs (bta-miR-2484, bta-miR-27a-3p, and bta-miR-194) and one lncRNA in the grass-fed group. RNAs also influence each other's levels by competing for a limited miRNA pool (Salmena et al., 2011). Based on the interaction network, we found two lncRNAs and eight genes might act as ceRNA to bind miRNA (Figure 4), which affected gene expression.
Conclusions
Our results indicated grass-fed induced the gene expression in glycolysis/gluconeogenesis, fatty acids degradation, and amino acid metabolism pathway in the liver to meet energy demand and maintain glucose homeostatic, and consequently improve beef quality. These genes were related to epigenetic regulation, which may offer new perspectives on different feeding regimens inducing metabolic regulation.
Data Availability Statement
The datasets presented in this study can be found in online repositories. The names of the repository/repositories and accession number(s) can be found here: https://www.ncbi.nlm.nih.gov/, GSE145376; https://www.ncbi.nlm.nih.gov/, GSE145377.
Ethics Statement
The animal study was reviewed and approved by the Institute of Animal Care and Use Committee at the University of Maryland. Written informed consent was obtained from the owners for the participation of their animals in this study.
Author Contributions
JS designed the experiments. CJ and JS analyzed the data and wrote the manuscript. LL, WC, and YH gave some help when analyzing data. CJ, JL, and YB performed the main experimental results. All authors read and approved the final manuscript.
Funding
This work was supported by Shaanxi Science and Technology Coordination and Innovation Project (2015KTCL02-01) Maryland Agricultural Experiment Station (MAES), Jorgensen Endowment Funds.
Conflict of Interest
The authors declare that the research was conducted in the absence of any commercial or financial relationships that could be construed as a potential conflict of interest.
Acknowledgments
Thanks for the support of the China Scholarship Council.
Supplementary Material
The Supplementary Material for this article can be found online at: https://www.frontiersin.org/articles/10.3389/fgene.2021.579393/full#supplementary-material
Supplementary Figure 1. Top 10 significantly enriched function from differential interaction genes with two lncRNAs. Biological process (A), cellular component (B), molecular function (C), and KEGG pathways (D) for grass-fed vs. grain-fed group.
Abbreviations
DEGs, differentially expressed genes; DEmiRNA, differentially expressed miRNA; ncRNAs, noncoding RNAs; lncRNA, long noncoding RNA; DElncRNA, differentially expressed lncRNA; ceRNA, competing endogenous RNAs; NFC, non-fibrous carbohydrates; NDF, Neutral Detergent Fiber; MREs, microRNA response elements; GO, gene ontology; BP, biological processes; CC, cellular component; MF, molecular function; ADH6, alcohol dehydrogenase 6; AOX1, aldehyde oxidase 1; CYP7A1, cytochrome P450 family 7 subfamily A polypeptide 1; DHCR24, 24-dehydrocholesterol reductase; DPYS, dihydropyrimidinase; FBP1, fructose-bisphosphatase 1; GATM, glycine amidinotransferase; HSD17B6, hydroxysteroid (17-beta) dehydrogenase 6; KMO, kynurenine 3-monooxygenase; SC5D, sterol-C5-desaturase; ALDOB, aldolase, fructose-bisphosphate B; TCA, tricarboxylic acid cycle; FBP1, Fructose-1, 6-bisphosphatase 1; PCK2, phosphoenolpyruvate carboxykinase 2; CYP1A2, cytochrome P450 family 1 subfamily A member 2; RDH16, retinol dehydrogenase 16; UGT2B15, UDP glucuronosyltransferase family 2 member B15; SULT1B1, sulfotransferase family 1B member 1; CCL3, C-C Motif Chemokine Ligand 3; RBPJ, Recombination Signal Binding Protein For Immunoglobulin Kappa J Region; TEFM, mitochondrial transcription elongation factor; CA, cholic acid; CDCA, chenodeoxycholic acid, T(G)CA, tauro(glyco)cholic acid; T(G)CDCA, tauro(glyco) chenodeoxycholic acid; DCA, deoxycholic acid; LCA, Lithocholic acid.
References
Agarwal, V., Bell, G. W., Nam, J. W., and Bartel, D. P. (2015). Predicting effective microRNA target sites in mammalian mRNAs. Elife 4:28. doi: 10.7554/eLife.05005.028
Andrews, S., and Fast, Q. C. (2010). A quality control tool for high throughput sequence data. Available online at: http://www.bioinformatics.babraham.ac.uk/projects/fastqc/ (accessed April 26, 2010).
Bae, S. H., and Paik, Y. K. (1997). Cholesterol biosynthesis from lanosterol: development of a novel assay method and characterization of rat liver microsomal lanosterol delta 24-reductase. Biochem. J. 326, 609–616. doi: 10.1042/bj3260609
Bartel, D. P. (2004). MicroRNAs: genomics, biogenesis, mechanism, and function. Cell 116, 281–297. doi: 10.1016/S0092-8674(04)00045-5
Beale, E. G., Harvey, B. J., and Forest, C. (2007). PCK1 and PCK2 as candidate diabetes and obesity genes. Cell. Biochem. Biophys. 48, 89–95. doi: 10.1007/s12013-007-0025-6
Berger, J., Kim, Y. H. B., Legako, J. F., Martini, S., Lee, J., Ebner, P., et al. (2018). Dry-aging improves meat quality attributes of grass-fed beef loins. Meat. Sci. 145, 285–291. doi: 10.1016/j.meatsci.2018.07.004
Bolger, A. M., Lohse, M., and Usadel, B. (2014). Trimmomatic: a flexible trimmer for Illumina sequence data. Bioinformatics 30, 2114–2120. doi: 10.1093/bioinformatics/btu170
Carrillo, J. A., He, Y., Li, Y., Liu, J., Erdman, R. A., Sonstegard, T. S., et al. (2016). Integrated metabolomic and transcriptome analyses reveal finishing forage affects metabolic pathways related to beef quality and animal welfare. Sci. Rep. 6:25948. doi: 10.1038/srep25948
Cheung, R., and McMahon, P. (2017). Back to Grass: The Market Potential for U.S. Grassfed Beef. Pocantico Hills, NY: Stone Barns Center for Food and Agriculture. Available online at: https://www.stonebarnscenter.org/wp-content/uploads/2017/10/Grassfed_Full_v2.pdf
Chiang, J. Y. (2013). Bile acid metabolism and signaling. Compr. Physiol. 3, 1191–1212. doi: 10.1002/cphy.c120023
Chiang, J. Y. L., and Ferrell, J. M. (2018). Bile acid metabolism in liver pathobiology. Gene Expr. 18, 71–87. doi: 10.3727/105221618X15156018385515
Daley, C. A., Abbott, A., Doyle, P. S., Nader, G. A., and Larson, S. (2010). A review of fatty acid profiles and antioxidant content in grass-fed and grain-fed beef. Nutr. J. 9:10. doi: 10.1186/1475-2891-9-10
Dauncey, M. J. (2012). Recent advances in nutrition, genes and brain health. Proc. Nutr. Soc. 71, 581–591. doi: 10.1017/S0029665112000237
Descalzo, A. M., Insani, E. M., Biolatto, A., Sancho, A. M., García, P. T., Pensel, N. A., et al. (2005). Influence of pasture or grain-based diets supplemented with vitamin E on antioxidant/oxidative balance of Argentine beef. Meat. Sci. 70, 35–44. doi: 10.1016/j.meatsci.2004.11.018
Devuyst, O., and Igarashi, T. (2018). “Renal Fanconi syndrome, dent disease, and bartter syndrome,” in Genetics of Bone Biology and Skeletal Disease, eds R. V. Thakker, M. P. Whyte, J. A. Eisman, and T. Igarashi (London: Academic Press), 783–799. doi: 10.1016/B978-0-12-804182-6.00041-1
Dunne, P. G., Monahan, F. J., O'Mara, F. P., and Moloney, A. P. (2009). Colour of bovine subcutaneous adipose tissue: a review of contributory factors, associations with carcass and meat quality and its potential utility in authentication of dietary history. Meat Sci. 81, 28–45. doi: 10.1016/j.meatsci.2008.06.013
Ebert, M. S., Neilson, J. R., and Sharp, P. A. (2007). MicroRNA sponges: competitive inhibitors of small RNAs in mammalian cells. Nat. Methods 4, 721–726. doi: 10.1038/nmeth1079
Enright, A. J., John, B., Gaul, U., Tuschl, T., Sander, C., and Marks, D. S. (2003). MicroRNA targets in Drosophila. Genome Biol. 5, R1. doi: 10.1186/gb-2003-5-1-r1
Fonseca, L. D., Eler, J. P., Pereira, M. A., Rosa, A. F., Alexandre, P. A., Moncau, C. T., et al. (2019). Liver proteomics unravel the metabolic pathways related to feed efficiency in beef cattle. Sci. Rep. 9:5364. doi: 10.1038/s41598-019-41813-x
Friedländer, M. R., Mackowiak, S. D., Li, N., Chen, W., and Rajewsky, N. (2012). miRDeep2 accurately identifies known and hundreds of novel microRNA genes in seven animal clades. Nucleic. Acids Res. 40, 37–52. doi: 10.1093/nar/gkr688
Granner, D., and Pilkis, S. (1990). The genes of hepatic glucose metabolism. J. Biol. Chem. 265, 10173–10176. doi: 10.1016/S0021-9258(18)86923-X
Holman, B. W. B., Bailes, K. L., Kerr, M. J., and Hopkins, D. L. (2019). Point of purchase fatty acid profile, oxidative status and quality of vacuum-packaged grass fed Australian beef held chilled for up to 12 weeks. Meat. Sci. 158:107878. doi: 10.1016/j.meatsci.2019.107878
Hrdlickova, R., Toloue, M., and Tian, B. (2017). RNA-Seq methods for transcriptome analysis. Wiley. Interdiscip. Rev. RNA 8:1364. doi: 10.1002/wrna.1364
Jiang, X. S., Backlund, P. S., Wassif, C. A., Yergey, A. L., and Porter, F. D. (2010). Quantitative proteomics analysis of inborn errors of cholesterol synthesis: identification of altered metabolic pathways in DHCR7 and SC5D deficiency. Mol. Cell Proteomics 9, 1461–1475. doi: 10.1074/mcp.M900548-MCP200
Jiménez-Chillarón, J. C., Díaz, R., Martínez, D., Pentinat, T., Ramón-Krauel, M., Ribó, S., et al. (2012). The role of nutrition on epigenetic modifications and their implications on health. Biochimie 94, 2242–2263. doi: 10.1016/j.biochi.2012.06.012
Kennedy, L. H., Sutter, C. H., Leon Carrion, S., Tran, Q. T., Bodreddigari, S., Kensicki, E., et al. (2013). 2,3,7,8-Tetrachlorodibenzo-p-dioxin-mediated production of reactive oxygen species is an essential step in the mechanism of action to accelerate human keratinocyte differentiation. Toxicol. Sci. 132, 235–249. doi: 10.1093/toxsci/kfs325
Kim, D., Paggi, J. M., Park, C., Bennett, C., and Salzberg, S. L. (2019). Graph-based genome alignment and genotyping with HISAT2 and HISAT-genotype. Nat. Biotechnol. 37, 907–915. doi: 10.1038/s41587-019-0201-4
Kullak-Ublick, G. A., Stieger, B., and Meier, P. J. (2004). Enterohepatic bile salt transporters in normal physiology and liver disease. Gastroenterology 126, 322–342. doi: 10.1053/j.gastro.2003.06.005
Kung, J. T., Colognori, D., and Lee, J. T. (2013). Long noncoding RNAs: past, present, and future. Genetics 193, 651–669. doi: 10.1534/genetics.112.146704
Lagos-Quintana, M., Rauhut, R., Lendeckel, W., and Tuschl, T. (2001). Identification of novel genes coding for small expressed RNAs. Science 294, 853–858. doi: 10.1126/science.1064921
Law, P. P., and Holland, M. L. (2018). Deciphering the role of the non-coding genome in regulating gene-diet interactions. Nutrients 10:10121831. doi: 10.3390/nu10121831
Li, Y., Carrillo, J. A., Ding, Y., He, Y., Zhao, C., Liu, J., et al. (2015a). Transcriptomic Profiling of spleen in grass-fed and grain-fed angus cattle. PLoS ONE 10:e0135670. doi: 10.1371/journal.pone.0135670
Li, Y., Carrillo, J. A., Ding, Y., He, Y., Zhao, C., Zan, L., et al. (2015b). Ruminal transcriptomic analysis of grass-fed and grain-fed angus beef cattle. PLoS ONE 10:e0116437. doi: 10.1371/journal.pone.0116437
Liepa, G. U., Beitz, D. C., and Linder, J. R. (1978). Cholesterol synthesis in ruminating and nonruminating goats. J. Nutr. 108, 535–543. doi: 10.1093/jn/108.3.535
Livak, K. J., and Schmittgen, T. D. (2001). Analysis of relative gene expression data using real-time quantitative PCR and the method. Methods 25, 402–408. doi: 10.1006/meth.2001.1262
Lobato, J. F., Freitas, A. K., Devincenzi, T., Cardoso, L. L., Tarouco, J. U., Vieira, R. M., et al. (2014). Brazilian beef produced on pastures: sustainable and healthy. Meat Sci. 98, 336–345. doi: 10.1016/j.meatsci.2014.06.022
Lynch, J. (2019). Availability of disaggregated greenhouse gas emissions from beef cattle production: a systematic review. Environ. Impact. Assess. Rev. 76, 69–78. doi: 10.1016/j.eiar.2019.02.003
Madden, A. (2003). “Gallbladder,” in Encyclopedia of Food Sciences and Nutrition, 2nd Edn, ed. B. Caballero (Oxford: Academic Press), 2846–2851. doi: 10.1016/B0-12-227055-X/00545-9
Mapato, C., and Wanapat, M. (2018). Comparison of silage and hay of dwarf Napier grass (Pennisetum purpureum) fed to Thai native beef bulls. Trop. Anim. Health. Prod. 50, 1473–1477. doi: 10.1007/s11250-018-1582-y
McAfee, A. J., McSorley, E. M., Cuskelly, G. J., Fearon, A. M., Moss, B. W., Beattie, J. A., et al. (2011). Red meat from animals offered a grass diet increases plasma and platelet n-3 PUFA in healthy consumers. Br. J. Nutr. 105, 80–89. doi: 10.1017/S0007114510003090
McAllan, A. B., and Smith, R. H. (1974). Carbohydrate metabolism in the ruminant. Bacterial carbohydrates formed in the rumen and their contribution to digesta entering the duodenum. Br. J. Nutr. 31, 77–88. doi: 10.1079/BJN19740010
Mitra, V., and Metcalf, J. (2009). Metabolic functions of the liver. Anaesth. Intens. Care Med. 10, 334–335. doi: 10.1016/j.mpaic.2009.03.011
Montanholi, Y. R., Haas, L. S., Swanson, K. C., Coomber, B. L., Yamashiro, S., and Miller, S. P. (2017). Liver morphometrics and metabolic blood profile across divergent phenotypes for feed efficiency in the bovine. Acta Vet. Scand. 59:24. doi: 10.1186/s13028-017-0308-x
Moubarak, A. S., and Rosenkrans, C. F. Jr. (2000). Hepatic metabolism of ergot alkaloids in beef cattle by cytochrome P450. Biochem. Biophys. Res. Commun. 274, 746–749. doi: 10.1006/bbrc.2000.3210
Mozaffarian, D., Ascherio, A., Hu, F. B., Stampfer, M. J., Willett, W. C., Siscovick, D. S., et al. (2005). Interplay between different polyunsaturated fatty acids and risk of coronary heart disease in men. Circulation 111, 157–164. doi: 10.1161/01.CIR.0000152099.87287.83
Muse, E. D., Yu, S., Edillor, C. R., Tao, J., Spann, N. J., Troutman, T. D., et al. (2018). Cell-specific discrimination of desmosterol and desmosterol mimetics confers selective regulation of LXR and SREBP in macrophages. Proc. Natl. Acad. Sci. U.S.A. 115, E4680–E4689. doi: 10.1073/pnas.1714518115
Orime, A., Yonezawa, T., Ogasawara, H., Kuroyanagi, T., and Manda, T. (2012). Analysis of preference for domestic grass-fed beef in Japanese youths. Anim. Sci. J. 83, 268–271. doi: 10.1111/j.1740-0929.2011.01006.x
Palmer, J. D., Soule, B. P., Simone, B. A., Zaorsky, N. G., Jin, L., and Simone, N. L. (2014). MicroRNA expression altered by diet: can food be medicinal? Ageing Res. Rev. 17, 16–24. doi: 10.1016/j.arr.2014.04.005
Pavan, E., and Duckett, S. K. (2013). Fatty acid composition and interrelationships among eight retail cuts of grass-feed beef. Meat Sci. 93, 371–377. doi: 10.1016/j.meatsci.2012.09.021
Puzio, N., Purwin, C., Nogalski, Z., Bialobrzewski, I., Tomczyk, L., and Michalski, J. P. (2019). The effects of age and gender (bull vs steer) on the feeding behavior of young beef cattle fed grass silage. Asian-Aust. J. Anim. Sci. 32, 1211–1218. doi: 10.5713/ajas.18.0698
Rao, P. N., Purdy, R. H., Williams, M. C., Moore, P. H. Jr., Goldzieher, J. W., and Layne, D. S. (1979). Metabolites of estradiol-17 beta in bovine liver: identification of the 17-beta-D-glucopyranoside of estradiol-17 alpha. J. Steroid Biochem. 10, 179–185. doi: 10.1016/0022-4731(79)90233-4
Robinson, M. D., McCarthy, D. J., and Smyth, G. K. (2010). edgeR: a Bioconductor package for differential expression analysis of digital gene expression data. Bioinformatics 26, 139–140. doi: 10.1093/bioinformatics/btp616
Rule, D. C., Broughton, K. S., Shellito, S. M., and Maiorano, G. (2002). Comparison of muscle fatty acid profiles and cholesterol concentrations of bison, beef cattle, elk, and chicken. J. Anim. Sci. 80, 1202–1211. doi: 10.2527/2002.8051202x
Salmena, L., Poliseno, L., Tay, Y., Kats, L., and Pandolfi, P. P. (2011). A ceRNA hypothesis: the Rosetta Stone of a hidden RNA language? Cell 146, 353–358. doi: 10.1016/j.cell.2011.07.014
Schmidt, D. R., Holmstrom, S. R., Fon Tacer, K., Bookout, A. L., Kliewer, S. A., and Mangelsdorf, D. J. (2010). Regulation of bile acid synthesis by fat-soluble vitamins A and D. J. Biol. Chem. 285, 14486–14494. doi: 10.1074/jbc.M110.116004
Scott, L. W., Dunn, J. K., Pownall, H. J., Brauchi, D. J., McMann, M. C., Herd, J. A., et al. (1994). Effects of beef and chicken consumption on plasma lipid levels in hypercholesterolemic men. Arch. Intern. Med. 154, 1261–1267. doi: 10.1001/archinte.154.11.1261
Sheriha, G. M., Waller, G. R., Chan, T., and Tillman, A. D. (1968). Composition of bile acids in ruminants. Lipids 3, 72–78. doi: 10.1007/BF02530972
Silva, J. P., and van Booven, D. (2018). Analysis of diet-induced differential methylation, expression, and interactions of lncRNA and protein-coding genes in mouse liver. Sci. Rep. 8:11537. doi: 10.1038/s41598-018-29993-4
Sithyphone, K., Yabe, M., Horita, H., Hayashi, K., Fumita, T., Shiotsuka, Y., et al. (2011). Comparison of feeding systems: feed cost, palatability and environmental impact among hay-fattened beef, consistent grass-only-fed beef and conventional marbled beef in Wagyu (Japanese Black cattle). Anim. Sci. J. 82, 352–359. doi: 10.1111/j.1740-0929.2010.00836.x
Slattery, M. L., Herrick, J. S., Mullany, L. E., Stevens, J. R., and Wolff, R. K. (2017). Diet and lifestyle factors associated with miRNA expression in colorectal tissue. Pharmgenomics Pers. Med. 10, 1–16. doi: 10.2147/PGPM.S117796
Tarallo, S., Pardini, B., Mancuso, G., Rosa, F., Di Gaetano, C., Rosina, F., et al. (2014). MicroRNA expression in relation to different dietary habits: a comparison in stool and plasma samples. Mutagenesis 29, 385–391. doi: 10.1093/mutage/geu028
Tay, Y., Rinn, J., and Pandolfi, P. P. (2014). The multilayered complexity of ceRNA crosstalk and competition. Nature 505, 344–352. doi: 10.1038/nature12986
Trapnell, C., Roberts, A., Goff, L., Pertea, G., Kim, D., Kelley, D. R., et al. (2012). Differential gene and transcript expression analysis of RNA-seq experiments with TopHat and Cufflinks. Nat. Protoc. 7, 562–578. doi: 10.1038/nprot.2012.016
Vessey, D. A., Crissey, M. H., and Zakim, D. (1977). Kinetic studies on the enzymes conjugating bile acids with taurine and glycine in bovine liver. Biochem. J. 163, 181–183. doi: 10.1042/bj1630181
Williams, A. G., Thomas, S., Wyman, S. K., and Holloway, A. K. (2014). RNA-seq data: challenges in and recommendations for experimental design and analysis. Curr. Protoc. Hum. Genet. 83, 1131–20. doi: 10.1002/0471142905.hg1113s83
Winter, J., Jung, S., Keller, S., Gregory, R. I., and Diederichs, S. (2009). Many roads to maturity: microRNA biogenesis pathways and their regulation. Nat. Cell. Biol. 11, 228–234. doi: 10.1038/ncb0309-228
Zerenturk, E. J., Sharpe, L. J., and Brown, A. J. (2012). Sterols regulate 3β-hydroxysterol Δ24-reductase (DHCR24) via dual sterol regulatory elements: cooperative induction of key enzymes in lipid synthesis by sterol regulatory element binding proteins. Biochim. Biophys. Acta 1821, 1350–1360. doi: 10.1016/j.bbalip.2012.07.006
Keywords: lncRNAs, miRNAs, ceRNAs, beef cattle, feeding regimens, metabolic regulations
Citation: Jia C, Bai Y, Liu J, Cai W, Liu L, He Y and Song J (2021) Metabolic Regulations by lncRNA, miRNA, and ceRNA Under Grass-Fed and Grain-Fed Regimens in Angus Beef Cattle. Front. Genet. 12:579393. doi: 10.3389/fgene.2021.579393
Received: 02 July 2020; Accepted: 03 February 2021;
Published: 04 March 2021.
Edited by:
Tad Stewart Sonstegard, Acceligen, United StatesReviewed by:
Brittney Keel, United States Department of Agriculture, United StatesPâmela Almeida Alexandre, Agriculture and Food, Commonwealth Scientific and Industrial Research Organisation (CSIRO), Australia
Copyright © 2021 Jia, Bai, Liu, Cai, Liu, He and Song. This is an open-access article distributed under the terms of the Creative Commons Attribution License (CC BY). The use, distribution or reproduction in other forums is permitted, provided the original author(s) and the copyright owner(s) are credited and that the original publication in this journal is cited, in accordance with accepted academic practice. No use, distribution or reproduction is permitted which does not comply with these terms.
*Correspondence: Jiuzhou Song, c29uZ2o4OEB1bWQuZWR1