 Zhenhua Lu1
 Lingbing Meng2
 Zhen Sun1Xiaolei Shi1Weiwei Shao1Yangyang Zheng1
 Xinglei Yao3,4*Jinghai Song1*
- 1Department of General Surgery, Department of Hepato-Bilio-Pancreatic Surgery, Beijing Hospital, National Center of Gerontology, Institute of Geriatric Medicine, Chinese Academy of Medical Sciences, Beijing, China
- 2Department of Cardiology, Beijing Hospital, National Center of Gerontology, Beijing, China
- 3Key Laboratory of Environmental Nanotechnology and Health Effects, Research Center for Eco-Environmental Sciences, Chinese Academy of Sciences, Beijing, China
- 4College of Resources and Environment, University of Chinese Academy of Sciences, Beijing, China
As the prevalence of obesity increases, so does the occurrence of obesity-related complications, such as cardiovascular and cerebrovascular diseases, diabetes, and some cancers. Increased adipose tissue is the main cause of harm in obesity. To better understand obesity and its related complications, we analyzed the mRNA expression profiles of adipose tissues from 126 patients with obesity and 275 non-obese controls. Using an integrated bioinformatics method, we explored the functions of 113 differentially expressed genes (DEGs) between them. Gene ontology (GO) and kyoto encyclopedia of genes and genomes (KEGG) pathway enrichment analyses revealed that upregulated DEGs were enriched in immune cell chemotaxis, complement-related cascade activation, and various inflammatory signaling pathways, while downregulated DEGs enriched in nutrient metabolism. The CIBERSORT algorithm indicated that an increase in macrophages may be the main cause of adipose tissue inflammation, while decreased γδ T cells reduce sympathetic action, leading to dysregulation of adipocyte thermogenesis. A protein-protein interaction network was constructed using the STRING database, and the top 10 hub genes were identified using the cytoHubba plug-in in Cytoscape. All were confirmed to be obesity-related using a separate dataset. In addition, we identified chemicals related to these hub genes that may contribute to obesity. In conclusion, we have successfully identified several hub genes in the development of obesity, which provide insights into the possible mechanisms controlling obesity and its related complications, as well as potential biomarkers and therapeutic targets for further research.
Introduction
Over the past 40 years, the incidence of obesity has increased in both developed and developing countries because of unbalanced diets, inadequate physical activity, chronic stress, and certain drugs and other environmental pollutants (Andersen et al., 2016; Yang et al., 2017; Sung et al., 2019; Tomiyama, 2019). According to the latest report of the World Health Organization, more than 1.9 million people were overweight in 2016, of which 6.5 million were obese (NCD Risk Factor Collaboration [NCD-RisC], 2017; WHO, 2018). Obesity can cause many chronic diseases, including cardiovascular and cerebrovascular diseases, diabetes, and some cancers of the colon, rectum, gastric cardia, liver, gallbladder, and pancreas (Arnold et al., 2016; Lauby-Secretan et al., 2016; Gadde et al., 2018). The most characteristic pathological changes associated with obesity are abnormal and excessive fat accumulation (WHO, 2018). Adipose tissue is widely distributed throughout the human body, and regulates metabolism by storing and releasing fatty acids and secreting adipokines (Giralt and Villarroya, 2013; Chait and den Hartigh, 2020). In obese people, this regulatory ability is disrupted, as is adipokine release (Munzberg and Myers, 2005; Leal and Mafra, 2013). Current treatment strategies for obesity includes inhibition of fat absorption, liposuction, and weight loss surgery (Yanovski and Yanovski, 2014; Apovian et al., 2015; Wolfe et al., 2016). However, these are symptomatic treatments rather than preventative measures controlling obesity development, and the number of obese individuals continues to increase annually. Therefore, it is important to identify biomarkers of obesity in adipose tissue and their related molecular mechanisms, to develop effective therapies to prevent obesity and its complications.
With the growing popularity of chip and sequencing technology, comprehensive bioinformatic analysis has become a promising method for exploring disease-related biomarkers and their molecular mechanisms (Sakharkar et al., 2019; Wan et al., 2020). For example, Zhang et al. found that the adipose tissues of insulin-resistant and non-insulin-resistant patients with obesity had differential expression of a number of genes, including matrix metallopeptidase 9, interleukin (IL)6, C-X-C motif chemokine ligand (CXCL) 8, C-C motif chemokine ligand 4, and CXCL10, which are enriched for several functions, including cytokine-cytokine receptor interactions, tumor necrosis factor (TNF) signaling, and pathways in cancer (Zhang et al., 2019). Ida et al. found that ST8 alpha-N-acetyl-neuraminide alpha-2,8-sialyltransferase 2 expression in omental fat was significantly associated with weight loss after Roux-en-Y gastric bypass (Hatoum et al., 2013). In addition, circadian clock and metabolic gene expression rhythms are reduced in the subcutaneous adipose tissue of obese patients with type 2 diabetes compared to lean controls (Stenvers et al., 2019). However, no large-scale studies have been performed to examine the differential expression of genes in the adipose tissues of obese and non-obese populations. In this study, we used an integrative bioinformatics approach to analyze immune cell differences and gene expression differences in adipose tissue from obese and non-obese patients. Moreover, we combined the analysis of differentially expressed genes (DEGs) with functional enhancement and protein-protein interaction (PPI) analysis. Finally, we identified the hub genes that may contribute to obesity.
Materials and Methods
Research Design
The research was designed as shown in Figure 1. Firstly, we downloaded relevant mRNA expression profiles from the Gene Expression Omnibus (GEO). We then identified the pathways that may contribute to obesity through gene set enrichment analysis (GSEA) and analyzed the differences in immune cell infiltration in obese patients using the CIBERSORT algorithm. Secondly, we used an integrated bioinformatics approach to identify DEGs and explore the genes-related disease. Gene ontology (GO) and Kyoto Encyclopedia of Genes and Genomes (KEGG) pathway enrichment analyses were used to explore potential molecular mechanisms. A PPI network was constructed to identify hub genes. Finally, we verified the hub genes in a separate dataset and identified several chemicals that may contribute to obesity using the comparative toxicology genomics (CTD) database.
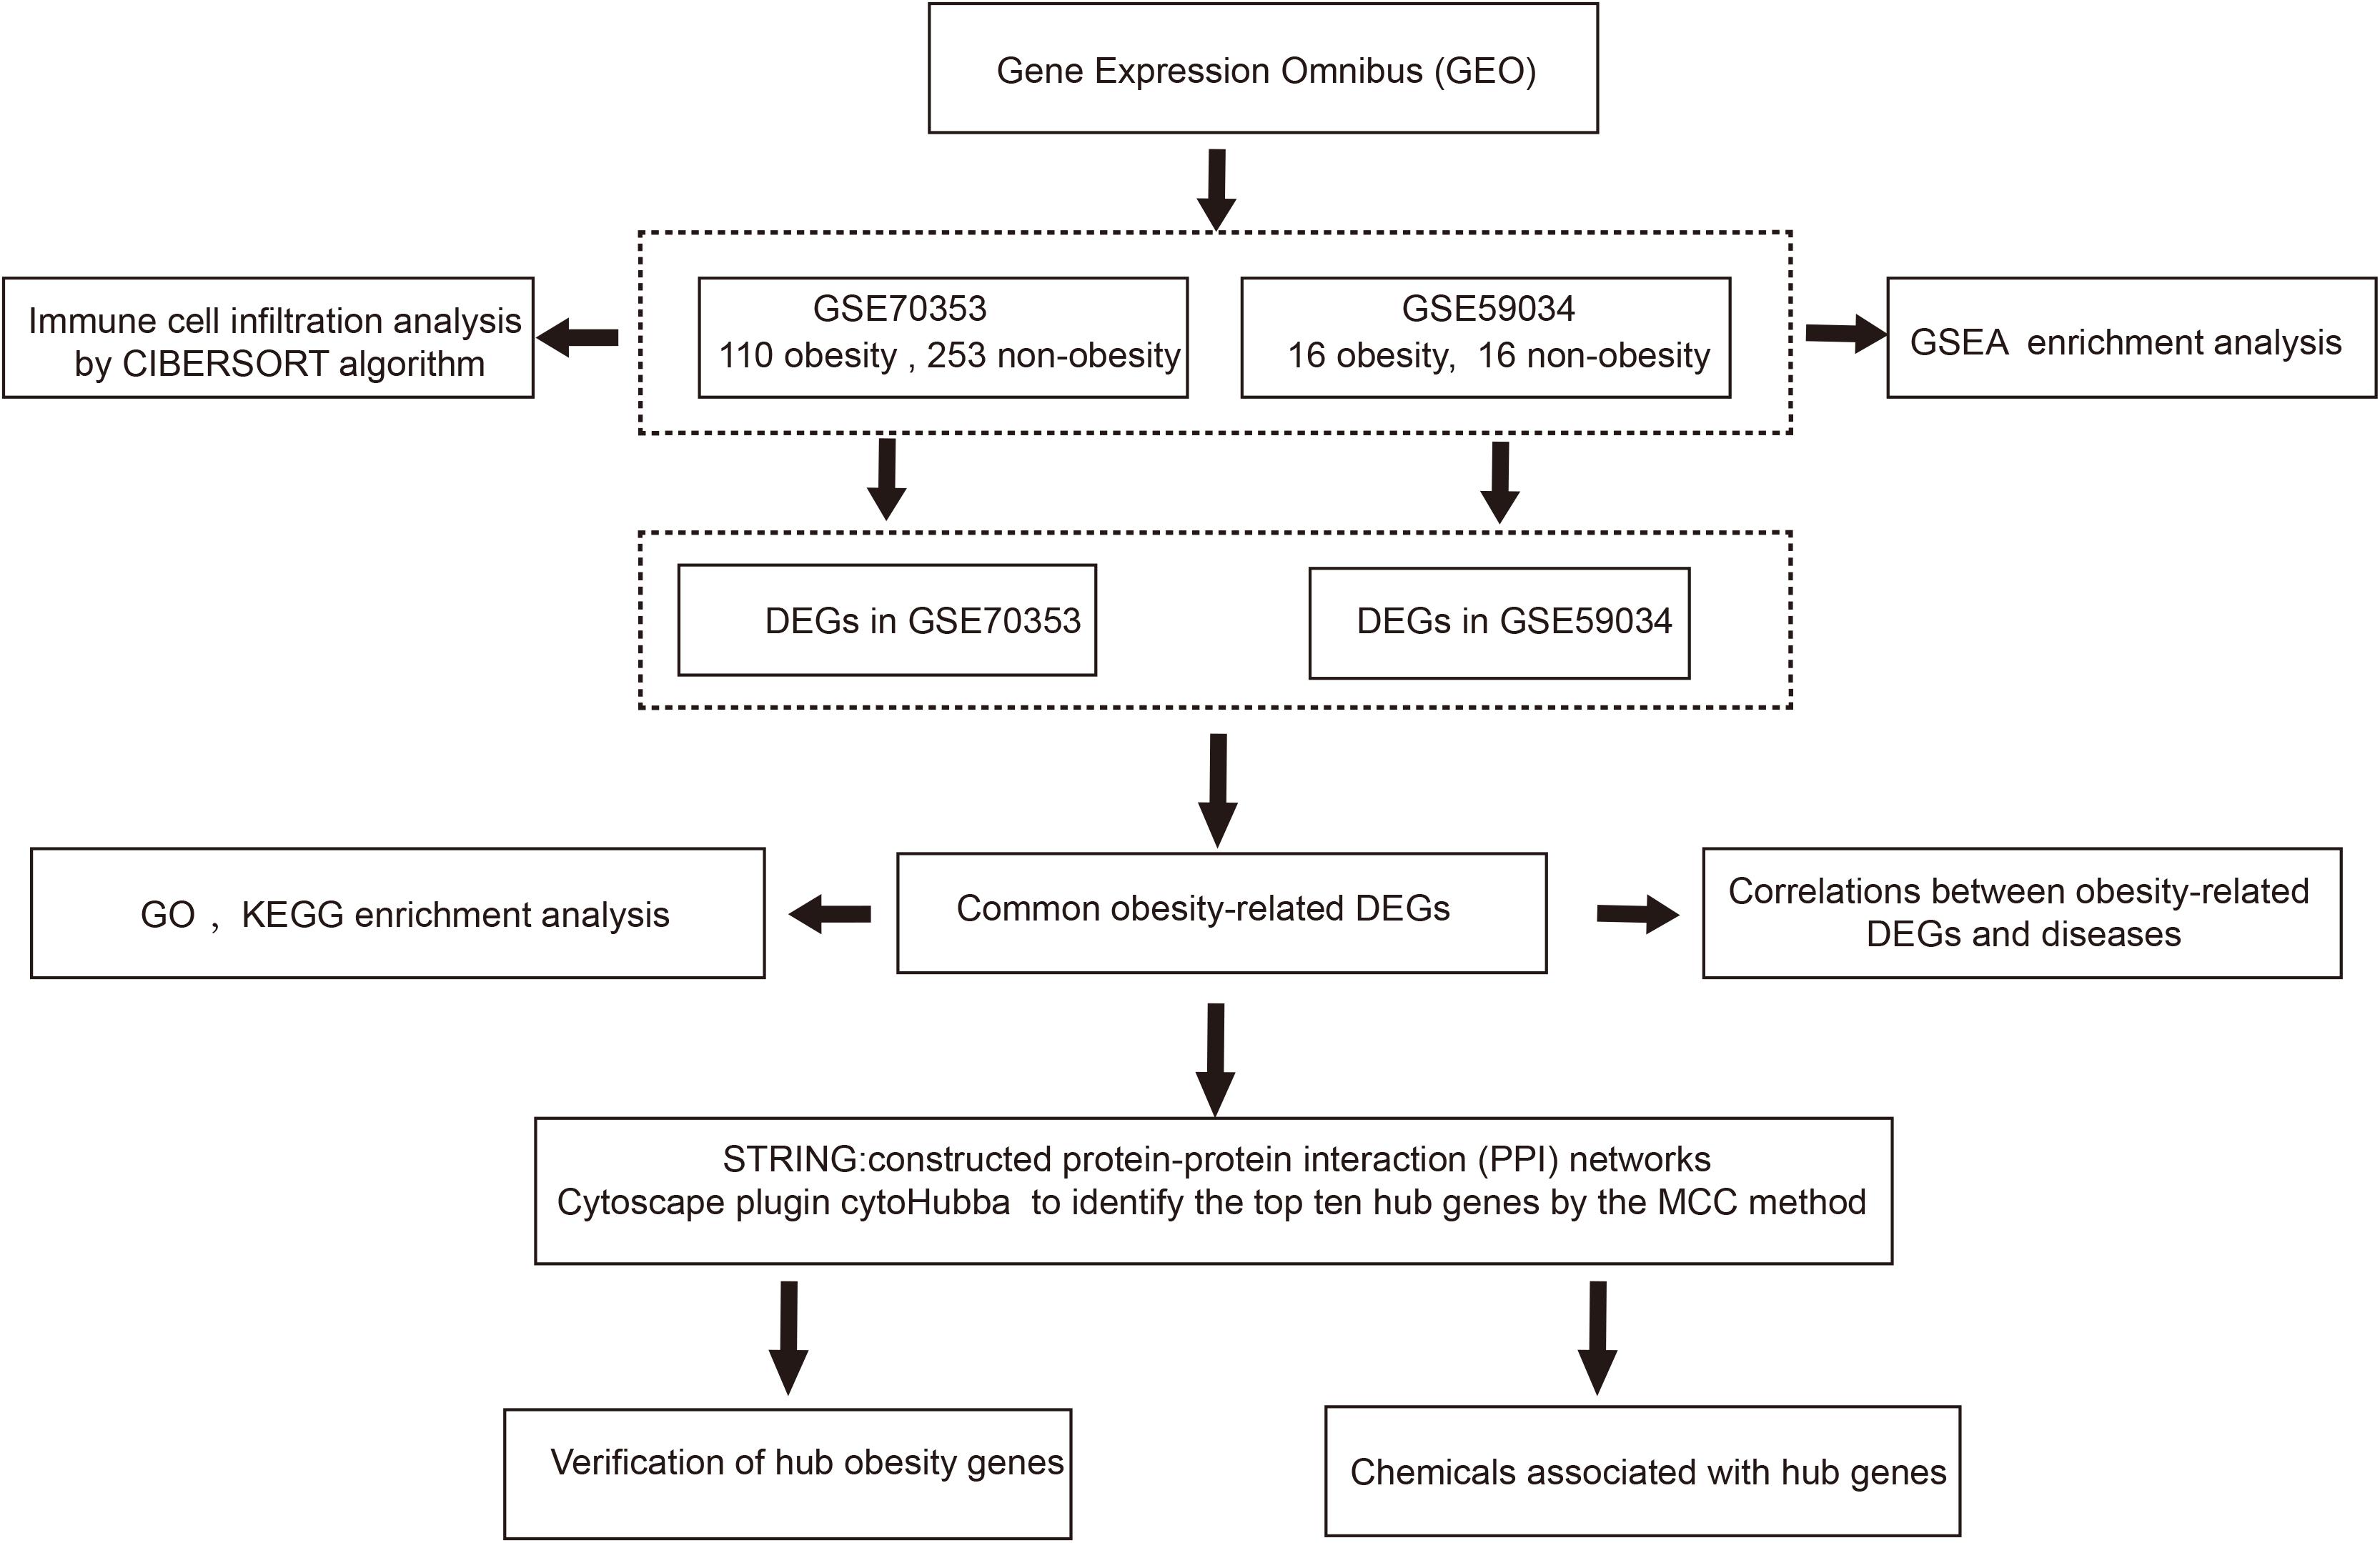
Figure 1. The flow chart of this study. DEGs, differentially expressed genes; GSEA, Gene set enrichment analysis; GO, Gene ontology; KEGG, Kyoto Encyclopedia of Genes and Genomes; MCC, maximal clique centrality.
Microarray Data
GEO1 is the largest public database of microarray- and sequencing-based expression data, and contains copious adipose tissue data (Edgar et al., 2002; Civelek et al., 2017). The search strategy used was “((obes∗) AND adipose tissue) AND “Homo sapiens”[porgn:_txid9606].” The inclusion criteria were as follows: subcutaneous adipose tissue samples, including those from obese [body mass index (BMI) > 30 kg/m2] and non-obese (BMI < 25 kg/m2) individuals. The GSE70353 and GSE59034 datasets were used. GSE70353 was submitted by the University of California, Los Angeles in 2015, and includes subcutaneous adipose biopsies from 770 people participating in the Metabolic Syndrome in Men study (Civelek et al., 2017). GSE59034 was submitted by the Karolinska Institute in 2014, and includes 48 subcutaneous adipose tissues from individuals with varying BMIs (Petrus et al., 2018), the details are presented in Table 1. After downloading the expression matrices and clinical data, samples were selected according to the inclusion criteria. Samples from 126 obese people (110 from GSE70353 and 16 from GSE59034) and 275 non-obese people (259 from GSE70353 and 16 from GSE59034) were used in the following analysis.
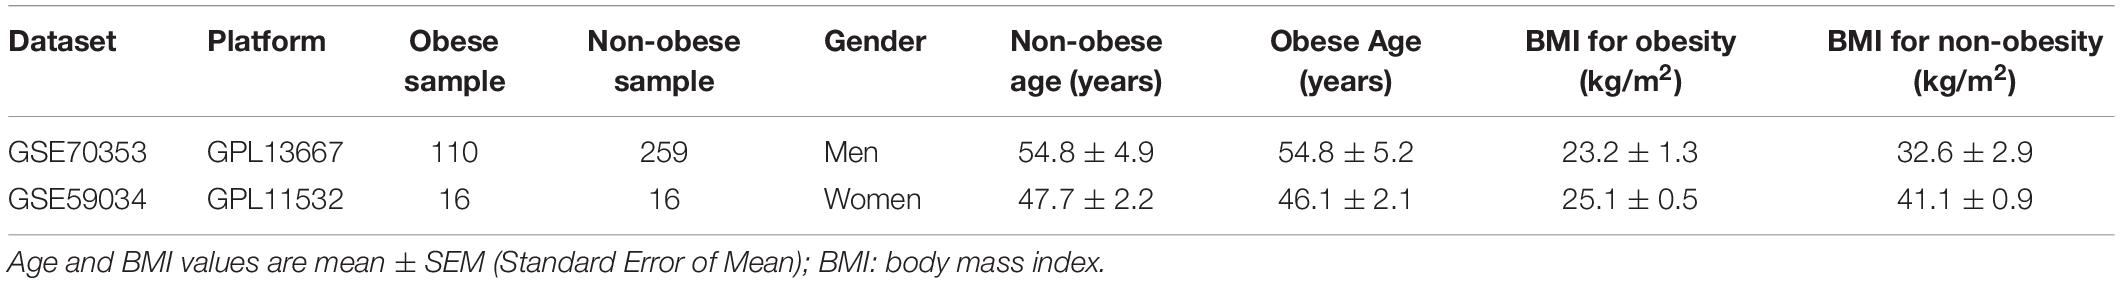
Table 1. Details for GEO obesity adipose tissue data.
Immune Cell Analysis
CIBERSORT is an analytical tool that uses gene expression data to estimate the abundance of immune cell types in mixed cell populations (Newman et al., 2015). We used the original CIBERSORT gene signature file LM22, which defines 22 immune cell subtypes, to analyze datasets from obese adipose tissues and non-obese adipose tissues, with the number of permutations set at 100. The CIBERSORT p-value represents the statistical significance of the deconvolution results across all cell subsets and can be used to filter out deconvolution with less significant fitting accuracy. Samples with a p < 0.05 were selected from the calculated score table for further analysis. Then, the output was directly integrated to generate an entire matrix of immune cell fractions. The vioplot package (version 0.3.5) was used to visualize the results of immune infiltration between the adipose tissues of obese and non-obese subjects, and the Wilcoxon test was used to compare the differences in the means between obese and normal samples (Gehan, 1965).
Gene Set Enrichment Analysis (GSEA)
GSEA was performed by comparing the obtained gene sets with known disease-related gene sets (Subramanian et al., 2005). GSE70353 and GSE59034 expression data and related phenotype files were imported into the GSEA software (version 4.0.2). The pre-validated curated C2 gene set database2 was employed as a reference to highlight the distinct biological features of obesity. Gene set permutations were performed 1,000 times for each analysis. A false discovery rate < 25% and a p < 5% were the criteria for significant gene set enrichment.
DEG Identification
DEG identification was performed as follows. Firstly, to convert each probe expression matrix into a gene expression matrix, we downloaded the annotation platform file and then mapped the probe IDs to the gene symbols using R software (version 4.0.3). Probes without corresponding gene symbols were removed. For several probes that matched only one gene symbol, mean expression values were calculated and considered the final gene expression values. Then, DEGs in the obese and non-obese groups were analyzed using the linear models’ limma package (version 3.44.3), and the Benjamini–Hochberg method was used for multiple test correction. Genes with | log2 (fold change)| > 0.5, and a corrected p < 0.05 were considered DEGs. DEG heatmaps were generated using the Pheatmap package (version 1.0.12) (Kolde, 2012). Finally, the online tool Draw Venn Diagram3 was used to detect the DEGs shared by both datasets (Bardou et al., 2014). Common DEGs were used in the following analyses.
Enrichment Analysis in DisGeNET
The DisGeNET database integrates multiple disease gene databases and is used to explore disease-related genes (Piñero et al., 2016). We used Metascape, an online tool that contains multiple enrichment methods (Zhou et al., 2019), to query DisGeNET to determine the proportion of obesity-related diseases.
Pathway and Functional Enrichment Analyses
To identify the pathways in which DEGs cause obesity, we conducted GO and KEGG enrichment analyses. GO analysis involves detecting the enrichment of genes in particular cellular components, biological processes, and molecular functions (Gene Ontology Consortium[GOC], 2006). The KEGG database contains various biological pathways. KEGG enrichment analysis reveals which pathways DEGs are involved in, which can indicate the molecular mechanisms of a disease (Kanehisa and Goto, 2000). In this study, GO and KEGG enrichment analyses were both performed using the ClusterProfiler package (version 3.16.0) in R (with a q < 0.05 and a p < 0.05 considered significant) (Yu et al., 2012).
PPI Network Construction and Hub Gene Identification
The STRING database (version 11)4 is a web resource containing all known and predicted PPI networks (Szklarczyk et al., 2016), and was used to explore the functional interactions between proteins. Based on the STRING online tool, PPI networks of the DEGs were constructed with a confidence score ≥ 0.4. After removing unconnected nodes from the network, DEG PPIs were visualized using Cytoscape (version 3.7.2). All data and information were exported and plotted using Cytoscape software. The DEGs are represented as nodes, and the interaction between DEGs are represented as edges between nodes. The plug-in cytoHubba was then used to identify hub genes in the network (Chin et al., 2014) and the top 10 hub genes were explored using the maximum clique centrality (MCC) method, a topological analysis method in CytoHubba for identifying feature nodes and hub genes from all DEGs.
Hub Gene Verification
To validate the differential expression of the hub genes in obesity, we used the GSE55200 dataset, which contains adipose tissue expression data from seven healthy lean people, eight metabolically healthy obese people, and eight metabolically unhealthy obese people (Badoud et al., 2014), by downloading its normalized gene expression matrix, converting the probes to gene names using R, and analyzing the differential expression of 16 obesity- and seven non-obesity-associated genes. Statistical analysis was performed using descriptive statistics and the two-tailed Student’s t-test in GraphPad Prism (version 8.0), with a p < 0.05 considered statistically significant (Mavrevski et al., 2018).
Identification of Chemicals Associated With Hub Genes
The CTD database5 is a major public resource of literature-based, artificially planned linkages between chemistry, genetic products, phenotypes, diseases, and environmental exposure (Davis et al., 2019). We searched the database for the hub genes to identify chemicals associated with obesity and weight gain.
Results
Immune Cell Infiltration Analysis
CIBERSORT analysis of the expression matrix, which included samples from 93 obese people and 129 non-obese people who met the screening criteria (p < 0.05), was used to examine the immune cell contents. As shown in Figure 2, the immune cells in adipose tissue were mainly mast cells, T cells, macrophages, monocytes, and neutrophils. Compared with non-obese adipose tissue, M0 and M2 macrophages were significantly higher in obese adipose tissues (p < 0.05), while M1 macrophages were also higher, but the difference was not statistically significant (p = 0.052). However, naive CD4+, CD8+, and γδ T cells were significantly reduced in obese adipose tissues compared with non-obese tissues (p < 0.05).
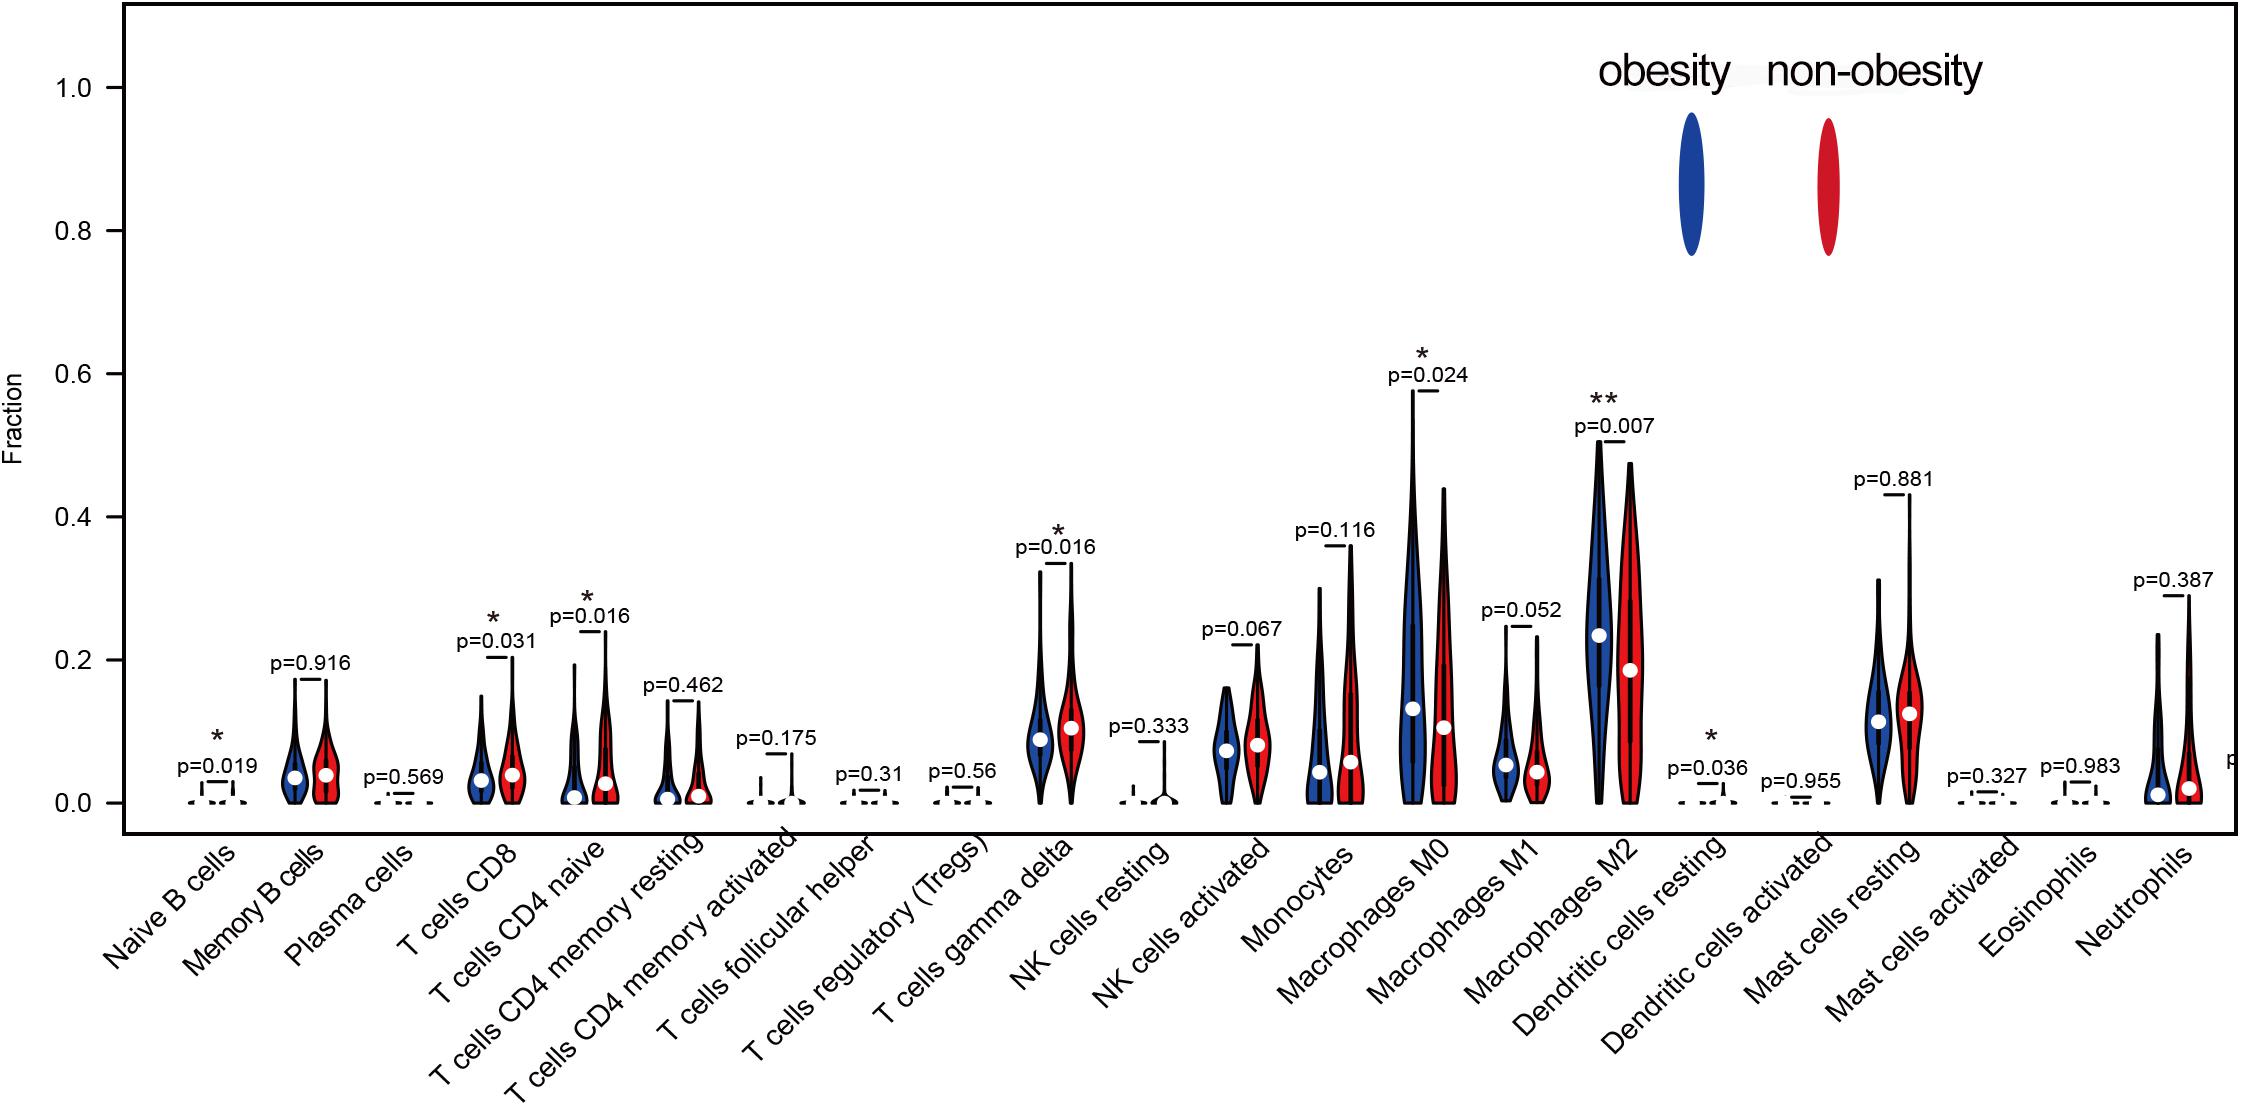
Figure 2. The difference of 22 kinds of immune cells in obesity and non-obesity, blue represents obese adipose tissue, red represents non-obesity adipose tissue.
GSEA
GSEA was performed to identify possible mechanisms of obesity. The samples were divided into obese and non-obese groups. The analysis indicated that the most significantly enriched gene sets were positively correlated with the obesity group, and included pathogenic Escherichia coli infection, the complement and coagulation cascades, the toll-like receptor signaling pathway, the chemokine signaling pathway, and cytokine-receptor interactions (Figures 3A,B), while top gene sets negatively correlated with obesity were involved in fatty acid metabolism, the insulin signaling pathway, adipocytokine signaling pathway, the citric acid cycle, and the ribosome.
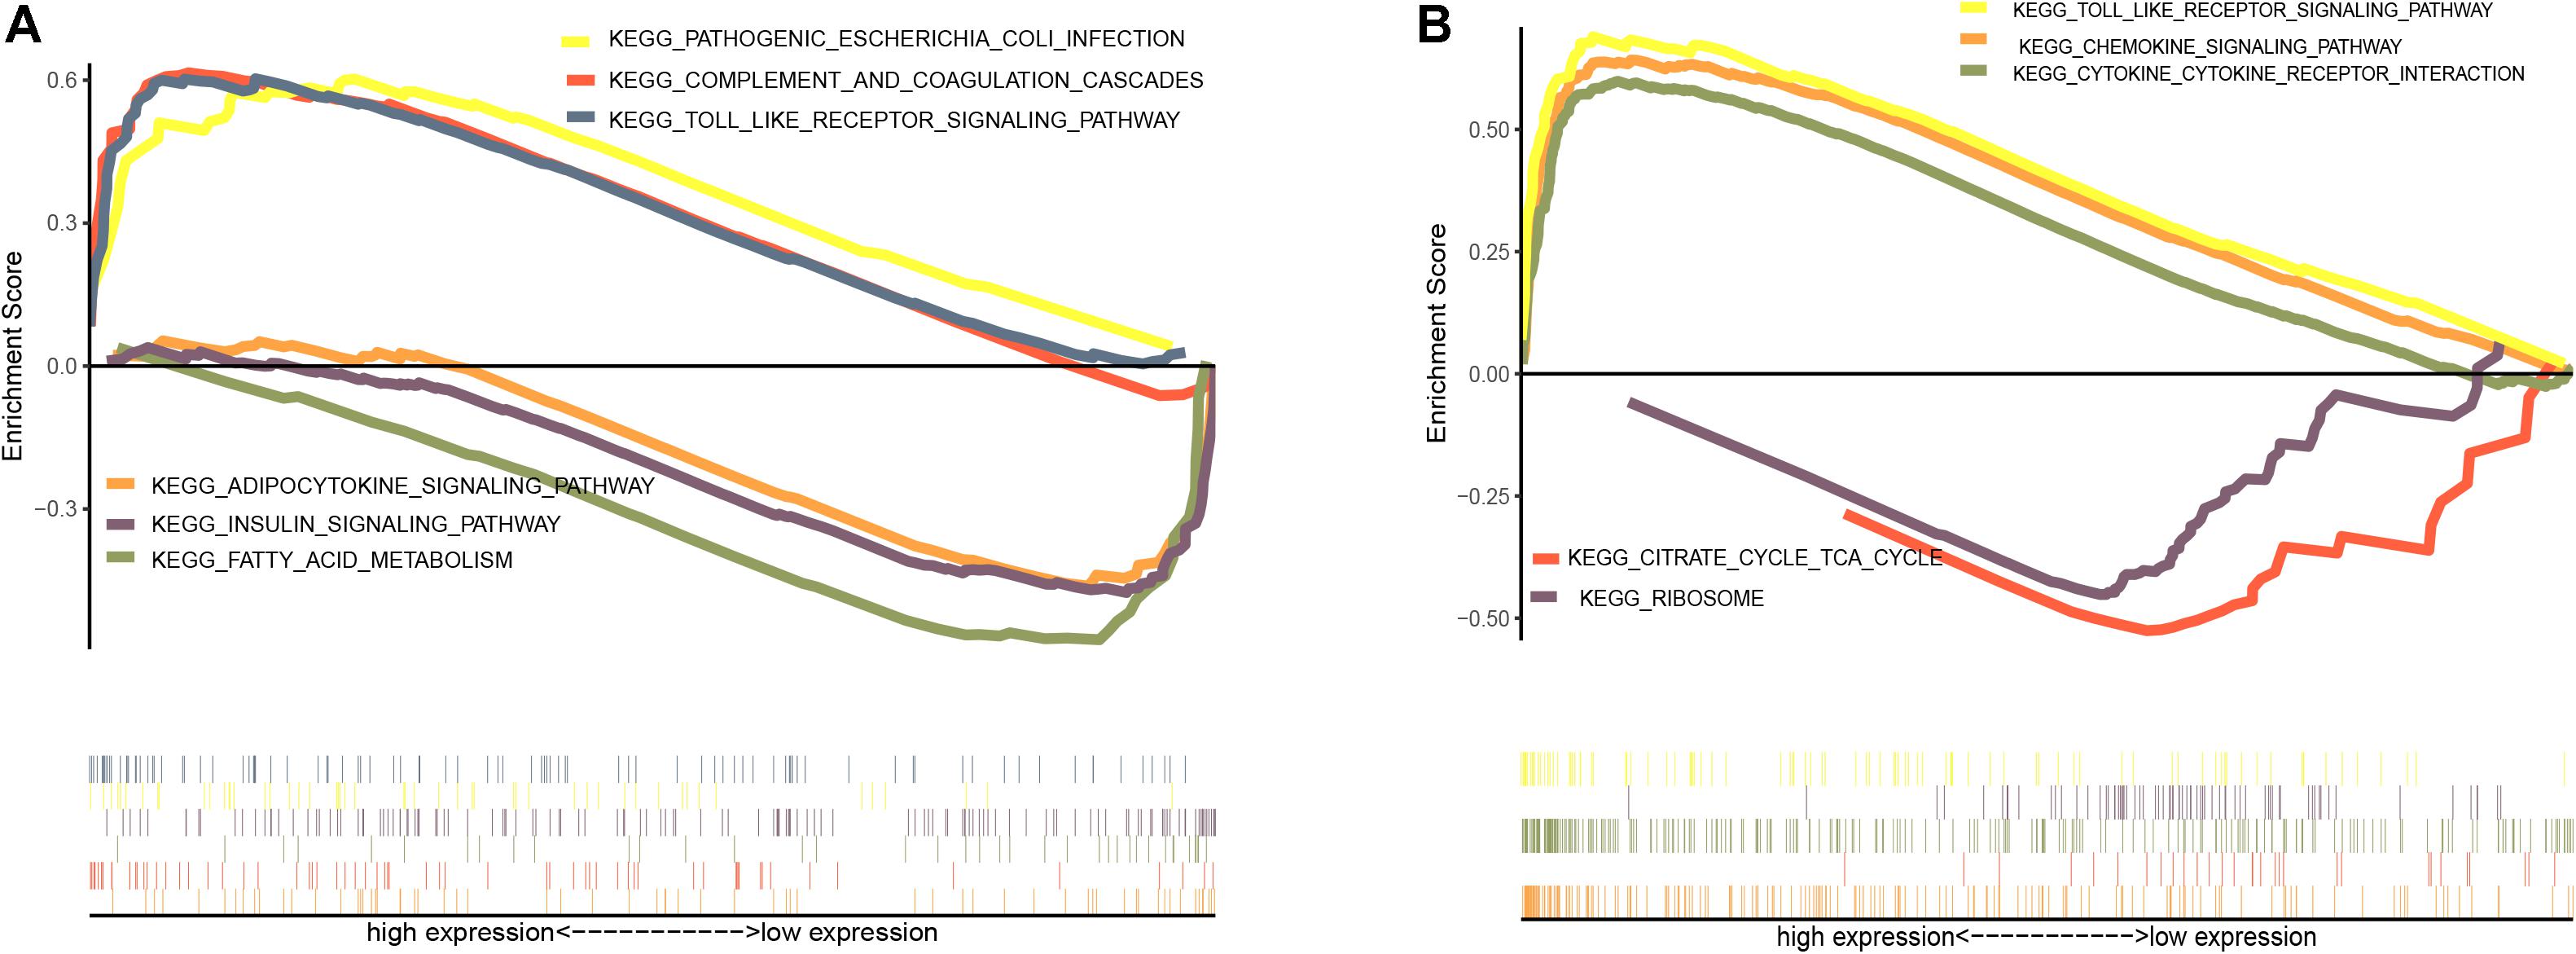
Figure 3. Enrichment analysis of gene set pathway. (A) Gene set enrichment analysis in GSE70353. (B) Gene set enrichment analysis in GSE59034.
Identification of Obesity-Related DEGs
After standardization and normalization of the microarray data, 147 and 904 DEGs between obese and non-obese adipose tissues were extracted from GSE70353 and GSE59034, respectively, as shown in the volcano plots (Figures 4A,B). GSE70353 included 82 upregulated genes and 65 downregulated genes, and GSE59034 included 648 upregulated genes and 256 downregulated genes. The heatmaps show the top 20 most significant downregulated and upregulated genes (Figures 4C,D). The two datasets shared 64 and 49 genes that were up- and downregulated in obesity (Figures 4E,F and Table 2), which are analyzed in later sections.
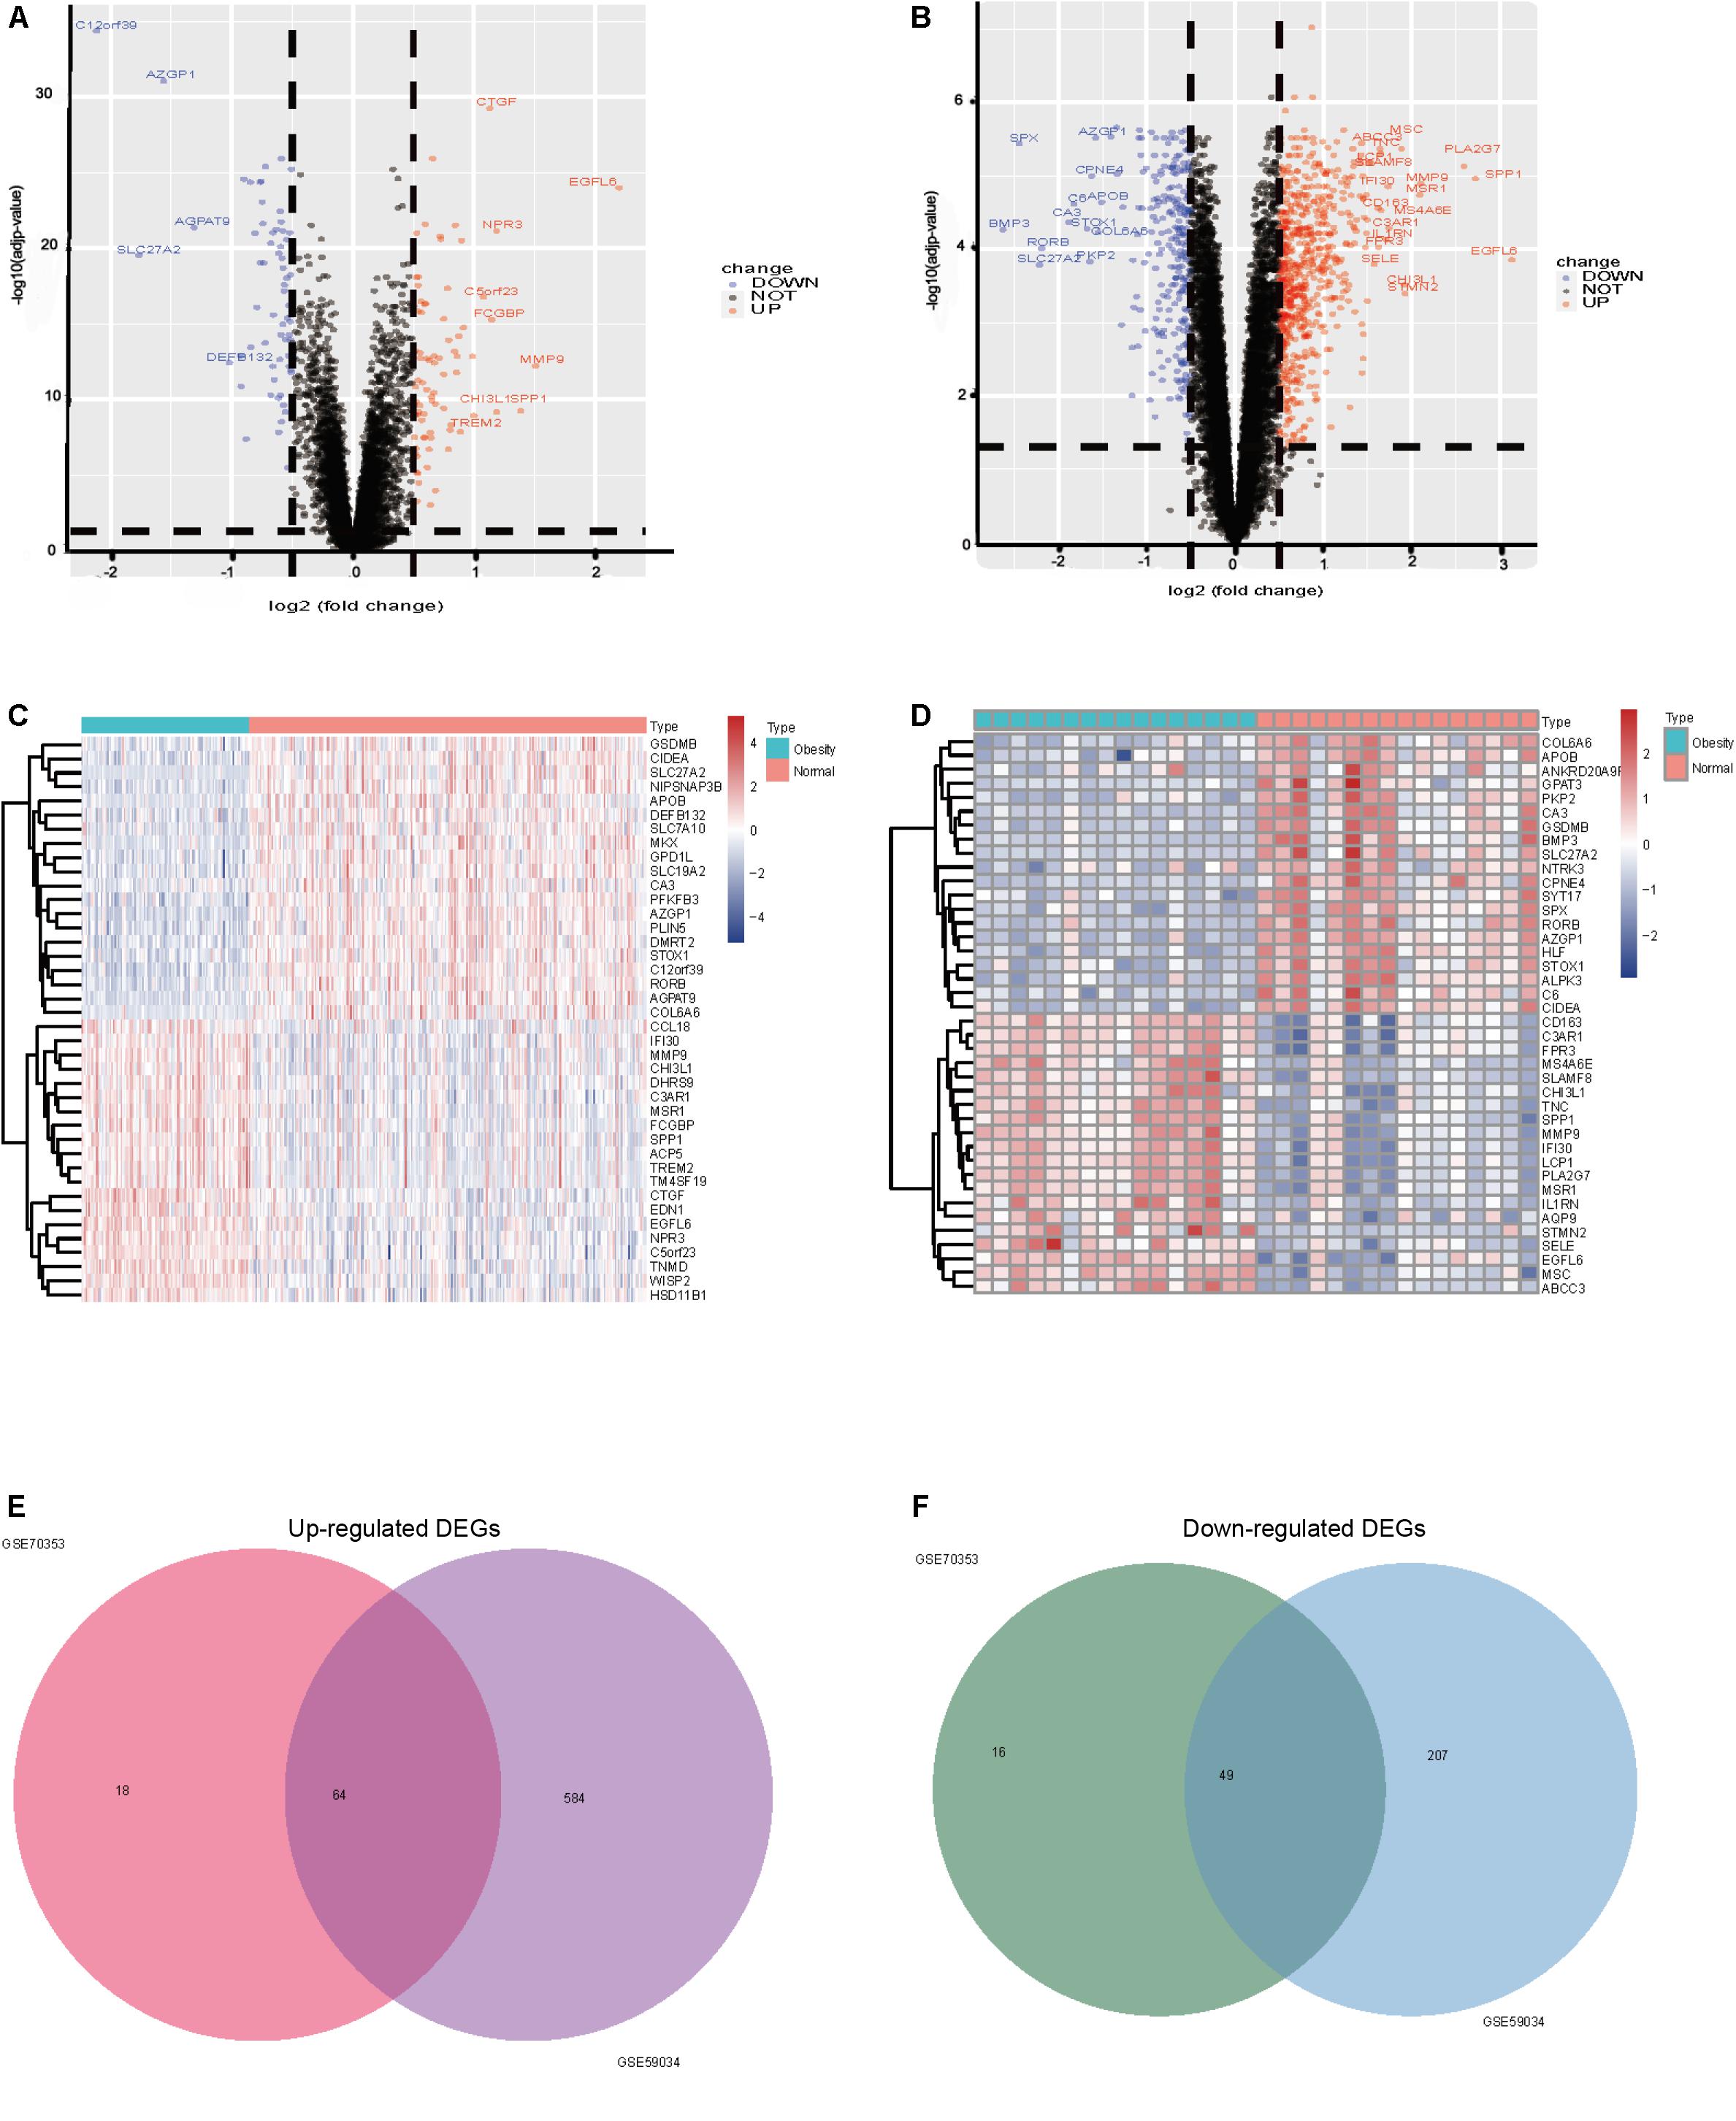
Figure 4. (A) GSE70353 volcano plots of differentially expressed genes, 82 upregulated and 65 downregulated, Upregulated genes are marked in red, downregulated genes are marked in blue; (B) GSE59034 volcano plots of differentially expressed genes 648 were upregulated and 256 downregulated; (C) GSE70353 top 20 up and down expressed genes heatmap, Upregulated genes are marked in red, downregulated genes are marked in blue; (D) GSE59034 top 20 up and down expressed genes heatmap; (E) up-regulation of co-expression Venn map with 64 up-regulation; (F) down-regulation of co-expressive Venn map with a total of 49 down-regulation co-expression.
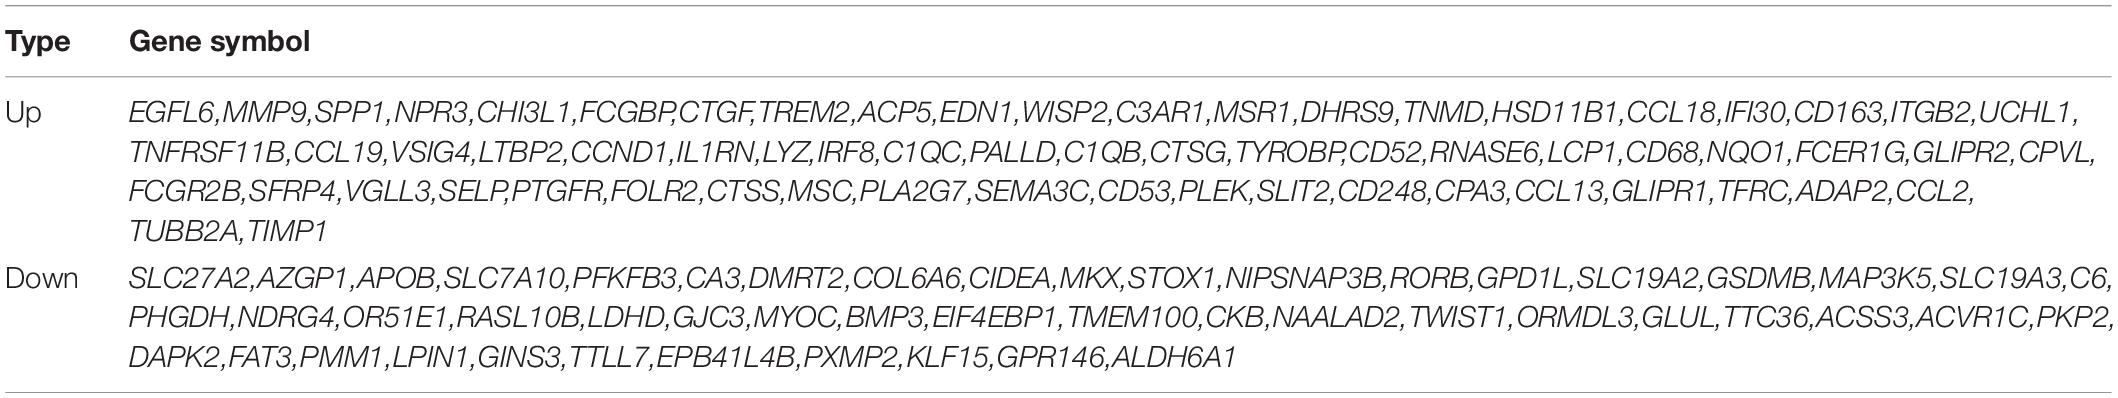
Table 2. Co-expression of differential genes.
Correlations Between Obesity-Related DEGs and Diseases
Obesity-upregulated genes were related to many diseases, including liver cirrhosis, pulmonary fibrosis, asthma, hypertension, rheumatoid arthritis, diabetes, and allergies (Table 3).
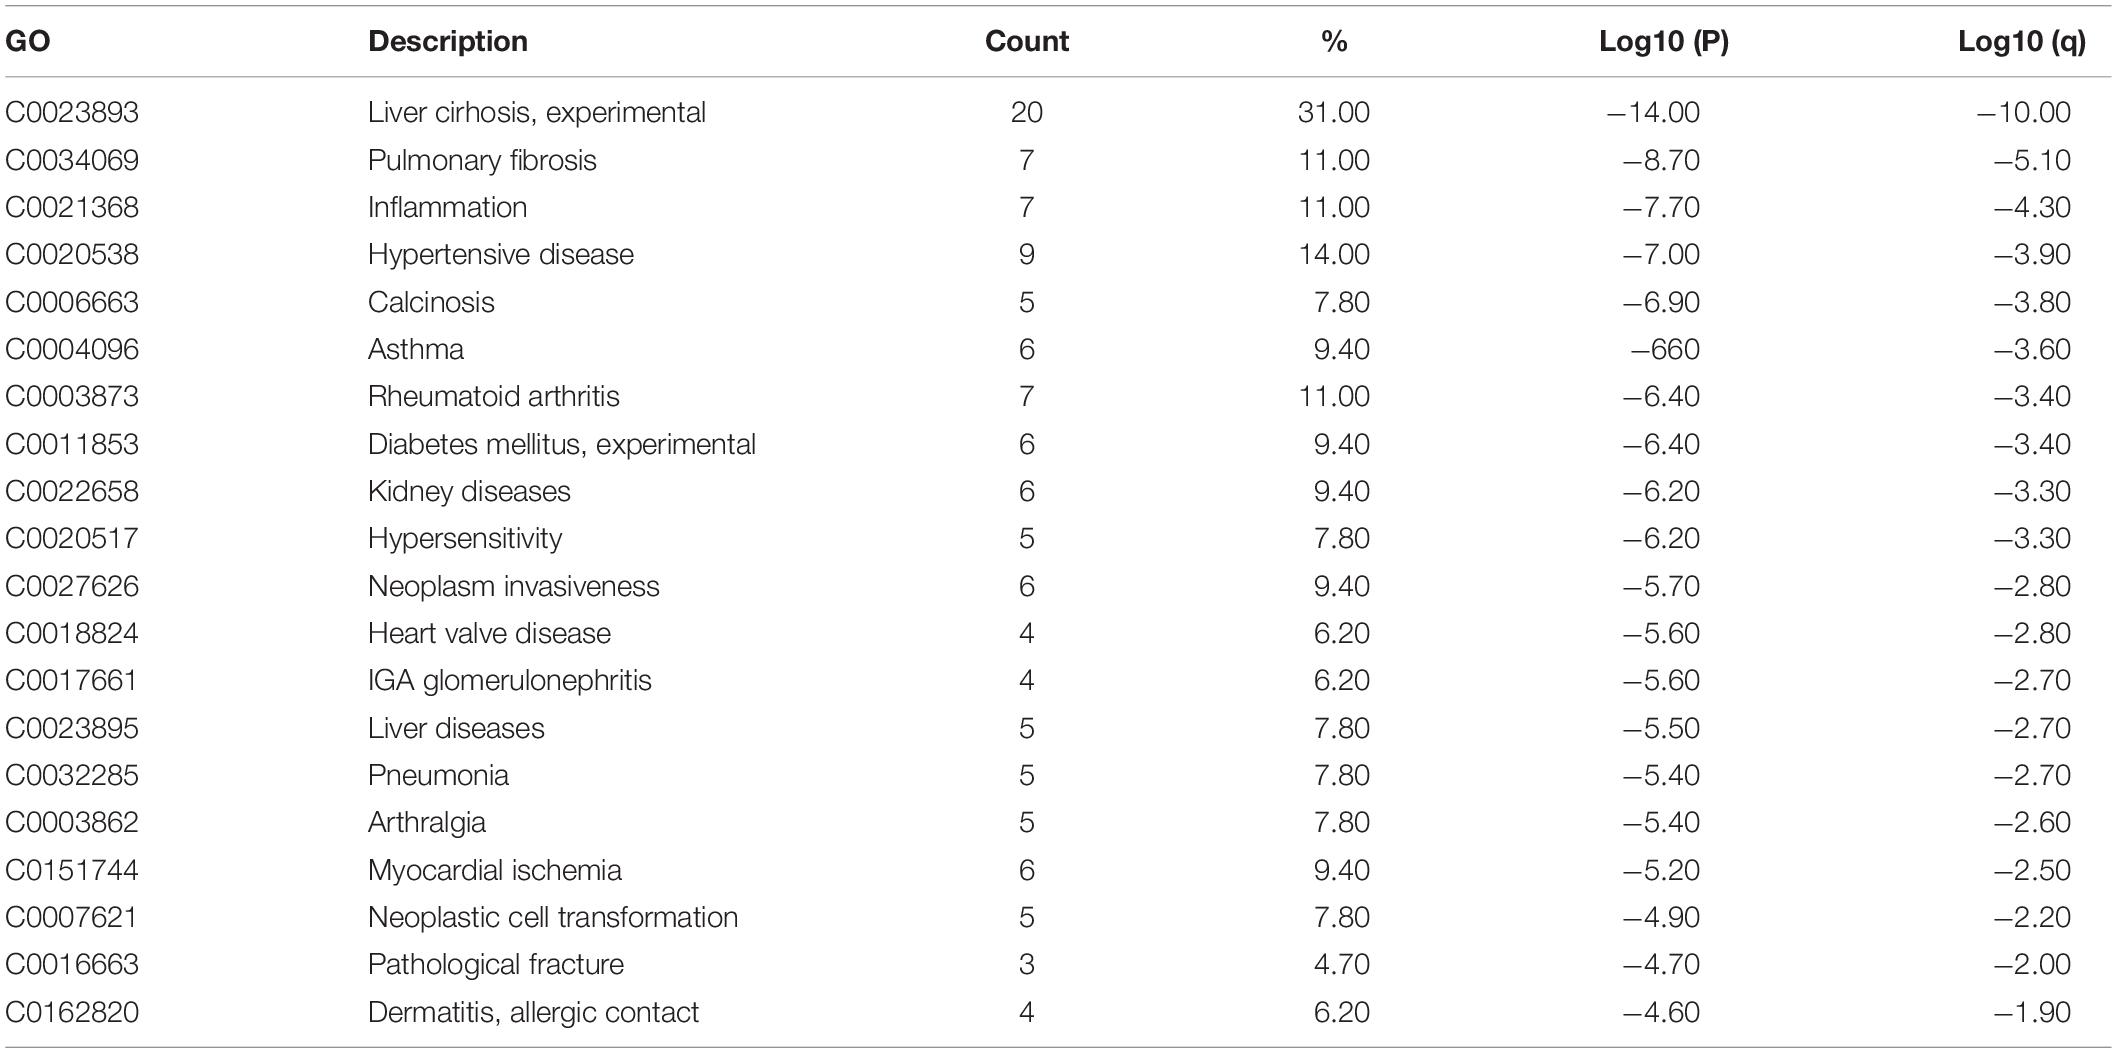
Table 3. Analysis of differential genes and related diseases.
GO Enrichment Analysis of DEGs
The results of GO enrichment analysis varied with GO classification and DEG expression changes, as shown in Figures 5A,B. In terms of biological processes, upregulated DEGs were significantly enriched in myeloid leukocyte migration, neutrophil migration, granulocyte chemotaxis, granulocyte migration, leukocyte chemotaxis, cell chemotaxis, neutrophil activation, leukocyte migration, the response to molecules of bacterial origin, and chemokine-mediated signaling. For cellular components, DEGs were enriched in the secretory granule membrane, collagen-containing extracellular matrix, protein-lipid complexes, lipoprotein particles, plasma lipoprotein particles, and low-density lipoprotein (LDL) particles. Regarding molecular functions, upregulated DEGs were significantly enriched for cytokine activity, receptor-ligand activity, LDL particle binding, amide binding, and CCR chemokine receptor binding. However, in terms of biological processes, downregulated DEGs were only enriched in the carboxylic acid catabolic process and the organic acid catabolic process. More detailed GO enrichment results are shown in Supplementary Tables 1, 2. The number of upregulated genes involved in the different processes of BP, CC, and MF was much higher than that of down-regulated genes. These results suggest that obesity may undergo complex metabolic activities involving adipose tissue inflammation.
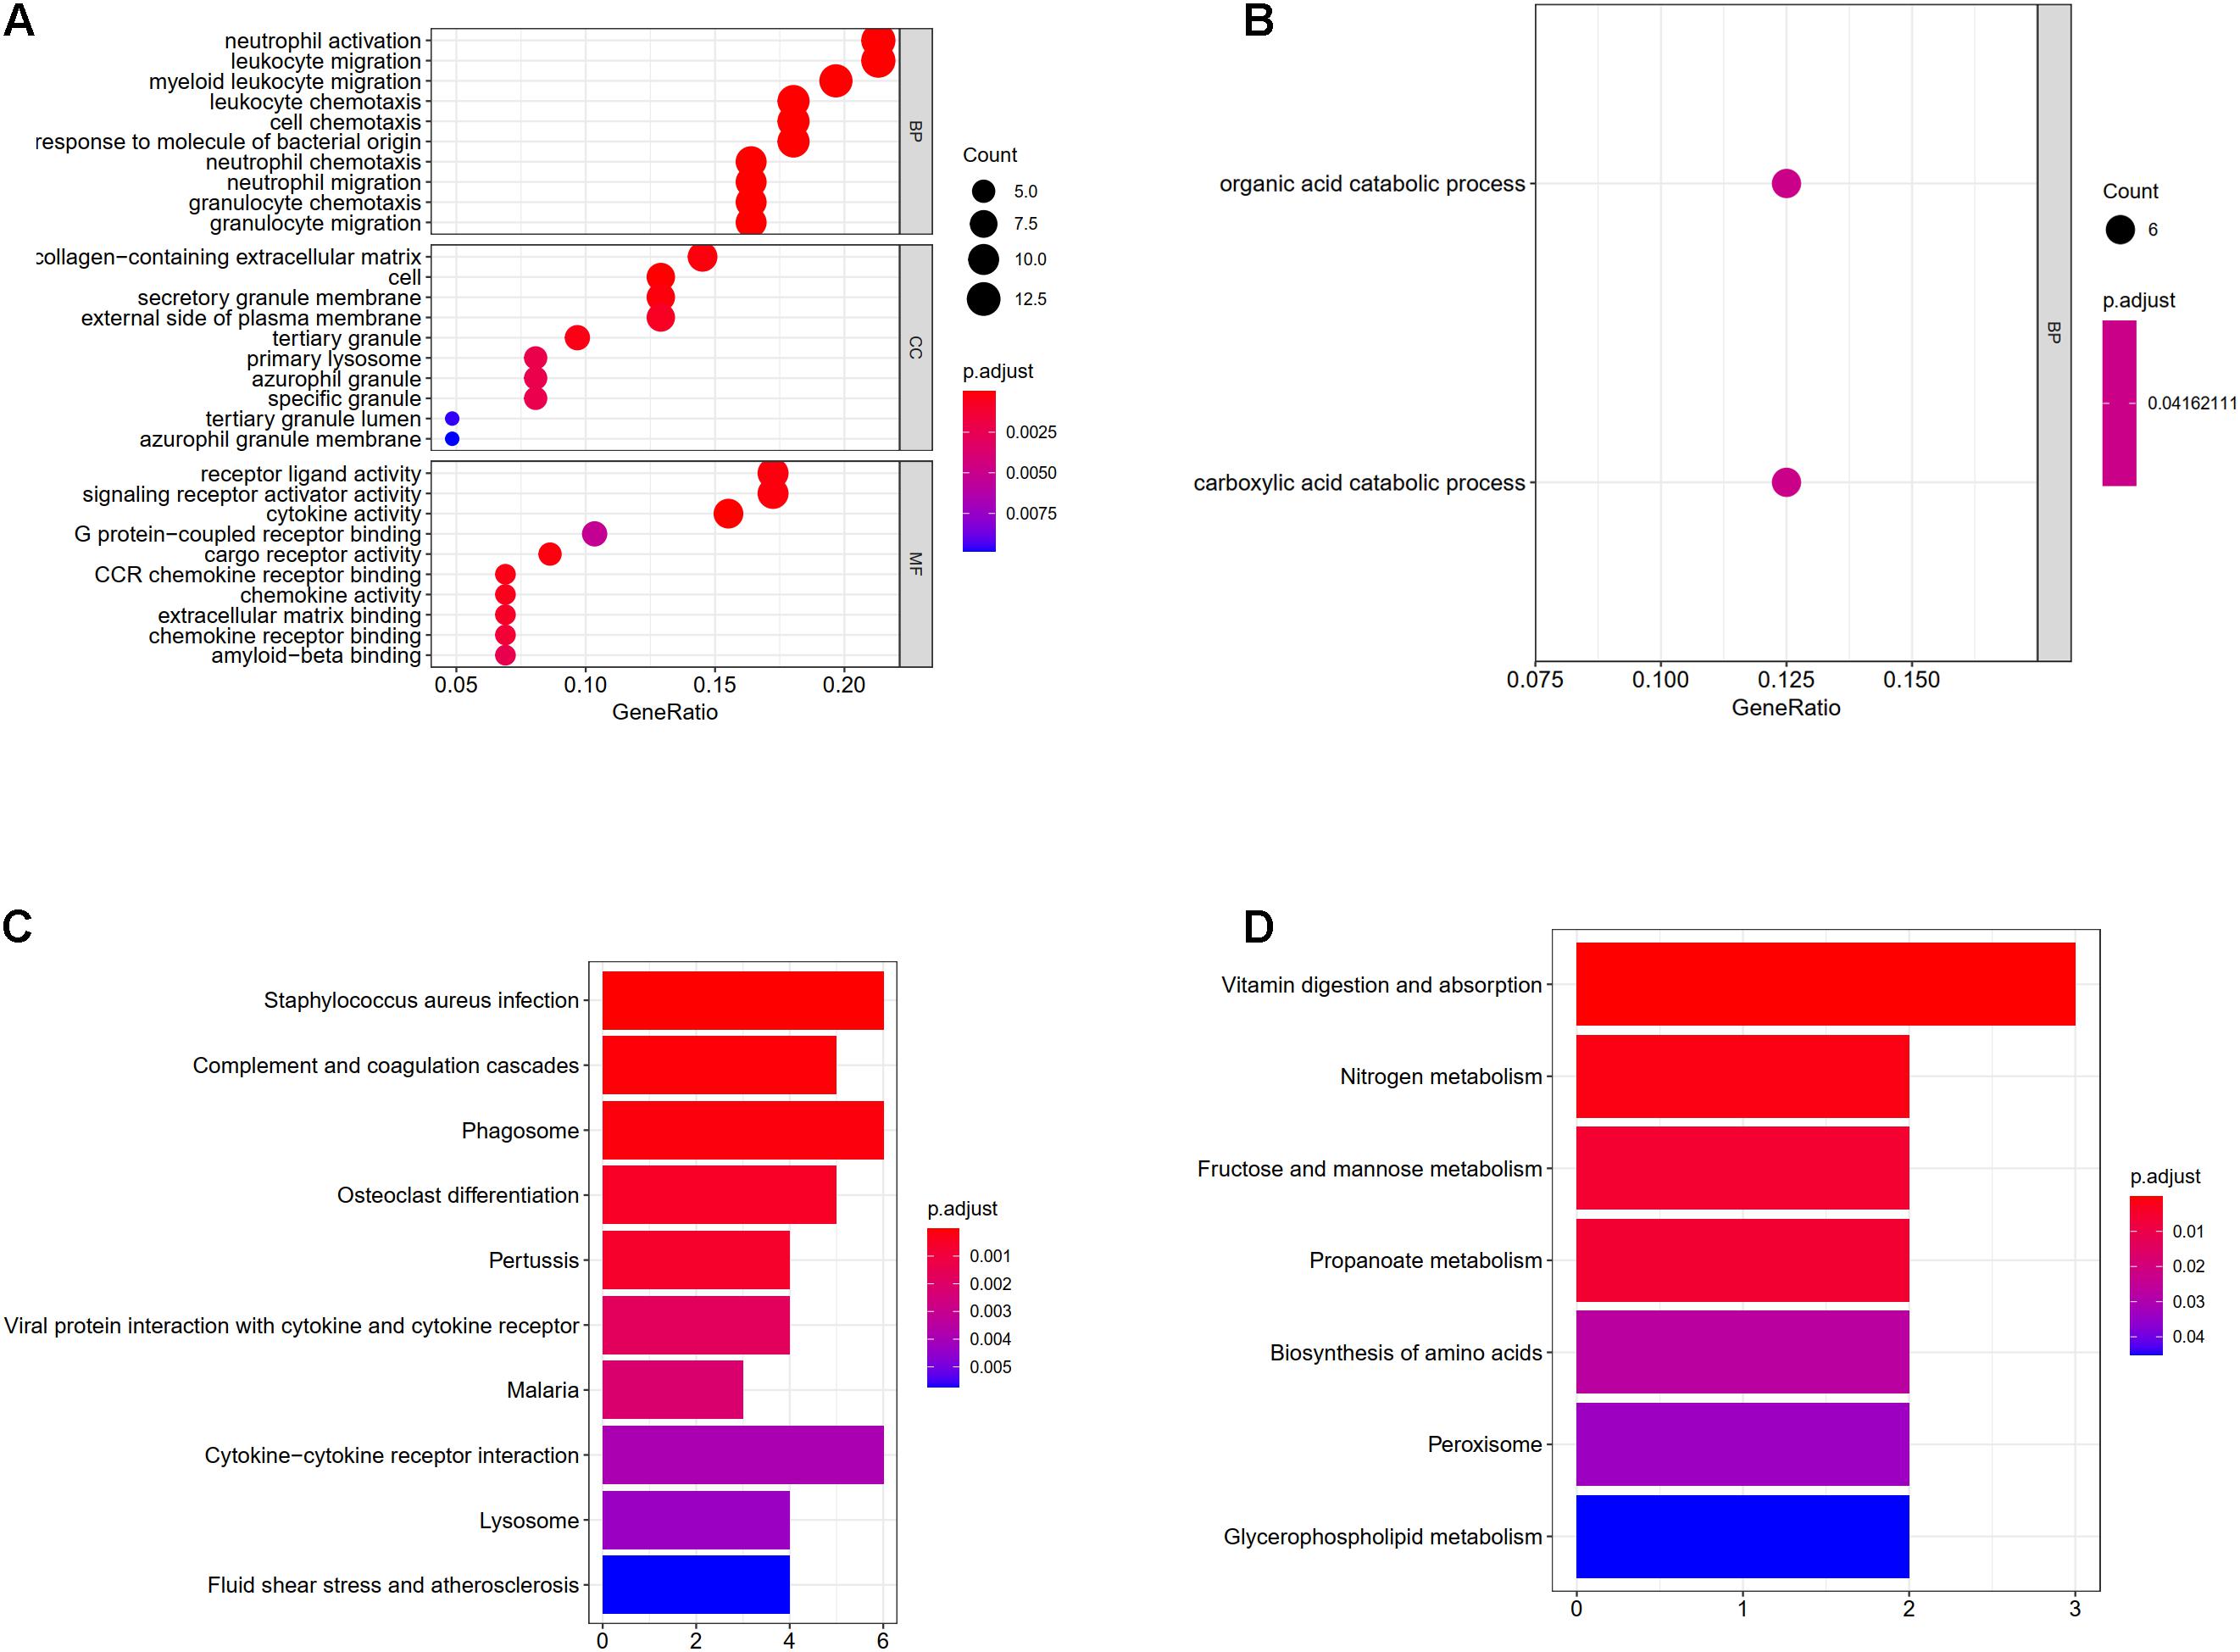
Figure 5. (A) Enrichment of upregulated differentially expressed genes in gene ontology (GO); (B) enrichment of downregulated differentially expressed genes in GO, different colored circles indicate different adjusted P-values. The size of the circle indicates the gene count. The Y-axis represents the GO term, the X-axis represents the gene proportion. (C) Enrichment of upregulated differentially expressed genes in KEGG, X-axis represents gene count, Y-axis represents different pathways, and different colors indicate different adjusted P-values; (D) enrichment of downregulated differentially expressed genes in KEGG.
KEGG Enrichment Analysis of DEGs
Upregulated genes were enriched in 23 pathways, and downregulated genes were enriched in seven pathways, as shown in Supplementary Tables 3, 4. The top 10 up- and downregulated pathways are shown in Figures 5C,D. Upregulated DEGs were enriched in pathways controlling Staphylococcus aureus infection, hypoxia-inducible factor 1 signaling, the complement and coagulation cascades, chemokine signaling, TNF signaling, and advanced glycation end products-receptor for advanced glycation end products signaling during diabetic complications, while downregulated genes were enriched in pathways controlling vitamin digestion and absorption, nitrogen metabolism, fructose and mannose metabolism, propanoate metabolism, amino acid biosynthesis, and glycerophospholipid metabolism.
Construction of an Obesity-Related DEG PPI Network
Based on the STRING database, we developed a PPI network containing 85 nodes and 285 edges in the network. As shown in Figure 6A, nodes are drawn in different sizes and colors, representing the node degree and control (up or down), there were 30 downregulated genes, 55 upregulated genes and 285 edges. The MCC method in cytoHubba plug-in was used to identify the top ten hub genes (Figure 6B). These 10 hub genes were all upregulated genes, as follows: the CD53 molecule (CD53), pleckstrin (PLEK), cathepsin S (CTSS), integrin subunit beta 2 (ITGB2), TYRO protein tyrosine kinase binding protein (TYROBP), complement C1q B chain (C1QB), complement C1q C chain (C1QC), complement C3a receptor 1 (C3AR1), Fc fragment of IgG receptor IIb (FCGR2B), and Fc fragment of IgE receptor Ig (FCER1G).
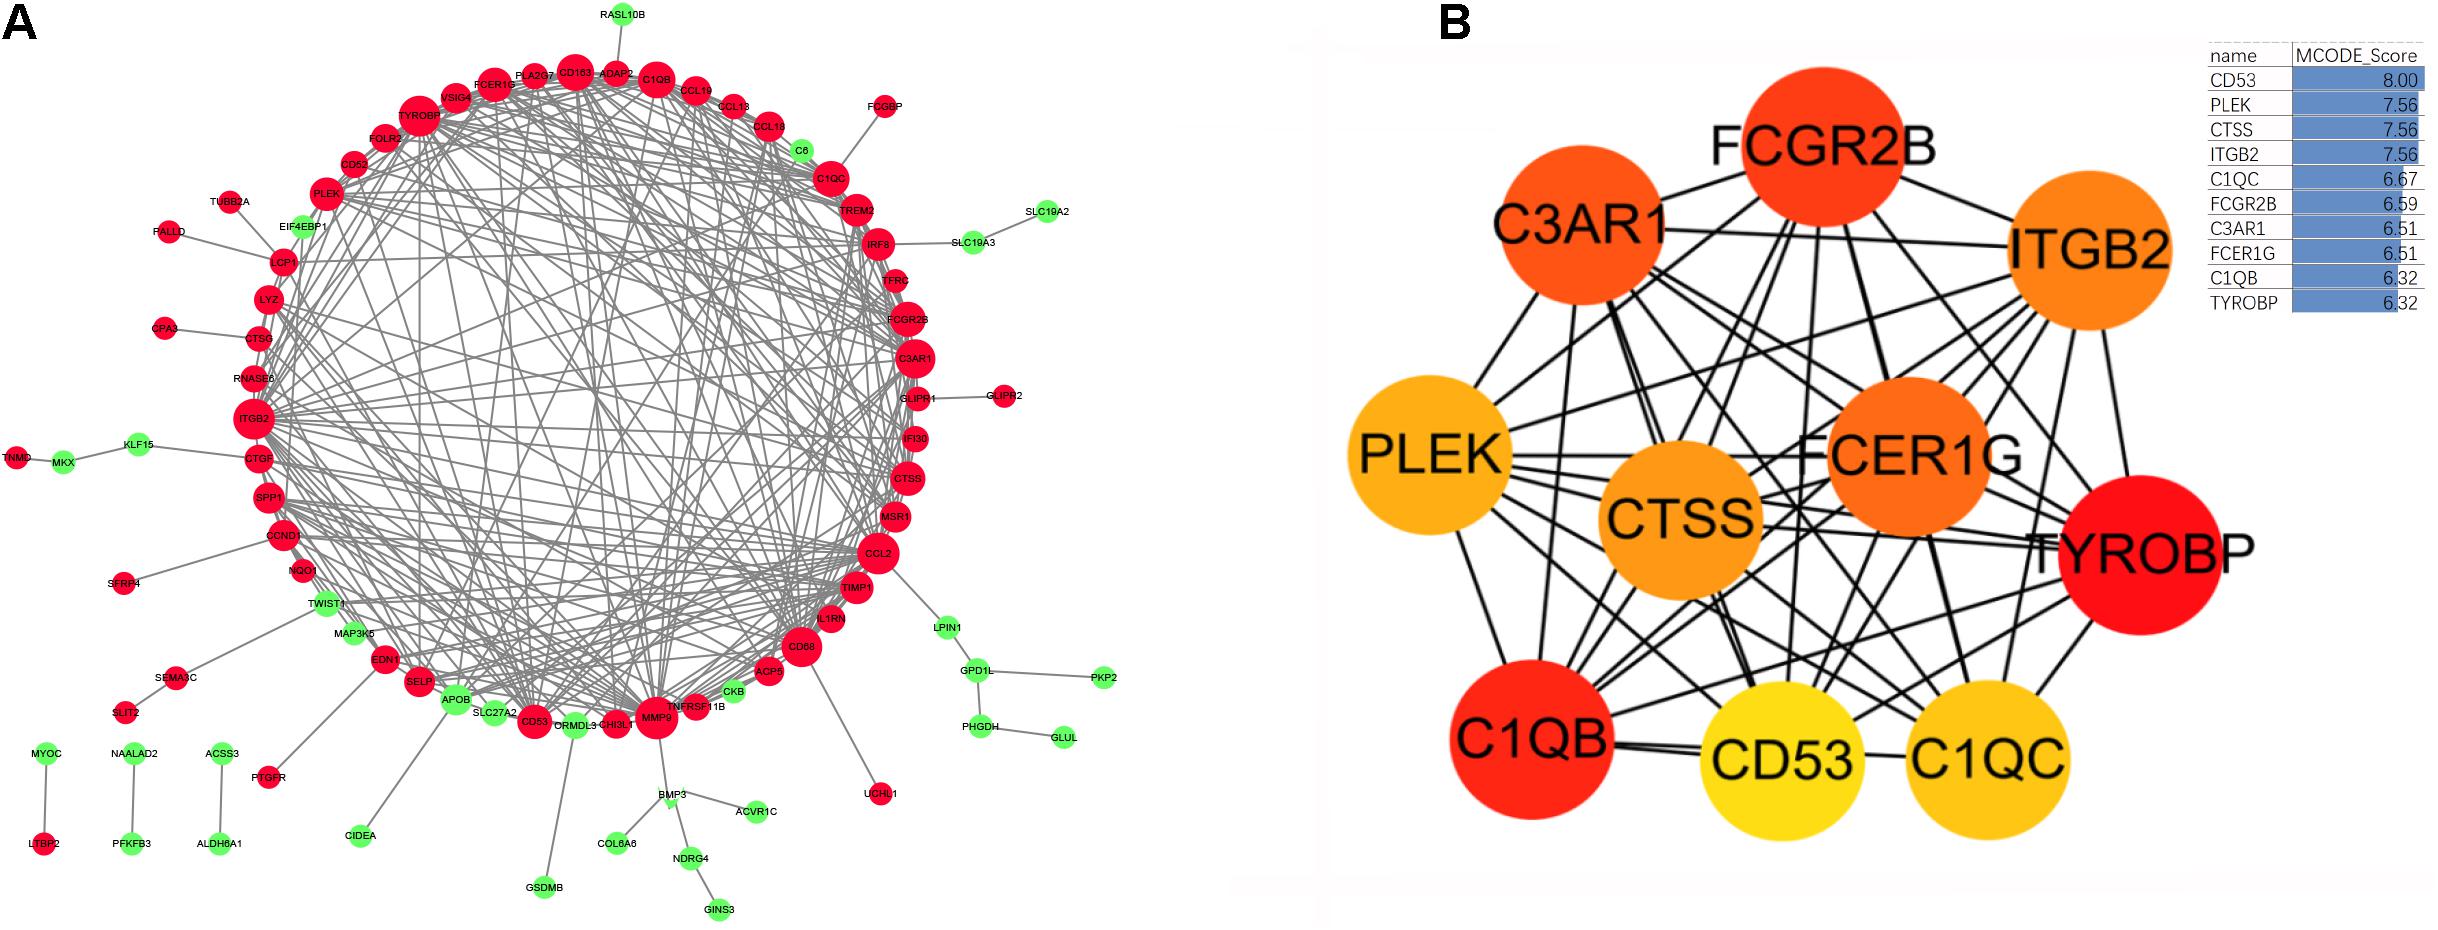
Figure 6. (A) The protein-protein interaction network diagram of DEGs in obese adipose tissue, red and green indicate that the node is upregulated and downregulated, respectively. The area of the node indicates the degree to which the node is connected to other nodes. (B) The top 10 hub genes screened by the MCC method in Cytohubba. The deeper yellow is the hub gene with a higher score, MCODE Score is calculated by MCC method, higher score means higher degree of connectivity.
Verification of Hub Obesity Genes
To validate the changes in these hub genes in obesity, we performed relevant analyses in the GSE55200 dataset, which revealed that the expression of each hub gene was higher in the adipose tissue of obese people than in those of non-obese people (p < 0.05; Figure 7).
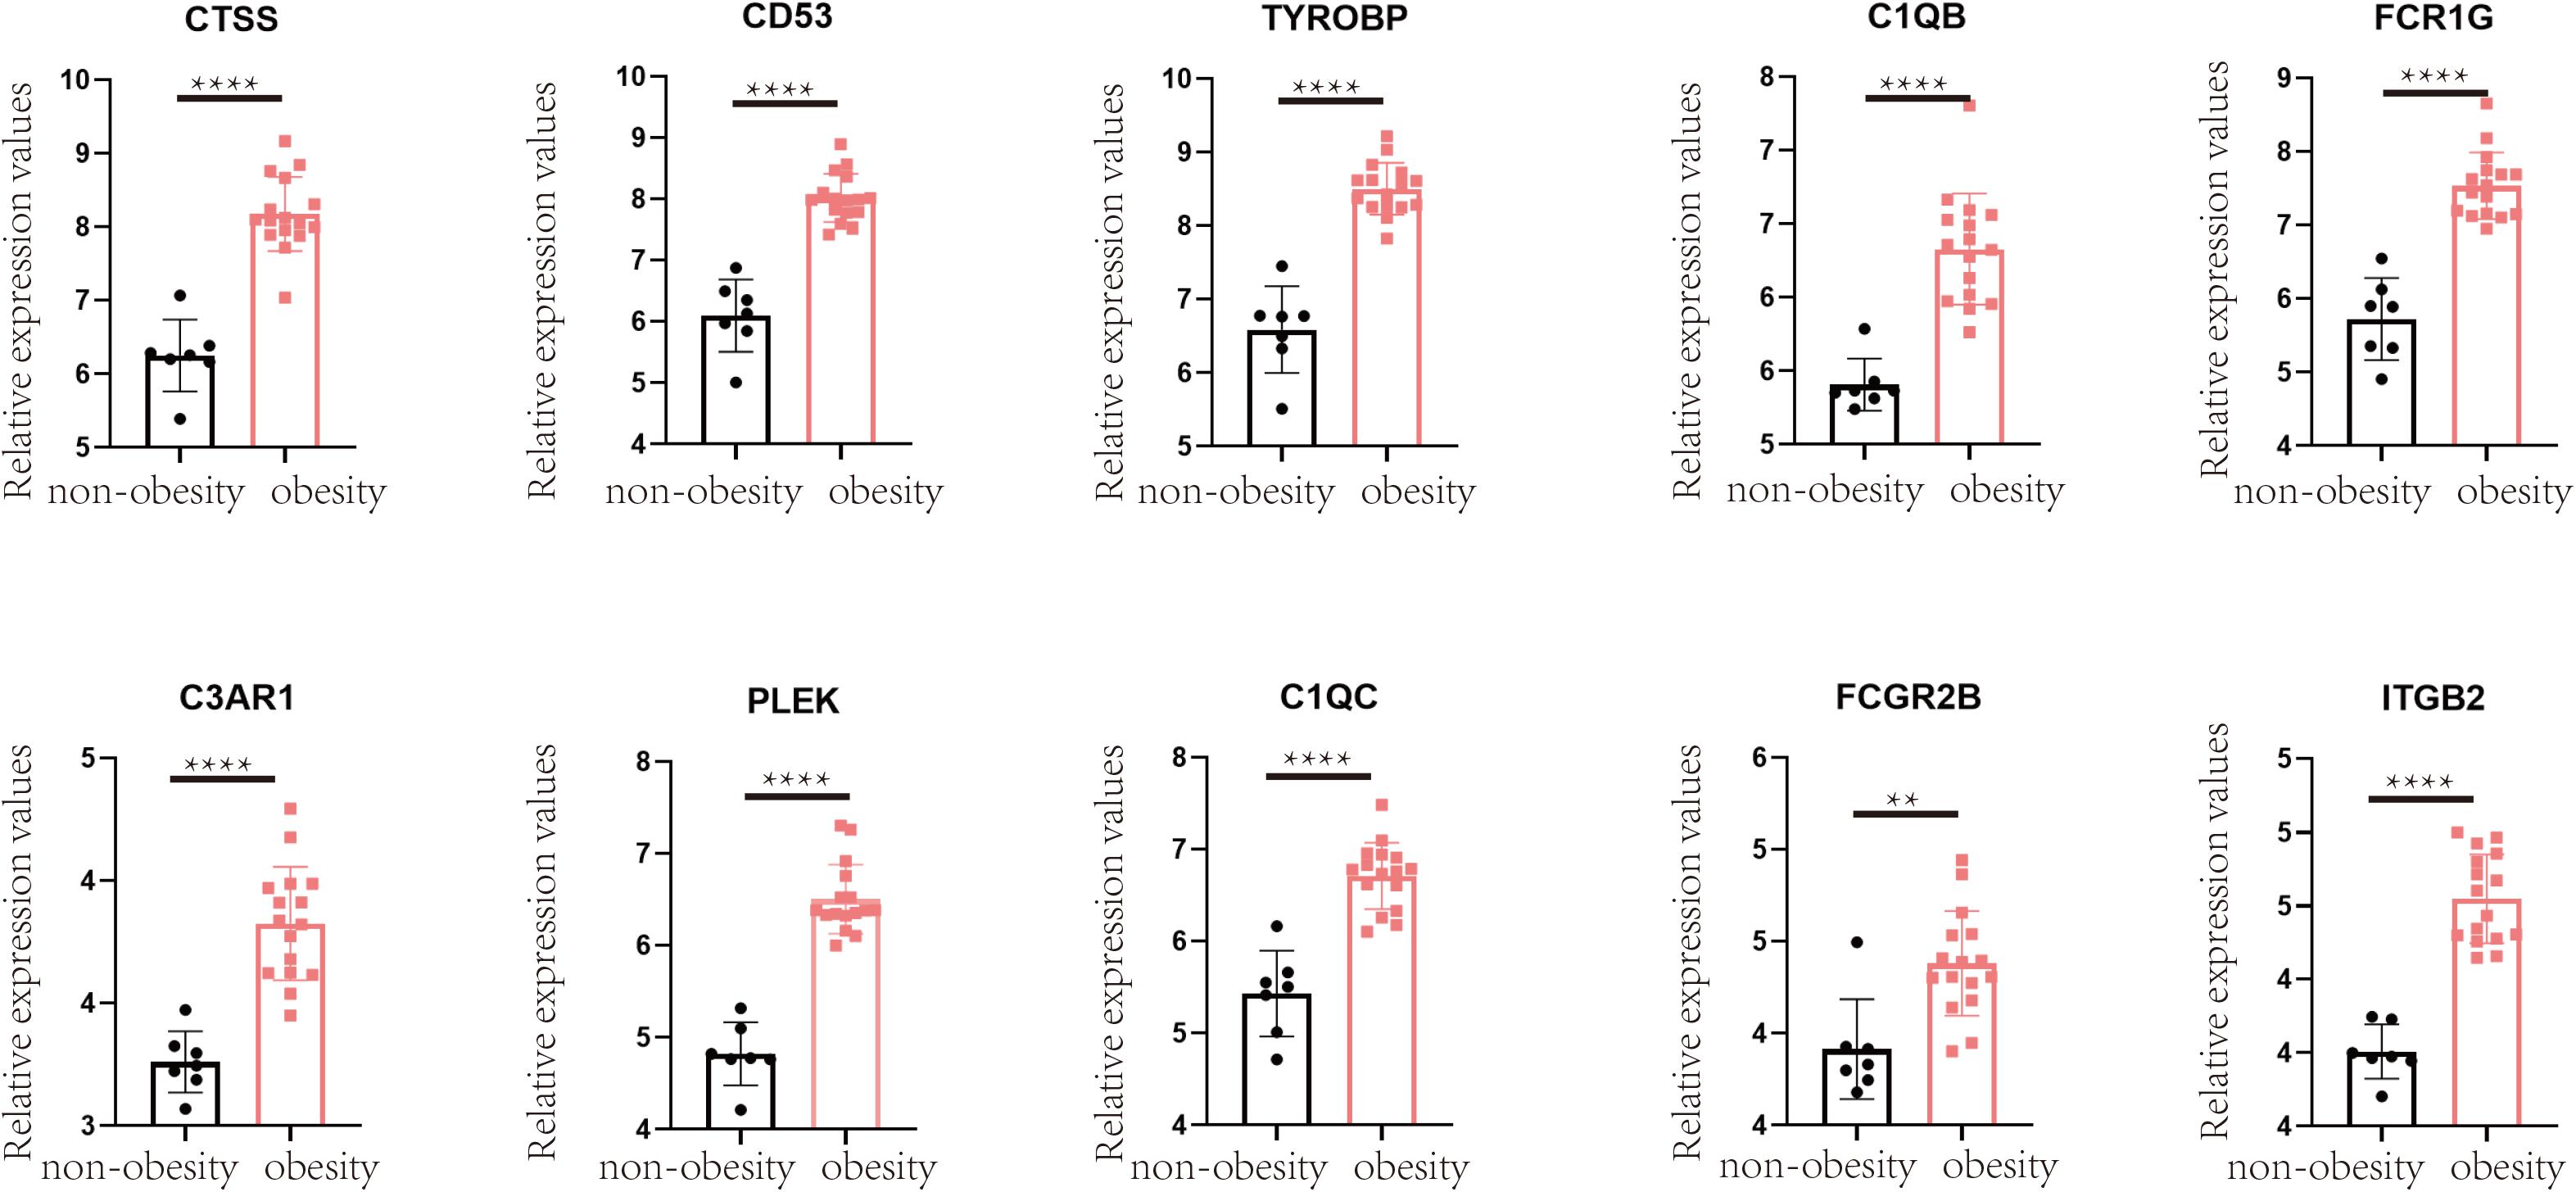
Figure 7. Verification in GSE55200 dataset, the comparison of hub gene in adipose tissue of obese and non-obese population. Y-axis represents the relative expression counts of genes. Obesity was marked in red, non-obesity was marked in black. ** for < 0.01, **** for < 0.0001.
Chemicals Associated With Hub Genes
We searched the CTD database for the 10 hub genes, and seven were related to obesity. For example, many chemicals have been identified that affect the expression of CD53 and lead to obesity, including bisphenol A, cadmium chloride, carbon tetrachloride, choline, cisplatin, dexamethasone, dietary fats, diethylstilbestrol, ethinyl estradiol, lipopolysaccharides, methionine, parathion, phenobarbital, resveratrol, sodium selenite, streptozocin, tamoxifen, testosterone enanthate, tetrabromobisphenol A, tetrachlorodibenzodioxin, and tretinoin. The complete results are shown in Table 4.
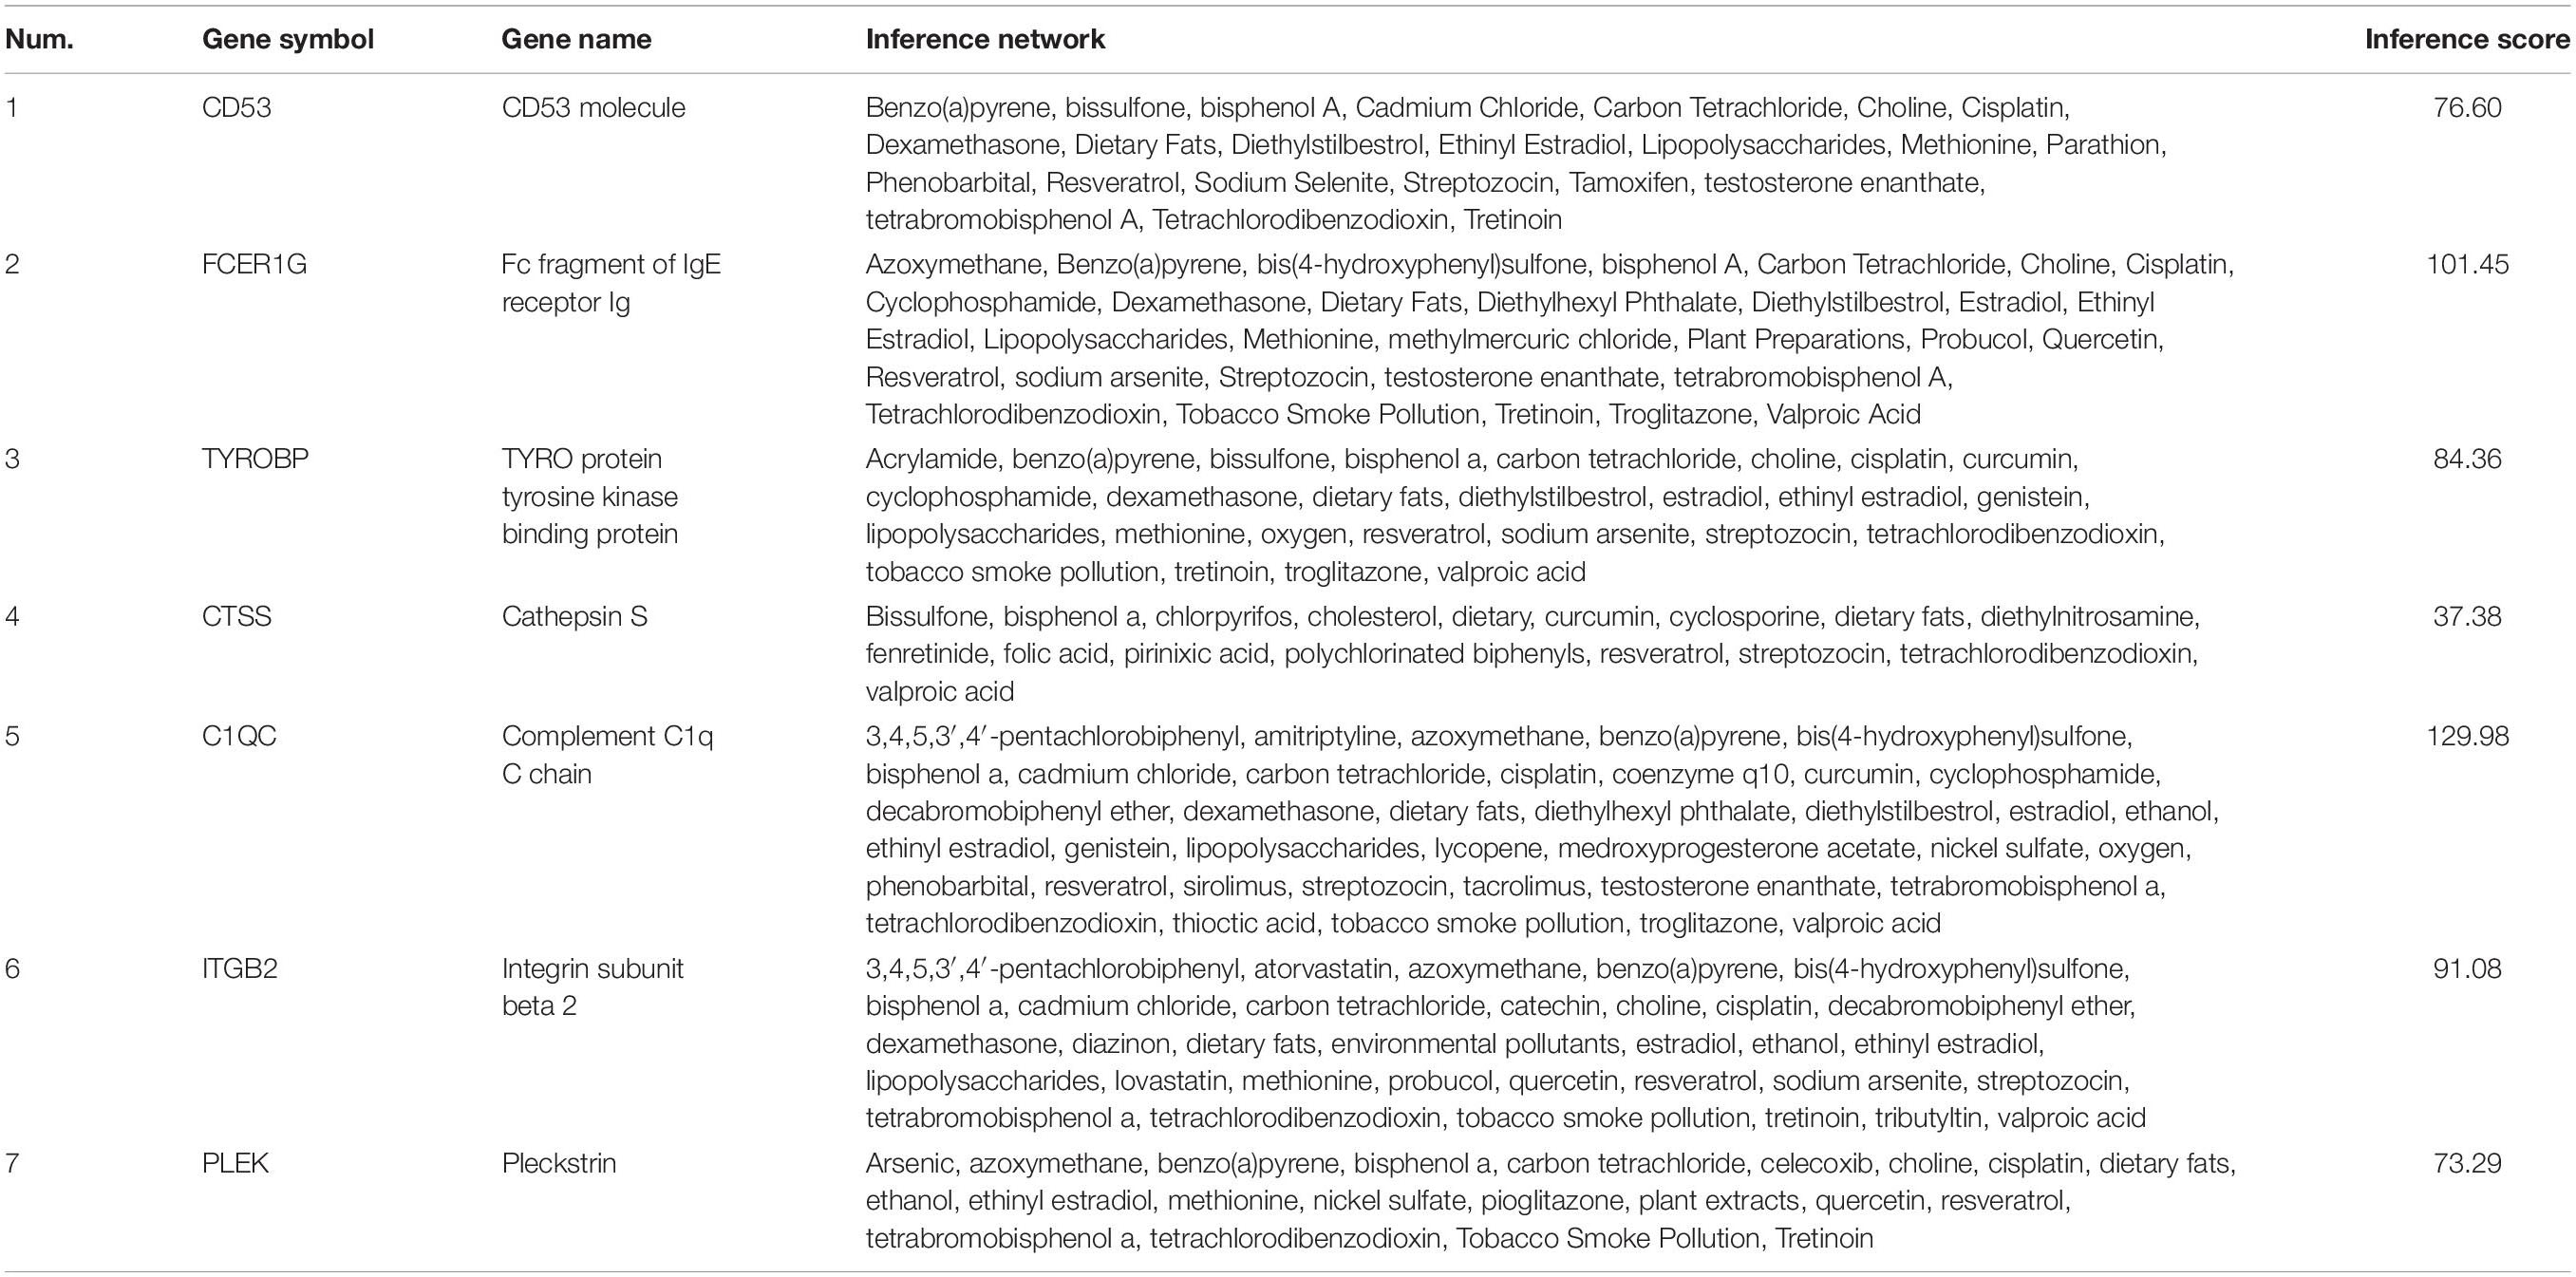
Table 4. Chemicals associated with obesity and weight gain.
Discussion
Globally, the incidence of obesity is continuously increasing. The harms and economic losses caused by obesity are significant. In 2014, economic losses directly or indirectly caused by obesity were as high as $2.0 trillion (Woetzel et al., 2014). The main feature of obesity is the accumulation of excessive adipose tissue, which can induce several diseases via oxygen deprivation, abnormal cytokine secretion, and interference with glycolipid metabolism (Chait and den Hartigh, 2020). Therefore, it is important to explore gene expression changes and associated molecular mechanisms in the adipose tissue of obese individuals. As the different estrogen levels and neural underpinnings affect body adipose tissue levels and appetite, obesity rates are higher in women than in men in most countries and regions, with an average prevalence of 10 and 18% in men and women, respectively (Kroll et al., 2020). Because of this, many studies have examined male and female obesity separately (Garawi et al., 2014). However, other studies have shown that variants of certain genes, including FTO alpha-ketoglutarate dependent dioxygenase, retinoic acid induced 1, MAGE family member L2, and melanocortin 4 receptor contribute to obesity development (Fall and Ingelsson, 2014; Poitou et al., 2020). To identify genes and pathways that cause obesity in everyone, in this study we analyzed two datasets, GSE70353, containing samples from men in Northern Finland with an average age of 54, and GSE59034, containing samples from women in Sweden with an average age of 45. We analyzed their DEGs separately, then performed overlap analysis to obtain a list of DEGs that were meaningful to all. A total of 64 upregulated and 49 downregulated genes were identified. Upregulated DEGs were associated with many diseases, including liver cirrhosis, pulmonary fibrosis, asthma, hypertension, rheumatoid arthritis, and diabetes. This evidence and epidemiological data provide mutual verification of the harmful effects of obesity (Chooi et al., 2019). These DEGs may represent key targets for the treatment of obesity and its complications.
Functional enrichment analyses revealed that the upregulated genes were mainly involved in the enhancement of inflammatory signals, including hypoxia-inducible factor 1, chemokine, and TNF signaling pathways. The increased oxygen consumption and the increasing size of adipocytes in turn leads to the occurrence of adipose tissue hypoxia (Lee et al., 2014). This may further induce increased production of adipokines such as chemokines, which increase myeloid leukocyte and neutrophil migration leading to chronic inflammation of adipose tissue (Krinninger et al., 2014). Downregulated genes were mainly involved in the metabolism of various nutrients, including fructose and mannose, propanoate, and glycerophospholipid metabolism, as well as amino acid biosynthesis (Shi et al., 2020). This indicates decreased metabolic function and nutrient dysregulation in the adipose tissue of obese people (Rogero and Calder, 2018). We also used GSEA to verify and supplement the DEG enrichment results. Pathways positively related to obesity included inflammatory infection, the complement cascade, and the toll-like receptor signaling pathway, which indicated that the complement system and toll-like receptors are the main factors of inflammation in adipose tissue during obesity (Rogero and Calder, 2018). Pathways negatively related to obesity included adipocytokine signaling, insulin signaling, and fatty acid metabolism, which reflect a dysregulation of adipokines and insulin signaling in obese patients. As enrichment analysis indicated inflammation-related signal upregulation in the adipose tissue of obese people, we used the CIBERSORT algorithm to detect whether there were changes in the immune cell composition between tissues from the two groups. It revealed increases in M0, M1, and M2 macrophages in the tissues of obese people, which may be the main reasons of adipose tissue inflammation. It also showed decreases in T cells, including CD4, CD8, and γδ types. Hu et al. showed that T cells (especially γδ T cells) can promote sympathetic innervation by driving the expression of transforming growth factor β1 in parenchymal cells via IL17 receptor C (Hu et al., 2020). Interestingly, recent studies have also reported fewer circulating γδ T cells in obesity (Li et al., 2020), which reduces the ability to fight viral infections, leading to a poorer prognosis for obese people than for lean people after infections such as severe acute respiratory syndrome coronavirus 2 (Jouan et al., 2020). Strategies to increase γδ T cell activation in these patients may be a promising direction for future research.
To identify the most critical hub genes among the 113 DEGs, we constructed a PPI network to identify the most interconnected genes. The top 10 hub genes were all upregulated. CD53 is the most connected protein in the PPI network. It is mainly expressed on the membranes of immune cells, where it helps regulate many of their functions, including adhesion, migration, and cell fusion (Dunlock, 2020), and plays an important role in antigen presentation. Many studies have shown that CD53 is increased in obese and inflammatory tissues, and regulating its expression may be an effective treatment for obesity with complications (Nair et al., 2005; Zhao et al., 2020). PLEK is the major protein kinase C substrate phosphorylated in diabetic macrophages, where a 30% reduction in PLEK can inhibit TNFα secretion by 80% (Ding et al., 2007). CTSS can promote adipocyte differentiation by degrading fibronectin. In vitro studies have also shown that the inflammatory factors TNFα and IL1β can induce cathepsin secretion in adipose tissue (Hooton et al., 2012). The expression of cathepsin mRNA in the adipose tissue of obese subjects was two times higher than that of healthy-weight subjects and decreased after weight loss, which shows that cathepsins can be effective markers of obesity (Naour et al., 2010).
ITGB2 is positively correlated with obesity (Taleb et al., 2005; Pei et al., 2014; Imaizumi et al., 2018). It plays an important role in the immune response, and defects in ITGB2 cause leukocyte adhesion deficiency (Ng et al., 2015). TYROBP is strongly related to insulin resistance and is mainly involved in the regulation of immune responses and integrin-mediated signaling (Das et al., 2015). C3AR1 is a complement receptor that is expressed in both adipocytes and macrophages, and is increased by a high-fat diet (Mamane et al., 2009). C3AR1 activation can enhance lipolysis induced by adrenaline, which may be a good way to treat obesity (Cero et al., 2017). C1QB and C1QC belong to a family of complement proteins that are positively correlated with immune cell chemotaxis and can regulate the expression of the immune cells. Recent findings have revealed that C1Q-related gene knockouts can prevent obesity-related complications of Alzheimer’s disease (Graham et al., 2020). FCGR2B and FCER1G are immunoglobulin fragments that regulate the immune response, and increase the likelihood of obese patients developing allergic diseases (Mathur et al., 2013). Shu et al. (2018) showed that FCGR2B promotes lipid accumulation and gluconeogenesis in hepatocytes.
In summary, CD53, PLEK, CTSS, ITGB2, TYROBP, C1QB, C1QC, C3AR1, FCGR2B, and FCER1G were all highly expressed in the adipose tissue of obese people. They all contribute to obesity and its complications, primarily through immune inflammation and glucolipid metabolism-related effects. In addition, the problem of environmental pollution is becoming increasingly serious, and many fat-soluble chemicals can accumulate in adipose tissue and interfere with gene expression, leading to obesity. The CTD database indicated that cadmium chloride, parathion, tetrachlorodiben, zodioxin, and bisphenol A may cause obesity by interfering with the expression of these hub genes. Therefore, it is important to reduce exposure to these chemicals. A limitation of this study is that it is strictly based on bioinformatic analysis, and the results will require further verification in vitro and in vivo.
Conclusion
In conclusion, this is the first large-scale study to examine differential gene expression in the adipose tissues of obese and non-obese populations. Our study provides several potential biomarkers and related molecular mechanisms for obesity and its complications, and lays a foundation for the exploration of new targeted treatments.
Data Availability Statement
The datasets presented in this study can be found in online repositories. The names of the repository/repositories and accession number(s) can be found in the article/ Supplementary Material.
Author Contributions
ZL wrote the article. LM designed the study. ZS and XS were responsible for data collection and analysis. WS and YZ were responsible for data analysis and mapping. JS and XY revised and critically reviewed the article. All authors have agreed on the journal to which the article has been submitted, agreed to be accountable for all aspects of the work criteria, and made a significant contribution to the work reported.
Conflict of Interest
The authors declare that the research was conducted in the absence of any commercial or financial relationships that could be construed as a potential conflict of interest.
Supplementary Material
The Supplementary Material for this article can be found online at: https://www.frontiersin.org/articles/10.3389/fgene.2021.620740/full#supplementary-material
Footnotes
- ^ http://www.ncbi.nlm.nih.gov/geo
- ^ http://www.gsea-msigdb.org/gsea/msigdb/collections.jsp
- ^ http://jvenn.toulouse.inra.fr/app/example.html
- ^ http://www.string-db.org/
- ^ http://ctdbase.org/
References
Andersen, L. B., Mota, J., and Di Pietro, L. (2016). Update on the global pandemic of physical inactivity. Lancet 388, 1255–1256.
Apovian, C. M., Aronne, L. J., Bessesen, D. H., McDonnell, M. E., Murad, M. H., Pagotto, U., et al. (2015). Pharmacological Management of Obesity: an Endocrine Society Clinical Practice Guideline. J. Clin. Endocrinol. Metab. 100, 342–362.
Arnold, M., Leitzmann, M., Freisling, H., Bray, F., Romieu, I., Renehan, A., et al. (2016). Obesity and cancer: an update of the global impact. Cancer Epidemiol. 41, 8–15.
Badoud, F., Lam, K. P., DiBattista, A., Perreault, M., Zulyniak, M. A., Cattrysse, B., et al. (2014). Serum and adipose tissue amino acid homeostasis in the metabolically healthy obese. J. Proteome Res. 13, 3455–3466.
Bardou, P., Mariette, J., Escudié, F., Djemiel, C., and Klopp, C. (2014). jvenn: an interactive Venn diagram viewer. BMC Bioinformatics 15:293. doi: 10.1186/1471-2105-15-293
Cero, C., Razzoli, M., Han, R., Sahu, B. S., Patricelli, J., Guo, Z., et al. (2017). The neuropeptide TLQP-21 opposes obesity via C3aR1-mediated enhancement of adrenergic-induced lipolysis. Mol. Metab. 6, 148–158.
Chait, A., and den Hartigh, L. J. (2020). Adipose Tissue Distribution, Inflammation and Its Metabolic Consequences, Including Diabetes and Cardiovascular Disease. Front. Cardiovasc. Med. 7:22. doi: 10.3389/fcvm.2020.00022
Chin, C.-H., Chen, S.-H., Wu, H.-H., Ho, C.-W., Ko, M.-T., and Lin, C.-Y. (2014). cytoHubba: identifying hub objects and sub-networks from complex interactome. BMC Syst. Biol. 8:S11. doi: 10.1186/1752-0509-8-S4-S11
Civelek, M., Wu, Y., Pan, C., Raulerson, C. K., Ko, A., He, A., et al. (2017). Genetic Regulation of Adipose Gene Expression and Cardio-Metabolic Traits. Am. J. Hum. Genet. 100, 428–443.
Das, S. K., Sharma, N. K., and Zhang, B. (2015). Integrative network analysis reveals different pathophysiological mechanisms of insulin resistance among Caucasians and African Americans. BMC Med. Genom. 8:4. doi: 10.1186/s12920-015-0078-0
Davis, A. P., Grondin, C. J., Johnson, R. J., Sciaky, D., McMorran, R., Wiegers, J., et al. (2019). The comparative toxicogenomics database: update 2019. Nucleic Acids Res. 47, D948–D954.
Ding, Y., Kantarci, A., Badwey, J. A., Hasturk, H., Malabanan, A., and Van Dyke, T. E. (2007). Phosphorylation of pleckstrin increases proinflammatory cytokine secretion by mononuclear phagocytes in diabetes mellitus. J. Immunol. 179, 647–654.
Dunlock, V. E. (2020). Tetraspanin CD53: an overlooked regulator of immune cell function. Med. Microbiol. Immunol. 209, 545–552.
Edgar, R., Domrachev, M., and Lash, A. E. (2002). Gene Expression Omnibus: NCBI gene expression and hybridization array data repository. Nucleic Acids Res. 30, 207–210.
Fall, T., and Ingelsson, E. (2014). Genome-wide association studies of obesity and metabolic syndrome. Mol. Cell Endocrinol. 382, 740–757.
Gadde, K. M., Martin, C. K., Berthoud, H.-R., and Heymsfield, S. B. (2018). Obesity Pathophysiology and Management. J.Am Coll. Cardiol. 71, 69–84.
Garawi, F., Devries, K., Thorogood, N., and Uauy, R. (2014). Global differences between women and men in the prevalence of obesity: is there an association with gender inequality? Euro. J. Clin. Nutr. 68, 1101–1106.
Gehan, E. A. (1965). A generalized Wilcoxon test for comparing arbitrarily singly-censored samples. Biometrika 52, 203–224.
Gene Ontology Consortium[GOC] (2006). The Gene Ontology (GO) project in 2006. Nucleic Acids Res. 34, D322–D326.
Giralt, M., and Villarroya, F. (2013). White, brown, beige/brite: different adipose cells for different functions? Endocrinology 154, 2992–3000.
Graham, L., Kocalis, H., Soto, I., and Howell, G. (2020). Deficiency of complement component C1Q prevents cerebrovascular damage and white matter loss in a mouse model of chronic obesity. eNeuro 7, ENEURO.57–ENEURO.20.
Hatoum, I. J., Greenawalt, D. M., Cotsapas, C., Daly, M. J., Reitman, M. L., and Kaplan, L. M. (2013). Weight loss after gastric bypass is associated with a variant at 15q26.1. Am. J. Hum. Genet. 92, 827–834.
Hooton, H., Ängquist, L., Holst, C., Hager, J., Rousseau, F., Hansen, R. D., et al. (2012). Dietary factors impact on the association between CTSS variants and obesity related traits. PLoS One 7:e40394. doi: 10.1371/journal.pone.0040394
Hu, B., Jin, C., Zeng, X., Resch, J. M., Jedrychowski, M. P., Yang, Z., et al. (2020). γδ T cells and adipocyte IL-17RC control fat innervation and thermogenesis. Nature 578, 610–614.
Imaizumi, T., Ando, M., Nakatochi, M., Yasuda, Y., Honda, H., Kuwatsuka, Y., et al. (2018). Effect of dietary energy and polymorphisms in BRAP and GHRL on obesity and metabolic traits. Obes. Res. Clin. Pract. 12, 39–48.
Jouan, Y., Guillon, A., Gonzalez, L., Perez, Y., Boisseau, C., Ehrmann, S., et al. (2020). Phenotypical and functional alteration of unconventional T cells in severe COVID-19 patients. J Exp. Med. 217:e20200872.
Kanehisa, M., and Goto, S. (2000). KEGG: kyoto encyclopedia of genes and genomes. Nucleic Acids Res 28, 27–30.
Krinninger, P., Ensenauer, R., Ehlers, K., Rauh, K., Stoll, J., Krauss-Etschmann, S., et al. (2014). Peripheral monocytes of obese women display increased chemokine receptor expression and migration capacity. J. Clin. Endocrinol. Metab. 99, 2500–2509.
Kroll, D. S., Feldman, D. E., Biesecker, C. L., McPherson, K. L., Manza, P., Joseph, P. V., et al. (2020). Neuroimaging of Sex/Gender Differences in Obesity: a Review of Structure, Function, and Neurotransmission. Nutrients 12:1972.
Lauby-Secretan, B., Scoccianti, C., Loomis, D., Grosse, Y., Bianchini, F., and Straif, K. (2016). Body Fatness and Cancer–Viewpoint of the IARC Working Group. N. Engl. J. Med. 375, 794–798.
Lee, Y. S., Kim, J. W., Osborne, O., Oh, D. Y., Sasik, R., Schenk, S., et al. (2014). Increased adipocyte O2 consumption triggers HIF-1α, causing inflammation and insulin resistance in obesity. Cell 157, 1339–1352.
Li, Y., Woods, K., Parry-Strong, A., Anderson, R. J., Capistrano, C., Gestin, A., et al. (2020). Distinct Dysfunctional States of Circulating Innate-Like T Cells in Metabolic Disease. Front. Immunol. 11:448. doi: 10.3389/fimmu.2020.00448
Mamane, Y., Chung Chan, C., Lavallee, G., Morin, N., Xu, L. J., Huang, J., et al. (2009). The C3a anaphylatoxin receptor is a key mediator of insulin resistance and functions by modulating adipose tissue macrophage infiltration and activation. Diabetes 58, 2006–2017.
Mathur, S. K., Jain, P., Mathur, P., Punjabi, P., Agarwal, A., and Sharma, A. (2013). Transcriptomic analysis of visceral adipose from healthy and diabetic obese subjects. Indian J. Endocrinol. Metab. 17, 446–450.
Mavrevski, R., Traykov, M., Trenchev, I., and Trencheva, M. (2018). Approaches to modeling of biological experimental data with GraphPad Prism software. WSEAS Trans. Syst. Control 13, 242–247.
Munzberg, H., and Myers, M. G. Jr. (2005). Molecular and anatomical determinants of central leptin resistance. Nat. Neurosci. 8, 566–570.
Nair, S., Lee, Y. H., Rousseau, E., Tataranni, P. A., Baier, L. J., and Bogardus, C. (2005). Increased expression of inflammation-related genes in cultured preadipocytes/stromal vascular cells from obese compared with non-obese Pima Indians. Diabetologia 48, 1784–1788.
Naour, N., Rouault, C., Fellahi, S., Lavoie, M. E., Poitou, C., Keophiphath, M., et al. (2010). Cathepsins in human obesity: changes in energy balance predominantly affect cathepsin s in adipose tissue and in circulation. J. Clin. Endocrinol. Metab. 95, 1861–1868.
NCD Risk Factor Collaboration [NCD-RisC] (2017). Worldwide trends in body-mass index, underweight, overweight, and obesity from 1975 to 2016: a pooled analysis of 2416 population-based measurement studies in 128.9 million children, adolescents, and adults. Lancet 390, 2627–2642.
Newman, A. M., Liu, C. L., Green, M. R., Gentles, A. J., Feng, W., Xu, Y., et al. (2015). Robust enumeration of cell subsets from tissue expression profiles. Nat. Methods 12, 453–457.
Ng, H. F., Chin, K. F., Chan, K. G., and Ngeow, Y. F. (2015). The mRNA expression of soluble urokinase plasminogen activator surface receptor in human adipose tissue is positively correlated with body mass index. Genome 58, 315–321.
Pei, Y. F., Zhang, L., Liu, Y., Li, J., Shen, H., Liu, Y. Z., et al. (2014). Meta-analysis of genome-wide association data identifies novel susceptibility loci for obesity. Hum. Mol. Genet. 23, 820–830.
Petrus, P., Mejhert, N., Corrales, P., Lecoutre, S., Li, Q., Maldonado, E., et al. (2018). Transforming Growth Factor-β3 Regulates Adipocyte Number in Subcutaneous White Adipose Tissue. Cell Rep. 25, 551–560.e5.
Piñero, J., Bravo, À, Queralt-Rosinach, N., Deu-Pons, J., Centeno, E., García-García, J., et al. (2016). DisGeNET: a comprehensive platform integrating information on human disease-associated genes and variants. Nucleic Acids Res. 45, D833–D839.
Poitou, C., Mosbah, H., and Clément, K. (2020). MECHANISMS IN ENDOCRINOLOGY: update on treatments for patients with genetic obesity. Eur. J. Endocrinol. 183, R149–R166.
Rogero, M. M., and Calder, P. C. (2018). Obesity, inflammation, toll-like receptor 4 and fatty acids. Nutrients 10:432.
Sakharkar, M. K., Kashmir Singh, S. K., Rajamanickam, K., Mohamed Essa, M., Yang, J., and Chidambaram, S. B. (2019). A systems biology approach towards the identification of candidate therapeutic genes and potential biomarkers for Parkinson’s disease. PLoS One 14:e0220995. doi: 10.1371/journal.pone.0220995
Shi, B., Feng, D., Sagnelli, M., Sun, X., Wang, X., Li, D., et al. (2020). Fructose levels are elevated in women with polycystic ovary syndrome with obesity and hyperinsulinemia. Hum. Reprod. 35, 187–194.
Shu, T., Song, X., Cui, X., Ge, W., Gao, R., and Wang, J. (2018). Fc Gamma Receptor IIb Expressed in Hepatocytes Promotes Lipid Accumulation and Gluconeogenesis. Int. J. Mol. Sci. 19:2932.
Stenvers, D. J., Jongejan, A., Atiqi, S., Vreijling, J. P., Limonard, E. J., Endert, E., et al. (2019). Diurnal rhythms in the white adipose tissue transcriptome are disturbed in obese individuals with type 2 diabetes compared with lean control individuals. Diabetologia 62, 704–716.
Subramanian, A., Tamayo, P., Mootha, V. K., Mukherjee, S., Ebert, B. L., Gillette, M. A., et al. (2005). Gene set enrichment analysis: a knowledge-based approach for interpreting genome-wide expression profiles. Proc. Natl. Acad. Sci. 102, 15545–15550.
Sung, H., Siegel, R. L., Torre, L. A., Stuttard, J. P., Islami, F., Fedewa, S. A., et al. (2019). Global patterns in excess body weight and the associated cancer burden. CA Cancer J. Clin. 69, 88–112.
Szklarczyk, D., Morris, J. H., Cook, H., Kuhn, M., Wyder, S., Simonovic, M., et al. (2016). The STRING database in 2017: quality-controlled protein–protein association networks, made broadly accessible. Nucleic Acids Res. 45, D362–D368.
Taleb, S., Lacasa, D., Bastard, J. P., Poitou, C., Cancello, R., Pelloux, V., et al. (2005). Cathepsin S, a novel biomarker of adiposity: relevance to atherogenesis. FASEB J. 19, 1540–1542.
Wan, Y., Zhang, X., Leng, H., Yin, W., Zeng, W., and Zhang, C. (2020). Identifying hub genes of papillary thyroid carcinoma in the TCGA and GEO database using bioinformatics analysis. PeerJ 8:e9120.
WHO (2018). Obesity And Overweight Fact Sheet. Available online at: https://www.who.int/news-room/fact-sheets/detail/obesity-and-overweight. (accessed on 5 Mar 2020)
Woetzel, J., Dobbs, R., Manyika, J., Sawers, C., Child, P., and Thompson, F. (2014). Overcoming Obesity: An Initial Economic Analysis. Jakarta, Indonesia: McKinsey Global Institute.
Wolfe, B. M., Kvach, E., and Eckel, R. H. (2016). Treatment of Obesity: weight Loss and Bariatric Surgery. Circ. Res. 118, 1844–1855.
Yang, C., Kong, A. P. S., Cai, Z., and Chung, A. C. K. (2017). Persistent Organic Pollutants as Risk Factors for Obesity and Diabetes. Curr. Diab. Rep. 17:132.
Yanovski, S. Z., and Yanovski, J. A. (2014). Long-term drug treatment for obesity: a systematic and clinical review. JAMA 311, 74–86.
Yu, G., Wang, L. G., Han, Y., and He, Q. Y. (2012). clusterProfiler: an R package for comparing biological themes among gene clusters. OMICS 16, 284–287.
Zhang, Y., Zheng, Y., Fu, Y., and Wang, C. (2019). Identification of biomarkers, pathways and potential therapeutic agents for white adipocyte insulin resistance using bioinformatics analysis. Adipocyte 8, 318–329.
Zhao, B., Wang, D., Liu, Y., Zhang, X., Wan, Z., Wang, J., et al. (2020). Six-Gene Signature Associated with Immune Cells in the Progression of Atherosclerosis Discovered by Comprehensive Bioinformatics Analyses. Cardiovasc. Ther. 2020:1230513.
Keywords: adipose tissue, inflammation, bioinformatics, obesity, mechanism
Citation: Lu Z, Meng L, Sun Z, Shi X, Shao W, Zheng Y, Yao X and Song J (2021) Differentially Expressed Genes and Enriched Signaling Pathways in the Adipose Tissue of Obese People. Front. Genet. 12:620740. doi: 10.3389/fgene.2021.620740
Received: 26 October 2020; Accepted: 15 April 2021;
Published: 19 May 2021.
Edited by:
Yi Zhao, Institute of Computing Technology, Chinese Academy of Sciences (CAS), ChinaReviewed by:
Sherry Bhalla, Mount Sinai Hospital, United StatesZhi-Ping Liu, Shandong University, China
Copyright © 2021 Lu, Meng, Sun, Shi, Shao, Zheng, Yao and Song. This is an open-access article distributed under the terms of the Creative Commons Attribution License (CC BY). The use, distribution or reproduction in other forums is permitted, provided the original author(s) and the copyright owner(s) are credited and that the original publication in this journal is cited, in accordance with accepted academic practice. No use, distribution or reproduction is permitted which does not comply with these terms.
*Correspondence: Jinghai Song, amhhaXNvbmcyMDAzQDE2My5jb20=; Xinglei Yao, eGx5YW9AcmNlZXMuYWMuY24=