 Yongkang Kim1†
 Sungyoung Lee
 Jin-Young Jang
 Taesung Park
- 1Department of Statistics, Seoul National University, Seoul, South Korea
- 2Center for Precision Medicine, Seoul National University Hospital, Seoul, South Korea
- 3Department of Genomic Medicine, Seoul National University Hospital, Seoul, South Korea
- 4Department of Surgery and Cancer Research Institute, Seoul National University College of Medicine, Seoul, South Korea
- 5Department of Mathematics and Statistics, Sejong University, Seoul, South Korea
- 6Interdisciplinary Program in Bioinformatics, Seoul National University, Seoul, South Korea
In the “personalized medicine” era, one of the most difficult problems is identification of combined markers from different omics platforms. Many methods have been developed to identify candidate markers for each type of omics data, but few methods facilitate the identification of multiple markers on multi-omics platforms. microRNAs (miRNAs) is well known to affect only indirectly phenotypes by regulating mRNA expression and/or protein translation. To take into account this knowledge into practice, we suggest a miRNA-mRNA integration model for survival time analysis, called mimi-surv, which accounts for the biological relationship, to identify such integrated markers more efficiently. Through simulation studies, we found that the statistical power of mimi-surv be better than other models. Application to real datasets from Seoul National University Hospital and The Cancer Genome Atlas demonstrated that mimi-surv successfully identified miRNA-mRNA integrations sets associated with progression-free survival of pancreatic ductal adenocarcinoma (PDAC) patients. Only mimi-surv found miR-96, a previously unidentified PDAC-related miRNA in these two real datasets. Furthermore, mimi-surv was shown to identify more PDAC related miRNAs than other methods because it used the known structure for miRNA-mRNA regularization. An implementation of mimi-surv is available at http://statgen.snu.ac.kr/software/mimi-surv.
Introduction
MicroRNAs (miRNAs) are small, non-coding RNAs that function to regulate target messenger RNAs (mRNAs), based on sequence complementarity. It is well known that miRNAs affect nearly all developmental and pathological processes in animals, particularly in cell development, and many cancer types are affected by miRNA regulation by downregulating their target mRNAs (Ha and Kim, 2014).
Using a well-known regulation mechanism, many studies have focused on finding the target mRNAs. The biological context of regulation mechanism between miRNA and target mRNA can be easily explained by showing significant negative correlation between them and investigating their relationship with the phenotypes (Enerly et al., 2011; Xu et al., 2019). For instance, hierarchical clustering on miRNA expression profiles found that the expression levels of the tumor suppressor gene, TP53 are associated with specific clusters (Enerly et al., 2011). When the number of target genes is small, this approach is effective. However, it is more difficult to identify novel combinations of miRNA and its target mRNAs that are concurrently associated to the phenotype.
To perform an integrated analysis of miRNA and its target mRNAs, two-step analysis has been commonly used in many studies. The first step chooses miRNAs associated with specific phenotypes. The second step further investigates expression levels of known target mRNAs that are negatively correlated with each miRNA (Enerly et al., 2011; Yonemori et al., 2017). However, this approach only focuses on the relationship between phenotypes and miRNAs without providing information about how miRNAs and their inhibited mRNAs affect observed phenotype together.
On the other hand, a hierarchical structured component analysis of miRNA-mRNA integration (HisCoM-mimi) has been recently proposed to investigate how miRNAs indirectly affect the phenotype with biological relationships between the miRNAs and their target mRNAs [5; 6]. HisCoM-mimi is a component-based method that models biological relationships as hierarchically structured “components,” to efficiently identify miRNA-mRNA integration sets. HisCoM-mimi has an advantage of handling many types of phenotypes from an exponential family distribution under the framework of a generalized linear model. While its application to cancerous vs. normal tissues successfully identified more biologically plausible and intuitive interpretations than other methods (Kim et al., 2018), it cannot be applicable to the survival analysis which is one of prominent interest among the cancer studies.
In this study, we propose a hierarchical structured component analysis of miRNA-mRNA integration to survival phenotype, called mimi-surv using a Cox Proportional Hazard (Cox-PH) model (Cox, 1972; Kim, 2018; Kim et al., 2018). Like HisCoM-mimi, mimi-surv is also a component-based analysis, such as pathway models we developed for rare variant pathway analysis (Lee et al., 2016, 2019). In this respect, the proposed model introduces a latent variable for each miRNA and its target mRNAs as a component and fits one augmented model including all latent variables to determine the associations with the survival phenotype.
We applied the proposed approach, mimi-surv, to two real datasets from pancreatic ductal adenocarcinoma (PDAC) patients. It is noted that PDAC is one of the most lethal gastrointestinal malignancies. Despite improvements in perioperative outcomes, PDAC has a poor prognosis, with a 5-year survival rate of only 6%, worldwide (Greither et al., 2010). Because most patients are diagnosed in the advanced stages, and effective systemic therapies are lacking. Consequently, many researchers have focused on developing novel prognostic markers of PDAC. For example, several studies have identified cell-free miRNAs as prognostic markers of PDAC among which high expression of miR-21 was shown to have a significant effect on overall survival time (Frampton et al., 2015). We considered two real PDAC datasets; one is a microarray-based dataset from PDAC patients from Seoul National University Hospital (SNUH), and the other is high-throughput sequencing data, obtained from The Cancer Genome Atlas (TCGA). From those datasets, we tried to find prognostic factors for survival after surgery of PDAC by survival analysis on integrated miRNA-mRNA sets, using mimi-surv.
In spite of that some prognostic miRNAs have been identified, their precise roles in the progression of PDAC have not been easy to interpret due to absence of overall grasp of vast network of miRNA-mRNA interaction. In this article, we demonstrated how well our hierarchical component-based approach can embrace such a biological concept. Moreover, the proposed mimi-surv was compared with many other survival analysis methods throughout the simulation studies.
Materials and Methods
The Mimi-Surv Model
Figure 1 shows the schematic plot for mimi-surv model. For survival data analysis, the Cox-PH model is used (Cox, 1972). miRNA-mRNA integration set contains the miRNA, mRNA affected by the miRNA, and miRNA integration latent variable. The miRNA-mRNA integration set shows that the miRNA’s direct and indirect effects on the phenotype are coming from target mRNAs. Each miRNA-mRNA integration set consists of one miRNA (zij), and mRNAs (xij1, xij2, …, xijGj) which were regulated by the miRNA. miRNA-mRNA integration set j is summarized by the latent variable fij which is a linear combination of zij and xij1, xij2, …, xijGj. Thus, the effect of miRNA-mRNA integration set j on the hazard rate is computed by βj. Detailed fitting approaches for mimi-surv are described as follows.
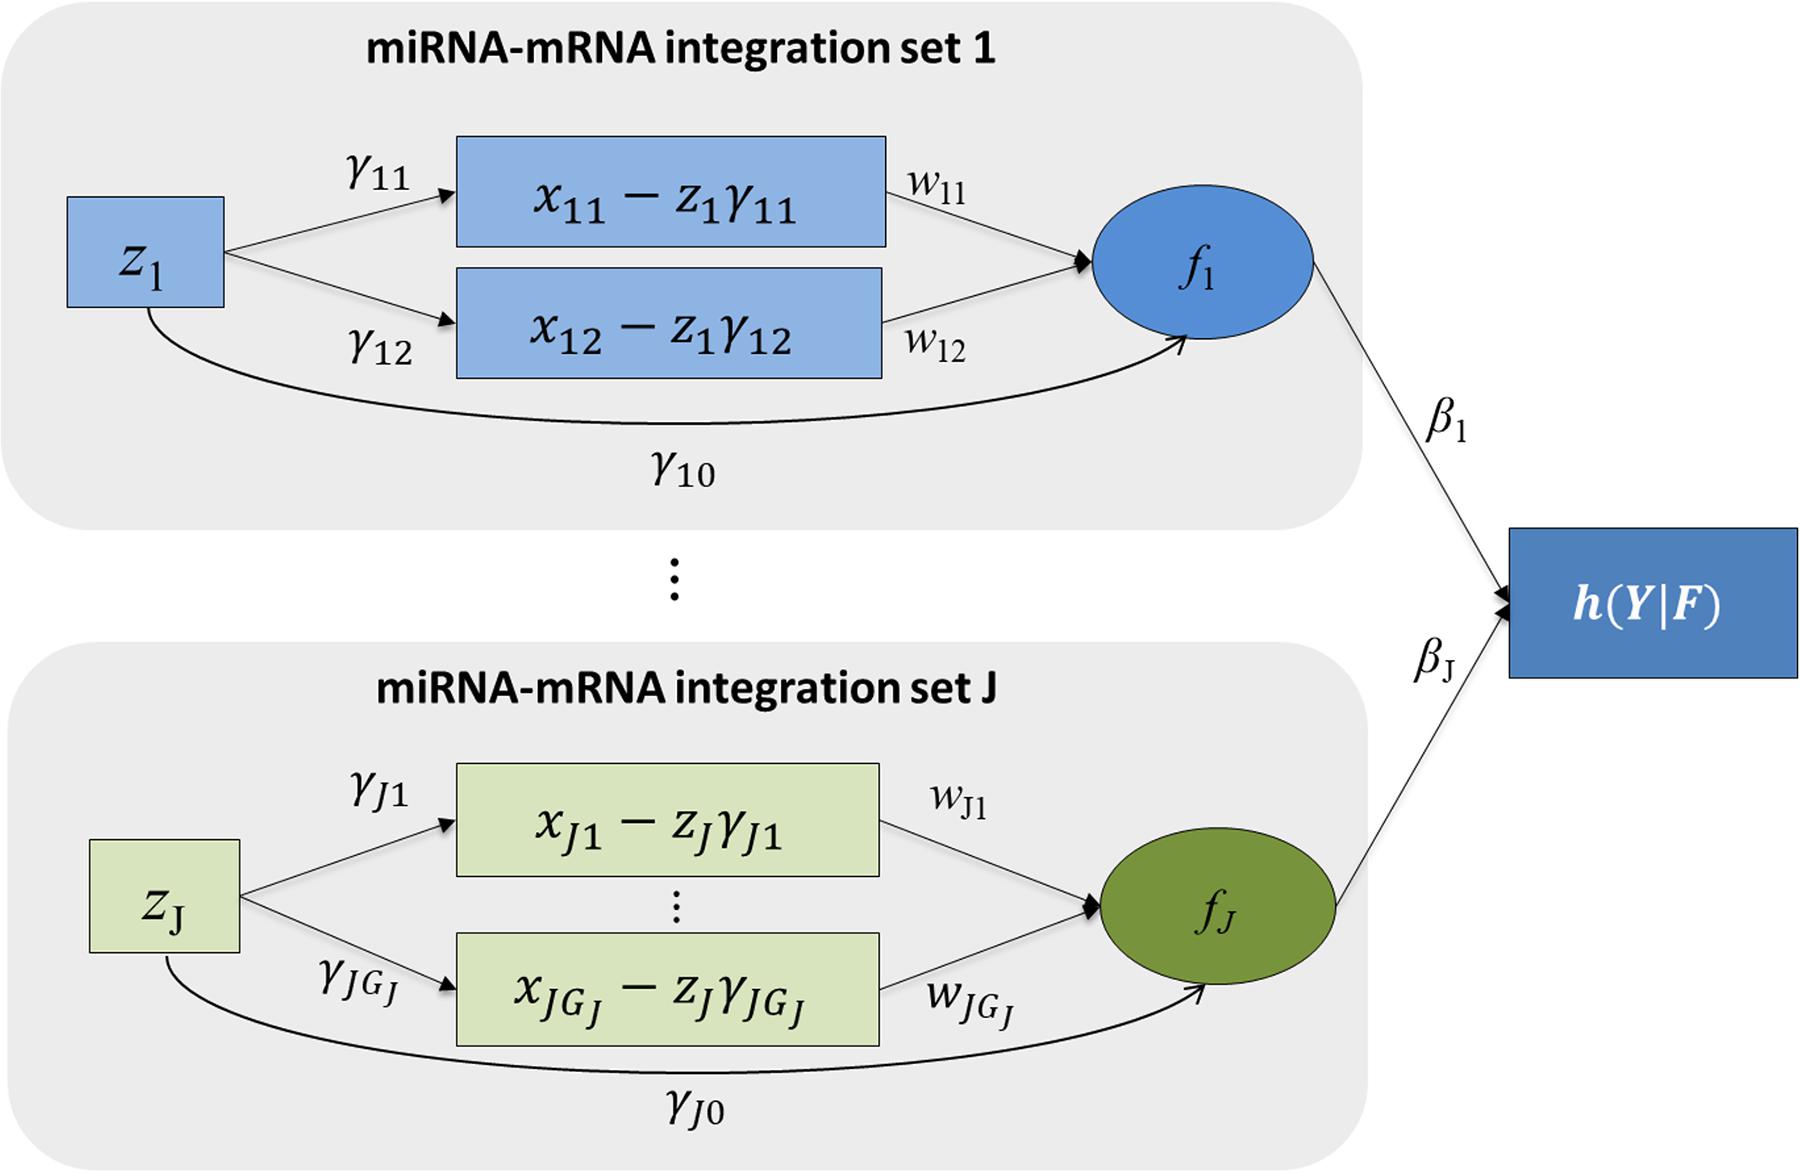
Figure 1. Schematic diagram of mimi-surv model. Rectangles and circles indicate observed and latent variables, respectively. Arrows indicate conceptualized directions of effects between the variables. Each miRNA-mRNA integration set consists of one miRNA and its target mRNAs. Each miRNA-mRNA integration set j is summarized by the latent variable fj which is linear combination of zj and its adjusted mRNA expressions.
Adjusting mRNA Expression by miRNA Regulation Information
The mimi-surv model consists of three parts. First, the miRNA-mRNA part estimates effect of miRNA on target mRNAs. Second, the miRNA integration latent part models overall effect of each miRNA. Finally, the phenotype-latent part associates all latent variables with the target phenotype. In the miRNA-mRNA part, a simple linear combination relationship is constructed between miRNA and target mRNAs, as shown in the following Equation 1:
where xijk is the ith individual’s mRNA expression of the kth gene, which is inhibited by jth miRNA, zij is the ith individual’s jth miRNA expression, γjk is the inhibition coefficient for the jth miRNA for the kth gene, and Gj is the number of inhibited mRNAs by the jth miRNA. By estimating the miRNA inhibition coefficients γjk, the kth gene’s mRNA expression after adjusting the inhibition effect of the jth miRNA can be obtained.
Latent Structures
The proposed mimi-surv models an aggregated effect of both miRNA and mRNA as a latent variable fij. As defined in Equation 2, the latent variable fij represents the global effect of the miRNA’s activity, as measured by a linear combination of both the inhibition effects (wjk) of its target mRNA(s) expression and the direct effect (γj0) of the miRNA expression value.
The latent variables are finally associated to the target phenotype using a Cox-PH model (Cox, 1972) as shown in Equation 3, under the assumption that the hazard rate is proportional to the risk factors over time.
where yi denotes the survival time, Y denotes the vector of yi, and h(yi|F) denotes the hazard function of the ith sample. In addition, h0(Y) is a baseline hazard function, and βj represents the effect of fij on the hazard rate, as a risk factor. Then, the partial likelihood function, Lp, is defined as follows:
Model Fitting
In model fitting, we estimate the parameters of mimi-surv by adopting the algorithm of HisCoM-mimi which is based on the alternating least squares (ALS) algorithm for the penalized log-likelihood function, with penalty parameters (Kim et al., 2018). In the mimi-surv model, the objective function to be maximized is expressed as follows:
Here, the first sum consists of the partial likelihood from a Cox-PH model and the remaining term consists of two penalization parts with tuning parameters of λm and λmm. These two λs are so-called the tuning parameters of both the miRNA-mRNA pairs and the integrated latent components to adjust the strength of the penalty function (Cox, 1972). Pλmm and Pλm denote penalty functions for w and β, respectively. Any regularization function can be used. For example, for β it can be defined as for ridge, for lasso, and for Elastic-Net.
We used the ALS algorithm to maximize the objective function by the two-step algorithm. The first part of the ALS algorithm is maximizing the objective function, ϕ, with the conditioning set of fqj, and finding solutions for a set of βj. The second part of algorithm is, maximizing the objective function, with a conditioning set of βj, as calculated in the previous step, and updating the set of f values. Then these two steps are iterated until the solution is converged.
In the mimi-surv model, βj indicates the effect size of jth miRNA-mRNA integration set and wjk indicates the effect size of kth mRNA inhibited by jth miRNA. In this study, we find the significant integrated effects of miRNA and its inhibited mRNAs, and we used mimi-surv to test βj, which summarized mRNA-miRNA integration set.
We performed a simple permutation scheme to test the statistical significance of βj and computed p-values and their q-values for the multiple testing adjustment (Ma et al., 2014). The number of permutations was set to 1,000. However, it can be increased easily to improve the accuracy of p-values. If one of the penalty functions is pre-specified, mimi-surv provides the corresponding p-values. However, if the choice of a penalty function is not given, mimi-surv can use a simple approach that picks the maximum estimate from multiple penalties, namely maxT. Through permutations, the null distribution of maxT is generated from which the p-value can estimated.
Comparative Models
We compared the performance of mimi-surv with various types of Cox-PH models, including a single miRNA Cox-PH model (single) and multiple penalized Cox-PH regression models with different penalties such as ridge, lasso, Elastic-Net (EN), and group lasso (grplasso) (Lee and Silvapulle, 1988; Tibshirani, 1996; Zou and Hastie, 2005; Meier et al., 2008)]. The objective function for multiple penalized Cox-PH model is given as follows:
where Pθ(δj) denotes regularization function, which can be defined as for ridge, for lasso, and for EN. Here θ is the tuning parameter to adjust the strength of the penalty function.
For a grplasso Cox-PH model (Meier et al., 2008), using the group information from the miRNAs and mRNAs, the following regression model is given:
To find the optimal tuning parameter θ, we performed 10-fold cross-validation and then determined the value of θ, which minimizes the value of the objected function for the validation set.
SNUH and TCGA Datasets
The SNUH dataset consists of 95 PDAC patients in which the average of age was 65.2 years with a standard deviation 9.4 years. There were 46 male and 49 female patients. The median survival time after surgery was 795 days, which is indicated by a red vertical line in a Kaplan-Meier plot as shown in Figure 2A.
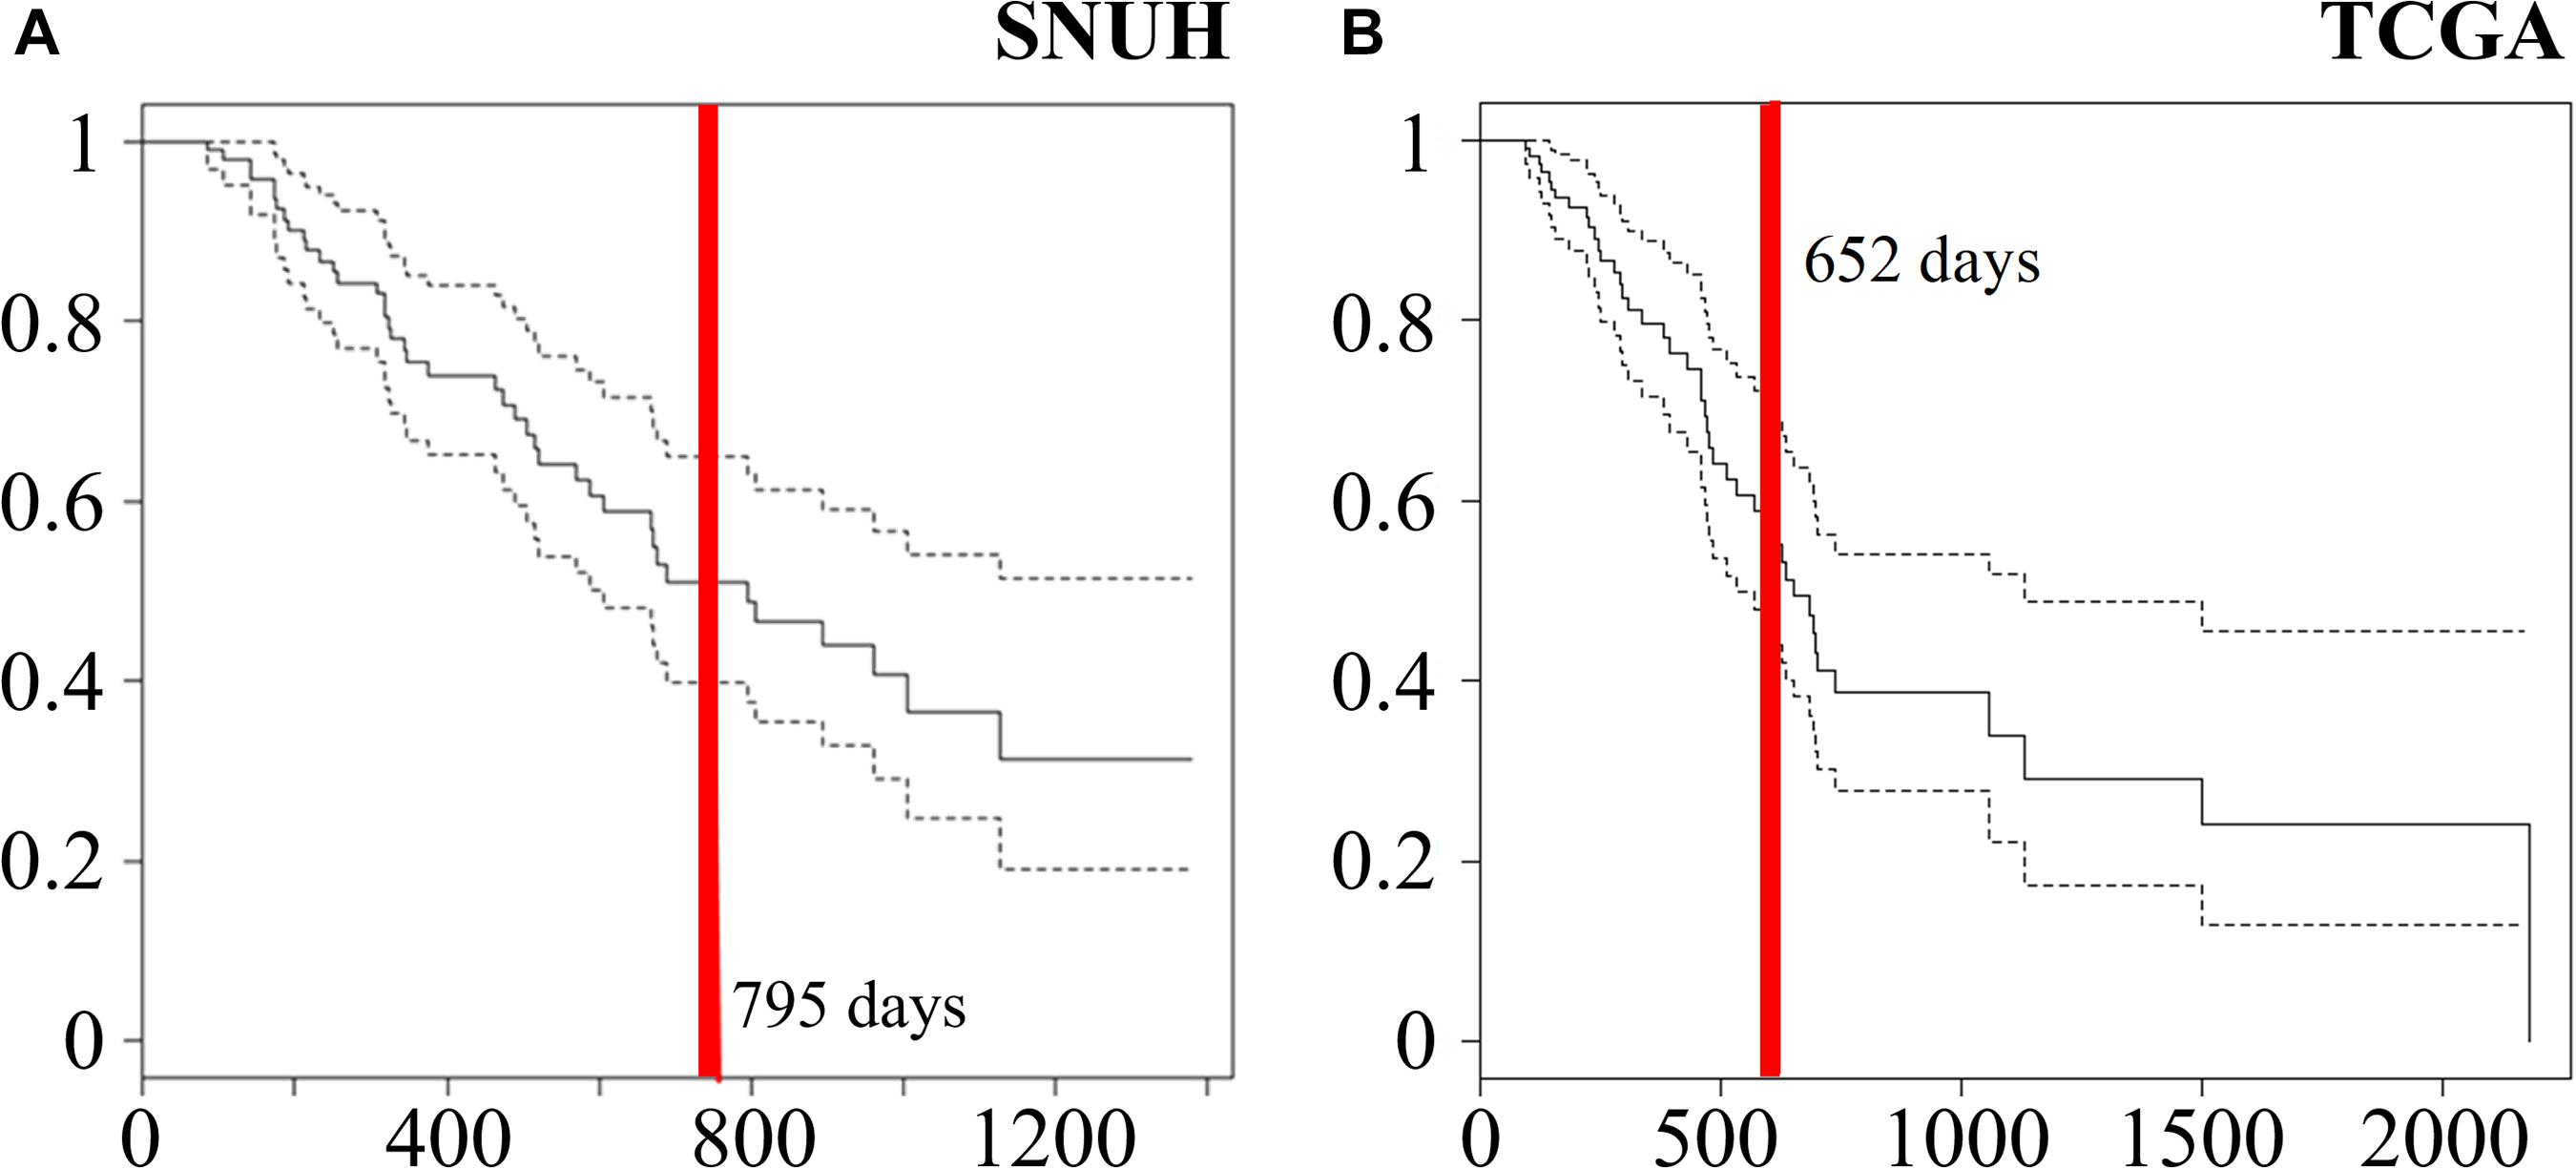
Figure 2. Kaplan-Meier curves of (A) 95 samples of SNUH dataset and (B) 112 samples of TCGA dataset. Red vertical lines indicate median survival times (795 and 652 days SNUH and TCGA, respectively).
mRNA expression data was produced by the Human Gene 1.0 ST array (Affymetrix, Santa Clara, CA, United States). For background correction, the expression values were processed by Robust Multi-array Averaging (RMA), using the Affymetrix console, followed by quantile normalization. For the same patient, miRNA expression was obtained from the GeneChip miRNA 3.0 array (Affymetrix, Santa Clara, CA, United States). miRNA expression values were normalized by RMA, and only the human-derived miRNA targets were selected. The normalization of the background correction of the jth human probe of the ith sample (xij) was done using the other species’ probes as background intensities as shown in Equation 8.
On the other hand, TCGA PDAC dataset were downloaded from the Genomic Data Commons (GDC) data portal of the U.S. National Cancer Institute1 (Cancer Genome Atlas Research Network, Weinstein et al., 2013). To normalize mRNA-seq and miRNA-seq datasets, Fragments Per Kilobase Million (FPKM) was measured for each read count. For miRNA expression profiling, Illumina HiSeq (Illumina Inc., San Diego, CA, United States) was used. We collected 185 TCGA PDAC data sample for analysis. The read counts were log-transformed after adding a pseudo count of 0.5. In survival analysis, we excluded 25 non-PDAC samples and 47 PDAC samples whose follow-up time was less than 3 months because the cause of their deaths is not clear. After excluding these cases, we have 112 samples that consist of 48 males and 64 females. The mean age was 63.9 years with a standard deviation 11.1 years. Furthermore, the median survival time was 585 days as indicated by a red vertical line in a Kaplan-Meier plot in Figure 2B.
Identification of miRNA-mRNA Integration Set
For miRNA-mRNA integration analysis, we generated miRNA-mRNA integration sets which collected miRNAs and their target mRNAs satisfying two conditions as follows: (i) Reported target mRNAs by sequence-based target prediction results from TargetScan 7.1 (Agarwal et al., 2015) and (ii) significant negative correlation coefficients between miRNAs and mRNAs from SNUH dataset.
From the miRNA-mRNA pairs from TargetScan using SNUH dataset, we calculated Pearson’s correlation and performed one-sided t-test to select the pairs with significant (p< 0.05) negative correlation. For those using TCGA dataset that contains many zero read counts, we first filtered out spurious pairs of miRNA-mRNA by performing one-sided t-test to test whether the average mRNA expression of the samples with zero miRNA read count was larger than that of the samples with non-zero miRNA read counts (p < 0.05). For those significant pairs, we then tested whether a correlation between target mRNAs and miRNAs was less than 0, using the samples with nonzero miRNA read counts.
Simulation Study and Real Data Analysis
To compare which method had a better power to discover the true signal miRNA-mRNA pair, we performed simulation studies to compute type I errors and power of mimi-surv and the compared methods, using the miRNA expression values of the SNUH PDAC dataset that consists of 64 miRNAs and 6,226 significant miRNA-mRNA pairs. Among those miRNA-mRNA pairs, we selected two, five and ten causal miRNAs to simulate phenotypes. Table 1 lists those miRNAs and their regulated mRNAs. To generate a simulation dataset, we used the same simulation settings as we did for our previous HisCoM-mimi analysis (Kim et al., 2018).
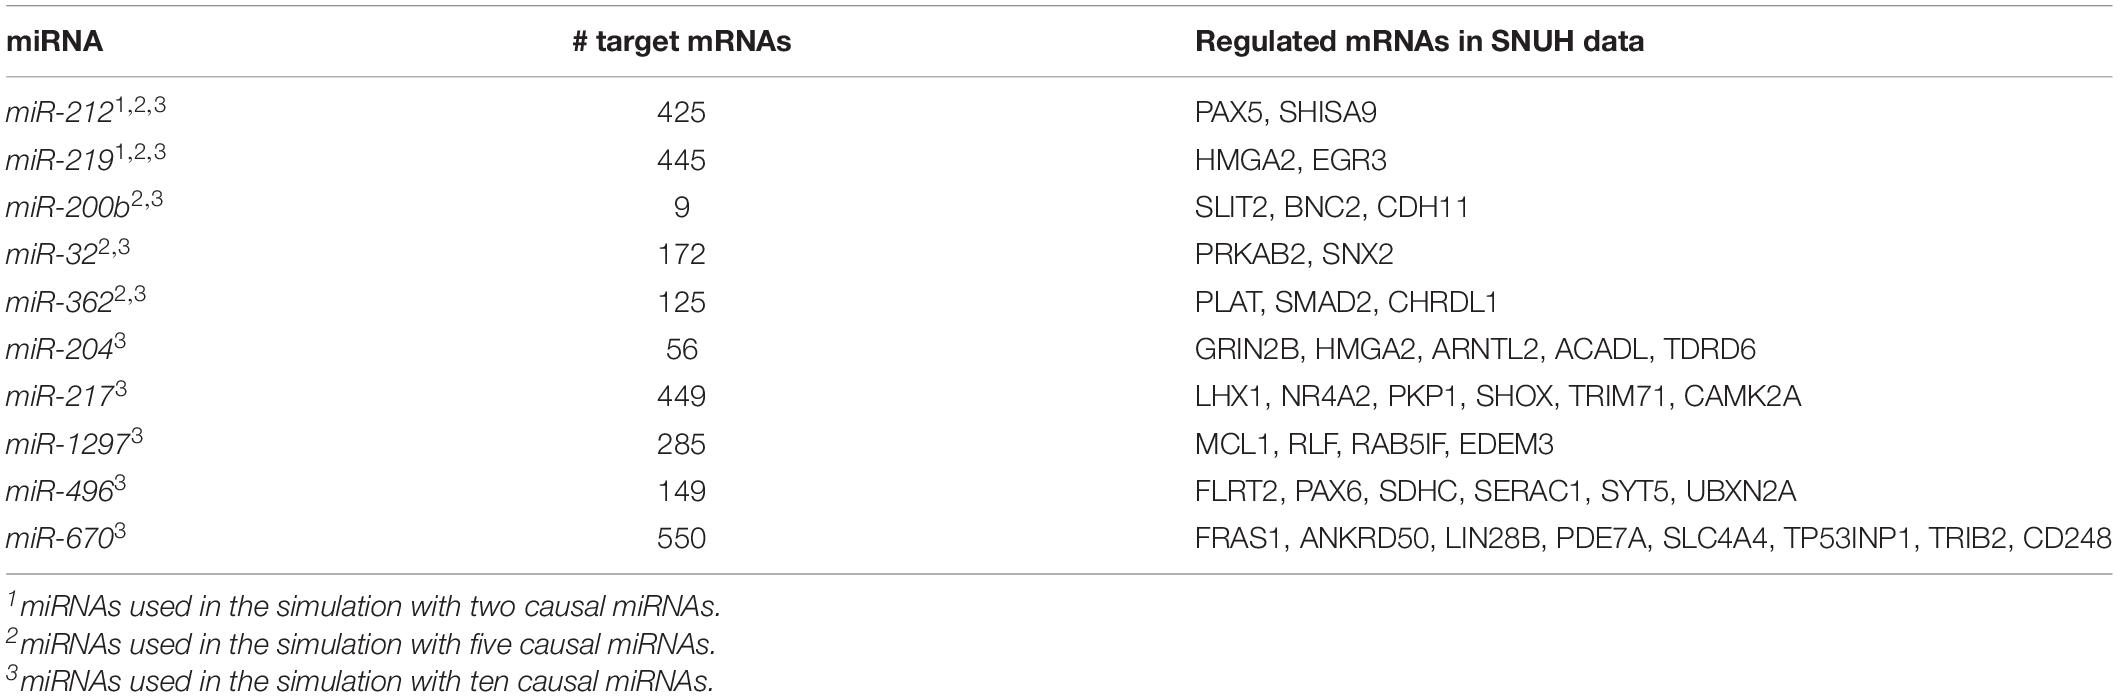
Table 1. List of causal miRNAs and the numbers of target mRNAs used in simulation.
We assumed a true model for generating simulated phenotype, as given in Equation 9. We considered that all causal miRNA-mRNA sets, having an effect size of β. Also, we considered regulated target mRNAs of the miRNA-mRNA sets, having the common effect size, w11 = w1p, and their regulating miRNA having the effect size γ10. We then considered three scenarios with different number of causal miRNAs (2, 5, and 10). For the scenario with two causal miRNAs, miR-212 and miR-219 were used to generate phenotypes. In the scenario with five causal miRNAs, miR-200, miR-32, miR-362 were considered, in addition to the aforementioned two miRNAs. Lastly, five miRNAs (miR-204, miR-217, miR-1297, miR-496, miR-670) were additionally used in the scenario with ten causal miRNAs (see Table 1 and section “Results”). The statistical powers were computed as the proportion of replicates whose empirical p-values of causal miRNAs are nonzero and significant.
In the real data analysis, to deal with the multiple testing problem, we used Benjamini-Hochberg procedure to calculate False Discovery Rate (FDR) and calculated the q-value. The threshold of q-value was set to 0.1.
Results
miRNA-mRNA Pairs Extraction
We first extracted miRNA-mRNA pairs using the SNUH and TCGA datasets. For the SNUH dataset, TargetScan provided 370,075 pairs of miRNA-mRNA for 503 unique miRNAs. Our filtering strategy (see Methods) narrowed down the initial 370,075 set of pairs to 6,226 pairs that resulted in 54 unique miRNAs. For the TCGA dataset, TargetScan provided 51,014 pairs of miRNA-mRNA for 69 unique miRNAs. Unlike SNUH microarray dataset, we found that only 133 pairs of miRNA-mRNA from nine unique miRNAs were left when Pearson correlation tests were used. As noted in the Methods, the two-side filtering step resulted in 1,456 pairs with 23 unique miRNAs having at least one significant mRNA.
While two datasets showed generally concordant patterns of miRNA-mRNA selection as shown in Table 2, the number of mRNAs in each integration set has dataset-specific patterns. While miR-211 integration set has the greatest number of overlapped mRNAs when combining those of SNUH and TCGA, the greatest number from each of SNUH and TCGA was miR-141 and miR-133b, respectively.
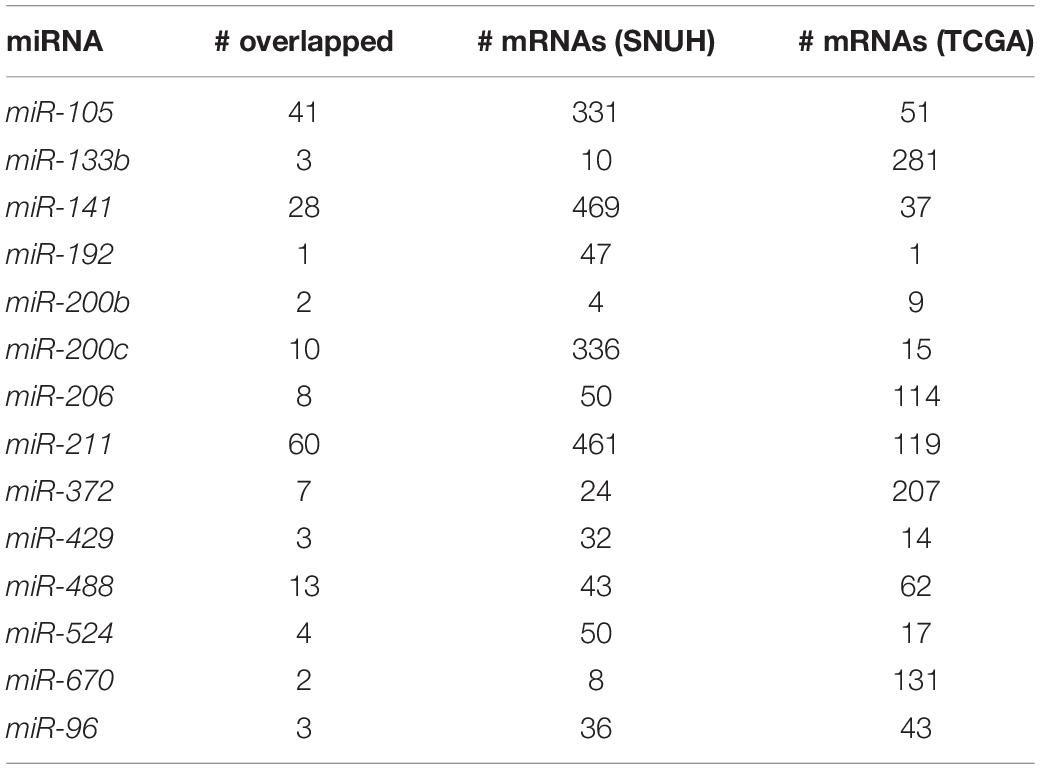
Table 2. The number of mRNAs included in the miRNA-mRNA integration set.
Simulation Results
The simulation was conducted using the SNUH dataset with 54 miRNAs and their 6,226 miRNA-mRNA pairs, with the following parameters: two censoring fractions (δ = 0.15 and 0.3), three miRNA effect sizes (γ = 0.2, 0.3, and 0.4), three mRNA effect sizes (w = 0.5, 0.6, and 0.7). Effect of miRNA-mRNA integration set β was fixed to 1 for simplicity. The significance level α was set to 0.05. First, we estimated the type I error of each method by setting all parameters to 0 with the censoring fraction as δ. As shown in Figure 3, type I errors were controlled at α = 0.05 in all models, except grplasso (Meier et al., 2008) model which showed slightly inflated type I errors. In addition, mimi-surv models generally showed slightly smaller standard deviations of type I errors than the compared methods (±0.009∼0.01 for mimi-surv,±0.013∼0.014 for the other models). Note that the type I errors of both mimi-surv and the compared methods were not affected by the zero proportion of miRNA expression (zero proportion 10, 30, and 50%). In addition, we also checked an effect of penalty selection in the simulation. Since the selection of optimal penalty is challenging in Cox-PH regression (Benner et al., 2010; Ojeda et al., 2016), we applied a simple strategy that combines the three penalties by selecting the maximum of the estimates from three different penalties (lasso, ridge, and EN), namely maxT. Simulation results showed that mimi-surv with the proposed maxT approach successfully controlled type I errors with significance level of 0.05 (0.049 ± 0.014 for mimi-surv), as shown in Figure 3.
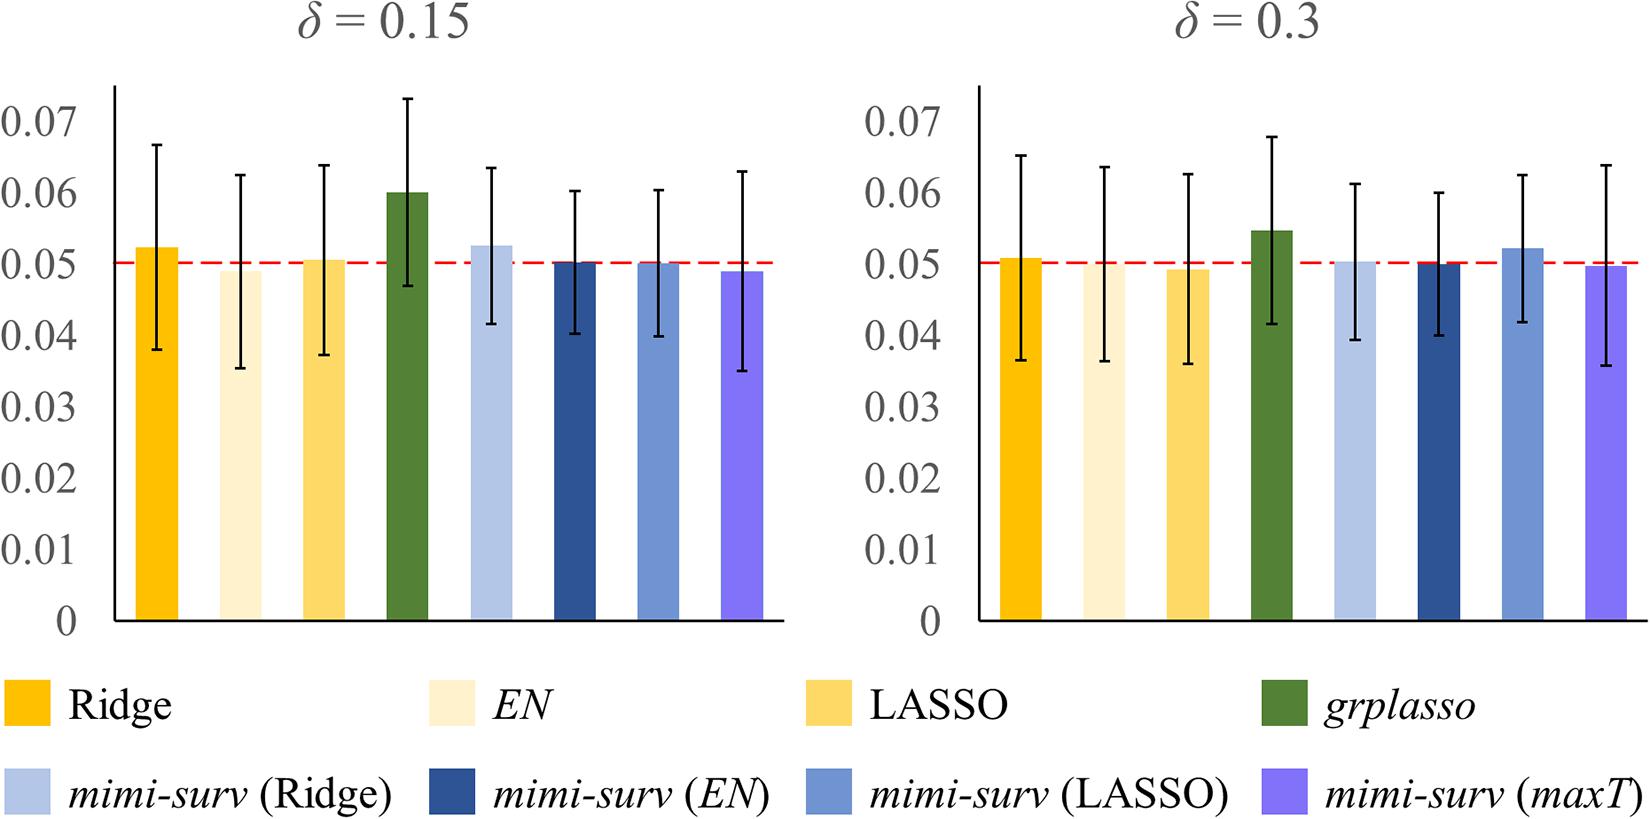
Figure 3. Result of type I error evaluation. Bars indicate estimated type I error rate with given parameters (censoring fraction δ). Note that the type I errors were evaluated by fixing all parameters to 0.
Second, we assessed the statistical powers of seven methods (mimi-surv with three different penalties, grplasso, lasso, ridge, and EN). Here, we generated 200 replicates of simulated phenotypes to assess the power. When variable selection methods (lasso, EN, grplasso, mimi-surv with lasso, and EN penalties) produced zero coefficients, their effects were regarded as non-significant. Figure 4 depicts statistical powers of the compared methods with different miRNA effect sizes (0.2, 0.3, and 0.4) and two censoring fractions (0.15 and 0.3). Note that other non-causal miRNAs or mRNAs were also included to the analysis, but they actually did not contribute to the phenotypes at all. In this case, mimi-surv with ridge penalty and grplasso showed the first and second largest powers, regardless of the miRNA effect sizes. Lasso, EN, mimi-surv with EN and lasso penalties had smaller power than the other methods. While the powers generally increased with the miRNA effect size, their ranks vary widely (Figure 4). Higher censoring rate yielded generally lower power. Note that those tendencies were maintained even if γ, w, or the number of connected mRNAs were changed.
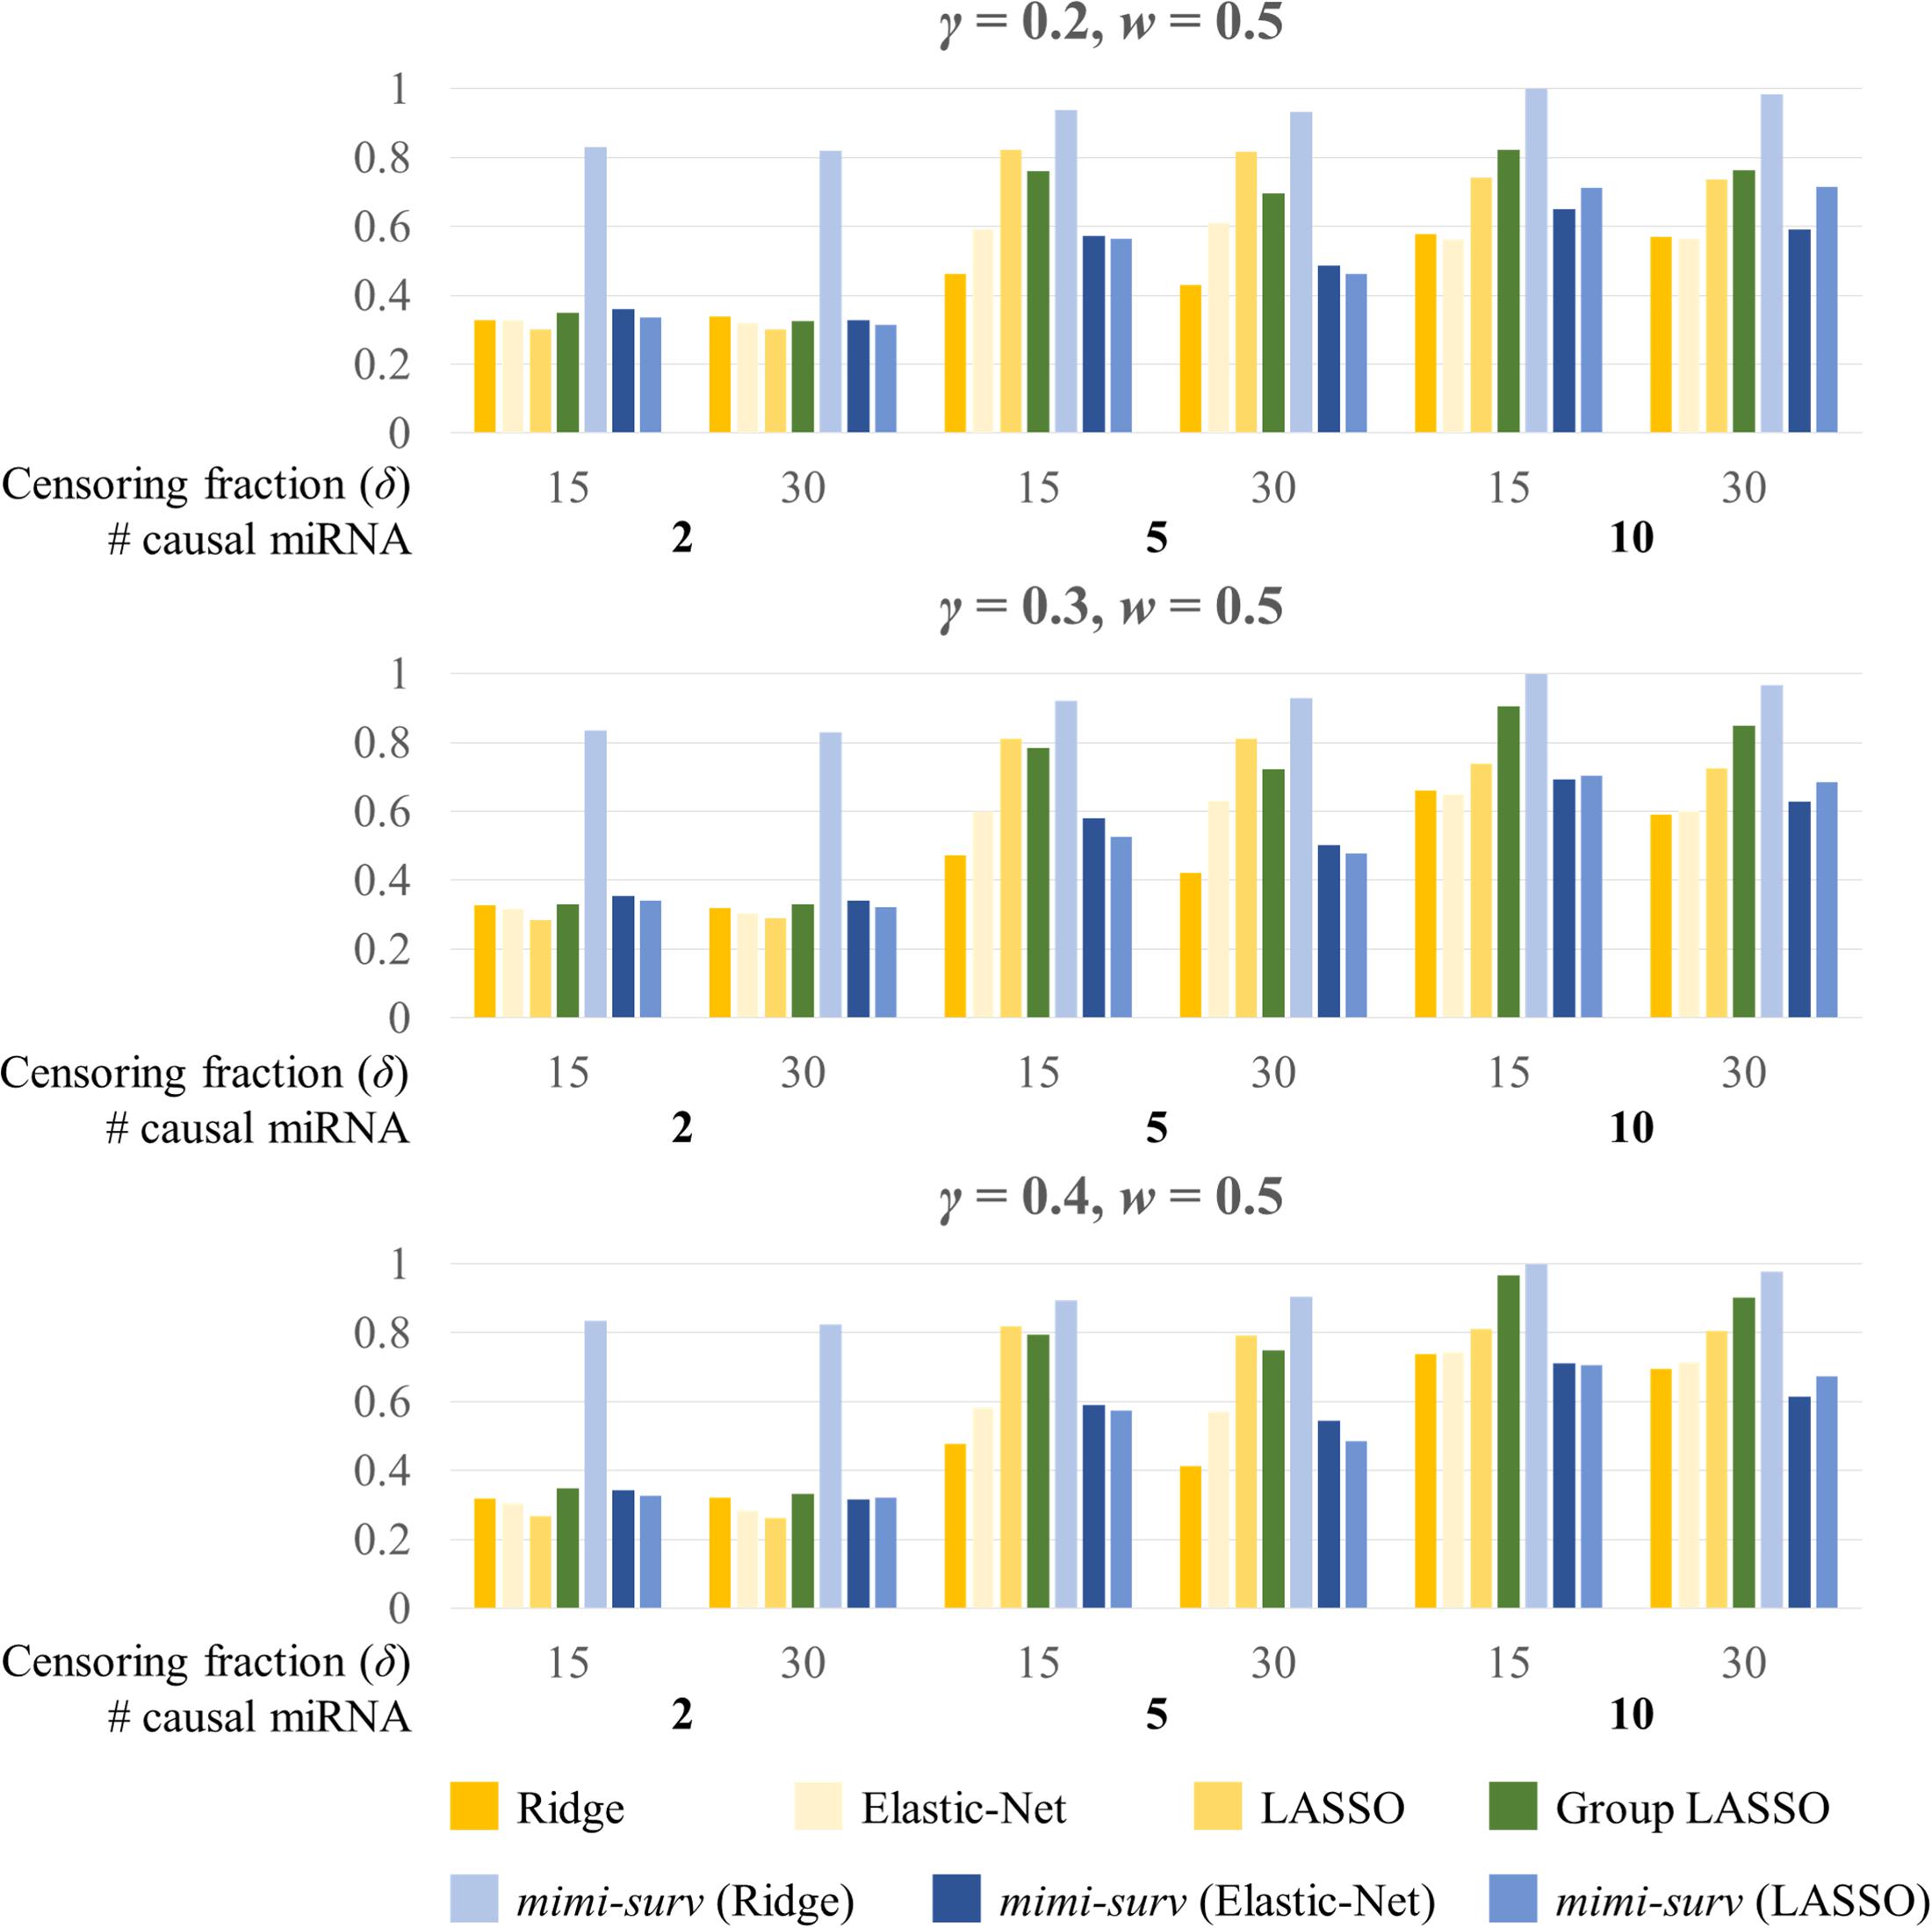
Figure 4. Statistical powers of mimi-surv and the compared methods with different miRNA effect sizes (γ = 0.2, 0.3, and 0.4). The phenotypes were generated from two, five and ten causal miRNA-mRNA integration set and censoring fraction of 0.15 and 0.3.
Figure 5 shows the barplots comparing the power of each method for a fixed miRNA effect size (γ = 0.2) and various mRNA effect sizes with censoring fractions of 0.15 and 0.3. Similarly, mimi-surv with ridge penalty showed the largest power. Unlike the results from Figure 4, mimi-surv with EN and lasso showed comparable power to grplasso when the number of causal miRNA increases. The same tendency was observed for various values of γ and w. In addition, the power differences between the results from various values of γ and w were small.
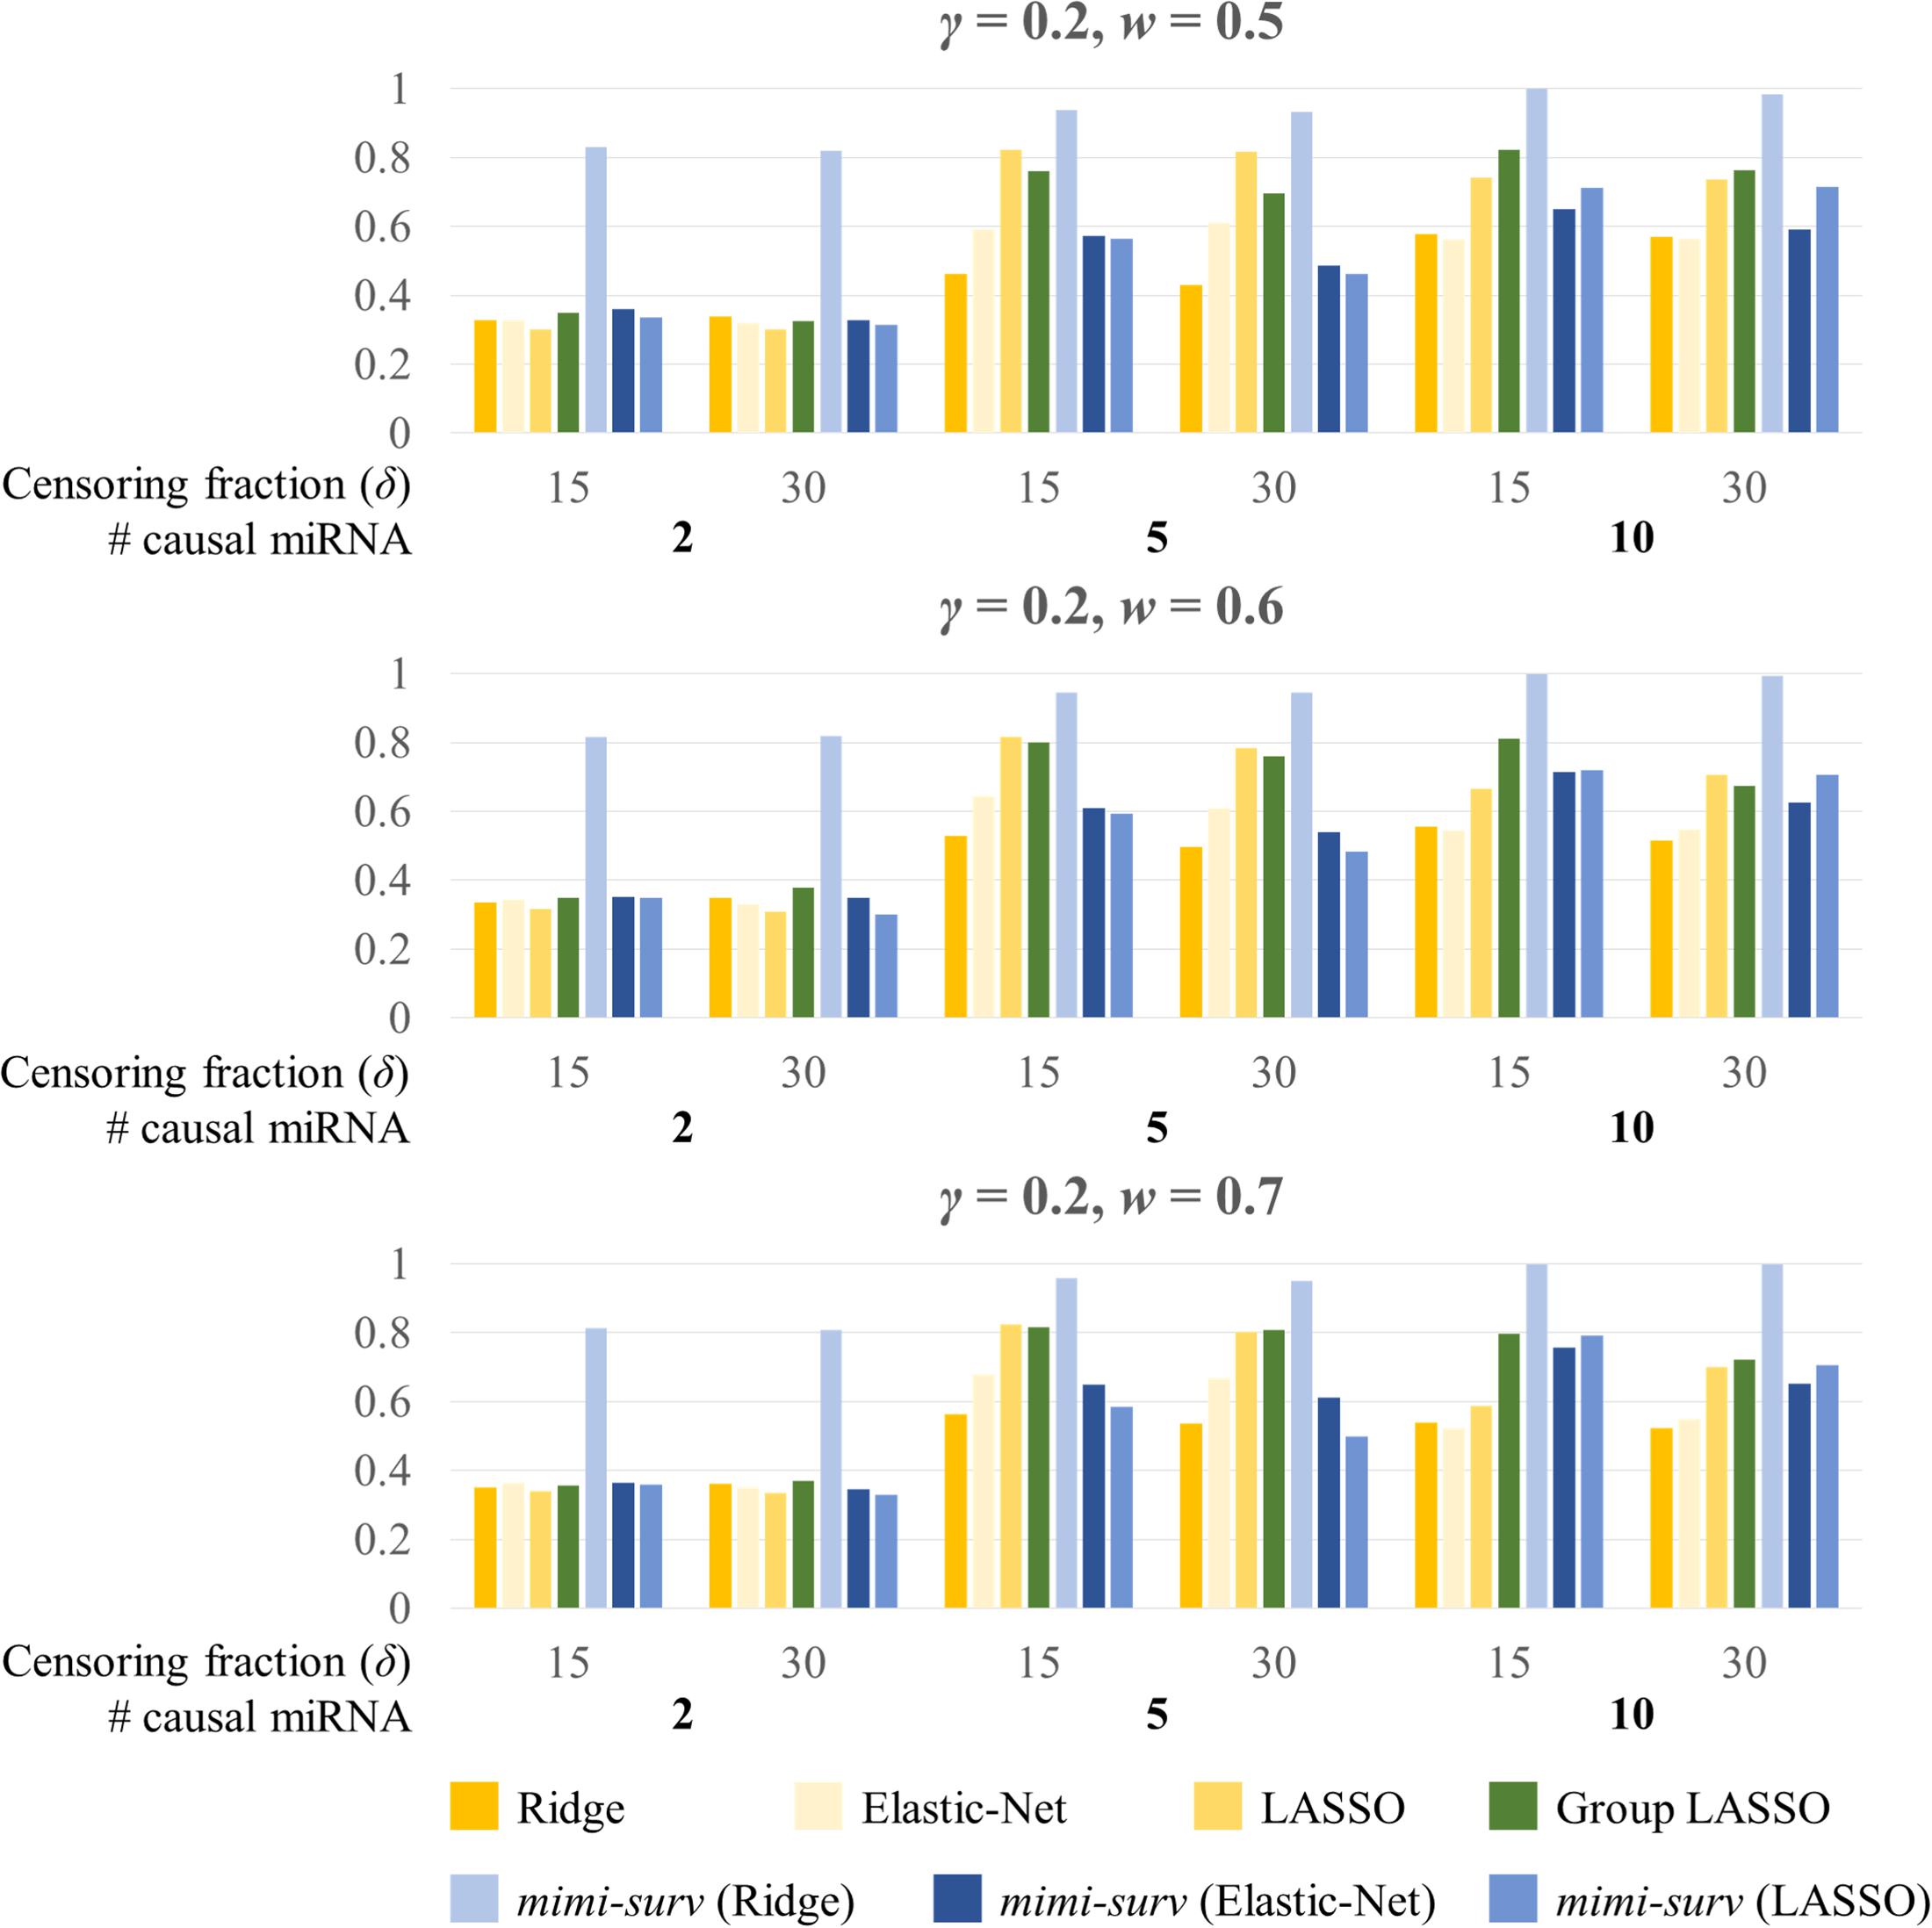
Figure 5. Statistical powers of mimi-surv and the compared methods with different mRNA effect sizes (w = 0.5, 0.6, and 0.7). The phenotypes were generated from two, five and ten causal miRNA-mRNA integration set and censoring fraction of 0.15 and 0.3.
SNUH Dataset Analysis Result
In order to identify miRNA-mRNA integration sets, 54 miRNA-mRNA integration sets were selected to which mimi-surv along with other methods was applied to identify significant miRNA-mRNA integration sets. In this analysis, we focused on comparing the lists of significant miRNAs obtained from single, ridge, lasso, EN, grplasso, and mimi-surv (Lee and Silvapulle, 1988; Tibshirani, 1996; Zou and Hastie, 2005; Meier et al., 2008).
Figure 6 shows a Venn diagram displaying the number of miRNAs identified by each method, in which the number without brackets shows the number of miRNAs reported in other studies, and those within brackets show the total number of miRNAs found significant by each method. Note that the largest number of miRNAs was detected by single marker analysis. Interestingly, about half (6 out of 14) overlapped with other methods. Of these, mimi-surv detected a total of six miRNAs, in which four miRNAs were reported in other PDAC analyses (Ma et al., 2014; Tanaka et al., 2014; Debernardi et al., 2015; Li et al., 2015; Cheng et al., 2017). In general, the penalized Cox-PH methods identified relatively fewer miRNAs than other methods, but ridge penalty had the largest detection rate. Note that all methods commonly detected miR-204, which is known for the differential expression relationship between PDAC stage I and stage II-IV samples (Debernardi et al., 2015). In addition, miR-204 has been used to distinguish solid pseudo-papillary tumors from pancreatic malignancies (Li et al., 2015).
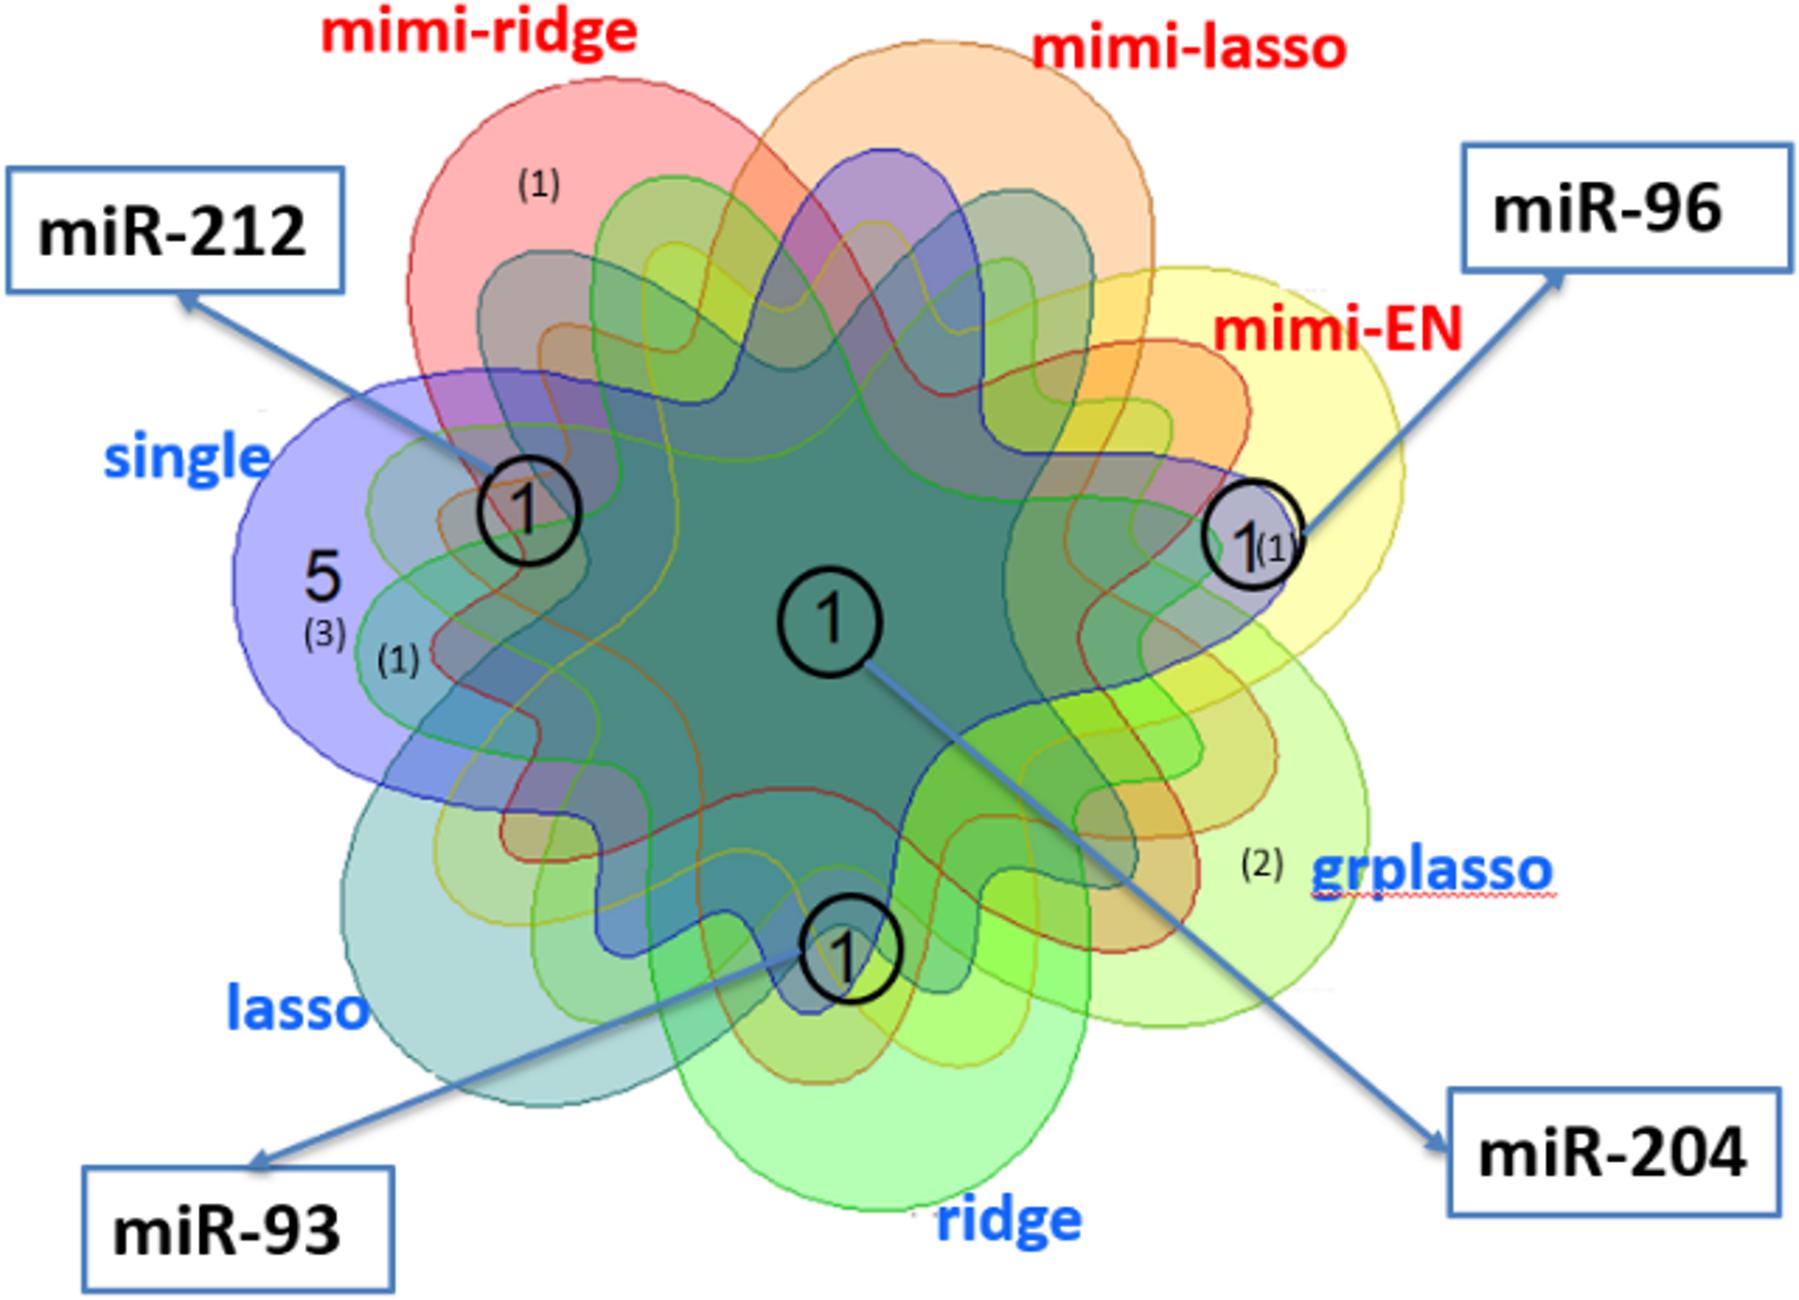
Figure 6. Venn diagram for the number of miRNAs detected by each method in analysis of PDAC data from SNUH. The numbers without brackets show the numbers of miRNAs found in other PDAC analyses, while those within brackets show the number of miRNAs not previously identified.
TCGA Dataset Analysis Result and Comparison
For the analysis of TCGA data, 23 miRNA-mRNA integrations pairs were constructed. Table 2 shows information for the miRNAs detected in the TCGA dataset analysis. For the TCGA data analysis, all the compared methods including single marker analysis and penalized regression methods failed to identify any significant miRNAs. However, mimi-surv detected five significant miRNAs with their significant genes, using various types of penalties. Among those results, we successfully replicated one miRNA miR-96, which was identified in the analysis of SNUH dataset. miR-96 is a well-known marker as a suppressor of the KRAS signaling pathway (Tanaka et al., 2014). Among our detected miRNAs, miR-200c, miR-506, and miR-96 were previously reported in other PDAC studies (Mees et al., 2010; Bryant et al., 2012; Tanaka et al., 2014; Cheng et al., 2016; Pan et al., 2018; Zhuo et al., 2018).
Table 3 lists the significant miRNAs and their significant target mRNAs detected by mimi-surv from both datasets. Interestingly, using the proposed maxT approach, mimi-surv successfully identified two significant miRNAs (miR-96 and miR-133b) after the multiple testing adjustment (FDR q-value < 0.05), and one of those miRNAs (miR-96) was the replicated miRNA. In addition, our approach successfully showed the advantage of penalization approach. For instance, miR-93 has more than 901 target mRNAs, therefore the significance level after multiple testing adjustment can be dramatically small. However, only 7 mRNAs were found significant by EN, and only 9 mRNAs were found significant by lasso. As a result, by using mimi-surv, we could reduce the number of candidate miRNA-mRNA sets.
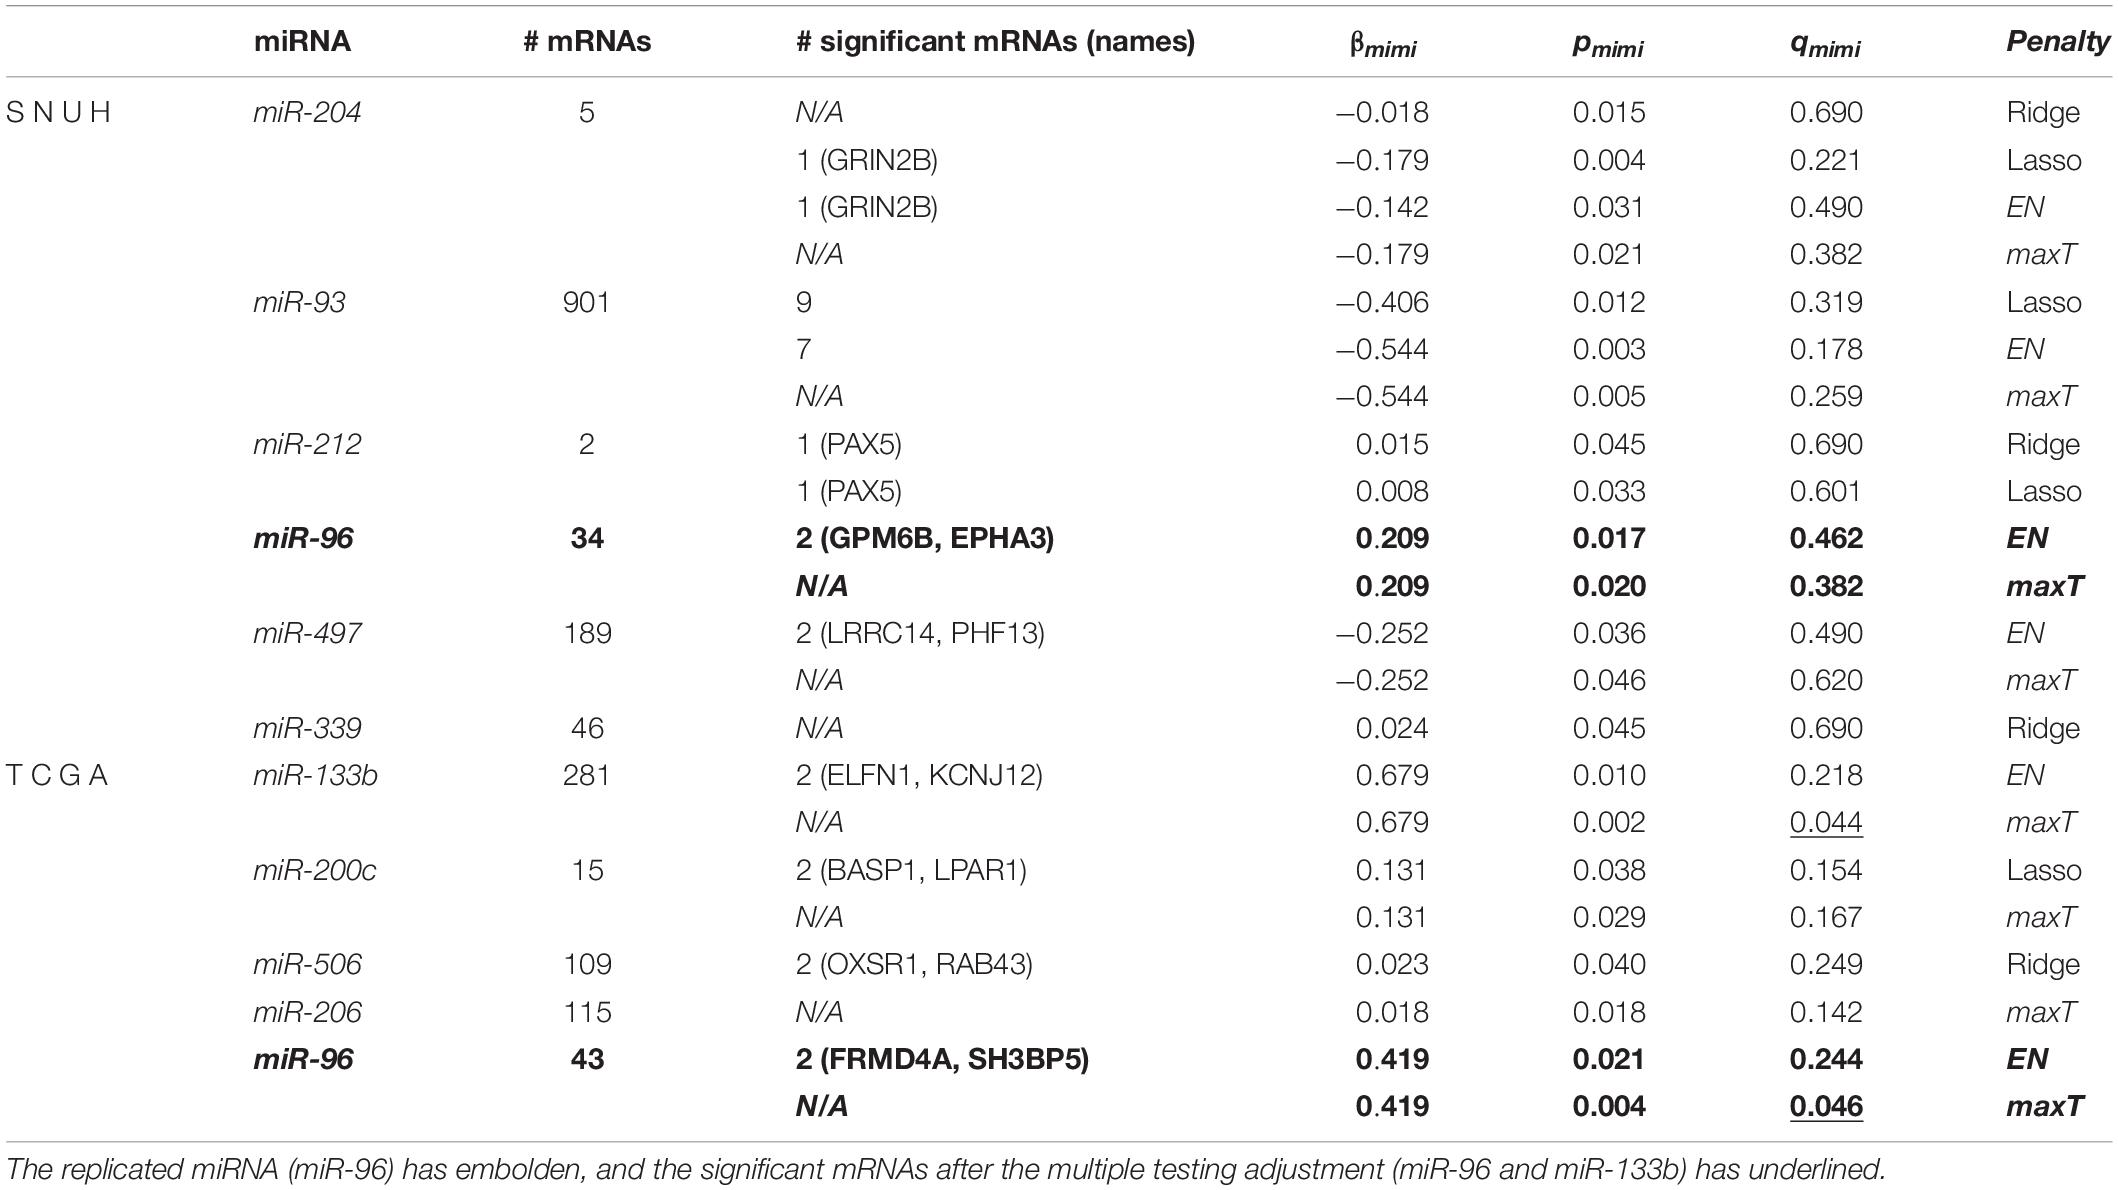
Table 3. Results of statistically significant miRNA and its significant mRNAs from both datasets using mimi-surv.
Discussion
In this study, we proposed mimi-surv which is a novel approach to identifying significant miRNA-mRNA sets associated with survival time, reflecting the nature of biological process between miRNA and mRNA. The objective of our analysis is to propose an integrative method for using an additional information of mRNA to the analysis of miRNA. Thus, we investigated how much the integrative analysis of miRNAs and mRNAs performs better than the other integrative methods using both miRNAs and mRNAs and the model using only miRNAs.
Through simulation studies, we compared the performance of mimi-surv, with various methods such as a single Cox-PH model, penalized Cox-PH methods with ridge, lasso, EN penalties and grplasso, including selection of optimal penalties. From the simulation results, it was shown that mimi-surv with ridge penalty outperformed other methods, in terms of the statistical power. The analysis of two real datasets of PDAC patients from SNUH and TCGA on which mimi-surv showed superior performance in identifying miRNA-mRNA integration sets for survival time. Moreover, mimi-surv successfully replicated one miRNA (miR-96) from TCGA dataset with statistical significance (q-value < 0.01), despite difference of the generation platform (Affymetrix chip vs. Illumina sequencing).
Our study remains with some limitations. First, although our simulation study based on the real SNUH dataset and simulated phenotypes showed that performance of mimi-surv with ridge penalty had better power than other penalties, mimi-surv with maxT approach or EN penalty detected more miRNAs in real PDAC data analysis. It is well known that selection of optimal penalty is challenging for Cox-PH model (Benner et al., 2010; Ojeda et al., 2016). For real data application, we recommend trying all applicable penalties to the dataset and select the penalty with less excessive shrinkage and lower dataset dependency. Although some additional simulation studies are required to evaluate performance, the maxT approach can be alternatively used. Finally, our permutation strategy requires an intensive computational burden to compute p-values. Thus, in future studies, we will derive a statistical distribution of the beta coefficient in mimi-surv, to avoid permutation procedures. Nonetheless, our mimi-surv remains promising for associating survival time with the expression of miRNAs and small non-coding RNAs whose misexpression is now widely accepted.
Data Availability Statement
The data analyzed in this study is subject to the following licenses/restrictions: The datasets used in this study are provided upon the approval of individual data provider. Requests to access these datasets should be directed to J-YJ, amFuZ2p5NEBnbWFpbC5jb20=.
Author Contributions
YK and TP: conceptualization and methodology. SuL: software. SeL, YK, and SuL: validation. SuL and YK: formal analysis and visualization. J-YJ: resources and data curation. YK: investigation and writing—original draft preparation. SuL and TP: writing—review and editing. TP: supervision, project administration, and funding acquisition. All authors contributed to the article and approved the submitted version.
Funding
This research was supported by a grant of the Korea Health Technology R&D Project through the Korea Health Industry Development Institute (KHIDI), funded by the Ministry of Health & Welfare, South Korea (grant number: HI16C2037010016) and Bio-Synergy Research Project of the Ministry of Science, ICT and Future Planning through the National Research Foundation (grant number: 2013M3A9C4078158). Publication of this article was sponsored by the Bio-Synergy Research Project (grant number: 2013M3A9C 4078158).
Conflict of Interest
The authors declare that the research was conducted in the absence of any commercial or financial relationships that could be construed as a potential conflict of interest.
Supplementary Material
The Supplementary Material for this article can be found online at: https://www.frontiersin.org/articles/10.3389/fgene.2021.634922/full#supplementary-material
Footnotes
References
Agarwal, V., Bell, G. W., Nam, J. W., and Bartel, D. P. (2015). Predicting effective microRNA target sites in mammalian mRNAs. Elife 4, e05005.
Benner, A., Zucknick, M., Hielscher, T., Ittrich, C., and Mansmann, U. (2010). High-dimensional Cox models: the choice of penalty as part of the model building process. Biom J 52, 50–69. doi: 10.1002/bimj.200900064
Bryant, J. L., Britson, J., Balko, J. M., Willian, M., Timmons, R., Frolov, A., et al. (2012). A microRNA gene expression signature predicts response to erlotinib in epithelial cancer cell lines and targets EMT. Br J Cancer 106, 148–156. doi: 10.1038/bjc.2011.465
Cancer Genome Atlas Research Network, Weinstein, J. N., Collisson, E. A., Mills, G. B., Shaw, K. R., Ozenberger, B. A., et al. (2013). The Cancer Genome Atlas Pan-Cancer analysis project. Nat Genet 45, 1113–1120. doi: 10.1038/ng.2764
Cheng, Y., Yang, H., Sun, Y., Zhang, H., Yu, S., Lu, Z., et al. (2017). RUNX1 promote invasiveness in pancreatic ductal adenocarcinoma through regulating miR-93. Oncotarget 8, 99567–99579. doi: 10.18632/oncotarget.20433
Cheng, R. F., Wang, J., Zhang, J. Y., Sun, L., Zhao, Y. R., Qiu, Z. Q., et al. (2016). MicroRNA-506 is up-regulated in the development of pancreatic ductal adenocarcinoma and is associated with attenuated disease progression. Chin J Cancer 35, 64.
Debernardi, S., Massat, N. J., Radon, T. P., Sangaralingam, A., Banissi, A., Ennis, D. P., et al. (2015). Noninvasive urinary miRNA biomarkers for early detection of pancreatic adenocarcinoma. Am J Cancer Res 5, 3455–3466.
Enerly, E., Steinfeld, I., Kleivi, K., Leivonen, S. K., Aure, M. R., Russnes, H. G., et al. (2011). miRNA-mRNA integrated analysis reveals roles for miRNAs in primary breast tumors. PloS one 6:e16915. doi: 10.1371/journal.pone.0016915
Frampton, A. E., Krell, J., Jamieson, N. B., Gall, T. M., Giovannetti, E., Funel, N., et al. (2015). microRNAs with prognostic significance in pancreatic ductal adenocarcinoma: A meta-analysis. Eur J Cancer 51, 1389–1404. doi: 10.1016/j.ejca.2015.04.006
Greither, T., Grochola, L. F., Udelnow, A., Lautenschlager, C., Wurl, P., and Taubert, H. (2010). Elevated expression of microRNAs 155, 203, 210 and 222 in pancreatic tumors is associated with poorer survival. Int J Cancer 126, 73–80. doi: 10.1002/ijc.24687
Ha, M., and Kim, V. N. (2014). Regulation of microRNA biogenesis. Nat. Rev. Mol. Cell Biol. 15, 509–524.
Kim, Y., Lee, S., Choi, S., Jang, J. Y., and Park, T. (2018). Hierarchical structural component modeling of microRNA-mRNA integration analysis. BMC Bioinformatics 19:75.
Kim, Y. (2018). Hierarchical Structural Component Models for Integrative Analysis of miRNA and mRNA expression data, Department of Statistics. Seoul: Seoul National University.
Lee, S., Choi, S., Kim, Y. J., Kim, B. J., T2d-Genes Consortium, Hwang, H., et al. (2016). Pathway-based approach using hierarchical components of collapsed rare variants. Bioinformatics 32, i586–i594.
Lee, S., Kim, S., Kim, Y., Oh, B., Hwang, H., and Park, T. (2019). Pathway analysis of rare variants for the clustered phenotypes by using hierarchical structured components analysis. BMC Med Genomics 12:100.
Lee, A. H., and Silvapulle, M. J. (1988). Ridge Estimation in Logistic-Regression. Communications in Statistics-Simulation and Computation 17, 1231–1257.
Li, P., Hu, Y., Yi, J., Li, J., Yang, J., and Wang, J. (2015). Identification of potential biomarkers to differentially diagnose solid pseudopapillary tumors and pancreatic malignancies via a gene regulatory network. J Transl Med 13, 361.
Ma, C., Nong, K., Wu, B., Dong, B., Bai, Y., Zhu, H., et al. (2014). miR-212 promotes pancreatic cancer cell growth and invasion by targeting the hedgehog signaling pathway receptor patched-1. J Exp Clin Cancer Res 33, 54. doi: 10.1186/1756-9966-33-54
Mees, S. T., Mardin, W. A., Wendel, C., Baeumer, N., Willscher, E., Senninger, N., et al. (2010). EP300–a miRNA-regulated metastasis suppressor gene in ductal adenocarcinomas of the pancreas. Int J Cancer 126, 114–124. doi: 10.1002/ijc.24695
Meier, L., van de Geer, S. A., and Buhlmann, P. (2008). The group lasso for logistic regression. Journal of the Royal Statistical Society Series B-Statistical Methodology 70, 53–71. doi: 10.1111/j.1467-9868.2007.00627.x
Ojeda, F. M., Muller, C., Bornigen, D., Tregouet, D. A., Schillert, A., Heinig, M., et al. (2016). Comparison of Cox Model Methods in A Low-dimensional Setting with Few Events. Genom Proteom Bioinf 14, 235–243. doi: 10.1016/j.gpb.2016.03.006
Pan, Y., Lu, F., Xiong, P., Pan, M., Zhang, Z., Lin, X., et al. (2018). WIPF1 antagonizes the tumor suppressive effect of miR-141/200c and is associated with poor survival in patients with PDAC. J Exp Clin Cancer Res 37, 167.
Tanaka, M., Suzuki, H. I., Shibahara, J., Kunita, A., Isagawa, T., Yoshimi, A., et al. (2014). EVI1 oncogene promotes KRAS pathway through suppression of microRNA-96 in pancreatic carcinogenesis. Oncogene 33, 2454–2463. doi: 10.1038/onc.2013.204
Tibshirani, R. (1996). Regression shrinkage and selection via the Lasso. J Roy Stat Soc B Met 58, 267–288. doi: 10.1111/j.2517-6161.1996.tb02080.x
Xu, X., Liu, T., Wang, Y., Fu, J., Yang, Q., Wu, J., et al. (2019). miRNA-mRNA Associated With Survival in Endometrial Cancer. Front. Genet 10:743. doi: 10.3389/fgene.2019.00743
Yonemori, K., Kurahara, H., Maemura, K., and Natsugoe, S. (2017). MicroRNA in pancreatic cancer. J Hum Genet 62, 33–40.
Zhuo, M., Yuan, C., Han, T., Cui, J., Jiao, F., and Wang, L. (2018). A novel feedback loop between high MALAT-1 and low miR-200c-3p promotes cell migration and invasion in pancreatic ductal adenocarcinoma and is predictive of poor prognosis. BMC Cancer 18:1032.
Keywords: statistical method, miRNA-mRNA integration, personalized medicine, pancreatic ductal adenocarcinoma, The Cancer Genome Atlas
Citation: Kim Y, Lee S, Jang J-Y, Lee S and Park T (2021) Identifying miRNA-mRNA Integration Set Associated With Survival Time. Front. Genet. 12:634922. doi: 10.3389/fgene.2021.634922
Received: 29 November 2020; Accepted: 06 April 2021;
Published: 29 June 2021.
Edited by:
Shaolong Cao, University of Texas MD Anderson Cancer Center, United StatesReviewed by:
Wei Zhu, Zhejiang University, ChinaChristine Lary, Maine Medical Center Research Institute, United States
Copyright © 2021 Kim, Lee, Jang, Lee and Park. This is an open-access article distributed under the terms of the Creative Commons Attribution License (CC BY). The use, distribution or reproduction in other forums is permitted, provided the original author(s) and the copyright owner(s) are credited and that the original publication in this journal is cited, in accordance with accepted academic practice. No use, distribution or reproduction is permitted which does not comply with these terms.
*Correspondence: Taesung Park, dHNwYXJrQHN0YXRzLnNudS5hYy5rcg==
†These authors have contributed equally to this work