 S. M. Hisam A. Rabbi1
 Ajay Kumar1*
 Sepehr Mohajeri Naraghi1
 Senay Simsek1
 Suraj Sapkota2Shyam Solanki3Mohammed S. Alamri4
 Elias M. Elias1Shahryar Kianian5
 Ali Missaoui2,6
 Mohamed Mergoum2,6*
- 1Department of Plant Sciences, North Dakota State University, Fargo, ND, United States
- 2Institute of Plant Breeding, Genetics, and Genomics, University of Georgia, Griffin, GA, United States
- 3Department of Crop and Soil Sciences, Washington State University, Pullman, WA, United States
- 4Department of Food Sciences and Nutrition, King Saud University, Riyadh, Saudi Arabia
- 5United States Department of Agriculture-The Agricultural Research Service (USDA-ARS) Cereal Disease Laboratory, University of Minnesota, St. Paul, MN, United States
- 6Department of Crop and Soil Sciences, University of Georgia, Griffin, GA, United States
Understanding the genetics of drought tolerance in hard red spring wheat (HRSW) in northern USA is a prerequisite for developing drought-tolerant cultivars for this region. An association mapping (AM) study for drought tolerance in spring wheat in northern USA was undertaken using 361 wheat genotypes and Infinium 90K single-nucleotide polymorphism (SNP) assay. The genotypes were evaluated in nine different locations of North Dakota (ND) for plant height (PH), days to heading (DH), yield (YLD), test weight (TW), and thousand kernel weight (TKW) under rain-fed conditions. Rainfall data and soil type of the locations were used to assess drought conditions. A mixed linear model (MLM), which accounts for population structure and kinship (PC+K), was used for marker–trait association. A total of 69 consistent QTL involved with drought tolerance-related traits were identified, with p ≤ 0.001. Chromosomes 1A, 3A, 3B, 4B, 4D, 5B, 6A, and 6B were identified to harbor major QTL for drought tolerance. Six potential novel QTL were identified on chromosomes 3D, 4A, 5B, 7A, and 7B. The novel QTL were identified for DH, PH, and TKW. The findings of this study can be used in marker-assisted selection (MAS) for drought-tolerance breeding in spring wheat.
Introduction
Wheat (Triticum aestivum L.) is a major crop worldwide contributing about 20% of calories to the human population. Current genetic and genomic improvements in wheat have helped increase its production; however, further improvements are essential to increasing wheat productivity to feed the world's population, which is projected to reach over nine billion by 2050 (Hertel, 2011; Sapkota et al., 2019). Wheat production is often reduced by several biotic and abiotic stresses including drought and heat. Plant breeding has improved crop resistance to both biotic and abiotic stresses; nevertheless, the progress is slow and the yield gap between stress-prone areas and favorable production regions of major crops, including wheat, is high (Edae et al., 2014). Therefore, breeding efforts are being focused on dissecting the genetics of abiotic stresses including drought in wheat to develop knowledge and resources to speed up the development of climate-resilient wheat cultivars.
Drought poses a major threat to crop yield, highlighting the urgent need to develop drought-tolerant cultivars (Ergen and Budak, 2009). The majority of countries worldwide experience drought problems, even those in humid regions as they often have dry spells at some point. Obviously, drought is more severe in arid areas with minimal rainfall (Sun et al., 2006). North Dakota is the biggest producer of hard-red spring wheat (HRSW) in the USA (North Dakota Wheat Commission, 2016). The state, especially the semiarid western half, experiences frequent droughts (Climate Change and the Economy, 2008). Consequently, HRSW, a major cash crop for ND and the USA, is regularly affected by drought in this region. Developing and releasing drought-tolerant HRSW cultivars is critical to countering ND drought conditions, but this cannot be done without understanding the genetics of drought tolerance for HRSW in northern USA.
Quantitative trait locus (QTL) analysis allows genetic dissection, which can be a sound approach for understanding the molecular basis of drought tolerance in HRSW. In the past, several QTL mapping studies for drought tolerance in wheat were conducted (Kirigwi et al., 2007; Alexander et al., 2012; Ibrahim et al., 2012a,b). These studies have used different types of markers, including SSRs, EST-STS, and DArTs. However, almost all of these studies were based on low-resolution molecular maps consisting of only 102–690 markers. The number of markers in the previous studies seems insufficient to saturate the wheat genome due to its large size of 17 gigabase pairs (Brenchley et al., 2012). Also, drought tolerance is a quantitative trait adopting different mechanisms (Blum, 1988) and should have several QTL distributed throughout the whole genome. A high-resolution map can provide a more complete genetic dissection of drought tolerance and also a successful application of associated molecular markers through marker-assisted selection (MAS) programs. The Infinium iSelect 90K assay (Wang et al., 2014), with more than 81,000 gene-associated SNPs to assess polymorphism in bread wheat, provides a better means to identify SNPs tightly linked to drought tolerance.
Biparental QTL mapping, even when using high-density linkage maps, suffers some limitations. The biparental population has fewer recombination events and therefore has low resolution. By comparison, association mapping (AM) exploits a broader population and multiple alleles and has a better resolution of the QTL (Yu and Buckler, 2006). A few AM studies on drought tolerance conducted in the past have used a small number of markers (Dodig et al., 2012; Edae et al., 2013, 2014; Ballesta et al., 2020; Maulana et al., 2020), which seems insufficient to explore the variation in wheat, efficiently. Dodig et al. (2012) used 46 SSR markers, and Edae et al. (2013) used 78 DArT markers. Maulana et al. (2020) used greenhouse for phenotyping for the association study, whereas Ballesta et al. (2020) used field experiments for their study but showed the association only for chromosome 4A. Furthermore, to our knowledge, no genetic studies were conducted on HRSW germplasm to elucidate the QTL associated with drought-related traits in the region. Therefore, the present study was undertaken to identify genes/QTL associated with yield and agronomic traits evaluated under drought conditions in field experiments using an association mapping approach combined with high-density SNP marker assay.
Materials and Methods
Plant Materials
In 2012, a germplasm panel comprising of 350 HRSW inbred lines developed by the HRSW breeding program at North Dakota State University (NDSU) and different cultivars with varying drought tolerances was used for this study (Supplementary Table 1). Eleven more accessions were added for the experiments conducted in 2013 and 2014 (Supplementary Table 2). These lines were developed over time from different crosses, and pedigree selections for different purposes such as drought tolerance, disease resistance, quality, and yield were used for this study.
Field Experiments and Data Collection
The evaluation of agronomic performances of the AM panel was carried out under non-irrigated field conditions at different locations in ND, USA. In 2012, the AM was evaluated at Prosper (46.96300°N, 97.01980°W), Casselton (46.540N, 97.1238°W), and Minot (48°13′59″N 101°17′32″W). In 2013, the evaluation was carried out in Prosper, Minot, and Williston (48°9′23″N 103°37′41″W), while in 2014, it was evaluated in Prosper, Minot, and Hettinger (46°0′3″N 102°38′0″W). Prosper and Casselton are located in eastern ND, at 46.9630° N, 97.0198° W, and 46.9° N, 97.210556° W, respectively. Minot is situated between western ND's semiarid grassland and central ND's subhumid grassland (48.2330° N, 101.2923° W). Williston's location is in northwestern ND (48.1470° N, 103.6180° W), and Hettinger's is in southwestern ND (46.0014° N, 102.6368° W). The total rainfall during the growing period (seed sowing to ripening) in 2012, 2013, and 2014 at Prosper was 119.6, 269.7, and 168.6 mm, respectively (Table 1). Minot's rainfall during the growing period was 168 mm in 2012, 159.8 mm in 2013, and 230.9 mm in 2014. In case of Casselton, Williston, and Hettinger, the rainfall was 122.8 mm (2012), 319.3 mm (2013), and 200.3 mm (2014), respectively, during the growing season (North Dakota Agricultural Weather Network, 2015). The total rainfall in the experimental sites during the growing period was considered to assess the drought condition (Table 1). The water holding capacity of the experimental sites was achieved from the soil type (Frazen, 2003). In 2012, the experiment was conducted in a randomized complete block design (RCBD) with two replicates, whereas a simple lattice design was used in 2013 and 2014. The plots had an area of 2.44 × 1.22 m and seven rows with a 15.24 cm gap between them in 2012 and 2013. The plot size in 2014 was 2.44 × 1.42 m, but the number of rows was still seven with a larger gap (17.78 cm) between them.
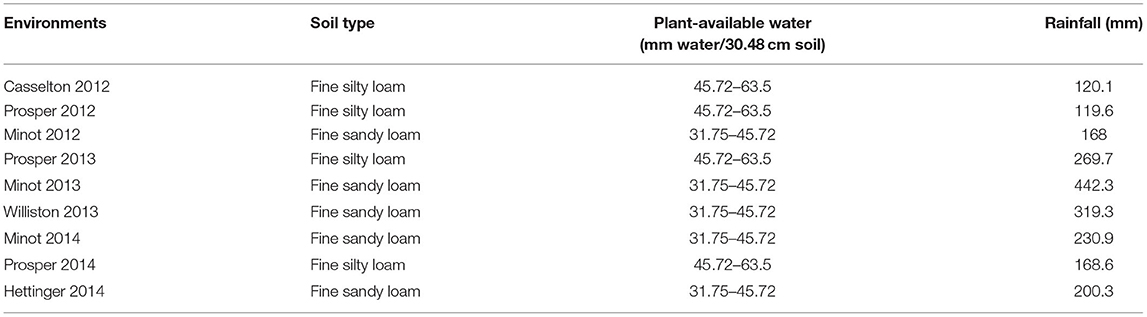
Table 1. Soil types, plant-available water (water-holding capacity of soil), and total rainfall for nine environments used in this study.
The phenotypic data was collected on DH, PH, YLD, TW, and TKW. The heading date (DH) was recorded when more than 50% of the plants in the plot were starting to flower. Plant height (PH) was measured in the middle of the plot from plant base to tip excluding the awn. Yield per plot (YLD) was converted to yield/ha for further analysis. Similarly, kg/0.5-pint cup was converted to kg/m3 as the test weight (TW) for further analysis. A thousand kernels were counted using a seed counter and were weighed for thousand kernel weight (TKW).
Single-Nucleotide Polymorphism Genotyping
Genomic DNA was isolated from lyophilized young leaves of each genotype using the DNeasy Plant Mini Kit (Qiagen, Valencia, CA, cat. no. 69106). The quality of the DNA was checked on 0.8% agarose gel. The NanoDrop 1000 spectrophotometer (NanoDrop Technologies Inc., Wilmington, DE) was used to check the DNA concentration. The accessions of the AM panel were genotyped using the Illumina 90K iSelect wheat SNP assay (Wang et al., 2014) in the Small Grains Genotyping Lab at USDA-ARS, Fargo, ND. The Illumina iSelect 90K assay produced data for 81,587 SNPs. The analyses of SNP genotyping, clustering of the SNP alleles, and calling of the genotypes were performed with Genome Studio v2011.1 (www.illumina.com). The minimum number of points used in the cluster was 10 (Wang et al., 2014). Monomorphic SNPs and SNPs having more than 20% missing genotypic data and 10% heterozygosity were excluded. The best linear unbiased prediction (iBLUP) method (Yang et al., 2014b) was used to impute the missing genotypic data for the remaining SNPs. The polymorphic SNPs selected after filtering based on the above mentioned criteria were screened for their positions on the chromosomes based on the wheat consensus genetic map (Wang et al., 2014).
Phenotypic Data Analysis (ANOVA, Descriptive Statistics, and Frequency Distribution)
The ANOVA Proc MIXED procedure was used (SAS Institute, 2004) to analyze the phenotypic data from 2012, whereas for 2013 and 2014, the Proc LATTICE was used. The accessions of the AM panel were considered as fixed effects, and environments and blocks were considered as random effects in the ANOVA Proc MIXED procedure. The mean values were separated using the F-protected least significant difference (LSD) value at the P ≤ 0.05 level of significance. CORR procedure of SAS (SAS Institute, 2004) was used to calculate Pearson correlations between traits for each environment. The phenotypic data with a low coefficient of variance (CV) value and significant differences among entries were used for further analysis. The locations that did not show significant differences for most of the traits and with a high CV were not included for further analysis and reporting.
Marker–Trait Association Analysis
Population structure was calculated using markers with pairwise R2 < 0.5 for all pairwise comparisons. To assign the subpopulation membership for each genotype, STRUCTURE software version 3.2 was used (Pritchard et al., 2000). We used an admixture model with independent allele frequencies, a burn-in of 100,000, and an MCMC replication of 500,000 for K = 1–10 with five replications. The delta k calculated from the STRUCTURE software was used to select the optimum number of subpopulations. The number of subpopulations (k) was plotted against the delta k calculated using the STRUCTURE software. Pairwise linkage disequilibrium (LD) between markers in the null model was calculated as the squared allele frequency correlation (R2) in the R-package (Lipka et al., 2012) after filtering for minor allele frequency (MAF) ≥ 5%. Genome-wide LD decay was estimated by plotting R2 against the corresponding pairwise genetic distance (cM) (Wang et al., 2014). AM analysis was conducted using the software TASSEL v.5.0 (Bradbury et al., 2007). The mixed linear model (MLM) with PC + Kinship (K) was used for AM, where the genotypic data were filtered for minor allele (≤ 5%) frequency. A total of 14,816 filtered SNPs were used for further AM study. The initial cutoff point for marker–trait association (MTA) was considered at p ≤ 0.001. Then, this cutoff was subjected to Bonferroni correction (Yang et al., 2014a) to get the threshold (p ≤ 3.4 * 10−6). Only the markers identified to be associated in at least two environments were reported.
Candidate Gene Analysis
For candidate gene analyses, the sequences of the markers showing MTAs were obtained from the T3/Wheat database (Blake et al., 2016) and their physical positions were extracted using the BLAST search against Chinese_Spring_IWGSC_RefSeq1.0 (Appels et al., 2018, Alaux et al., 2018) to identify the most proximal gene. The physical position of each marker was utilized to identify if it represents the perfect marker in the annotated gene space of Chinese Spring. For markers anchored in the non-gene space, flanking genes were obtained by manual IWGSC RefSeq1.0 (Blake et al., 2019) genome scanning in the GrainGenes Genome Browser (https://wheat.pw.usda.gov/GG3/genome_browser). For each MTA, the linked gene set can be extracted from the GrainGenes database. Finally, annotation of identified genes was included to predict their function. In silico expression analysis was carried out in the Wheat Expression Browser expVIP (Ramírez-González et al., 2018, Borrill et al., 2016) dataset for drought and heat stress and PEG to stimulate drought.
Results
Phenotypic Analyses
Significant differences among genotypes were found in the environments of Casselton 2012, Prosper 2012, Minot 2012, Prosper 2013, Prosper and Minot 2013 and 2014, and Hettinger 2014 (Table 2). The rest of the phenotypic data was not analyzed further. The seeds of Minot 2013 could not be cleaned due to Fusarium head blight infection, and hence, YLD, TW, and TKW could not be reported for that environment. Also, TKW for Minot 2014 and Hettinger 2014 was not reported. The phenotypic analyses of the data showed that the heading date had a highly significant negative correlation with YLD, TW, and TKW in all environments (Table 2). Heading date showed a significant positive correlation with PH in four environments. Plant height had a significantly negative correlation with YLD in four environments including the overall mean. It had a significantly positive correlation with TW in six environments, whereas it did not show any correlation with TKW. The yield had a strong positive association with TW in five environments. Also, it showed a strong positive association with TKW in all the environments including the overall mean. Again, TW had a strong positive correlation with TKW in three environments (Table 2). The frequency distributions of the phenotypic data for DH, PH, YLD, TW, and TKW showed a continuous distribution, a characteristic of the typical quantitative traits (Figure 1).
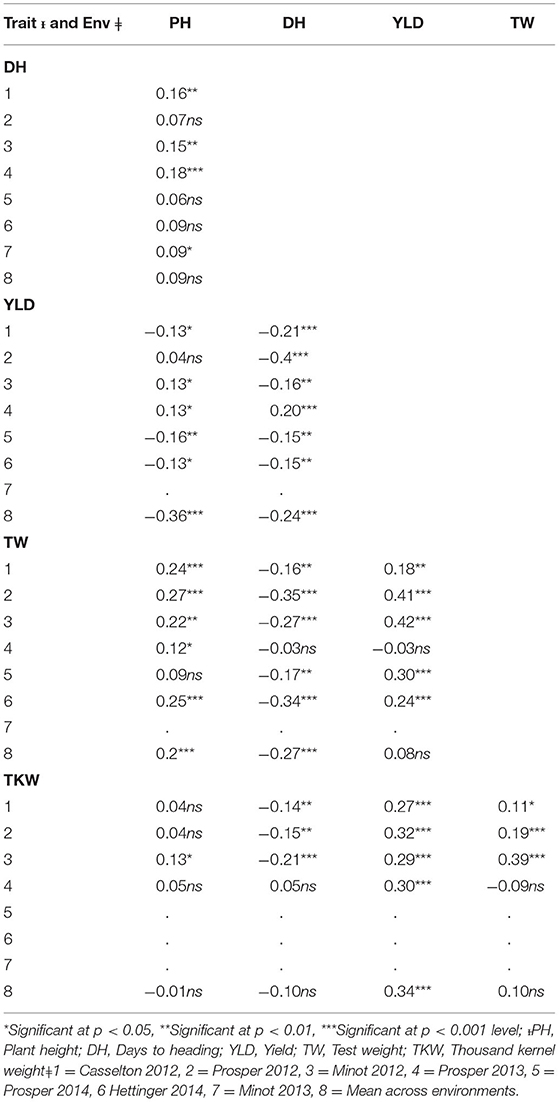
Table 2. Correlation coefficients between five agronomic traits in the association mapping panel in different environments (Env.) and overall mean across environments (M).
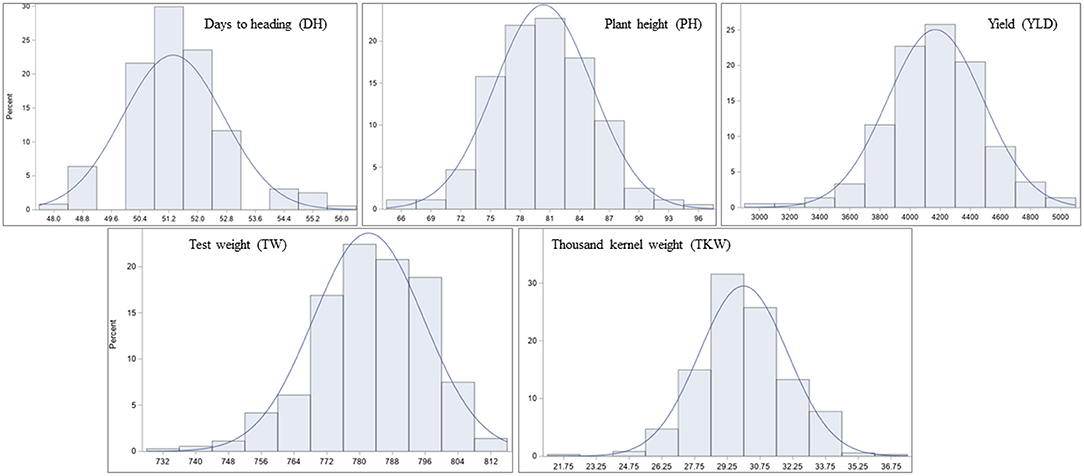
Figure 1. Frequency distribution of least-square means (lsmeans) for the agronomic traits in the hard red spring wheat panel across environments. The panel was evaluated for days to heading (DH), plant height (PH), yield (YLD), test weight (TW), and thousand kernel weight (TKW) in nine different environments of North Dakota in 2012, 2013, and 2014.
Marker Distribution, Population Structure, and LD
A total of 17,514 polymorphic SNPs were selected after the filtering-based criteria mentioned earlier in the material and methods section (Supplementary Table 3). An additional 2,756 SNPs were excluded for lacking map positions on the consensus hexaploid wheat maps (Wang et al., 2014). Out of 14,816 SNP markers used in the AM study, 7,848 were located on the B-genome, 5,503 on the A-genome, and 1,465 markers on the D-genome. The D-genome had the lowest density of markers, with an average distance of 0.87 cM between two markers. The number of markers on individual chromosomes ranged from 56 (4D) to 1,433 (2B). The average number of markers per chromosome was 705.52 (Table 3). The number of subpopulations (k) was plotted against the delta k calculated using software STRUCTURE. The peak of the broken line graph was observed at k = 7, indicating that the natural population can be divided into seven subpopulations (Figure 2). The association was analyzed using five principal components (PC), which captured 25% of the variation. Genome-wide LD decay was estimated by plotting the R2 value against the corresponding pairwise genetic distance (cM) and the LD heat map was created for the whole genome (Supplementary Figure 1). The LD pattern varied by chromosome even after controlling for population relatedness. Overall, the A and B genomes showed high LD compared to the D-genome. The LD dropped at an approximate genetic distance of 10 cM, and therefore, ±10 cM was used to establish confidence intervals for QTL regions. Furthermore, SNP markers with a pairwise R2 ≥ 0.7 were considered as a single locus.
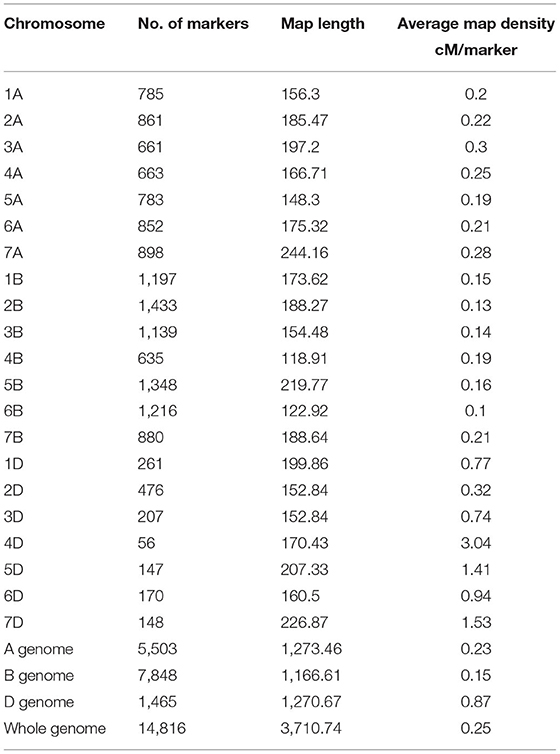
Table 3. Chromosome and genome wide distribution of markers in our spring wheat association mapping panel based on the 90k SNP consensus map (Wang et al., 2014).
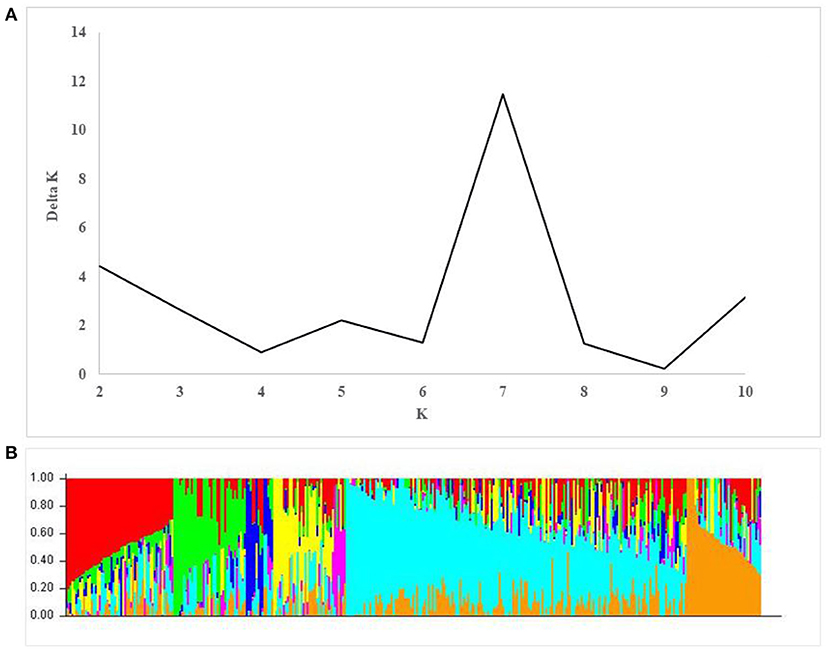
Figure 2. Population structure in the association mapping (AM) panel. (A) Estimation of the number of populations by calculating delta K values. (B) Estimated population structure of the AM panel (k = 7).
Identification of QTL and Associated Candidate Genes
In this study, we detected a total of 69 QTL involved with drought tolerance on all chromosomes except 5D using AM (Table 4; Supplementary Figure 2). Twenty QTL six were associated with DH. These QTL explained 5.6–11.33% of phenotypic variation (PV). Five of those QTL explained >10% of PV and therefore were considered major QTL. Twelve of the QTL were identified to be constitutive, and eight of the QTL were identified exclusively in drought-prone environments. Similarly, a total of 20 QTL six were associated with PH. These QTL explained 4.54–48.01% of PV, with major effects (>10% PV). Sixteen QTL were identified as constitutive, three were identified in the control environments, and one was identified in the drought environment (Table 4).
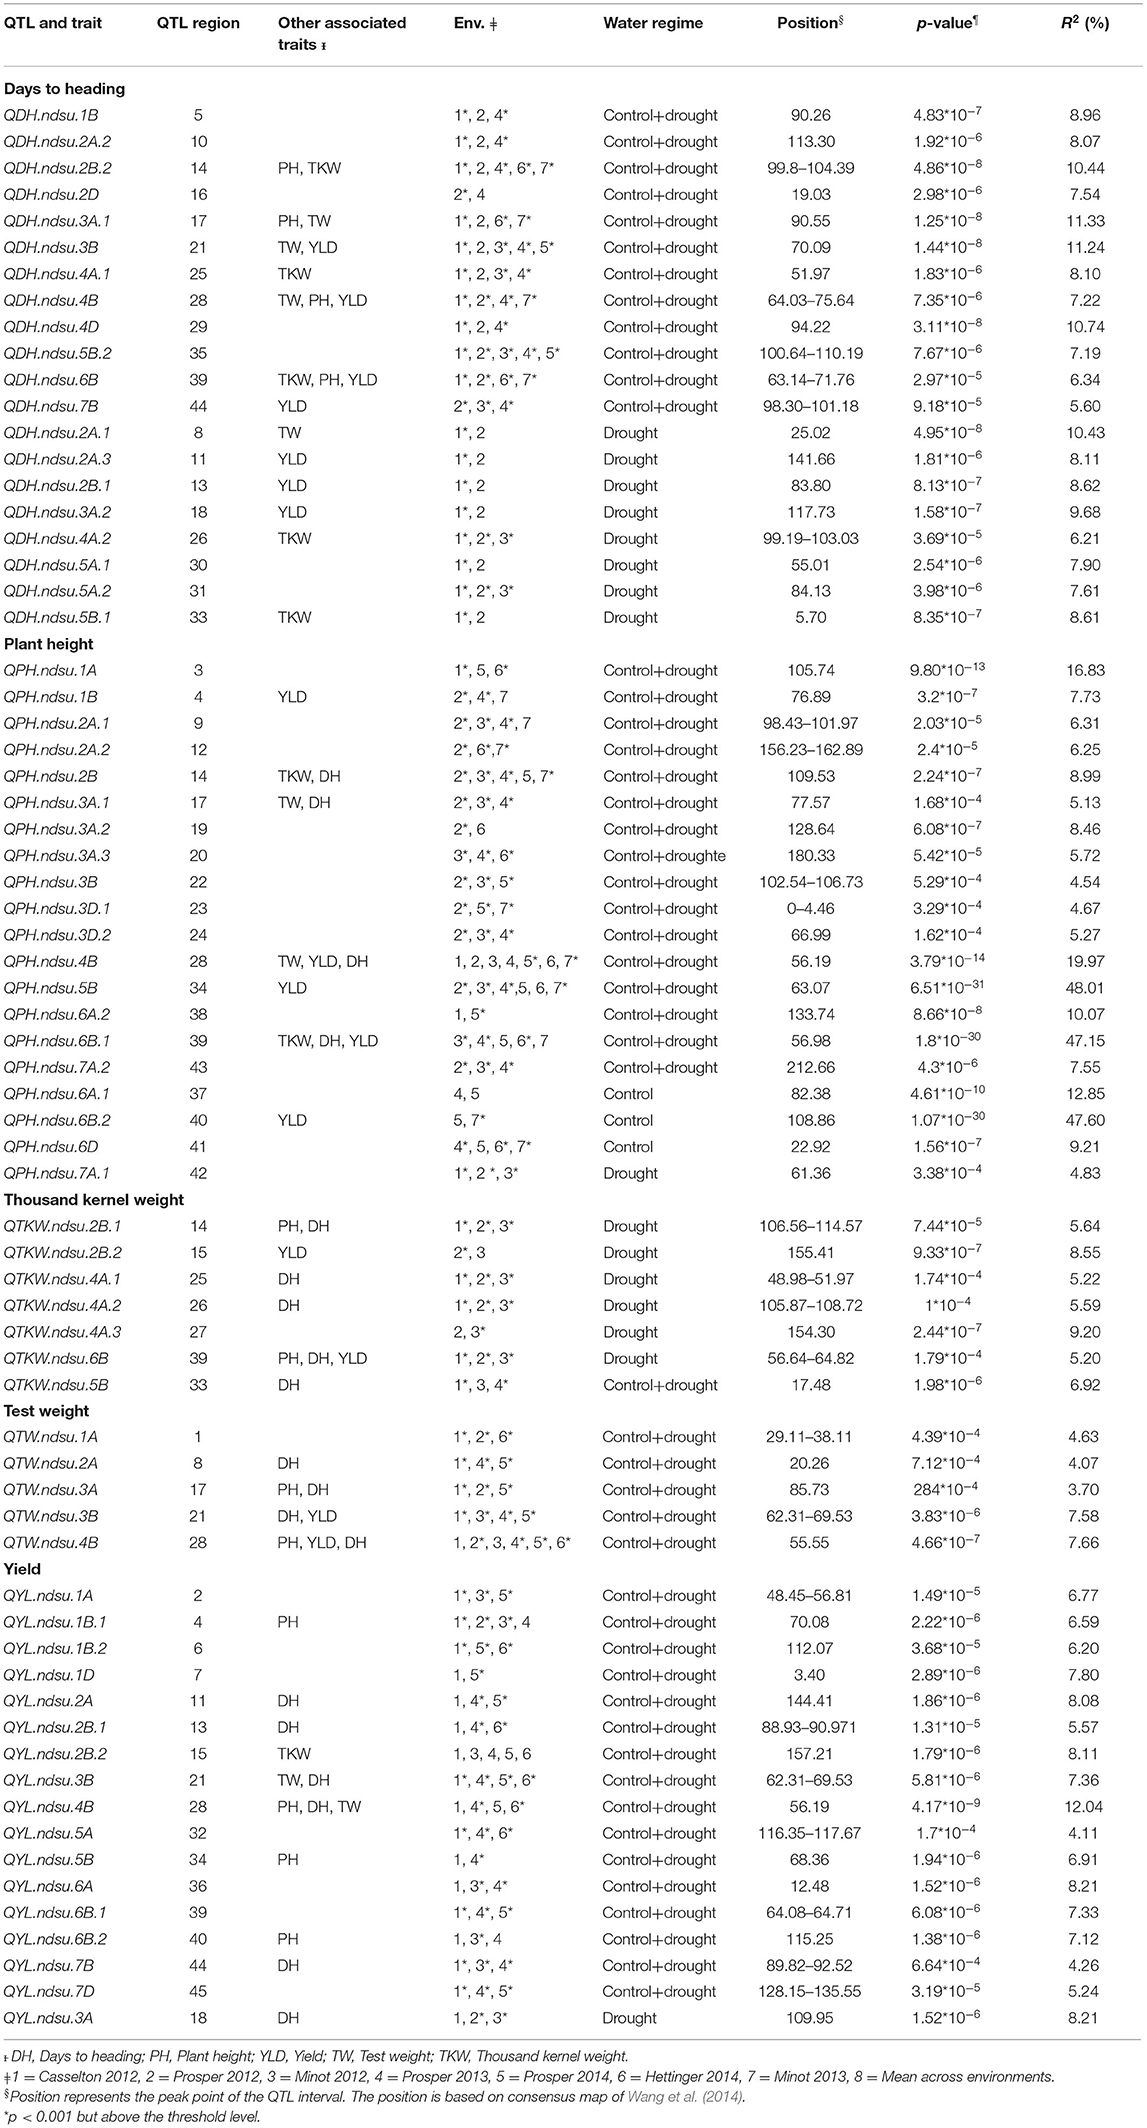
Table 4. Marker-trait associations (QTL) identified for yield and related traits under different environments in this study.
Seventeen QTL were identified for YLD. These QTL explained 4.11–12.04% of PV (Table 4). Only one QTL, located on chromosome 4B, had a major effect. Sixteen QTL were identified as constitutive, and the remaining QTL was identified in the drought-prone experimental sites. Five QTL were associated with TW. All of these QTL had minor effects, explaining 3.7–7.66% of PV. All of the QTL identified were constitutive. Seven QTL were identified for TKW, all of which had minor effects, explaining from 5.2 to 9.2% of PV. One QTL among them was constitutive, and the remaining six were identified in the drought-prone environments (Table 4).
The sequence of 69 markers associated with QTL was mined from Wang et al. (2014) to identify their physical position in the Chinese_Spring_IWGSC_RefSeq1.0 (Appels et al., 2018). Out of 69, seven markers (BobWhite_c47948_76, D_contig00840_473, Kukri_c15043_326, Excalibur_c25353_1171, Ex_c3115_2742, Excalibur_rep_c92985_510, Excalibur_c56240_176) were manually anchored on the genome. A total of 47 SNPs were anchored in the predicted gene space, and 22 were found in the intergenic region (Supplementary Table 4). For these intergenic SNPs, we identified the most proximal flanking genes representing the possible linked gene contributing to the phenotype. Thus, a total of 91 AM-QTL-associated most proximal genes along with their predicted function and genome orientation (Table 5) were mined from the genome. Using the expVIP analysis (Ramírez-González et al., 2018, Borrill et al., 2016), we explored the in silico expression of these genes affected by drought stress (Supplementary Figure 3) which could be used to prioritize the candidate genes. However, for breeding purposes all the MTAs are valuable.
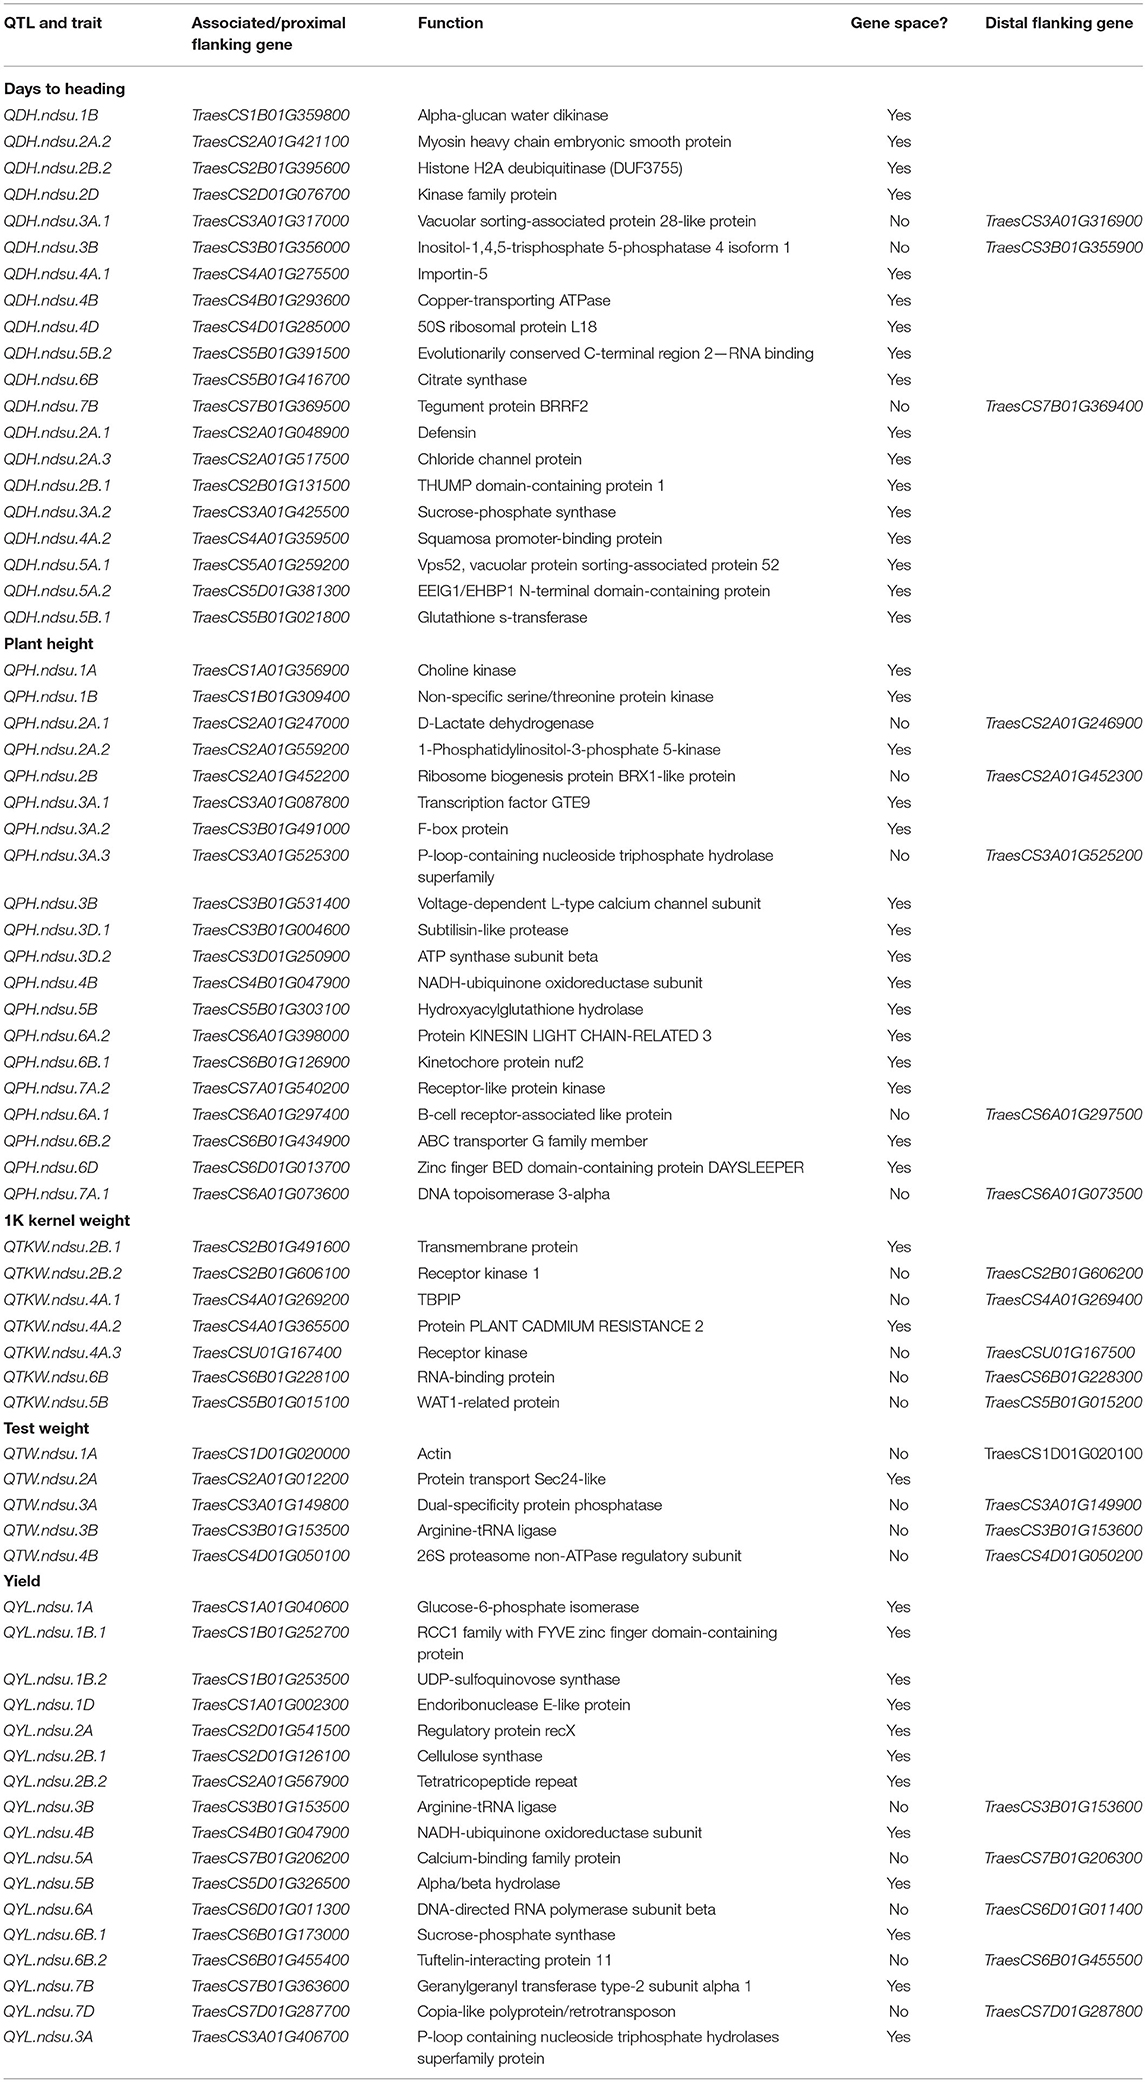
Table 5. List of candidate genes associated with QTL identified in this study.
Discussion
Association Analyses
Studies are conducted to dissect the genetics of drought tolerance in many crops including wheat, and it is well-known that drought tolerance is a complex quantitative trait affected by genetic and environmental factors (Gahlaut et al., 2019). In this study, the iBLUP method (Yang et al., 2014b) was used to impute missing genotypic data as it was reported to tolerate a high rate of missing data especially for rare alleles, compared to the common imputation methods. High-density single-nucleotide polymorphism (SNP) genotyping arrays explore genomic diversity and MTAs very efficiently (Wang et al., 2014). Infinium iSelect 90K assay uses more than 81,000 gene-associated SNPs to reveal polymorphism in allohexaploid wheat populations (Wang et al., 2014; Kumar et al., 2016, 2019). Higher genome coverage and resolution in the dissection of wheat's agronomic traits are possible using this genotypic tool (Kirigwi et al., 2007; Alexander et al., 2012; Ibrahim et al., 2012b). The marker density found in this study (0.49 cM/marker) was in agreement with the previous studies using the 90K Infinium iSelect assay (Wang et al., 2014; Ain et al., 2015; Kumar et al., 2016). The MLM model used in this association study has been proven to be very efficient for genome-wide association studies (GWAS) and can be used with either structure (R) or principal component (PC) analyses. This study used five PCs, which captured 25% of the variation. The MLM model, which accounts for both structure and relatedness (PC + K), was used for the marker–trait association study.
Determining the threshold for the p-value is crucial. A liberal threshold will declare a false-positive association (a type I error), whereas a too stringent threshold is likely to miss a true association (a type II error). Taking this into consideration, the initial cutoff was chosen as p ≤ 0.001, which was not very stringent. Then, the threshold (p ≤ 3.4 * 10−6) was determined using the Bonferroni correction (Yang et al., 2014a), which was very stringent. The MTAs identified at the initial cutoff and the threshold were reported if they were identified in at least two environments. This repetition of the MTA further minimized any false associations.
Use of Secondary Data to Assess Drought Conditions
Drought can be assessed by variable weather conditions, soil moisture, and crop conditions over a particular growing season (Lanceras et al., 2004). Therefore, rainfall data were collected, and the soil types of the experimental sites, which reflect soil moisture, were taken into consideration to assess drought conditions for this study. The total amount of rainfall was collected from planting date to plant physiological maturity. The dates for the physiological maturity of the plants were calculated by adding 30 days to DH (Simmons et al., 1914). Among the experimental locations, Casselton 2012, Prosper 2012, and Minot 2012 were considered to have drought conditions, whereas Prosper 2013, Minot 2013, Prosper 2014, and Hettinger 2014 were considered to have control or normal conditions. Although Minot 2012 and Prosper 2014 had about the same amount of rainfall, the soil in Prosper had a better water-holding capacity. Therefore, Minot 2012 was considered to have drought conditions.
Use of Agronomic Data to Assess Drought Tolerance
Days to Heading
Several major and minor QTL were revealed for DH, which indicated the quantitative nature of the trait. The eight QTL for DH, identified exclusively under drought conditions, could play a vital role in drought tolerance. Also, the constitutive QTL can be used for drought tolerance breeding in wheat. Some of these QTL (exclusively expressed under drought conditions, called constitutive QTL) identified in this study likely correspond with some already reported QTL associated with drought tolerance; however, further studies such as allelism test is warranted to determine their relationship. Malik et al. (2015) identified three adjacent QTL on chromosome 2A for drought tolerance related to the photosynthetic rate, cell membrane stability, and relative water content. The QTL QDH.ndsu.2A.1 in this study likely represent one of those QTL previously reported (Malik et al., 2015; Gahlaut et al., 2019), but further studies are required to determine their relationship. Two QTL identified in this study on the chromosome 3A which were important for drought tolerance, QDH.ndsu.3A.1 and QDH.ndsu.3A.2, could represent the QTL QHea.T84-3A which was earlier found to increase DH under both drought and non-drought conditions (Ibrahim et al., 2012b). Chromosomal arm 3AL also harbors a gene for earliness per se (Edae et al., 2014), associated with enhanced response to abscisic acid (ERA1), which provides drought tolerance (Edae et al., 2014). The gene ERA1, also located on chromosome 3B, could represent the QTL QDH.ndsu.3B identified in this study which is closely associated with TraesCS3B01G356000 (Table 5), putatively encoding for inositol-1,4,5-trisphosphate 5-phosphatase (InsP3). InsP3 is reported to be a second messenger in plants responding to many stimuli and has been shown to affect drought tolerance, carbohydrate metabolism, and phosphate-sensitive biomass increases in tomato (Khodakovskaya et al., 2010). In wheat, differential expression of the phospholipase C gene regulating the inositol-1,4,5-triphosphate (IP3) signal transduction pathway possibly results in the quick sensing of drought stress (Ergen et al., 2009). Kamran et al. (2013) identified a QTL, QFlt.dms-4A.1, for reduced DH at 61.2 cM on chromosome 4A, which may represent the constitutive QTL QDH.ndsu.4A.1 identified in this study. The constitutive QTL QDH.ndsu.2B.2 is located in the same region as the earlier reported QTL QCrs- (Ibrahim et al., 2012a), which deteriorate the number of root crossing in both water regimes. A QTL for drought tolerance on 4AL reported earlier by Alexander et al. (2012) may represent the QTL QDH.ndsu.4A.2, which was identified exclusively for drought-prone environments in this study. The constitutive QTL QDH.ndsu.6B was located in the same genomic location as the QTL QHea+, which was reported to reduce DH under both water conditions (Ibrahim et al., 2012b). Huang et al. (2006) reported a QTL for days to maturity, QDtm.crc-2D, which corresponded with the constitutive QTL in this study, QDH.ndsu.2D, representing the kinase family protein. However, the SNP markers associated with sucrose-phosphate synthase (TraesCS3A01G425500) and vacuolar protein sorting-associated protein (TraesCS5A01G259200, TraesCS3A01G317000) in this group (Table 5) may represent the important abiotic stress genes controlling the plant height. The QTL QDH.ndsu.5B.2 and QDH.ndsu.7B identified in this study seem to be novel.
Plant Height
The QTL QPH.ndsu.5B could represent the ortholog to the GA-insensitive dwarf gene, GID1L2, in rice, indicating the synergistic relationship of rice and wheat (Zanke et al., 2014). The major QTL for PH, QPH.ndsu.6B.1 and QPH.ndsu.6B.2, have been identified on wheat chromosome 6B, and several previous studies also reported QTL for PH on a similar location (Zanke et al., 2014; Gahlaut et al., 2019; Abou-Elwafa and Shehzad, 2021). The major QTL QPH.ndsu.4B could represent the reduced height gene Rht-B1 (Wilhelm, 2011), which was reported to be on the short arm of chromosome 4B. This gene encodes the DELLA protein that reduces a plant's sensitivity to gibberellin (GA), thereby reducing stalk length and making the plant semi-dwarf. The QTL QPH.ndsu.1A, QPH.ndsu.2A.1, QPH.ndsu.6A.2, and QPH.ndsu.3A.3 could represent the QTL for PH reported earlier by Zanke et al. (2014). The QTL QPH.ndsu.3A.2 and QPH.ndsu.3D.2, important for drought tolerance, could be the same as those reported by Ibrahim et al. (2012a). Liu et al. (2011) identified a QTL for PH, QHt-3B, which could occupy the same region as the QTL QPH.ndsu.3B in the study. The QTL QPH.ndsu.7A.1 coincided with the earlier reported QTL QHt.crc-7A (McCartney et al., 2005). The QTL QPH.ndsu.7A.2 in a receptor-like kinase gene (TraesCS7A01G540200) and QPH.ndsu.3D.1 in a subtilisin-like protease (Table 5) in this study did not correspond with any reported QTL and hence could be novel.
YLD
In the past, Edae et al. (2014) reported a QTL for TKW on chromosome 1BL and a QTL for TW on chromosome 2BL that could be in the region of QTL QYL.ndsu.1B.1 and QYL.ndsu.2B.2, respectively. More recently, Tura et al. (2020) detected a main-effect QTL, QYld.aww-1B.2, on 1B chromosome which likely represents the same locus as QYL.ndsu.1B.1; however, further research is warranted to determine their relationship. Ibrahim et al. (2012a) identified a QTL, QCrs.D84-2B, on chromosome 2B at 93.4 cM that deteriorates the number of root crossings under both water regimes and could represent the QTL QYL.ndsu.2B.1 (TraesCS2D01G126100-cellulose synthase) found in this study. Another QTL for YLD QYld.T84-3Bat identified earlier (Ibrahim et al., 2012b) occupies the same location as the QTL QYL.ndsu.3B identified in this study. Another QTL, QYld.T84-3Bat 59.8, which deteriorated YLD under both water regimes, could coincide with the QTL QYL.ndsu.4B in (TraesCS4B01G047900) identified in this study. The QTL QYL.ndsu.5B and QYL.ndsu.6B.2 also likely correspond to the QTL for TW and TKW identified earlier by Edae et al. (2014). Also, the QTL QYL.ndsu.5B corresponded with the QTL QYld*, which was reported to improve YLD under drought stress (Ibrahim et al., 2012b). The QTL QYL.ndsu.1B.2 had the same genomic location as the constitutive QTL for the green leaf area reported by Edae et al. (2014). Ibrahim et al. (2012a) reported a QTL, QTgw+, which improved thousand-grain weight under both water conditions and could represent the QTL QYL.ndsu.1D. The QTL QYL.ndsu.2A likely coincides with the YLD QTL QGY.caas-2A (Li et al., 2015) or a QTL identified by Mathew et al. (2019) evaluated under drought stress conditions. Huang et al. (2006) identified the QTL QTgw.crc-6A for TKW that seems to be present at the same location as the QTL QYL.ndsu.6A identified in this study. The QTL QYL.ndsu.7D corresponded with the QTL QHi+, which was reported to improve the harvest index under both water conditions (Ibrahim et al., 2012b).
TW
The QTL QTW.ndsu.4B could be the same QTL earlier reported by Li et al. (2016) on the same chromosome. The QTL QTW.ndsu.1A corresponded with two QTL for YLD, QYld.abrii-1A1.2 (Azadi et al., 2014) and QGY.caas-1A (Li et al., 2015). The constitutive QTL QTW.ndsu.2A occupied the same genomic region as the QTL for drought tolerance related to the photosynthetic rate reported by Malik et al. (2015). The QTL QTW.ndsu.3B corresponded with the YLD QTL QYld.T84-3Bat reported by Ibrahim et al. (2012b).
TKW
The QTL QTKW.ndsu.4A.2 had the same genomic location as the QTL reported by Kirigwi et al. (2007) for YLD and YLD-related traits under drought stress. Ibrahim et al. (2012a) identified the QTgw- for thousand-grain weight under both water conditions, which seems to represent the QTL QTKW.ndsu.6B identified in this study. The QTL QTKW.ndsu.2B.1, QTKW.ndsu.2B.2, and QTKW.ndsu.4A.3 could be the same QTL for thousand-grain weight reported by Zanke et al. (2015). The QTL QTKW.ndsu.4A.1 and QTKW.ndsu.5B seem to be novel QTL as they do not correspond with any reported QTL.
Conclusions
This study revealed 69 QTL, which included 50 constitutive QTL, three QTL identified for the control water regime, and 16 QTL exclusively under the drought conditions (Table 4; Supplementary Figure 2). These 16 QTL could be used for developing lines suitable for drought conditions. We also reported the QTL-associated genes, their physical positions, and predicted functions along with in silico expression prediction in abiotic stress conditions (Supplementary Figure 3). Chromosome 5B, 6B, and 4B seem to be very important for drought tolerance by reducing PH and increasing YLD and YLD-related traits. Several identified QTL occupied genomic regions reported earlier for earliness per se, drought tolerance, and reduced height. The consistency of some QTL in the different environments indicated their validity. Overall, this study provides valuable genetic and genomic resources to the breeders to design programs to breed drought-tolerant wheat cultivars, combining traditional and genomics-based approaches.
Data Availability Statement
The list of markers and their genotypic data is available at figshare, doi: 10.6084/m9.figshare.14195348 and also in the Supplementary Table 3.
Author Contributions
SR: data collection, analysis, and major write-up of the manuscript. SM: data collection and analysis. AK: data analyses, manuscript write-up, and review. EE, SK, and SSi: data analysis and manuscript review. MA and AM: data and manuscript review. SSo and SSa: data analysis and write-up. MM: conceptualization and design of the experiment, phenotypic data collection, and manuscript write-up and review. All authors contributed to the article and approved the submitted version.
Conflict of Interest
The authors declare that the research was conducted in the absence of any commercial or financial relationships that could be construed as a potential conflict of interest.
Acknowledgments
The authors thank Late Dr. J. J. Hammond, Dr. A. El-Fatih El Dolfey, J. Underdahl, M. Abdallah, A. Walz, T. Selland, D. Olsen, K. McMonagle, C. Cossette, K. Dickey, K. Whitney, and K. Beck for their help and support. We would also like to thank the technical support team in the NDSU Research Centers at Minot, Williston, and Hettinger and at the Agronomy Farm at Casselton and Prosper for their help and supporting to conduct field trials. The authors would also like to thank Dr. Shiaoman Chao and Mary Osenga of Small Grains Genotyping Lab at USDA-ARS, Fargo, ND, for genoyping our samples using 90 K Infinium assay.
Supplementary Material
The Supplementary Material for this article can be found online at: https://www.frontiersin.org/articles/10.3389/fgene.2021.649988/full#supplementary-material
References
Abou-Elwafa, S. F., and Shehzad, T. (2021). Genetic diversity, GWAS and prediction for drought and terminal heat stress tolerance in bread wheat (Triticum aestivum L.). Genet. Resour. Crop Evol. 68, 711–728. doi: 10.1007/s10722-020-01018-y
Ain, Q. U., Rasheed, A., Anwar, A., Mahmood, T., Imtiaz, M., Xia, X., et al. (2015). Genome-wide association for grain yield under rainfed conditions in historical wheat cultivars from Pakistan. Front. Plant Sci. 6:743. doi: 10.3389/fpls.2015.00743
Alaux, M., Rogers, J., Letellier, T., Flores, R., Alfama, F., Pommier, C., et al. (2018). Linking the International Wheat Genome Sequencing Consortium bread wheat reference genome sequence to wheat genetic and phenomic data. Genome Biol. 19, 1–10. doi: 10.1186/s13059-018-1491-4
Alexander, L. M., Kirigwi, F. M., Fritz, A. K., and Fellers, J. P. (2012). Mapping and quantitative trait loci analysis of drought tolerance in a Spring wheat population using amplified fragment length polymorphism and diversity array technology markers. Crop Sci. 52, 253–261. doi: 10.2135/cropsci2011.05.0267
Appels, R., Eversole, K., Stein, N., Feuillet, C., Keller, B., Rogers, J., et al. (2018). Shifting the limits in wheat research and breeding using a fully annotated reference genome. Science 361:eaar7191. doi: 10.1126/science.aar7191
Azadi, A., Mardi, M., Hervan, E. M., Mohammadi, S. A., Moradi, F., Tabatabaee, M. T., et al. (2014). QTL Mapping of yield and yield components under normal and salt-stress conditions in bread wheat (Triticum aestivum L.). Plant Mol. Biol. Rep. 33, 102–120. doi: 10.1007/s11105-014-0726-0
Ballesta, P., Mora, F., and Pozo, A. D. (2020). Association mapping of drought tolerance indices in wheat: QTL-rich regions on chromosome 4A. Sci. Agric. 77, 2. doi: 10.1590/1678-992x-2018-0153
Blake, V. C., Birkett, C., Matthews, D. E., Hane, D. L., Bradbury, P., and Jannink, J. L. (2016). The triticeae toolbox: combining phenotype and genotype data to advance small-grains breeding. Plant Genome 9:99. doi: 10.3835/plantgenome2014.12.0099
Blake, V. C., Woodhouse, M. R., Lazo, G. R., Odell, S. G., Wight, C. P., Tinker, N. A., et al. (2019). GrainGenes: centralized small grain resources and digital platform for geneticists and breeders. Database 2019:baz065. doi: 10.1093/database/baz065
Borrill, P., Ramirez-Gonzalez, R., and Uauy, C. (2016). expVIP: a customizable RNA-seq data analysis and visualization platform. Plant Physiol. 170, 2172–2186. doi: 10.1104/pp.15.01667
Bradbury, P. J., Zhang, Z., Kroon, D. E., Casstevens, T. M., Ramdoss, Y., and Buckler, E. S. (2007). Genetics and population analysis TASSEL: software for association mapping of complex traits in diverse samples. Bioinformatics 23, 2633–2635. doi: 10.1093/bioinformatics/btm308
Brenchley, R., Spannagl, M., Pfeifer, M., Barker, G. L., D'amore, R., Allen, A. M., et al. (2012). Analysis of the bread wheat genome using whole-genome shotgun sequencing. Nature 491, 705–710. doi: 10.1038/nature11650
Climate Change the Economy (2008). North Dakota Assessing the costs of Climate Change. Washington, DC: National Conference of State Legislatures. Available online at: http://www.ncsl.org/print/environ/ClimateChangeND.pdf (accessed December 15, 2016).
Dodig, D. M, Zoric, B., Kobiljski, J., Savic, V., Kandic, S., Quarrie, S., and Barnes, J. (2012). Genetic and association mapping study of wheat agronomic traits under contrasting water regimes. Int. J. Mol. Sci. 13:6167–6188. doi: 10.3390/ijms13056167
Edae, E. A., Byrne, P. F., Haley, S. D., Lopes, M. S., and Reynolds, M. P. (2014). Genome-wide association mapping of yield and yield components of spring wheat under contrasting moisture regimes. Theor. Appl. Genet. 127, 791–807. doi: 10.1007/s00122-013-2257-8
Edae, E. A., Byrne, P. F., Manmathan, H., Haley, S. D., Moragues, M., Lopes, M. S., et al. (2013). Association mapping and nucleotide sequence variation in five drought tolerance candidate genes in spring wheat. Plant Genome 6:13. doi: 10.3835/plantgenome2013.04.0010
Ergen, N. Z., and Budak, H. (2009). Sequencing over 13,000 expressed sequence tags from six subtractive cDNA libraries of wild and modern wheats following slow drought stress. Plant Cell Env. 32, 220–236 doi: 10.1111/j.1365-3040.2008.01915.x
Ergen, N. Z., Thimmapuram, J., Bohnert, H. J., and Budak, H. (2009). Transcriptome pathways unique to dehydration tolerant relatives of modern wheat. Funct. Integr. Genomics 9, 377–396. doi: 10.1007/s10142-009-0123-1
Frazen, D. W. (2003). North Dakota Soil and Fertilizer Handbook. Fargo, ND: North Dakota State University.
Gahlaut, V., Jaiswal, V., Singh, S., Balyan, H. S., and Gupta, P. K. (2019). Multi-locus genome wide association mapping for yield and its contributing traits in hexaploid wheat under different water regimes. Sci. Rep. 9:19486. doi: 10.1038/s41598-019-55520-0
Hertel, T. W. (2011). The global supply and demand for agricultural land in 2050: a perfect storm in the making?. Am. J. Agric. Econ. 93, 259–275. doi: 10.1093/ajae/aaq189
Huang, X. Q., Cloutier, S., Lycar, L., Radovanovic, N., Humphreys, D. G., Noll, J. S., et al. (2006). Molecular detection of QTLs for agronomic and quality traits in a doubled haploid population derived from two Canadian wheats (Triticum aestivum L.). Theor. Appl. Genet. 113, 753–766. doi: 10.1007/s00122-006-0346-7
Ibrahim, S. E., Schubert, A., Pillen, K., and Léon, J. (2012a). QTL analysis of drought tolerance for seedling root morphological traits in an advanced backcross population of spring wheat. Int. J. Agri. Sci. 2, 619–629.
Ibrahim, S. E., Schubert, A., Pillen, K., and Léon, J. (2012b). Comparison of QTLs for drought tolerance traits between two advanced backcross populations of spring wheat. Int. J. Agri. Sci. 2, 216–227.
Kamran, A., Iqbal, M., Navabi, A., Randhawa, H., Pozniak, C., and Spaner, D. (2013). Earliness per se QTLs and their interaction with the photoperiod insensitive allele Ppd-D1a in the Cutler × AC Barrie spring wheat population. Theor. Appl. Genet. 126, 1965–1976. doi: 10.1007/s00122-013-2110-0
Khodakovskaya, M., Sword, C., Wu, Q., Perera, I. Y., Boss, W. F., Brown, C. S., et al. (2010). Increasing inositol (1, 4, 5)-trisphosphate metabolism affects drought tolerance, carbohydrate metabolism and phosphate-sensitive biomass increases in tomato. Plant Biotechnol. J. 8, 170–183. doi: 10.1111/j.1467-7652.2009.00472.x
Kirigwi, F. M., Van Ginkel, M., Brown-Guedira, G., Gill, B. S., Paulsen, G. M., and Fritz, A. K. (2007). Markers associated with a QTL for grain yield in wheat under drought. Mol. Breed. 20, 401–413. doi: 10.1007/s11032-007-9100-3
Kumar, A., Mantovani, E., Simsek, S., Jain, S., Elias, E. M., and Mergoum, M. (2019). Genome wide genetic dissection of wheat quality and yield related traits and their relationship with grain shape and size traits in an elite × non-adapted bread wheat cross. PLoS ONE 14:e0221826. doi: 10.1371/journal.pone.0221826
Kumar, A., Mantovani, E. E., Seetan, R., Soltani, A., Echeverry-Solarte, M., Jain, S., et al. (2016). Dissection of genetic factors underlying wheat kernel shape and size in an elite × nonadapted cross using a high density SNP linkage map. Plant Genome 9:81. doi: 10.3835/plantgenome2015.09.0081
Lanceras, J. C., Pantuwan, G., Jongdee, B., and Toojinda, T. (2004). Quantitative trait loci associated with drought tolerance at reproductive stage in rice. Plant Physiol. 135, 384–399. doi: 10.1104/pp.103.035527
Li, C., Bai, G., Chao, S., Carver, B., and Wang, Z. (2016). Single nucleotide polymorphisms linked to quantitative trait loci for grain quality traits in wheat. Crop J. 4, 1–11. doi: 10.1016/j.cj.2015.10.002
Li, X. M., Xia, X. C., Xiao, Y. G., He, Z. H., Wang, D. S., Trethowan, R., et al. (2015). QTL mapping for plant height and yield components in common wheat under water limited and full irrigation environments. Crop Pasture Sci. 67, 660–670. doi: 10.1071/CP14236
Lipka, A. E., Tian, F., Wang, Q., Peiffer, J., Li, M., Bradbury, P. J., et al. (2012). GAPIT: genome association and prediction integrated tool. Bioinformatics 28, 2397–2399. doi: 10.1093/bioinformatics/bts444
Liu, G., Xu, S. B., Ni, Z. F., Xie, C. J., Qin, D. D., Li, J., et al. (2011). Molecular dissection of plant height QTLs using recombinant inbred lines from hybrids between common wheat (Triticum aestivum L.) and spelt wheat (Triticum spelta L.). Chin. Sci. Bull. 56, 1897–1903. doi: 10.1007/s11434-011-4506-z
Malik, S., Malik, T. A., and Engineering, G. (2015). Genetic mapping of potential QTLs associated with drought tolerance in wheat. J. Anim. Plant Sci. 25, 1032–1040.
Mathew, I., Shimelis, H., Shayanowako, A. II., Laing, M., and Chaplot, V. (2019). Genome-wide association study of drought tolerance and biomass allocation in wheat. PLoS ONE 14:e0225383. doi: 10.1371/journal.pone.0225383
Maulana, F., Huang, W., Anderson, J. D., and Ma, X. (2020). Genome wide association mapping of seedling drought tolerance in winter wheat. Front. Plant Sci. 11:573786. doi: 10.3389/fpls.2020.573786
McCartney, C. A., Somers, D. J., Humphreys, D. G., Lukow, O., Ames, N., Noll, J., et al. (2005). Mapping quantitative trait loci controlling agronomic traits in the spring wheat cross RL4452x'AC Domain'. Genome 48, 870–883. doi: 10.1139/g05-055
North Dakota Agricultural Weather Network (NDAWN) (2015). Available at: https://ndawn.ndsu.nodak.edu
North Dakota Wheat Commission (2016). Building Bigger Better Mark. Available online at: http://www.ndwheat.com/buyers/default.asp?ID=294 (verified 15 December 2016).
Pritchard, J. K., Stephens, M., and Donnelly, P. (2000). Inference of population structure using multilocus genotype data. Genetics 155, 945–959 doi: 10.1093/genetics/155.2.945
Ramírez-González, R. H., Borrill, P., Lang, D., Harrington, S. A., Brinton, J., Venturini, L., et al. (2018). The transcriptional landscape of polyploid wheat. Science 361:6089. doi: 10.1126/science.aar6089
Sapkota, S., Hao, Y., Johnson, J., Buck, J., Aoun, M., and Mergoum, M. (2019). Genome-wide association study of a worldwide collection of wheat genotypes reveals novel quantitative trait loci for leaf rust resistance. Plant Genome 12:190033. doi: 10.3835/plantgenome2019.05.0033
Simmons, S. R., Oelke, E. A., and Anderson, P. M. (1914). Growth and Development Guide for Spring Wheat, AG-FO-2547. Minneapolis, MN: Agricultural Extension at the University of Minnesota.
Sun, Y., Solomon, S., Dai, A., and Portmann, R. W. (2006). How often does it rain? J. Clim. 19, 916–934. doi: 10.1175/JCLI3672.1
Tura, H., Edwards, J., Gahlaut, V., Garcia, M., Sznajder, B., Baumann, U., et al. (2020). QTL analysis and fine mapping of a QTL for yield-related traits in wheat grown in dry and hot environments. Theor. Appl. Genet. 133, 239–257 doi: 10.1007/s00122-019-03454-6
Wang, S., Wong, D., Forrest, K., Allen, A., Chao, S., Huang, B. E., et al. (2014). Characterization of polyploid wheat genomic diversity using a high-density 90,000 single nucleotide polymorphism array. Plant Biotechnol. J. 12, 787–796. doi: 10.1111/pbi.12183
Wilhelm, E. (2011). Genetic Analysis of the Group IV Rht LOCI in Wheat. (Doctoral thesis) University of East Anglia, Norwich, United Kingdom.
Yang, N., Lu, Y., Yang, X., Huang, J., Zhou, Y., Ali, F., et al. (2014a). Genome wide association studies using a new nonparametric model reveal the genetic architecture of 17 agronomic traits in an enlarged maize association panel. PLoS Genet. 10:e1004573. doi: 10.1371/journal.pgen.1004573
Yang, Y., Wang, Q., Chen, Q., Liao, R., Zhang, X., Yang, H., et al. (2014b). A new genotype imputation method with tolerance to high missing rate and rare variants. PLoS ONE 9:1025. doi: 10.1371/journal.pone.0101025
Yu, J., and Buckler, E. S. (2006). Genetic association mapping and genome organization of maize. Curr. Opin. Biotechnol. 17, 155–160 doi: 10.1016/j.copbio.2006.02.003
Zanke, C. D., Ling, J., Plieske, J., Kollers, S., Ebmeyer, E., Korzun, V., et al. (2014). Whole genome association mapping of plant height in winter wheat (Triticum aestivum L.). PLoS ONE 9:e113287. doi: 10.1371/journal.pone.0113287
Keywords: drought tolerance, hard red spring wheat, association mapping, quantitative trait loci, marker-assisted selection
Citation: Rabbi SMHA, Kumar A, Mohajeri Naraghi S, Simsek S, Sapkota S, Solanki S, Alamri MS, Elias EM, Kianian S, Missaoui A and Mergoum M (2021) Genome-Wide Association Mapping for Yield and Related Traits Under Drought Stressed and Non-stressed Environments in Wheat. Front. Genet. 12:649988. doi: 10.3389/fgene.2021.649988
Received: 06 January 2021; Accepted: 28 April 2021;
Published: 22 June 2021.
Edited by:
Vijay Kumar Tiwari, University of Maryland, United StatesReviewed by:
Amita Mohan, University of Pennsylvania, United StatesGautam Saripalli, Chaudhary Charan Singh University, India
Copyright © 2021 Rabbi, Kumar, Mohajeri Naraghi, Simsek, Sapkota, Solanki, Alamri, Elias, Kianian, Missaoui and Mergoum. This is an open-access article distributed under the terms of the Creative Commons Attribution License (CC BY). The use, distribution or reproduction in other forums is permitted, provided the original author(s) and the copyright owner(s) are credited and that the original publication in this journal is cited, in accordance with accepted academic practice. No use, distribution or reproduction is permitted which does not comply with these terms.
*Correspondence: Mohamed Mergoum, bW1lcmdvdW1AdWdhLmVkdQ==; Ajay Kumar, YWpheS5rdW1hci4yQG5kc3UuZWR1