 Chaoju Qian1
 Xia Yan2,3
 Tingzhou Fang1,4
 Xiaoyue Yin1,4
 Shanshan Zhou1,4
 Xingke Fan1,4
 Yuxiao Chang5
 Xiao-Fei Ma1,2*
- 1Key Laboratory of Stress Physiology and Ecology in Cold and Arid Regions, Gansu Province, Department of Ecology and Agriculture Research, Northwest Institute of Eco-Environment and Resources, Chinese Academy of Sciences, Lanzhou, China
- 2School of Life Sciences, Nantong University, Nantong, China
- 3Key Laboratory of Eco-hydrology of Inland River Basin, Northwest Institute of Eco-Environment and Resources, Chinese Academy of Sciences, Lanzhou, China
- 4College of Resources and Environment, University of Chinese Academy of Sciences, Beijing, China
- 5Agricultural Genomics Institute at Shenzhen, Chinese Academy of Agricultural Sciences, Shenzhen, China
Natural selection is a significant driver of population divergence and speciation of plants. Due to local adaptation to geographic regions with ecological gradients, plant populations harbored a wide range of adaptive genetic variation to enable them to survive the heterogeneous habitats. This is all the more necessary for desert plants, as they must tolerant more striking gradients of abiotic stresses. However, the genomic mechanism by which desert plants adapt to ecological heterogeneity remains unclear, which could help to guide the sustainability of desert ecosystems. Here, using restriction-site-associated DNA sequencing in 38 natural populations, we investigated the genomic divergence and environmental adaptation of sand rice, Agriophyllum squarrosum, an annual pioneer species that covers sand dunes in northern China. Population genetic structure analyses showed that sand rice could be divided into three geographically distinct lineages, namely, Northwest, Central, and East. Phylogeographic analyses revealed that the plant might originate locally in Bergen County and further differentiated into the East lineage and then the Central lineage. Ecological niche modeling found that different lineages occupied distinct ecological niches, suggesting that the ecological gradient would have triggered genomic differentiation among sand rice lineages. Ecological association study supported that the three SNPs under divergent selection were closely correlated with precipitation gradients, indicating that precipitation might be the most important stress trigger for lineage diversity in sand rice. These adaptive SNPs could be used to genotype suitable germplasms for the ecological restoration of specific desertified lands. Further analyses found that genetic structure could significantly overestimate the signals for balancing selection. Within the Central lineage, we still found that 175 SNPs could be subject to balancing selection, which could be the means by which sand rice maintains genetic diversity and adapts to multiple stresses across heterogeneous deserts and sandy lands. From a genomic point of view, this study highlighted the local and global adaptation patterns of a desert plant to extreme and heterogeneous habitats. Our data provide molecular guidance for the restoration of desertified lands in the arid and semi-arid regions of China and could facilitate the marker assistant breeding of this potential crop to mitigate climate change.
Introduction
Natural selection is acknowledged to be the main driver of population divergence and even speciation, contributing highly to the diversity of species (Dobzhansky, 1940; Darwin, 1968; Mayr, 1992; Schneider, 2000). Divergent selection is one of the most important fundamental evolutionary processes for genetic differentiation among populations, and further facilitates reproductive isolation among populations and completes speciation (Thompson, 2016; Bamba et al., 2019; Li J. L. et al., 2020). Numerous studies of plants have found that understanding local population adaptations could not only provide more information on how populations respond to divergent ecological factors but could also provide far-reaching implications for species management, conservation, and ability to cope with global climate change (Fady et al., 2016; Lázaro-Nogal et al., 2016; Rellstab et al., 2016; Escalante et al., 2020; Li L.-F. et al., 2020; Li Y. et al., 2020; Moran, 2020). The consequences and mechanisms of balancing selection in plants have seldom been addressed due to the partial or lacking genomic investigation of plant populations (Zou et al., 2017), with the exception of information on biotic interactions such as sex-determining alleles among model plants (Weis et al., 2017). However, the roles of diversifying selection and balancing selection have not been fully discussed in pioneer species for the conservation and restoration of fragile ecosystems, especially for desert ecosystems that are facing multiple stresses and climate change (Swart et al., 1998; Leemans and Eickhout, 2004).
Characterized by low biodiversity and high environmental stress, desert ecosystems are believed to be much more sensitive to climate change than other ecosystems. Thus, under conditions of rapid climate change, the sustainability of desert ecosystems is more at risk (Thomas et al., 2005; Wang et al., 2009). Furthermore, due to the long-term stresses of excessive grazing and intensive cultivation, fragile desert ecosystems have been subjected to severe erosion and land degradation (Lu et al., 2018). To prevent land degradation and eco-environmental deterioration, the Chinese government has, since 1979, successively implemented a series of ecological construction projects aimed at the restoration of desertified land, such as the Three North Shelterbelt Project, Converting Farmland to Forests, Beijing-Tianjin Sand Source Control, Grain-for-Green Program, and Key Management of Shiyang River Basin (Feng et al., 2016; Lu et al., 2018; Yin, 2018). Unfortunately, because of their poor adaptability to the local environment, these large-scale artificial forests began to decline a few decades later since afforestation (Jiang et al., 2006; Cao et al., 2010). Thus, native plant species/populations with local adaptations should be chosen to enable successful desert restoration.
Deserts in marginal monsoonal zones tend to experience frequent contractions and expansions during glacial and inter-glacial periods (Lu et al., 2013), during which times the dynamics (such as the distribution ranges and effective population size) of desert plants in this region are significantly sped up (Yin et al., 2015; Qian et al., 2016), which sheds an interesting light on the influence of climate change on the demographic history of desert plant species (Wang et al., 2013; Ignace et al., 2018; Shi et al., 2020; Yin et al., 2020). During long-term adaptation to monsoonal climate change and heterogeneous environments, those populations can be expected to harbor more valuable genetic resources. To exemplify the ways that their potential genetic resources can be evaluated across natural plant populations in different geographical and climatic zones, it is critical to fully investigate the adaptive genomic patterns within pioneer species widely distributed across desert areas. The knowledge of the molecular mechanisms for desert plants adapting to heterogeneous environments can guarantee the successful restoration of the desert ecosystems.
Sand rice (Agriophyllum squarrosum, Chenopodiaceae) is an annual plant species that is widely distributed across the sand dunes of all of the deserts and sandy lands across the Asian interior1. It can survive extremely high temperatures, drought, and sand burial (Li et al., 1992; Miao et al., 2013; Zhao et al., 2014). As a primary and pioneer species in the reversal of desertification, sand rice plays a key role in the succession of fragile desert ecosystems, which is a rich source of carbon and nitrogen in such poor soil environments and the withered plants can also reduce at least 90% of wind velocity (Ma et al., 2008; Chen et al., 2009). Sand rice also has high edible and medicinal values. Its grains provide rich and balanced nutrition that is comparable to Chenopodium quinoa, an important food resource recommended by the United Nations Food and Agriculture Organization (Chen et al., 2014). The above-ground tissues of sand rice are also rich in the active ingredients of alkaloids, polyphenols, and flavonoids, which have anti-oxidation and anti-inflammatory effects (Yin et al., 2018). Thus, this plant is believed to be an invaluable candidate species for domestication as an ideally nutritious food and non-resistant forage crop that can help mitigate future climate change. Study of multiple cpDNA fragments and nuclear ITS has shown that sand rice has significant differences in genetic structures among its geographical populations (Qian et al., 2016). Common garden experiments on sand rice have also shown that their phenotypic traits are significantly differentiated among the natural populations in a way that is highly correlated with local environmental and climatic factors (Yin et al., 2016a, b). Because only a few neutral molecular markers were used in previous studies, the fine genetic structure and mechanisms of the adaptive genomic differentiation of sand rice is still far from clear.
In this study, using restriction-site associated DNA (RAD) sequencing, we investigated population genomic diversity in natural populations of sand rice collected from almost all of the deserts and sandy lands of northern China. By precisely describing the geographical variation in genetic structure, thoroughly profiling the shifts in distribution region for each genetic lineage coordinated with changes in climate in the past and future and combining associations between genetic variation and the gradients of the ecological factors of the in situ populations, we elucidated the following issues that might affect the successful restoration of desert ecosystems: (i) because the colonization of sand rice was accompanied with the shifting of sand dunes, there existed diverse hydrothermal heterogeneity among the different deserts, so it was investigated whether the genomic differentiation in sand rice was triggered by ecological heterogeneity; (ii) it was also examined how diversifying and/or balancing selection shaped genomic differentiation among the genetic lineages, as well as whether the allele frequency of these adaptive SNPs was associated with the ecological gradient. The clarification of these questions could shed light on the construction of ideal founder populations in specific regions during desert restoration. This could also provide germplasms for breeding high-resistance plants to cope with future global climate change.
Materials and Methods
Sample Collection and DNA Extraction
A total of 187 individuals from 38 populations (3--5 individuals for each population) were collected across all deserts and sandy lands in the Asian interior, as indicated by the distribution range of sand rice from the Chinese Virtual Herbarium2 and field records (Qian et al., 2016; Figure 1 and Supplementary Table 1). Fresh leaves were dried and preserved in silica gel, and voucher specimens were deposited at the Key Laboratory of Stress Physiology and Ecology in Cold and Arid Regions, Gansu Province, Northwest Institute of Eco-Environment and Resources, Chinese Academy of Sciences. The total genomic DNA was isolated from the tissue samples with a MagCore Genomic DNA Plant Kit via MagCore® automated extraction instrument following the manufacturer’s protocol. All of the DNA quantity was assessed with Qubit assay HS kit (Life Technologies, Burlington, ON, Canada) using a Qubit v2.0 (Life Technologies).
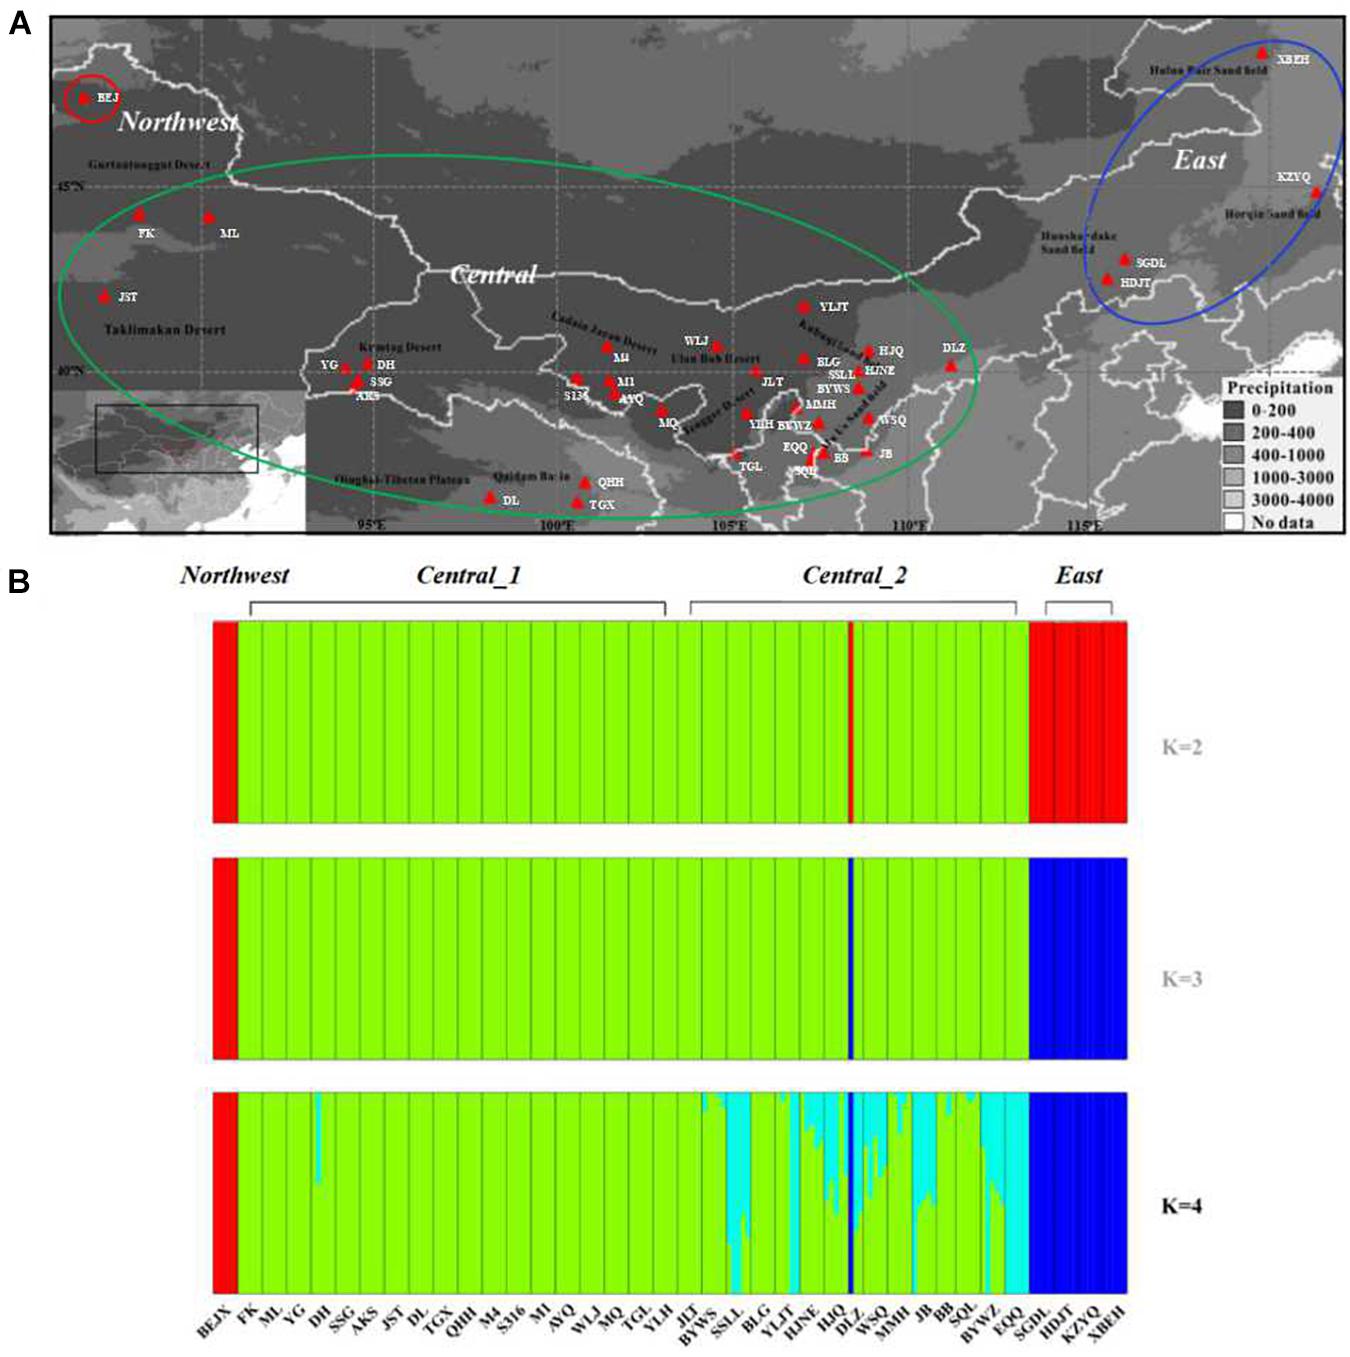
Figure 1. Geographic distribution and genetic clusters of the 38 sand rice populations used in this study. (A) Geographic distribution of the sampled sand rice populations. Populations in the red circle represent the populations were grouped into the Northwest lineage, populations in the green circle represent the populations were grouped into the Central lineage, populaitons in the blue circle represent the populations were grouped into the East lineage. (B) Population structure of the 38 sand rice populations inferred using FastStructure, based on neutral SNPs.
Library Construction and RAD Sequencing
After being examined by both double digest and single digest with different restriction enzymes, EcoRI single digest RAD libraries were prepared, following the protocol of Baird et al. (2008) for each individual. In brief, 1 μg genomic DNA was digested for 3–4 h at 37°C in a 40 μL reaction with 20 units of EcoRI restriction enzyme (specific for the G| AATTC motif) per sample. Then the digested and purified DNA was ligated to P1 barcoded adapters and was sheared to an average size of 350 bp using a Bioruptor pico. After P2 adapter ligation, to remove the adapter dimers, libraries with DNA 300–500 bp were further purified using the Qiagen Mini Elute Kit (Qiagen) according to the protocol of the manufacturer. All of the libraries were enriched with PCR amplification using KAPA Library Amplification Kits, purified again with the Qiagen Mini Elute Kit, and sequenced on a HiSeq 3000 platform (Illumina, San Diego, CA, United States) as 150 bp paired end sequences with one library per lane. The sequences generated by Illumina HiSeq 3000 are available in the NCBI Sequence Read Archive (SRA) under the accession number PRJNA693348.
Raw Data Filtering and SNP Calling
Raw reads were demultiplexed using process_radtags in Stacks Version 1.483 and the quality for each sample was checked using FastQC4. The raw reads were filtered for quality, length, and ambiguous barcodes by Skewer (Jiang et al., 2014). All of the remaining reads from each individual were further used for genotyping and SNP calling with de novo pipeline in STACKS v.0.9999 (Catchen et al., 2011). Putative orthologous loci were assembled using ustacks with a preliminary dataset set using a minimum depth of coverage to create a stack (-m) of 15. The maximum number of mismatches between two stacks in a locus in each sample (-M) was seven. The catalog of loci was assembled using cstacks with a distance allowed between loci in the catalog (-n) of five. Then, PLINK v.1.07 was used to filter the final dataset with the following criteria: (i) putative polymorphic SNPs in one population were present in all of the samples of this population and should be presented in at least 5 of the total 38 populations; (ii) to minimize the physical linkage, only one SNP was remained for per RAD tag; and (iii) SNPs with more than two alleles were discarded.
Population Genetic Diversity, Divergent Loci, Genetic Structure, and Phylogenetic Relationship Analyses
To investigate the general genetic diversity of sand rice, we used the resulting full SNP dataset with SNPs from all frequencies to estimate genetic diversity statistics, such as number of segregating sites (S), average pairwise differences (π) and Waterson’s θ (θw) in each population and geographic group, using DnaSP version 5.10.01 (Librado and Rozas, 2009).
Previous studies that used neutrality markers (ITS and five cpDNA fragments) showed significant genetic differentiation among the geographical populations of sand rice from northern China (Qian et al., 2016). Thus, to dissect the genetic basis for local adaptation among sand rice populations, two methods were used to detect the selection signals resulted by environmental heterogeneity. First, we adopted the widely used FST-based outlier approach based on the multinomial Dirichlet model, implemented in BayeScan, version 2.1 (Foll and Gaggiotti, 2008). Compared to those neutral SNPs, SNPs under diversifying selection should have higher values for FST, while balancing selection should result in lower FST values (Beaumont and Nichols, 1996; Foll and Gaggiotti, 2008). Second, we also used logistic regression models to identify the possible locus associated with environment variables with Samβada (Stucki et al., 2017). The multivariate option was chosen for data analyses, as this allows a combination of predictor variables to be simultaneously assessed and could reduce the occurrence of spurious genotypes through environment associations (Stucki et al., 2017). A total of 19 independent environmental variables at a resolution of 2.5 arc-minutes were downloaded from the WorldClim database version 1.4 (1950--2000)5, and altitude, longitude, and latitude were taken for each population for the association analyses. The significance of the outputs was assessed taking the log-likelihood ratios (G-scores) into account and was provided as the P-values derived from the χ2 test (Joost et al., 2007).
Then, based on multiple neutral SNPs but excluding SNPs that were involved in local adaptation, as described above, a Bayesian algorithm implemented in FASTSTRUCTURE (Raj et al., 2014) was used to estimate the genetic clustering (K = 2–8) with 10 replicates of 1,000,000 iterations for each K-value. The results were further analyzed with the chooseK.py script, and K = 4 was determined to be the model that best explained the variation in the data. PCA (Maćkiewicz and Ratajczak, 1993) and the FineRADStructure (Malinsky et al., 2018) were also used to check the genetic clusters. Furthermore, INSTRUCT (Gao et al., 2007) was also run for K = 2–8 in mode 2 for the joint inference of the population-selfing rate and the population substructure, as sand rice might have a high selfing rate (Qian et al., 2016).
The historic event model of the sand rice was reconstructed with ∗BEAST version 2.4.1 (Bouckaert et al., 2014) to reflect the divergence history of each sand rice lineage. The BEAUti function implemented in ∗BEAST was used to generate an input file with 5,831 neutral SNPs. A strict clock was used as the molecular clock, and the Yule model was used as the speciation prior. The best substitution model for these combined 5,831 SNPs was estimated using jModelTest version 2.1.7 (Posada, 2008). Three independent runs were carried out with the Markov chain Monte Carlo. The length was set to 80 million generations, and trees were stored every 8000 generations. Then, Tracer version 1.7.1 (Drummond and Rambaut, 2007) was used to ensure that each run converged to a similar stationary distribution, and LogCombiner version 1.7.4 (Drummond and Rambaut, 2007) was used to combine the log and tree files for each run with 10% burn-in. Finally, the maximum lineage credibility tree was summarized from consensus trees with TreeAnnotator version 1.7.5 (Drummond and Rambaut, 2007).
Ecological Niche Modeling and Identity Testing
Based on our field-work records and documents from the Chinese Virtual Herbarium (see text footnote 2), 103 non-duplicate data points were used to estimate the distribution regions, composed of 89 and 14 points for the Central and East lineages, respectively. Due to the small distribution for the Northwest ancestral lineage, with only one point, to avoid bias, this lineage was excluded from the ecological niche modeling (ENM). After removing those highly correlated bio-climatic variables (i.e., those with Pearson correlation coefficients >0.9) among the 19 climatic variables from the WorldClim database (Hijmans et al., 2005) using ENMTools version 1.4.3 (Warren et al., 2010), twelve environmental variables were retained for the subsequent analyses. The present distribution region for each lineage was estimated by maximum entropy modeling with MAXENT version 3.4.1 under 100 replicates of cross-validation with default settings (Phillips et al., 2006). The model accuracy was evaluated using the area under the receiver operating characteristics curve (AUC), which gives values from 0 (no discrimination) to 1 (perfect discrimination), where a score of 0.5 suggests that the discriminatory power of the model is no better than random prediction (Elith et al., 2006). Then the identity tests were applied to compare the similarity of the distribution models of the two lineages. First, the null hypothesis proposed that each lineage pair is distributed in an identical environmental area. Then, Schoener’s D similarity index (Schoener, 1970) and Warren’s I measure of niche overlap (Warren et al., 2008) were calculated with ENMTools. Finally, to test the significance of the divergence between the distribution models, 100 simulations were carried out for each lineage pairwise comparison. The current model was also projected into the past (LIG, ∼140 Kya and LGM, ∼21 Kya) and future (the year 2070 with moderate carbon release was chosen based on the average between the 2061 and 2080) layers to predict the potential distribution range shifts of sand rice in response to climate change.
Isolation by Distance and Isolation by Environment Testing
To evaluate the effect of geographical distance among these populations on the genetic divergence, IBD (isolation by distance) were assessed across all populations by comparing the matrices of geographic and genetic distances. In addition, to verify the effect of ecological distance on the genetic structure, IBE were also estimated among all these populations by comparing the matrices of ecological (converted to a binary factor) and genetic distance. Nineteen environmental variables at a resolution of 2.5 arc-minutes from the WorldClim database version 1.4 (1950–2000, see text footnote 5) were used to calculate the ecological distance. The genetic distances among populations were calculated with Arlequin version 3.11 (Excoffier et al., 2005). Then, to assess the statistical correlation among matrices, we applied Mantel tests with 9999 randomizations between geographic and genetic distance and between ecological and genetic distance using the dist_amova function in the GSTUDIO R package (Dyer and Nason, 2004) and mantel.partial function in VEGAN R package (Oksanen et al., 2015) among populations.
Results
SNP Discovery and Overall Genetic Variation
Restriction-site associated DNA sequencing was used to investigate the genome-wide diversity of sand rice, and the final sample set included 187 individuals who represent 38 populations (Figure 1 and Supplementary Table 1). After removing the low-quality reads and samples, we obtain a total of 666.68 million reads for 187 individuals. For each individual, the number of raw sequences reads ranged from 1.06 to 9.23 million, and the mean coverage depth ranged from 17× to 45×. On average, 94.96% of the reads were utilized in the de novo assembly of the RAD catalog, and 306,276 high quality catalogs with polymorphic sites and 1,102,051 SNPs were assembled and identified, respectively. After de novo catalog building and SNP calling filtered with those strict criteria, 6,124 SNPs were finally identified and used for further analyses.
The genetic diversity analyses shown in Table 1 showed that the number of segregate sites ranged from 2 (the HDJT and KZYQ populations) to 543 (the DLZ population) per population. Waterson’s θ (θW) was estimated to be 0.0120 (the KZYQ population) to 0.1340 (the DLZ population) for each population, and nucleotide diversity (π) ranged from 0.0103 (the SGDL population) to 0.1582 (the DLZ population). The number of haplotypes for each population ranged from 3 to 10, and the haplotype diversity ranged from 0.622 to 1.000. In general, the genetic diversity of the four populations from the sandy lands of Hunshandake, Horqin, and Hulun Buir were lower than those of populations. Further, pairwise genetic differentiation was significantly higher between these four populations and other populations (Supplementary Table 2).
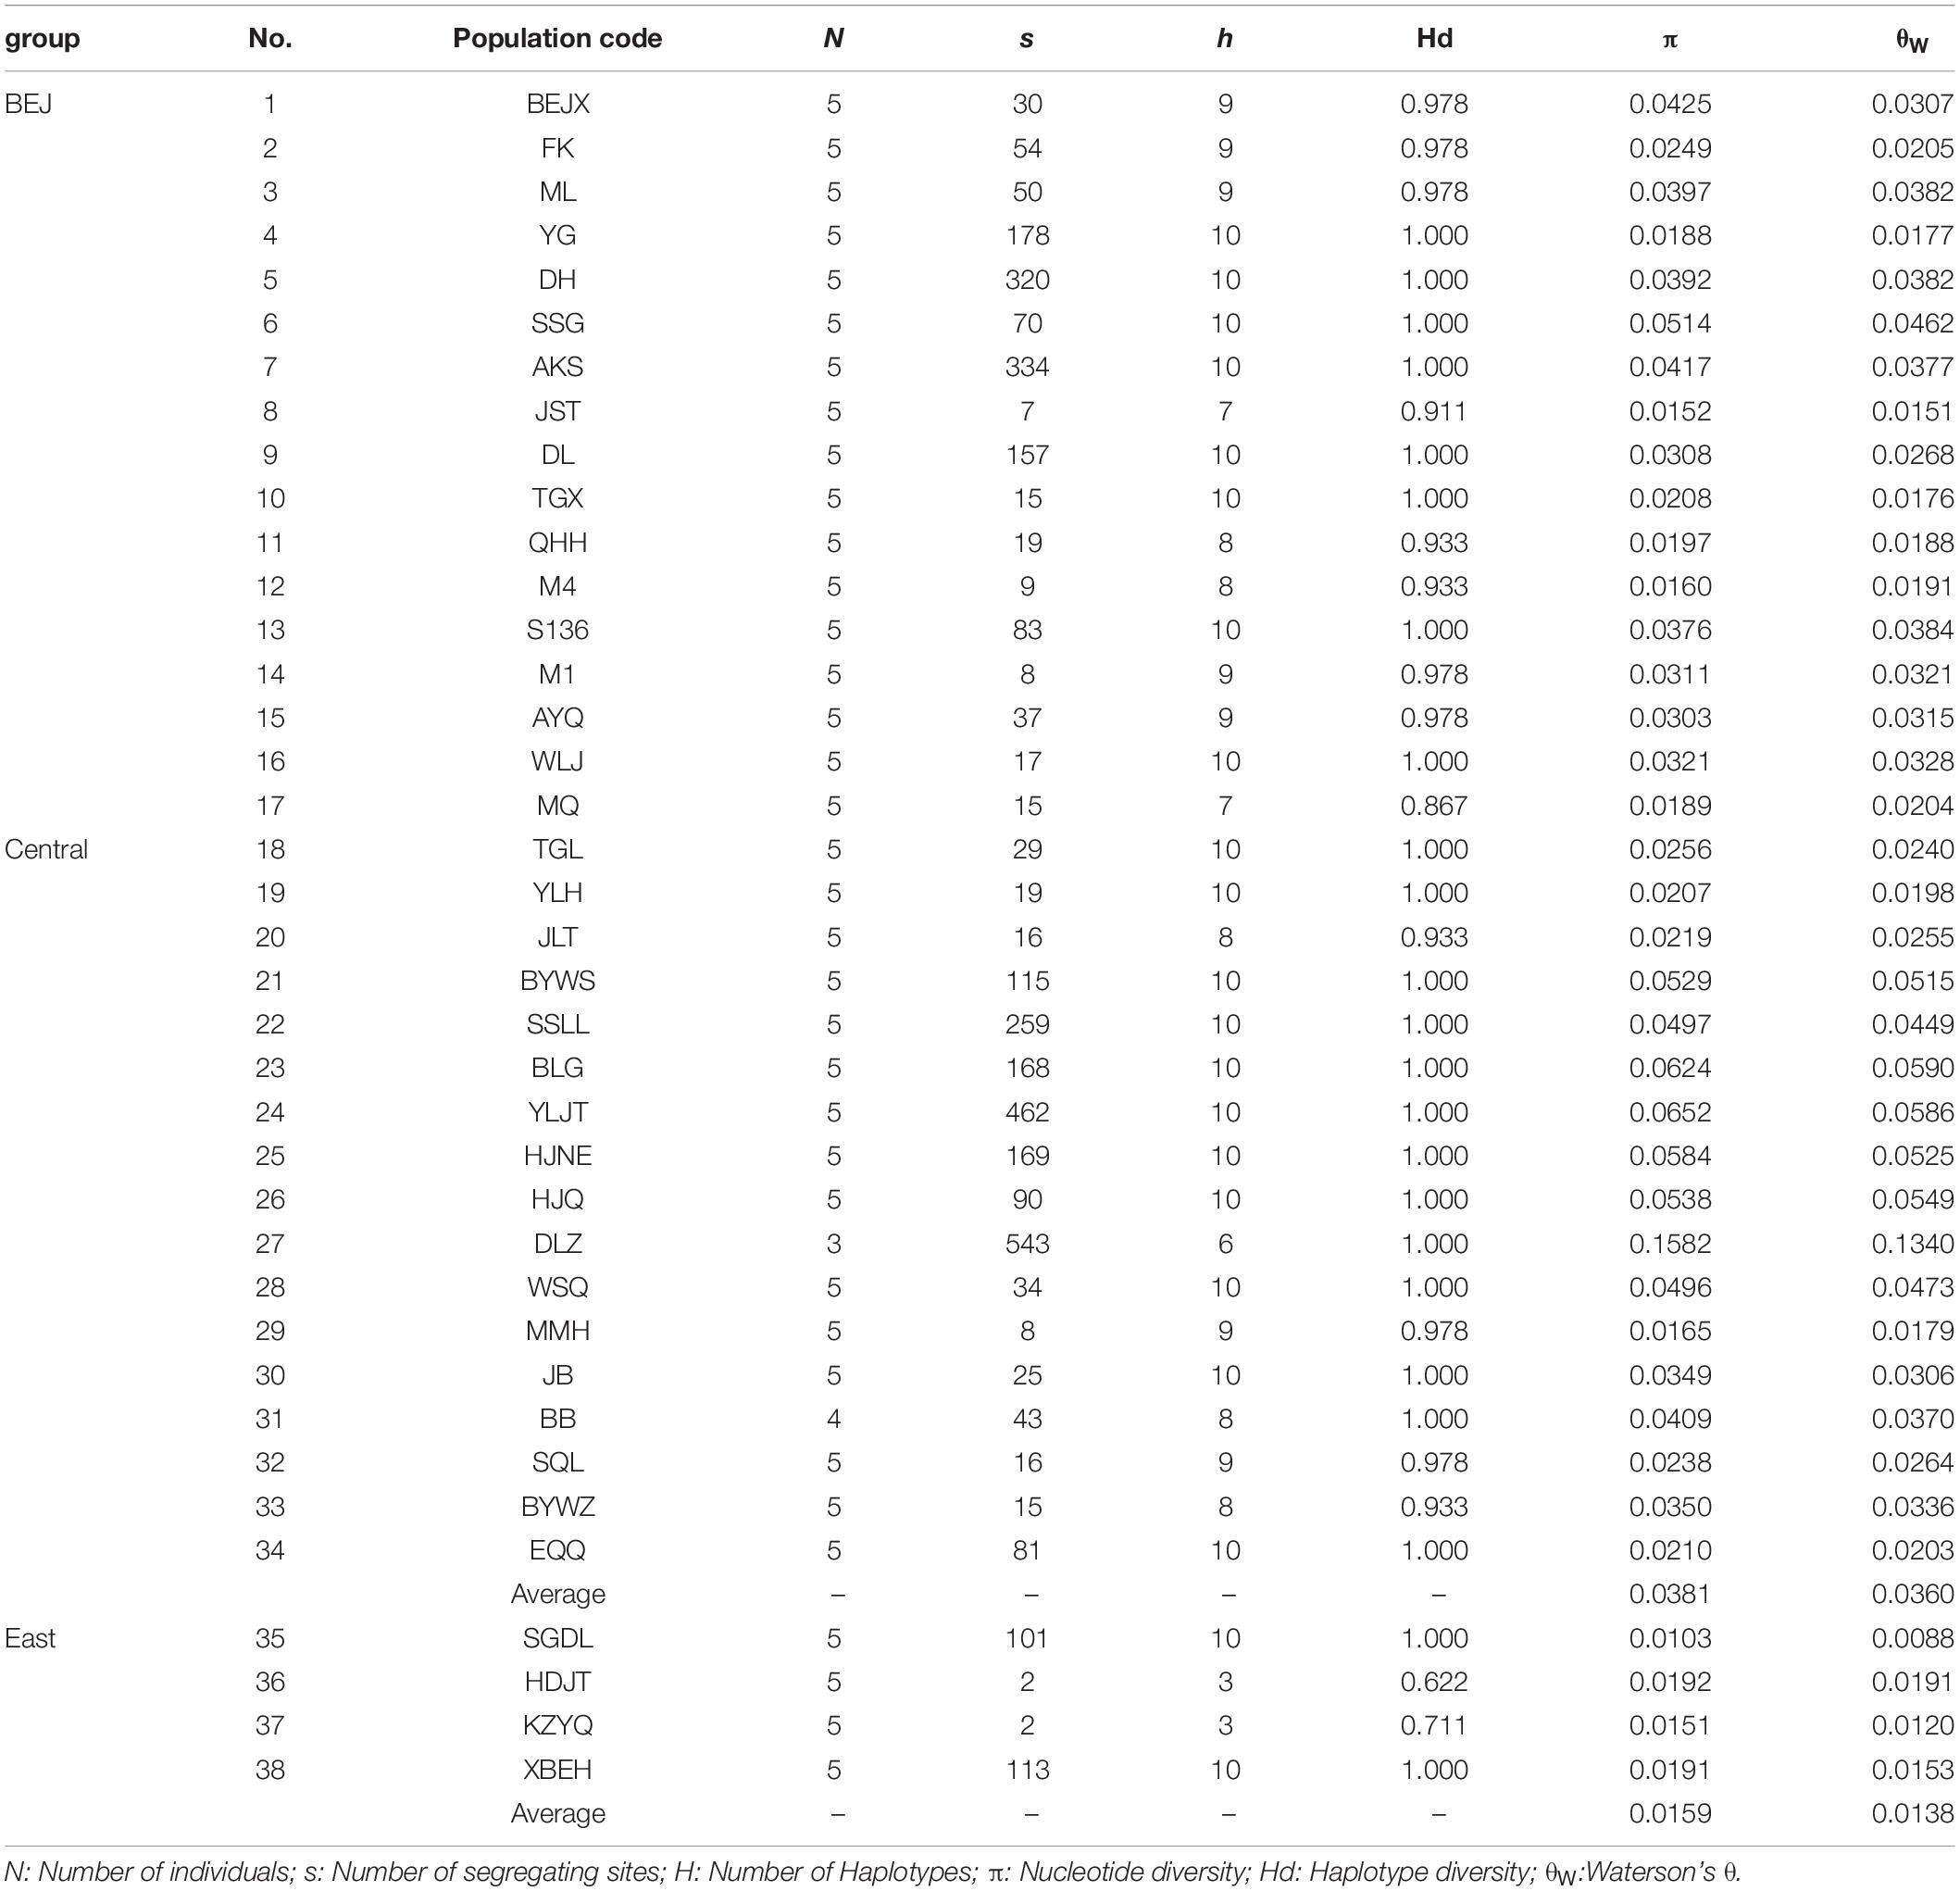
Table 1. Grouping and summary of genetic diversity of each population in A. squarrosum.
SNPs Outliers With Genetic Structure
SNPs with extreme allele frequency differences across populations were identified using FST outlier analyses to further explore the potential candidate loci under selection, and 243 outlier SNPs across all populations were detected, with a false discovery rate of 1% (Figure 2A). Among the 243 outlier SNPs, according to the criteria of BayeScan, 5 were suggested to be subject to diversifying selection, and the other 238 were subject to balancing selection. On the other hand, 717 associations between 293 SNPs outliers and 22 climate/geographic variables were identified with Samβada software by P < 0.0001 (Supplementary Table 3). Among these, 328 associations were related to temperature, 275 to precipitation, 69 to latitude, 35 to longitude, and 10 to altitude (Supplementary Table 3). The five divergent selected outlier SNPs (SNP_776, SNP_2533, SNP_3753, SNP_5540, and SNP_6016) detected by BayeScan were further identified to be associated with climate/geographic variables, and four were significantly associated with precipitation, with the exception of SNP_5540, which was associated with annual mean temperature (Supplementary Table 3). Interestingly, as shown in Figure 3, allele frequency distribution analyses of these five outlier SNPs showed a significant differentiation between semi-arid populations and those from arid regions of northern China.
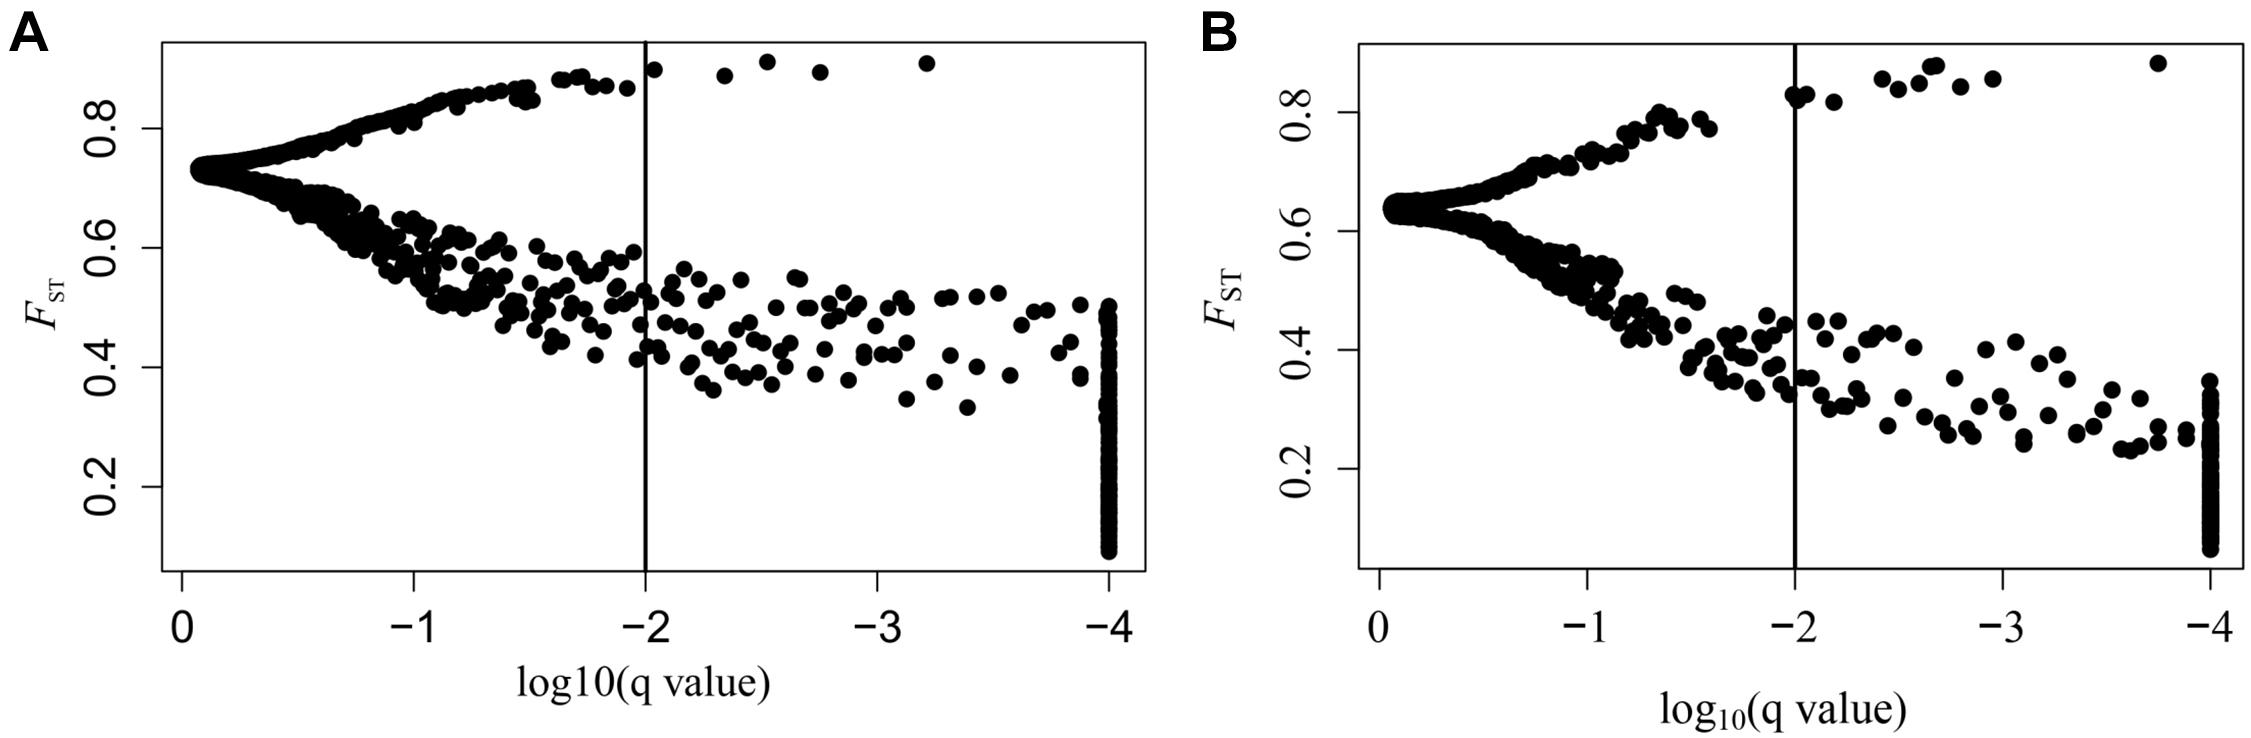
Figure 2. Results of BayeScan. (A) FST outliers of all A. squarrosum populations sampled in this study. The x-axis represents the q-value, which is standardized to log10, and the y-axis represents FST values. (B) FST outliers of sand rice populations of the Central lineage. The x-axis represents the q-value, which is standardized to log10, and the y-axis represents FST values.
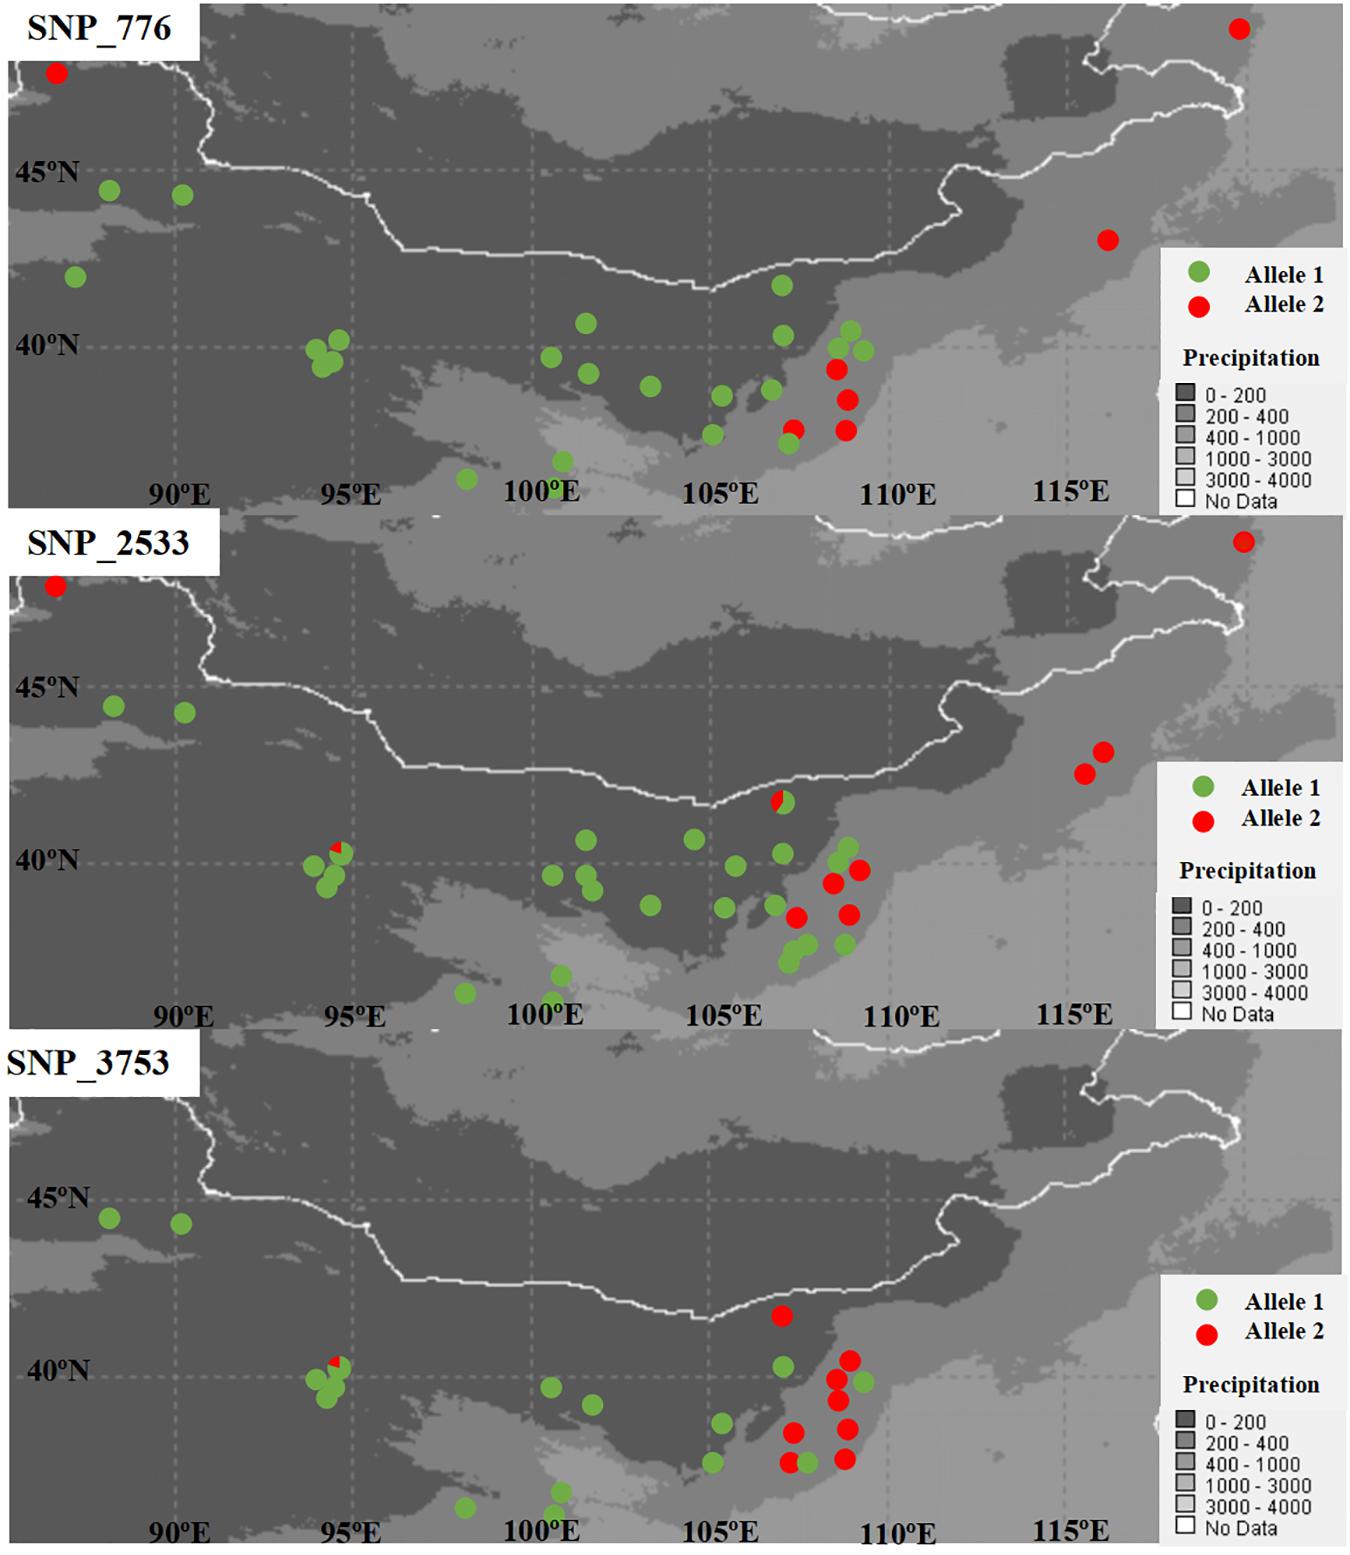
Figure 3. Plots of allele frequency in each population for the three detected SNPs under diversifying selection.
To investigate the genetic structure of the genomic variation, 5831 neutral SNPs were used to construct the genetic structure of the sand rice populations. The results of FASTSTRUCTURE predicated K = 4 as the optimum population structure for A. squarrosum populations. As shown in Figure 1B, the four groups were divided as follows: (1) Northwest, including only one population of BEJ, the ancestral population of sand rice as suggested by the results of FineRADStructure and the ∗BEAST; (2) Central_1, including 18 populations from the Gurbantünggüt desert, the Taklamakan desert, the Kumtag desert, the Qaidam, Badan Jaran desert, and the Tengger desert; (3) Central_2, including 15 populations from the Ulan Buh sandy land, the Kubuqi desert, and the Mu Us sandy land, which are located in monsoonal zones; and (4) East, including four populations from the Hunshandake sandy land, the Horqin sandy land, and the Hulun Buir sandy land. Two components were found in the group UKM, of which one is unique to this group, while the other one is similar to that in the Central lineage. We also found an odd phenomenon in population DLZ; among the three individuals in this population, one individual shared the its genetic component with the East lineage, which also contributed to the high values of genetic diversity of this population (Table 1). To avoid possible sampling errors or sample contamination, we deleted this population from the analyses. On the other hand, pairwise genetic distance analyses showed that lineages of Central_1 and Central_2 lineages were closely related due to the frequent gene flow (FST = 0.01, P < 0.01, Supplementary Table 4). The results of PCA, FineRADStructure and INSTRUCT also supported that the Central_1 and Central_2 lineages were closely related and that there were three genetic lineages among all of the populations (Supplementary Figure 1). Thus, in the further analyses, two groups were merged into one lineage called Central. Phylogenetic analyses further supported the conclusion that sand rice may have originated in the far northwest of the Gurbantünggüt Desert (in Burgin County) and then further differentiated into East and Central lineages (Supplementary Figure 1).
On the other hand, as shown in Figure 2B, when East and Northwest lineages excluded, significant selection signals were identified in 186 SNPs among populations from the Central lineage, with 11 SNPs were under diversifying selection, while the 175 SNPs were remained under balancing selection. Among these 11 SNPs with diversifying selection, three SNPs (SNP_776, SNP_2533, and SNP_3753) were also detected in the upper analyses based on all populations with distinctly genetic structure, while all of the 175 SNPs with balancing selection could also be found in the upper analyses.
Ecological Niche Modeling and Identity Tests
All of the AUC scores are over 0.9 (0.977 and 0.977 for Central and East lineages’ ecological niche prediction, respectively), supporting the suitability of our models. The results of ENM indicated that the Central and East lineages occupied distinct niches (Figure 4A). For the Central lineage, precipitation, the mean temperature of the coldest quarter, and the mean temperature of the driest quarter were found to have large effects on its distribution ranges. For the East lineage, however, besides the above two ecological factors, precipitation seasonality and isothermality were also thought to affect its distribution range (Supplementary Table 5).
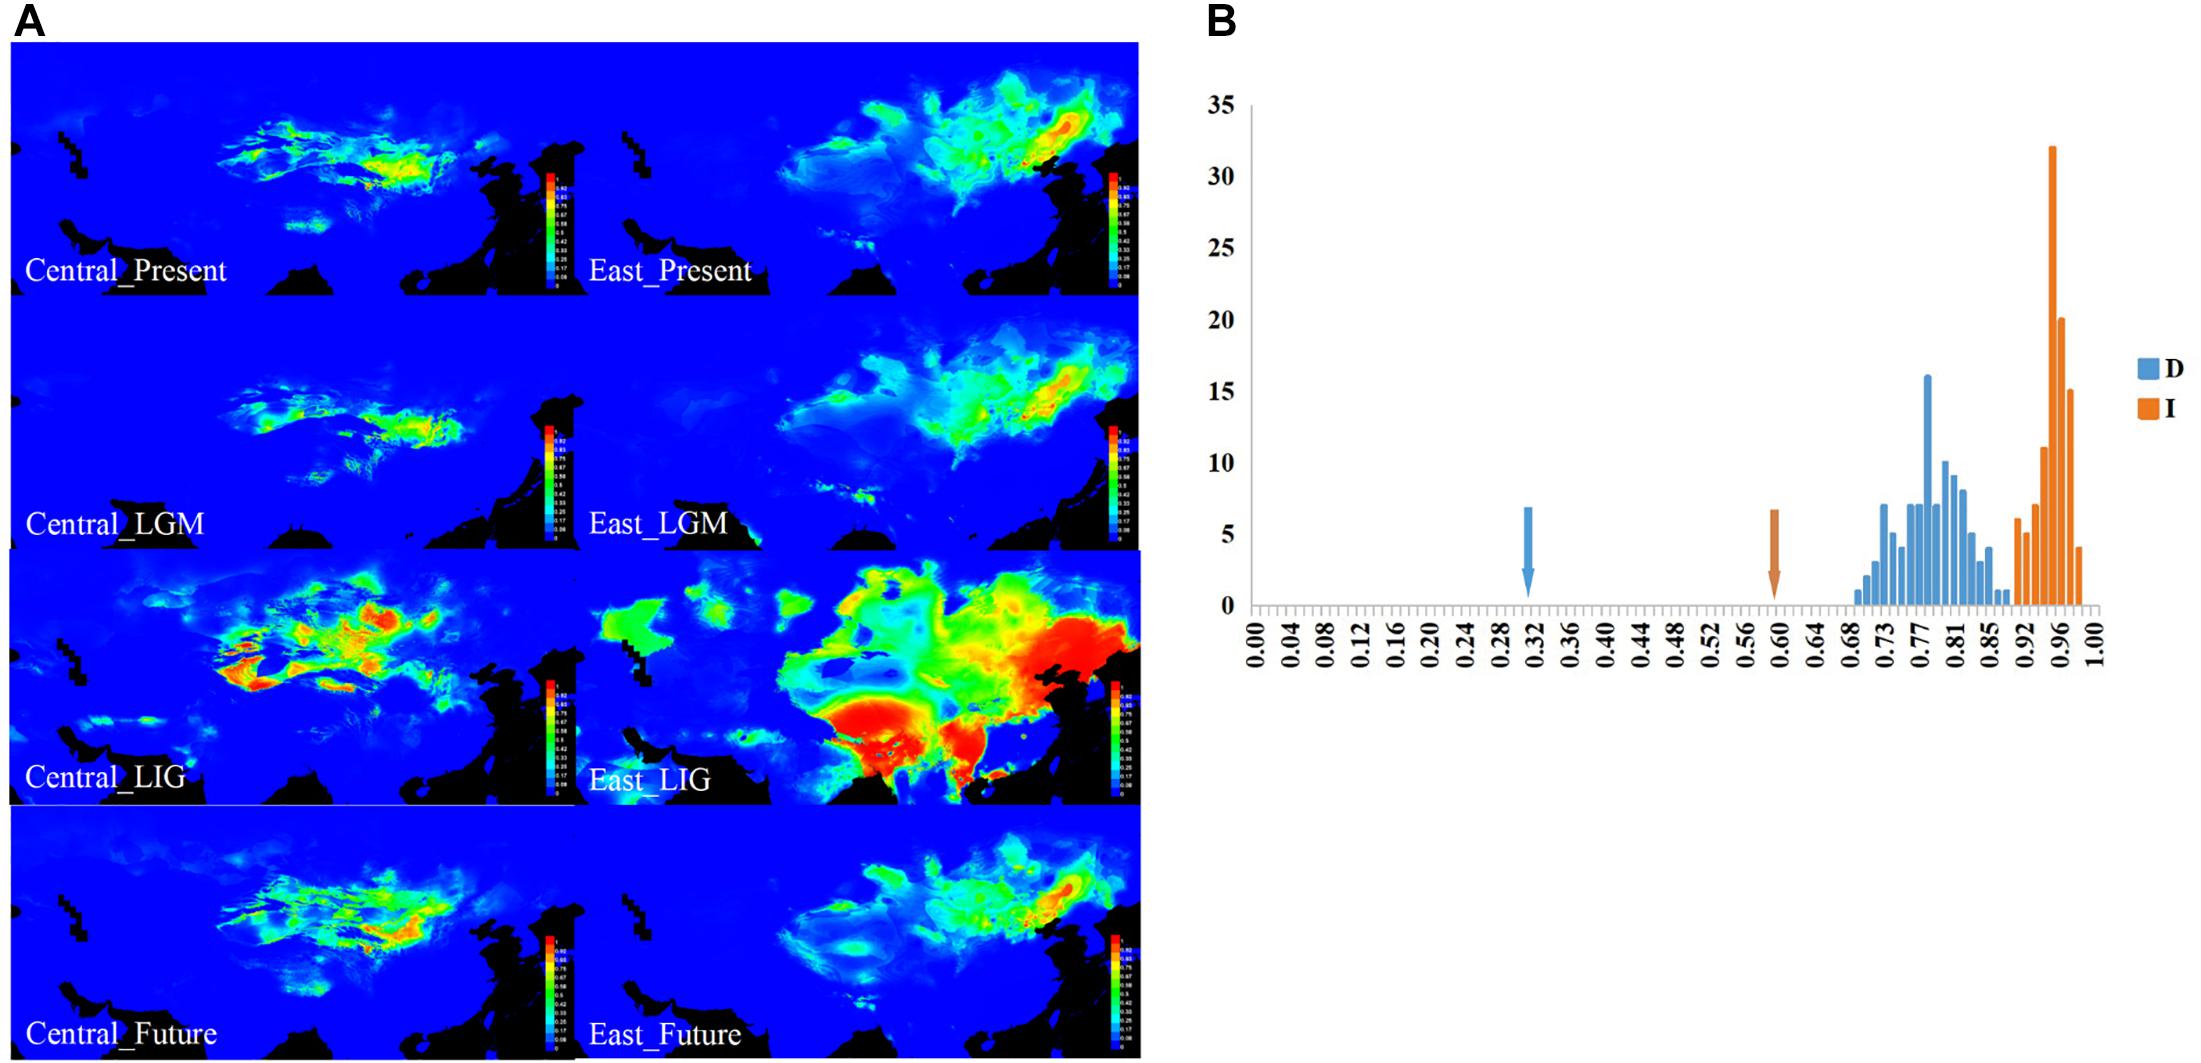
Figure 4. The results for ecological niche modeling suggest three significant divergent niches of sand rice. (A) Geographic projections of the Central and East lineages of sand rice niche derived from the MaxEnt model. These figures originated from the software packages of MAXENT version 3.3.3, the environmental variables originated from the WorldClim database version 1.4 (1950–2000, http://www.worldclim.org/) and then modified by CQ with CorelDraw X6 (Corel Corporation, Ottawa, ON, Canada). (B) Results of identity tests. Observed niche overlap values of Schoener’s D and I for Central and East lineages compared to null distributions (bars indicate the null distributions of D or I). All pairwise comparisons show significant niche divergence (P < 0.05).
Furthermore, ecological identity tests of lineages pairwise based on the Schoener’s D and I values (Figure 4B) showed that both of these lineages significantly differed from the random distribution (P < 0.01), suggesting that the niches occupied by the different lineages were not identical, and the two lineages were somewhat eco-geographically isolated. Furthermore, as illustrated in the ecological niche simulations for the present and LGM periods, the potential distribution regions of the two lineages were separated with small overlap, which suggested that the distribution range of the lineages was not be enlarged during global cooling. Meanwhile, both distribution ranges may have greatly expanded during global warming (LIG and future), particularly for the East lineage during the LIG period (Figure 4A and Supplementary Table 5).
Furthermore, besides the influence of the physical distances on the genetic distance for sand rice populations (Mantel test geographical distance vs. genetic distance: r = 0.4622, p-value = 0.001), divergent ecological factors were also suggested to have significant affection on the genetic structure (Mantel test ecology distance vs. genetic distance: r = 0.3487, p-value = 0.003) (Supplementary Figure 2), suggested that the ecological divergence would also triggered the genomic divergence of these genetic lineages of sand rice.
Discussion
China is one of the largest countries affected by desertification. In northern China, more than two million square kilometers is characterized as desert and/or sandy lands (Wang et al., 2008). An annual pioneer and primary desert species, sand rice is an ideal plant for sand fixation and the reversion of desertification. To investigate how to construct ideal founder populations for desert restoration, we investigated the genomic diversity of sand rice based on RAD sequencing. By elucidating the effects of genetic structure on adaptive signal detection, we examined the molecular basis for sand rice adaptability to heterogeneous sand dune environments across the arid and semi-arid regions of north China. Then we discussed the guidelines for artificial vegetation using sand rice for the sustainability of desert ecosystems.
Using RAD sequencing in 38 populations with species-wide sampling, we found a total of 6,124 SNPs without strong LD. To our surprise, we detected only five SNPs involved in local adaptation. Then, based on these SNPs, three distinct genetic lineages were clustered in this study (Figure 1 and Supplementary Figure 1), and sand rice might originate locally in Burgin County and further differentiated into the East lineage and then the Central lineage (Supplementary Figure 1), which is concordant in the previous study based on nrITS and several cpDNA fragments (Qian et al., 2016). Because high genetic structure affects the signal detection of diversifying selection, particularly in a highly selfing plant (Qian et al., 2020), the genetic structure could be expected to increase the average FST of the genomic background and make it more difficult to detect significant outliers under conditions of spatially diversifying selection. However, the high average FST of the genomic background would have little influence on the detection of SNPs under balancing selection, with have lower FST values than the average FST of the genomic background (Beaumont and Nichols, 1996; Foll and Gaggiotti, 2008). Thus, we analyzed adaptive SNPs by excluding the influence of genetic structure by excluding the Northwest and East lineages. Ultimately, we detected 11 SNPs under significant diversifying selection in the Central populations. Three SNPs (SNP_776, SNP_2533, and SNP_3753) were outliers in both tests (with or without the East and Northwest lineages). Furthermore, the distribution of their allele frequencies were also significantly associated with precipitation gradients (Supplementary Table 4), suggesting that these SNPs could be used as the characteristic markers for specific population construction in artificial desert restoration. In other research fields, such as forestry management and breeding, adaptive SNPs are commonly used as molecular markers for afforestation (Ma et al., 2010; Hall et al., 2011; Chen et al., 2012, 2016). However, no similar work had been begun in the desert restoration until this study.
To our surprise, 175 out of 6,124 SNPs (∼2.9%) were detected under balancing selection in both the overall samples and the Central lineage populations alone. Normally, balancing selection is able to maintain genetic diversity in a population via two key mechanisms: heterozygote advantage and frequency-dependent selection, which contributes to the adaptive potential of a population in the presence of environmental heterogeneity (Barrett and Schluter, 2008). Considering to the high selfing rate of sand rice (∼0.67, estimated by Instruct based on RAD sequences, data not shown), we proposed that a high percentage of balancing selection in the sand rice genome could be due more to frequency-dependent selection than to heterozygous advantage.
In fact, genetic structural data showed that significant amounts of new genetic components exist across populations from the monsoonal zone of the Central lineage (Figure 1B). Due to the seesaw battles between summer and winter monsoons during the Pleistocene climatic oscillations (Hallatschek et al., 2007; Excoffier and Ray, 2008), populations from the monsoonal zone could have experienced frequent population bottlenecks and habitat fragmentation, as found in other desert plants (Yin et al., 2015; Shi et al., 2020), which promoted the fixation of new alleles within these local populations and further contributed to complicated genetic components of populations from the monsoonal zone. It is a pity, however, as the RAD reads were too short to be annotated without the genomic sequences of sand rice, that we did not find any genes with their function annotated. We proposed that these SNPs under balancing selection may be linked to the genes functioning in respond to multiple stresses or climatic oscillations.
Numerous studies have found that in glacial periods, such as the LGM, northern China experienced significant desertification (Ding et al., 2005; Lu et al., 2013). As a pioneer desert plant, the colonization of sand rice is accompanied with an expansion of desertification. However, ENM results showed that under global cooling, such as at the present and during the LGM period, the suitable habitats for the Central lineage and East lineages were quite stable. This suggests that although desertification with global cooling could produce more sand dunes, the habitat of sand rice was not enlarged because of the limitation of its ecological niche. In cases of global warming, such as during the LIG and under a scenario of moderate CO2 emissions, the suitable habitats of these two lineages become greatly enlarged, particularly for the East lineage. However, for Central lineage (average π = 0.0381, Table 1), the genetic diversity of the East lineage is fairly low (π = 0.0159, Table 1), and its genetic background did not support a large expansion of its distribution range. Thus, the prediction of ecological niches could be overestimated based solely on 19 climate factors, which would further result in incorrect prediction of the potential distribution ranges. According to this point of view, we should be very careful to narrowly identify the strategy for desertification reversion based on the ENM without genetic evaluation. Besides, other ecological factors such as soil type and wind system should also be included in the description of ecological niches of plant species, at least in desert plants.
Thus, based on a thorough investigation of the genomic diversity and ecological factors of sand rice, an annual pioneer plant species widely endemic to sand dunes in arid and semi-arid regions of China, to build up ideal founder populations for the restoration of the desert ecosystem, we suggest the following. First, we should select native and widely distributed plant species with diverse levels of ecological adaptability. Second, by investigating their genetic structure and screening the SNPs involved into ecological adaptation, we can easily classify genetic lineages by core germplasms or ecotypes. Third, by combining genetic data with ENM to evaluate the risk for each lineages facing the climate change and environmental heterogeneity, the composition of the founder populations can be determined for specific environmental conditions. Finally, common garden and/or transplant experiments can be conducted to verify the fitness of founder populations, which could be exploited to obtain the successful restoration of a desert ecosystem. We have not reached this step yet. Of course, to obtain a more comprehensive understanding of how sand rice can be adapted to the heterogeneous local environment and to global climate change, de novo genome sequencing of populations is still needed for future study, which will provide more genetic information and guidance for the resistance and restoration of fragile desert ecosystems as global warming proceeds in the future.
Data Availability Statement
The datasets presented in this study can be found in online repositories. The names of the repository/repositories and accession number(s) can be found in the article/Supplementary Material.
Author Contributions
X-FM conceived and designed the investigations. CQ and XYa analyzed the data and wrote the first version of the manuscript. CQ collected the data. TF, XYi, SZ, and XF performed the experiments. X-FM and YC provided improvements to the manuscript. All authors contributed to the article and approved the submitted version.
Funding
This work was supported by the National Key Research and Development Program of China (Grant No. 2016YFC0500903), the Foundation for Excellent Youth Scholars of NIEER, CAS (Grant No. Y92972), the National Natural Science Foundation of China (Grant Nos. 31901079 and 31770416), the Key Research and Development Program of Gansu Province (Grant No. 18YF1NA123), the Xinjiang Production and Construction Crops Key Laboratory of Protection and Utilization of Biological Resources in Tarim Basin (Grant No. BRZD1809), the Special Foundation for National Science and Technology Basic Research Program of China (2017FY100201), and the Special Funds for Scientific and Technological Innovation and Development in Gansu Province (Research and Development Center of Desert Nutrition and Medicinal Plant Germplasm Innovation).
Conflict of Interest
The authors declare that the research was conducted in the absence of any commercial or financial relationships that could be construed as a potential conflict of interest. The reviewer YL declared a past co-authorship with one of the authors X-FM, to the handling editor.
Acknowledgments
We thank Xin Zhao for the laboratory assistance and Peipei Sun, Yule Ma, and Yu Ma for their help in sampling.
Supplementary Material
The Supplementary Material for this article can be found online at: https://www.frontiersin.org/articles/10.3389/fgene.2021.656061/full#supplementary-material
Footnotes
- ^ http://www.iplant.cn
- ^ https://www.cvh.ac.cn
- ^ http://catchenlab.life.illinois.edu/stacks/
- ^ http://www.bioinformatics.babraham.ac.uk/projects/fastqc
- ^ http://www.worldclim.org/
References
Baird, N. A., Etter, P. D., Atwood, T. S., Currey, M. C., Shiver, A. L., Lewis, Z. A., et al. (2008). Rapid SNP discovery and genetic mapping using sequenced RAD markers. PLoS One 3:e0003376.
Bamba, M., Kawaguchi, Y. W., and Tsuchimatsu, T. (2019). Plant adaptation and speciation studied by population genomic approaches. Dev. Growth Differ. 61, 12–24. doi: 10.1111/dgd.12578
Barrett, R. D. H., and Schluter, D. (2008). Adaptation from standing genetic variation. Trends Ecol. Evol. 23, 38–44. doi: 10.1016/j.tree.2007.09.008
Beaumont, M. A., and Nichols, R. A. (1996). Evaluating loci for use in the genetic analysis of population structure. Proc. R. Soc. Lond. Ser. B Biol. Sci. 263, 1619–1626. doi: 10.1098/rspb.1996.0237
Bouckaert, R., Heled, J., Kuhnert, D., Vaughan, T., Wu, C. H., Xie, D., et al. (2014). BEAST 2: a software platform for bayesian evolutionary analysis. PLoS Comput. Biol. 10:e1003537.
Cao, S., Tian, T., Chen, L., Dong, X., Yu, X., and Wang, G. (2010). Damage caused to the environment by reforestation policies in arid and semi-arid areas of China. Ambio 39, 279–283. doi: 10.1007/s13280-010-0038-z
Catchen, J. M., Amores, A., Hohenlohe, P., Cresko, W., and Postlethwait, J. H. (2011). Stacks: building and genotyping loci de novo from short-read sequences. G3 1, 171–182. doi: 10.1534/g3.111.000240
Chen, B.-M., Wang, G.-X., and Peng, S.-L. (2009). Role of desert annuals in nutrient flow in arid area of Northwestern China: a nutrient reservoir and provider. Plant Ecol. 201, 401–409. doi: 10.1007/s11258-008-9526-7
Chen, G., Zhao, J., Zhao, X., Zhao, P., Duan, R., Nevo, E., et al. (2014). A psammophyte Agriophyllum squarrosum (L.) moq.: a potential food crop. Genet. Resour. Crop Evol. 61, 669–676. doi: 10.1007/s10722-014-0083-8
Chen, J., Källman, T., Ma, X., Gyllenstrand, N., Zaina, G., Morgante, M., et al. (2012). Disentangling the roles of history and local selection in shaping clinal variation of allele frequencies and gene expression in Norway spruce (Picea abies). Genetics 191, 865–881. doi: 10.1534/genetics.112.140749
Chen, J., Källman, T., Ma, X.-F., Zaina, G., Morgante, M., and Lascoux, M. (2016). Identifying genetic signatures of natural selection using pooled population sequencing in Picea abies. G3 6, 1979–1989. doi: 10.1534/g3.116.028753
Darwin, C. (1968). On the Origin of Species by Means of Natural Selection. 1859. London: Murray Google Scholar.
Ding, Z., Derbyshire, E., Yang, S., Sun, J., and Liu, T. (2005). Stepwise expansion of desert environment across northern China in the past 3.5 Ma and implications for monsoon evolution. Earth Planet. Sci. Lett. 237, 45–55. doi: 10.1016/j.epsl.2005.06.036
Dobzhansky, T. (1940). Speciation as a stage in evolutionary divergence. Am. Nat. 74, 312–321. doi: 10.1086/280899
Drummond, A. J., and Rambaut, A. (2007). BEAST: bayesian evolutionary analysis by sampling trees. BMC Evol. Biol. 7:214. doi: 10.1186/1471-2148-7-214
Dyer, R. J., and Nason, J. D. (2004). Population graphs: the graph theoretic shape of genetic structure. Mol. Ecol. 13, 1713–1727. doi: 10.1111/j.1365-294X.2004.02177.x
Elith, J. H., Graham, C. P., Anderson, R., Dudík, M., Ferrier, S., and Guisan, A. (2006). Novel methods improve prediction of species’ distributions from occurrence data. Ecography 29, 129–151.
Escalante, M. A., Perrier, C., García-De León, F. J., Ruiz-Luna, A., Ortega-Abboud, E., and Manel, S. (2020). Genotyping-by-sequencing reveals the effects of riverscape, climate and interspecific introgression on the genetic diversity and local adaptation of the endangered Mexican golden trout (Oncorhynchus chrysogaster). Conserv. Genet. 21, 907–926. doi: 10.1007/s10592-020-01297-z
Excoffier, L., Laval, G., and Schneider, S. (2005). Arlequin (version 3.0): an integrated software package for population genetics data analysis. Evol. Bioinform. 1, 47–50.
Excoffier, L., and Ray, N. (2008). Surfing during population expansions promotes genetic revolutions and structuration. Trends Ecol. Evol. 23, 347–351. doi: 10.1016/j.tree.2008.04.004
Fady, B., Aravanopoulos, F. A., Alizoti, P., Mátyás, C., von Wühlisch, G., Westergren, M., et al. (2016). Evolution-based approach needed for the conservation and silviculture of peripheral forest tree populations. For. Ecol. Manag. 375, 66–75. doi: 10.1016/j.foreco.2016.05.015
Feng, X., Fu, B., Piao, S., Wang, S., Ciais, P., Zeng, Z., et al. (2016). Revegetation in China’s loess plateau is approaching sustainable water resource limits. Nat. Clim. Chang. 6, 1019–1022. doi: 10.1038/nclimate3092
Foll, M., and Gaggiotti, O. (2008). A genome-scan method to identify selected loci appropriate for both dominant and codominant markers: a bayesian perspective. Genetics 180, 977–993. doi: 10.1534/genetics.108.092221
Gao, H., Williamson, S., and Bustamante, C. D. (2007). A markov chain monte carlo approach for joint inference of population structure and inbreeding rates from multilocus genotype data. Genetics 176, 1635–1651. doi: 10.1534/genetics.107.072371
Hall, D., Ma, X. F., and Ingvarsson, P. K. (2011). Adaptive evolution of the Populus tremula photoperiod pathway. Mol. Ecol. 20, 1463–1474. doi: 10.1111/j.1365-294x.2011.05014.x
Hallatschek, O., Hersen, P., Ramanathan, S., and Nelson, D. R. (2007). Genetic drift at expanding frontiers promotes gene segregation. Proc. Natl. Acad. Sci. USA 104, 19926–19930. doi: 10.1073/pnas.0710150104
Hijmans, R. J., Cameron, S. E., Parra, J. L., Jones, P. G., and Jarvis, A. (2005). Very high resolution interpolated climate surfaces for global land areas. Int. J. Climatol. 25, 1965–1978. doi: 10.1002/joc.1276
Ignace, D. D., Huntly, N., and Chesson, P. (2018). The role of climate in the dynamics of annual plants in a Chihuahuan desert ecosystem. Evol. Ecol. Res. 19, 279–297.
Jiang, G., Han, X., and Wu, J. (2006). Restoration and management of the inner Mongolia grassland require a sustainable strategy. J. Hum. Environ. 35, 269–270. doi: 10.1579/06-s-158.1
Jiang, H. S., Lei, R., Ding, S. W., and Zhu, S. F. (2014). Skewer: a fast and accurate adapter trimmer for next-generation sequencing paired-end reads. BMC Bioinform. 15:182.
Joost, S., Bonin, A., Bruford, M. W., Després, L., Conord, C., Erhardt, G., et al. (2007). A spatial analysis method (SAM) to detect candidate loci for selection: towards a landscape genomics approach to adaptation. Mol. Ecol. 16, 3955–3969. doi: 10.1111/j.1365-294x.2007.03442.x
Lázaro-Nogal, A., Matesanz, S., Hallik, L., Krasnova, A., Traveset, A., and Valladares, F. (2016). Population differentiation in a Mediterranean relict shrub: the potential role of local adaptation for coping with climate change. Oecologia 180, 1075–1090. doi: 10.1007/s00442-015-3514-0
Leemans, R., and Eickhout, B. (2004). Another reason for concern: regional and global impacts on ecosystems for different levels of climate change. Glob. Environ. Chang. 14, 219–228. doi: 10.1016/j.gloenvcha.2004.04.009
Li, J. L., Zhong, L. L., Wang, J., Ma, T., Mao, K. S., and Zhang, L. (2020). Genomic insights into speciation history and local adaptation of an alpine aspen in the Qinghai–Tibet Plateau and adjacent highlands. J. Syst. Evol. doi: 10.1111/jse.12665
Li, L.-F., Cushman, S. A., He, Y.-X., and Li, Y. (2020). Genome sequencing and population genomics modeling provide insights into the local adaptation of weeping forsythia. Hortic. Res. 7:130.
Li, S., Chang, X., and Zhao, X. (1992). Study of Agriophyllum squarrosum—pioneering plant on shifting sand. J. Arid Land Resour. Environ. 6, 63–70.
Li, Y., Cao, K., Li, N., Fang, W., Chen, C., Wang, X., et al. (2020). Genomic analyses provide insights into peach local adaptation and responses to climate change. bioRxiv [preprint] doi: 10.1101/2020.01.15.907709
Librado, P., and Rozas, J. (2009). DnaSP v5: a software for comprehensive analysis of DNA polymorphism data. Bioinformatics 25, 1451–1452. doi: 10.1093/bioinformatics/btp187
Lu, F., Hu, H., Sun, W., Zhu, J., Liu, G., Zhou, W., et al. (2018). Effects of national ecological restoration projects on carbon sequestration in China from 2001 to 2010. Proc. Natl. Acad. Sci. U.S.A. 115, 4039–4044. doi: 10.1073/pnas.1700294115
Lu, H. Y., Yi, S. W., Xu, Z. W., Zhou, Y. L., Zeng, L., Zhu, F. Y., et al. (2013). Chinese deserts and sand fields in last glacial maximum and holocene optimum. Chin. Sci. Bull. 58, 2775–2783. doi: 10.1007/s11434-013-5919-7
Ma, Q. L., Wang, J. H., Zhang, J. G., Zhan, K. J., Zhang, D. K., and Chen, F. (2008). Ecological protective function of a pioneer species (Agriophyllum squarrosum) on Shifting Sand Dunes. J. Soil Water Conserv. 6:26613.
Ma, X. F., Hall, D., St Onge, K. R., Jansson, S., and Ingvarsson, P. K. (2010). Genetic differentiation, clinal variation and phenotypic associations with growth cessation across the Populus tremula photoperiodic pathway. Genetics 186, 1033–1044. doi: 10.1534/genetics.110.120873
Maćkiewicz, A., and Ratajczak, W. (1993). Principal components analysis (PCA). Comput. Geosci. 19, 303–342.
Malinsky, M., Trucchi, E., Lawson, D. J., and Falush, D. (2018). RADpainter and fineRADstructure population inference from RADseq data. Mol. Biol. Evol. 35, 1284–1290. doi: 10.1093/molbev/msy023
Miao, C. P., Li, X. H., and Jiang, D. M. (2013). Spatial variability of Agriophyllum squarrosum across scales and along the slope on an active sand dune in semi-arid China. Arid Land Res. Manag. 27, 231–244. doi: 10.1080/15324982.2012.761659
Moran, E. V. (2020). Simulating the effects of local adaptation and life history on the ability of plants to track climate shifts. AoB Plants 12:laa008.
Oksanen, J., Blanchet, F., Kindt, R., Legendre, P., Minchin, P., O’Hara, R., et al. (2015). vegan: Community Ecology Package. R package version 2.0-10. 2013.
Phillips, S. J., Anderson, R. P., and Schapire, R. E. (2006). Maximum entropy modeling of species geographic distributions. Ecol. Modell. 190, 231–259. doi: 10.1016/j.ecolmodel.2005.03.026
Posada, D. (2008). jModelTest: phylogenetic model averaging. Mol. Biol. Evol. 25, 1253–1256. doi: 10.1093/molbev/msn083
Qian, C. J., Yan, X., Shi, Y., Yin, H. X., Chang, Y. X., Chen, J., et al. (2020). Adaptive signals of flowering time pathways in wild barley from Israel over 28 generations. Heredity 124, 62–76. doi: 10.1038/s41437-019-0264-5
Qian, C., Yin, H., Shi, Y., Zhao, J., Yin, C., Luo, W., et al. (2016). Population dynamics of Agriophyllum squarrosum, a pioneer annual plant endemic to mobile sand dunes, in response to global climate change. Sci. Rep. 6:26613.
Raj, A., Stephens, M., and Pritchard, J. K. (2014). fastSTRUCTURE: variational inference of population structure in large SNP data sets. Genetics 197, 573–589. doi: 10.1534/genetics.114.164350
Rellstab, C., Zoller, S., Walthert, L., Lesur, I., Pluess, A. R., Graf, R., et al. (2016). Signatures of local adaptation in candidate genes of oaks (Quercus spp.) with respect to present and future climatic conditions. Mol. Ecol. 25, 5907–5924. doi: 10.1111/mec.13889
Schneider, C. J. (2000). Natural selection and speciation. Proc. Natl. Acad. Sci. U.S.A. 97, 12398–12399.
Schoener, T. W. (1970). Nonsynchronous spatial overlap of lizards in patchy habitats. Ecology 51, 408–418. doi: 10.2307/1935376
Shi, Y., Yan, X., Yin, H. X., Qian, C. J., Fan, X. K., Yin, X. Y., et al. (2020). Divergence and hybridization in the desert plant Reaumuria soongarica. J. Syst. Evol. 58, 159–173. doi: 10.1111/jse.12490
Stucki, S., Orozco-terWengel, P., Forester, B. R., Duruz, S., Colli, L., Masembe, C., et al. (2017). High performance computation of landscape genomic models including local indicators of spatial association. Mol. Ecol. Resour. 17, 1072–1089. doi: 10.1111/1755-0998.12629
Swart, R., Berk, M., Janssen, M., Kreileman, E., and Leemans, R. (1998). “The safe landing approach: risks and trade-offs in climate change, in Global Change Scenarios of the 21st Century: Results from the IMAGE, eds J. Alcamo, R. Leemans, and E. Kreileman (London: Elsevier Science).
Thomas, D. S., Knight, M., and Wiggs, G. F. (2005). Remobilization of southern African desert dune systems by twenty-first century global warming. Nature 435, 1218–1221. doi: 10.1038/nature03717
Thompson, J. N. (2016). Coevolution, local adaptation and ecological speciation. Mol. Ecol. 25, 5608–5610. doi: 10.1111/mec.13873
Wang, Q., Abbott, R. J., Yu, Q. S., Lin, K., and Liu, J. Q. (2013). Pleistocene climate change and the origin of two desert plant species, Pugionium cornutum and Pugionium dolabratum (Brassicaceae), in northwest China. New Phytol. 199, 277–287. doi: 10.1111/nph.12241
Wang, X., Chen, F., Hasi, E., and Li, J. (2008). Desertification in China: an assessment. Earth Sci. Rev. 88, 188–206. doi: 10.1016/j.earscirev.2008.02.001
Wang, X., Yang, Y., Dong, Z., and Zhang, C. (2009). Responses of dune activity and desertification in China to global warming in the twenty-first century. Glob. Planet. Chang. 67, 167–185. doi: 10.1016/j.gloplacha.2009.02.004
Warren, D. L., Glor, R. E., and Turelli, M. (2008). Environmental niche equivalency versus conservatism: quantitative approaches to niche evolution. Evol. Int. J. Organic Evol. 62, 2868–2883. doi: 10.1111/j.1558-5646.2008.00482.x
Warren, D. L., Glor, R. E., and Turelli, M. (2010). ENMTools: a toolbox for comparative studies of environmental niche models. Ecography 33, 607–611.
Weis, J. J., Ode, P. J., and Heimpel, G. E. (2017). Balancing selection maintains sex determining alleles in multiple-locus complementary sex determination. Evolution 71, 1246–1257. doi: 10.1111/evo.13204
Yin, C., Qian, C., Chen, G., Yan, X., and Ma, X. (2016a). The influence of selection of ecological differentiation to the phenotype polymorphism of Agriophyllum squarrosum. J. Desert Res. 36, 364–373.
Yin, C., Zhao, J., Hu, J., Qian, C., Xie, Z., Chen, G., et al. (2016b). Phenotypic variation of a potential food crop, Agriophyllum squarrosum, impacted by environmental heterogeneity. Scientia Sinica Vitae 46, 1324–1335. doi: 10.1360/n052015-00294
Yin, H., Wang, L., Shi, Y., Qian, C., Zhou, H., Wang, W., et al. (2020). The east asian winter monsoon acts as a major selective factor in the intraspecific differentiation of drought-tolerant Nitraria tangutorum in Northwest China. Plants 9:1100. doi: 10.3390/plants9091100
Yin, H., Yan, X., Shi, Y., Qian, C., Li, Z., Zhang, W., et al. (2015). The role of East Asian monsoon system in shaping populationdivergence and dynamics of a constructive desert shrub Reaumuria soongarica. Sci. Rep. 5: 15823.
Yin, X. Y., Wang, W.-D., Qian, C., Fan, X. K., Yan, X., Yan, G.-H., et al. (2018). Analysis of metabolomics in Agriophyllum squarrosum based on UPLC-MS. Chin. J. Exp. Tradit. Med. Formulae 24, 51–56.
Yin, Z. (2018). Governing desertification project in northwest china—analysis of” three North” shelterbelt project. Anhui Architecture 24, 219–220.
Zhao, P., Capella-Gutiérrez, S., Shi, Y., Zhao, X., Chen, G., Gabaldón, T., et al. (2014). Transcriptomic analysis of a psammophyte food crop, sand rice (Agriophyllum squarrosum) and identification of candidate genes essential for sand dune adaptation. BMC Genomics 15:872. doi: 10.1186/1471-2164-15-872
Keywords: sand rice (Agriophyllum squarrosum), environmental heterogeneity, RAD sequencing, balancing selection, desertification reversion
Citation: Qian C, Yan X, Fang T, Yin X, Zhou S, Fan X, Chang Y and Ma X-F (2021) Genomic Adaptive Evolution of Sand Rice (Agriophyllum squarrosum) and Its Implications for Desert Ecosystem Restoration. Front. Genet. 12:656061. doi: 10.3389/fgene.2021.656061
Received: 20 January 2021; Accepted: 08 April 2021;
Published: 30 April 2021.
Edited by:
Yongpeng Ma, Kunming Institute of Botany (CAS), ChinaReviewed by:
Nian Wang, Shandong Agricultural University, ChinaYong Li, Henan Agricultural University, China
Copyright © 2021 Qian, Yan, Fang, Yin, Zhou, Fan, Chang and Ma. This is an open-access article distributed under the terms of the Creative Commons Attribution License (CC BY). The use, distribution or reproduction in other forums is permitted, provided the original author(s) and the copyright owner(s) are credited and that the original publication in this journal is cited, in accordance with accepted academic practice. No use, distribution or reproduction is permitted which does not comply with these terms.
*Correspondence: Xiao-Fei Ma, bWF4aWFvZmVpQGx6Yi5hYy5jbg==