 Xiangguang Meng1
 Chen Fan
 Yiqiang Yuan
- 1Laboratory of Cardiovascular Disease and Drug Research, Zhengzhou No. 7 People’s Hospital, Zhengzhou, China
- 2Department of Pharmacology, School of Medicine, Zhengzhou University, Zhengzhou, China
- 3Skin Research Institute of Singapore, Agency for Science, Technology and Research (A∗STAR), Singapore, Singapore
- 4Department of Cardiac Surgery, Zhengzhou No. 7 People’s Hospital, Zhengzhou, China
- 5Department of Cardiovascular Internal Medicine, Henan Provincial Chest Hospital, Zhengzhou, China
More reliable methods are needed to uncover novel biomarkers associated with atrial fibrillation (AF). Our objective is to identify significant network modules and newly AF-associated genes by integrative genetic analysis approaches. The single nucleotide polymorphisms with nominal relevance significance from the AF-associated genome-wide association study (GWAS) data were converted into the GWAS discovery set using ProxyGeneLD, followed by merging with significant network modules constructed by weighted gene coexpression network analysis (WGCNA) from one expression profile data set, composed of left and right atrial appendages (LAA and RAA). In LAA, two distinct network modules were identified (blue: p = 0.0076; yellow: p = 0.023). Five AF-associated biomarkers were identified (ERBB2, HERC4, MYH7, MYPN, and PBXIP1), combined with the GWAS test set. In RAA, three distinct network modules were identified and only one AF-associated gene LOXL1 was determined. Using human LAA tissues by real-time quantitative polymerase chain reaction, the differentially expressive results of ERBB2, MYH7, and MYPN were observed (p < 0.05). This study first demonstrated the feasibility of fusing GWAS with expression profile data by ProxyGeneLD and WGCNA to explore AF-associated genes. In particular, two newly identified genes ERBB2 and MYPN via this approach contribute to further understanding the occurrence and development of AF, thereby offering preliminary data for subsequent studies.
Introduction
Atrial fibrillation (AF), manifesting as irregular AF, is the most common arrhythmia in clinical practice and leads to many serious complications such as stroke, heart failure, ventricular arrhythmias, and peripheral arterial embolism (Barrios et al., 2012). Epidemiological investigations have reported that the prevalence of AF dramatically increases with age (Bapat et al., 2018). AF causes a high risk of disability and death (Acciarresi et al., 2017), which places a heavy burden on individuals and the healthcare system. It has been reported that the underlying mechanisms of the occurrence and maintenance of AF are regulated by genetic factors, particularly single nucleotide polymorphisms (SNPs) (He et al., 2018; Lin et al., 2019). Therefore, the accurate identification of SNPs is essential for the investigation of AF-associated genes.
To date, genome-wide association study (GWAS) has been the most popular method for SNP identification and has been widely used in the study of various complex diseases due to its high throughput and cost-effectiveness. In particular, some mutations associated with AF have been identified using GWAS by setting a standard threshold p-value > 5E–08 (Jannot et al., 2015; Christophersen et al., 2017; Nielsen et al., 2018; Roselli et al., 2018). However, this arbitrary threshold discards many mutations with subtle effects but potential biological significance (p > 5E–08), which in turn leads to a partial loss of heritability (Jia et al., 2012). Thus, network analysis methods, such as pathway enrichment analysis, are required to solve the missing heritability problem (Askland et al., 2009; Elbers et al., 2009).
Gene ontology (GO) and the Kyoto Encyclopedia of Genes and Genomes (KEGG), two representative enrichment analysis approaches, are designed based on hypergeometric distribution. They function by comparing the number of interesting genes enriched in a special term or pathway with the number of random background genes. Although these methods are user-friendly, their statistical efficiency is limited since expressive information of genes is not taken into account (Farber, 2013). Therefore, the more powerful gene-set enrichment analysis (GSEA), combined with the signal strength of gene expression, was applied for pathway analysis of genes in this study.
Studies have demonstrated that the weighted gene coexpression network analysis (WGCNA), another pathway analysis software, has the characteristics of reliable robustness and repeatability for expression profile data, and can obtain the interconnections between genes and find the network modules relative to diseases using gene expression values (Zhang et al., 2017; Kong et al., 2019; Wang et al., 2019). It is reported that one network-integrated approach combining GWAS with expression profile data by WGCNA possesses significant advantages in mining hidden disease-associated pathways and functional genes, compared with other existing approaches. Farber (2013) used this analysis method to repeat the previous functional pathways from osteoporosis-associated GWAS and transcriptome data, and identify newly functional genes. Chen et al. (2016) validated the potential ability of this method by exploring the hidden biological functions in a larger data set associated with osteoporosis. The joint method, however, has not been applied for AF-associated studies.
In this study, we converted SNPs with nominal relevance significance from the AF-associated GWAS data into the GWAS discovery set using ProxyGeneLD, followed by merging with the AF-associated modules constructed by WGCNA, and finally obtained two newly AF-associated biomarkers ERBB2 and MYPN. This study offers a systemic analytical method for revealing hidden AF-associated genes from GWAS and expression profile data.
Materials and Methods
Software Used
All analyses were conducted based on Cytoscape 3.7.2 (Shannon et al., 2003), GSEA 4.0.2 (Subramanian et al., 2005), LD score regression (LDSC) 1.0.1 (Bulik-Sullivan et al., 2015; Finucane et al., 2015), ProxyGeneLD (Hong et al., 2009), and R-related packages (R 3.6.1, 2019).
Pre-processing of GWAS Data
The keyword “atrial fibrillation” was used for the GWAS catalog database and retrieved 24 data sets, in which GCST006414 (Nielsen et al., 2018) were pre-processed as the GWAS discovery set, followed by merging with expressive profile data. The data set included 1,030,836 European individuals and 34,740,186 SNPs with precomputed p-values. The raw data for the test set came from FinnGen research project Freeze 3 (Finngen_r3_I9_AF1), which included 86,200 European individuals and 16,932,622 SNPs with precomputed p-values. Either total heritability of the two GWAS summary_statistic datasets was calculated by LDSC. Please refer to the following detailed steps, https://github.com/bulik/ldsc/wiki/Heritability-and-Genetic-Correlation.
Based on linkage disequilibrium (LD), gene length, and variant locus density, the p-values of SNPs from the GCST006414 were converted into the adjusted p-values (adj p) of genes by ProxyGeneLD, whose reference genome was set to the genome reference consortium human genome build 37 (GRCh37). LD patterns were determined using HapMap LD data set hg19_2009.04_rel27 from CEU (Utah residents with Northern and Western European ancestry from the CEPH collection). LD threshold (R2) was set to a default value (>0.8), and the 5′ and 3′ ends of each gene sequence were recognized and extended by 2,000 and 1,000 bp, respectively. The correction of p-values was based on the false discovery rate (FDR). The ultimately retained genes made up the GWAS discovery set (adj pdis < 0.05) and the GWAS test set (adj ptest < 0.05), respectively, for the following analysis.
Pre-processing of Expression Profile Data
The keyword “atrial fibrillation” was used to retrieve the GEO database, and three data sets (GSE79768, GSE115574, and GSE128188) from individuals with the paired LAA and RAA samples were obtained. Considering that the races of the samples from GSE79768 and GSE115574 are not consistent with the GWAS data sets and that the relevant literature of GSE115574 has not yet been published, they were discarded. The GSE128188 selected is produced by next-generation RNA sequencing (Illumina NextSeq 500) and contains 10-paired LAA and RAA samples from five male patients in sinus rhythm (SR) (average age: 62.4 ± 6.87 years) and 5 male patients in AF (average age: 73.6 ± 5.12 years), of European descent. The two data sets were normalized to build up the LAA- and RAA-normalized express lists by the DESeq function of DESeq2 package in R environment. To determine whether there were outlier samples, the “plotPCA” function was used for principal component analysis (PCA).
Constructing Network Modules by WGCNA
The correlation between each pair of the top 5,000 genes with high SDs in each of LAA- and RAA-normalized express lists was calculated to gain a correlation matrix, and then one adjacency matrix was obtained using a soft threshold (power index) instead of an arbitrarily hard threshold in an unsupervised manner. The power index was used to minimize the weaker connections and amplify the stronger connections between nodes in the matrix. The adjacency matrix was eventually used to calculate a topological overlap measure (TOM), and one dissimilarity matrix was obtained by 1 – TOM. The one-step network construction function “BlockwiseModules,” provided by the WGCNA package (Langfelder and Horvath, 2008), was applied to the construction of WGCNA cluster trees. Different branches of cluster tree represent different gene modules and are shown in different colors. The parameter “minModuleSize” was set to 30 to avoid modules with very few genes, and the “mergeCutHeight” parameter was set to 0.25 to combine genes with lower values. For details of the procedure, please refer to the website: https://horvath.genetics.ucla.edu/html/CoexpressionNetwork/Rpackages/WGCNA/Tutorials/.
Description of Network-Related Parameters for WGCNA
Weighted gene coexpression network analysis generates multiple parameter metrics. Module eigengene (ME) represents the expression value of all genes in one module after dimensionality reduction by the first PCA, and it can be used to determine the biological significance of the module combined with external phenotypes. In this study, the correlation between ME and AF was determined by the contingency coefficient (CC), which was calculated from the ME-dichotomized values around the median by the assocstats function (Liu et al., 2015a,b), given that the disease status (AF or SR) is a dichotomous variable. Gene significance (GS) was defined as minus log 10 of the p-value obtained by the DESeq function, measuring differential expression between AF and SR groups, for individual genes among all modules (Farber, 2010). In addition, the association between GS and module membership (MM) was used to verify the relationship between ME and AF (Farber, 2013), and the threshold for significance is set to p < 0.05 and R > 0.3. MM was defined as the correlation of ME in one module and gene expression values. For example, the blue MMi = cor(xi, MEblue) measures how correlated the expression value of one gene i is to the blue ME. The blue MMi measures the membership of the i-th gene as regards the blue module. If the blue MMi is close to 0, then the i-th gene is not part of the blue module. But if the blue MMi is close to 1 or –1, it is highly associated with the blue module genes.
Gene-Set Enrichment Analysis
Gene-set enrichment analysis v4.0.3 was applied to obtain the AF-associated pathways. The four human gene sets (c5.bp/cc/mf.v7.0.symbols.gmt and c2.cp.kegg.v7.0.symbols.gmt) from the Molecular Signatures Database (MsigDB, a collection of annotated gene sets for use with GSEA software) were chosen. In addition, the value of parameter “Permutation type” was set to “gene sets,” and the other parameters were set by default. The corrected p-value (FDR) for the screening criteria of function pathways is set to FDR < 0.25.
Application of Cytoscape Software and Vennerable Package
First, two gene lists (GS > 2) are generated from AF-associated network modules constructed from LAA- and RAA-normalized express lists, respectively, which are taken as input data sets of the venn.diagram function in Vennerable package. The result image returned by this function can show the different distribution of coexpression pattern genes between LAA and RAA. Furthermore, according to weights between genes (>0.15), the two gene lists are input into Cytoscape for visualization to determine core genes under the conditions of adj pdis < 0.05 and GS > 2, which are then validated by the GWAS test set (adj ptest < 0.05).
Patient Samples
All 30 patients with valvular heart diseases who received cardiac surgery at Zhengzhou No. 7 People’s Hospital were enrolled and classified into permanent AF (n = 12) and SR (n = 18) groups. Written informed consents were obtained from all participants. AF rhythm status was documented by electrocardiogram for >3 months. Patients with mitral valve or mitral valve combined other valve disease, who had coronary heart disease and hypertension, were included. Patients with other arrhythmia or other diseases such as pulmonary disease, diabetes mellitus, hyperthyroidism, rheumatic disease, autoimmune disease, congenital heart disease, and myocardial bridge were excluded. The data of all patients are shown in Table 1. The LAA tissues of patients were snap frozen in liquid nitrogen and kept at –80°C until RNA extraction. All procedures with human were in accordance with the Declaration of Helsinki. The experimental scheme was approved by the ethics committee of Zhengzhou No. 7 People’s Hospital (Approval No. 20190804).

Table 1. Clinical characteristics of AF and SR groups.
Validation of Real-Time Quantitative Polymerase Chain Reaction
The differential expression genes using data-mining were validated in human LAA by real-time quantitative polymerase chain reaction (RT-qPCR). All primers are shown in Supplementary File 1. The expression level of each gene was detected by SYBR GREEN method using the StepOnePlus system (Applied Biosystems, Foster City, CA, United States), with the housekeeping GAPDH as the internal reference gene. The reaction system volume was 20 μl, and the reaction conditions were 95°C 60 s, then 95°C 5 s and 60°C 40 s, lasting 40 cycles. The Ct value is the cycle number reflecting to reach the detection threshold of fluorescence signal. Relative gene expression levels were calculated by 2–ΔΔCt. Mann–Whitney U-tests were used for significance difference analysis by ΔΔCt values, and the data were reported as mean ± SE. Amplifications were performed in triplicate for each sample.
Results
Overviews of GWAS Data Sets and Network Modules Constructed
We calculated the total heritability/SE/intercept of two GWAS datasets in this study by LDSC and observed that there was little difference in heritability between the two microarrays (GCST006414: 0.0236/0.0022/1.0503 and Finngen_r3_I9_AF: 0.0485/0.0087/1.0324). Although their intercept values are close to 1, more data are needed to confirm how close they are to the true heritability because there are few variables available from the GWAS summary_statistic datasets such as environmental factors. The GWAS discovery and test sets were constructed by ProxyGeneLD, composed of 2,676 and 1,142 genes with adj p < 0.05, respectively (showed in red in the first and second histogram tracks of Figure 1), and the GS values of first 5,000 genes with high standard deviations from the LAA and RAA of GSE128188 are shown in the third and four histogram tracks of Figure 1. There were no outlier values observed in the expression sets of LAA and RAA (Figures 2A,B). Both WGCNA networks of LAA and RAA were constructed, and the power indexes β were confirmed as 18 using the “pickSoftThreshold” function (Figures 2C,D). Ten and 12 distinct gene modules were identified in LAA and RAA, respectively. A unique color was assigned to each module, and the ranges of the gene number of modules from LAA and RAA were from 101 (magenta) to 1,642 (turquoise), and from 159 (green yellow) to 1,066 (turquoise). Two gray modules with 448 and 634 genes represented the background color (Figures 2E,F).
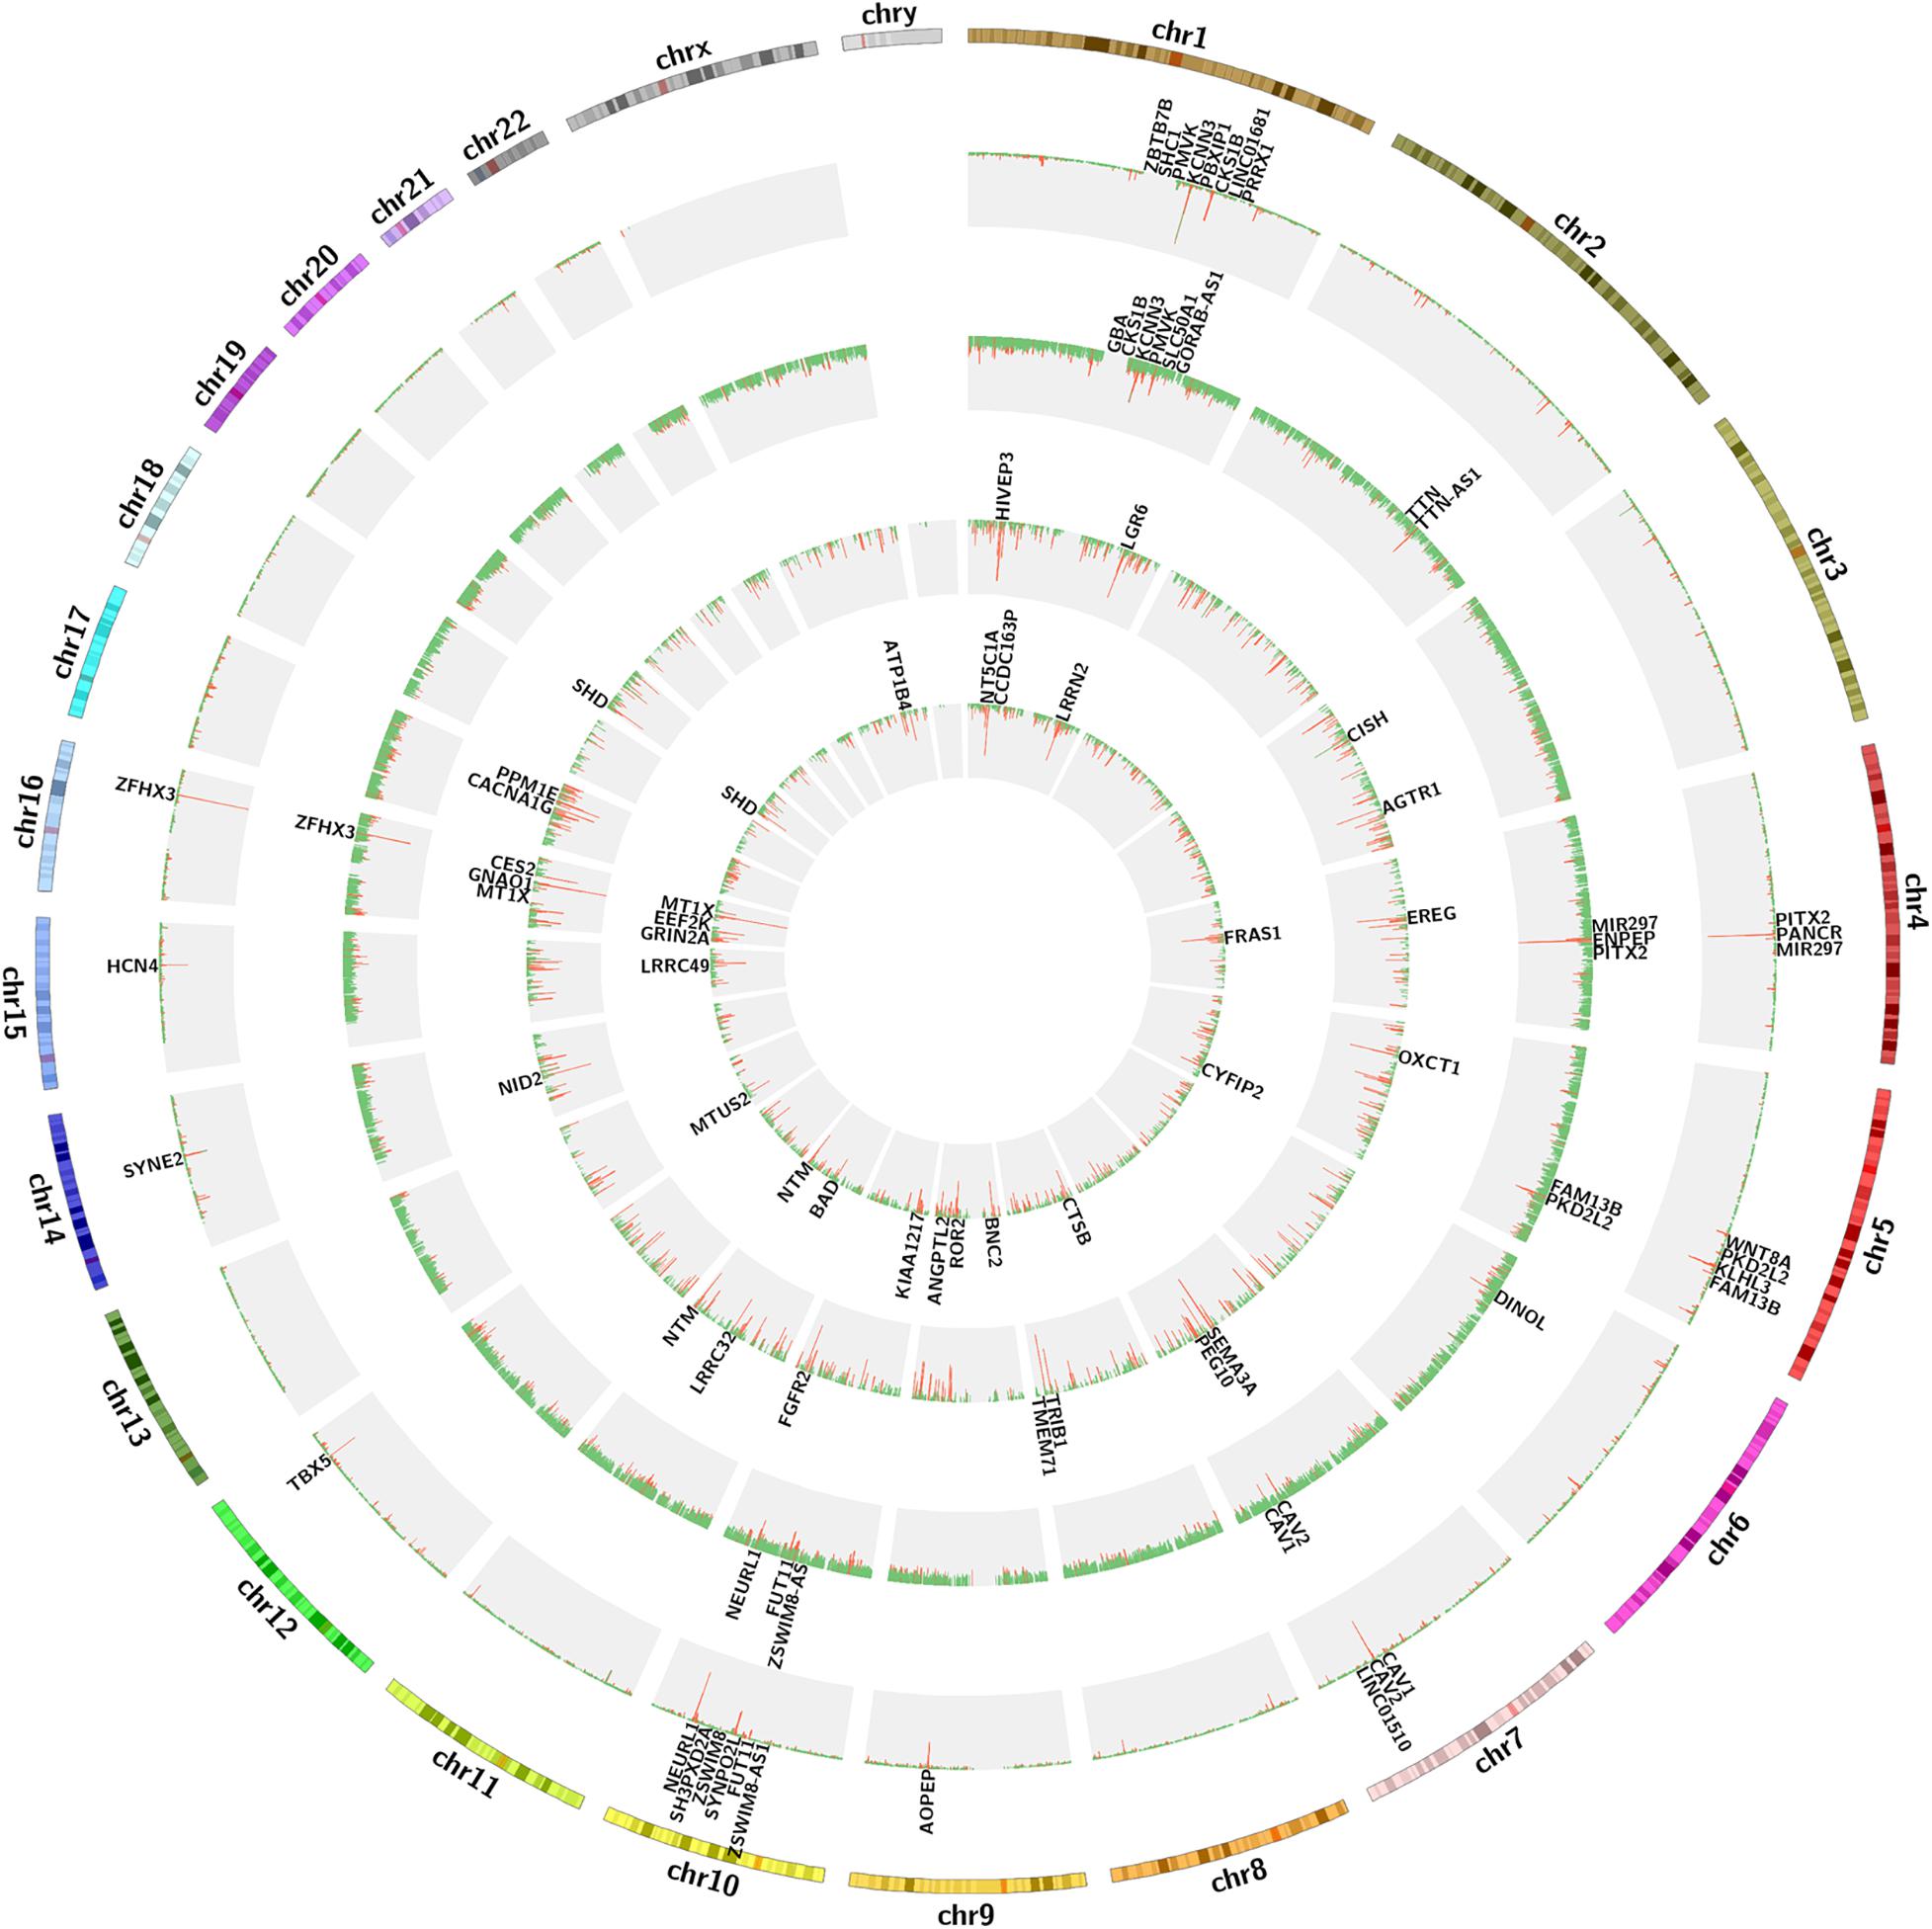
Figure 1. The circos diagram for GWAS and expression data sets. Two outermost tracks represent the chromosome text and banding positions. From the outside to the inside, the first and second histogram tracks represent the GWAS discovery and test sets, respectively. The red abundance value along the vertical axis represents the genes with adj p < 0.05, the first 20 of which are displayed in the first and second text tracks, and the green represents the genes with adj p > 0.05. The third and four histogram tracks represent the GS values of the expression sets of LAA and RAA, respectively. The red abundance value along the vertical axis represents the genes with GS > 2, the first 20 of which are displayed in the third and four text tracks, and the green represents the genes with GS < 2. GS, gene significance; LAA, left atrial appendage; RAA, right atrial appendage.
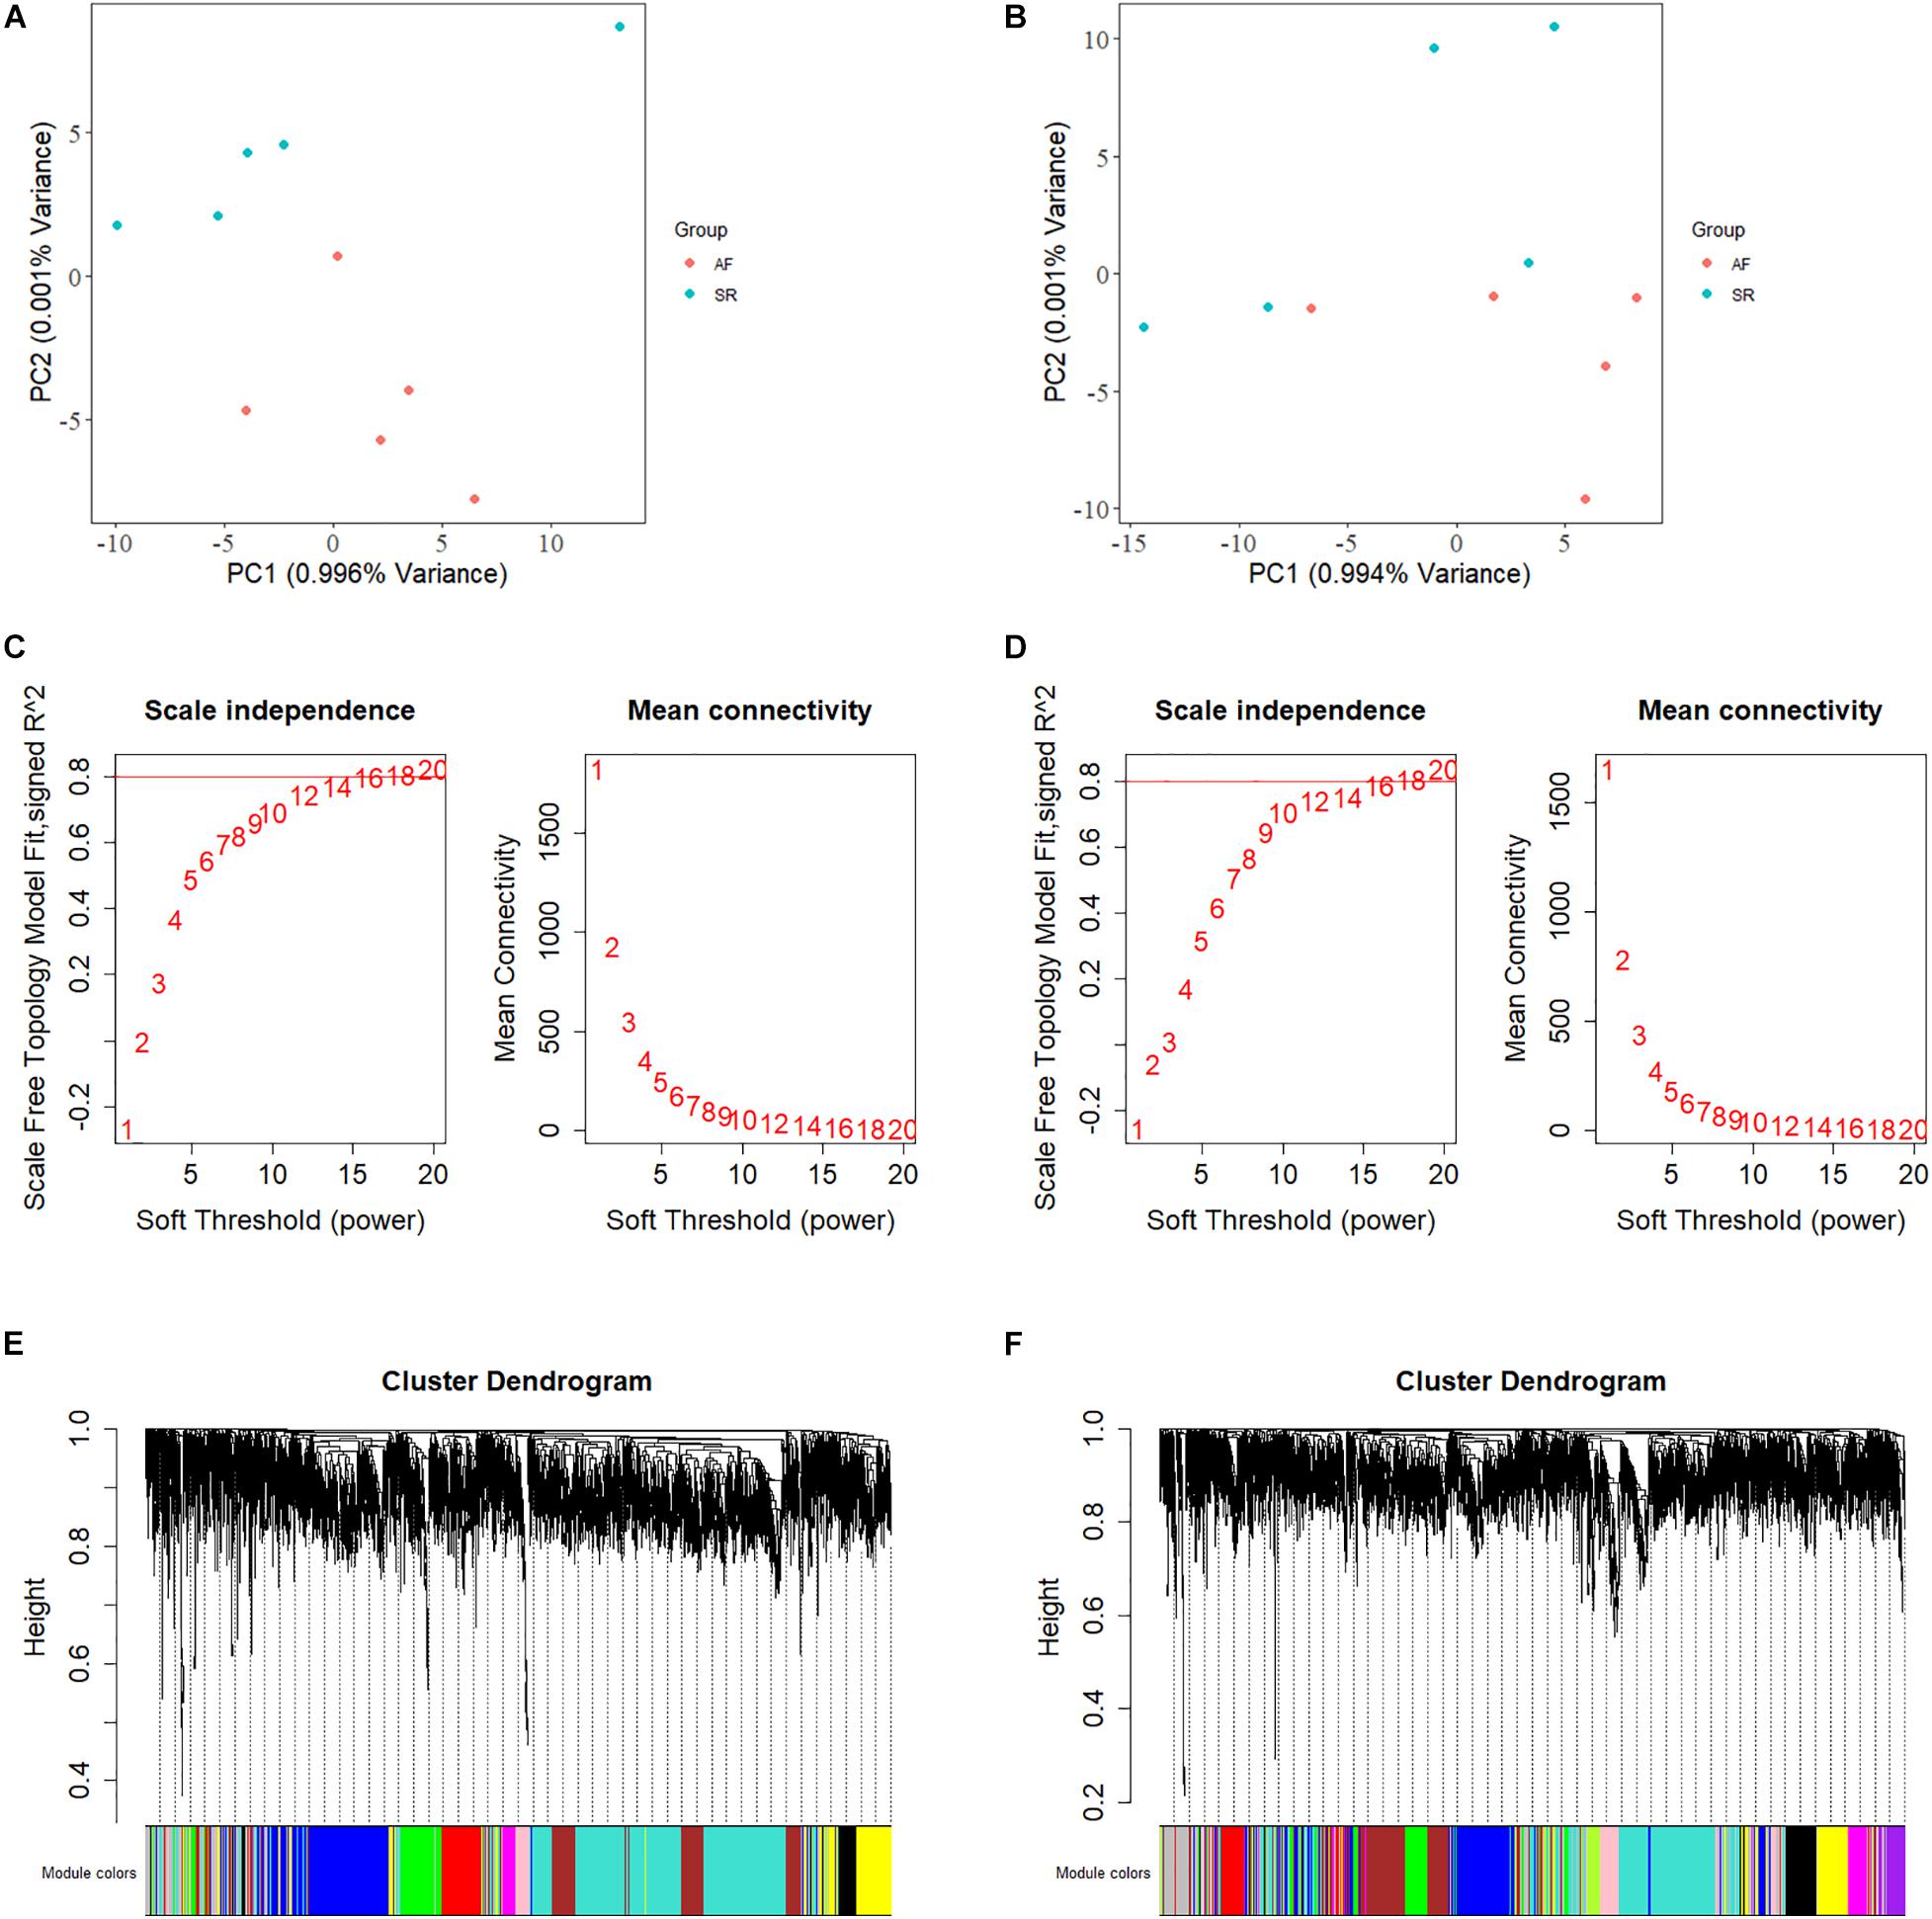
Figure 2. The principal component analysis, the calculation of power indexes, and the generation of module cluster trees on expression data sets. (A) The PCA plot is shown for determination of outlier samples in LAA. (B) The PCA plot is shown for determination of outlier samples in RAA. (C) Analysis of network topology for various soft-thresholding powers in LAA. The y-axis of the left panel represents the scale-free fit index while the x-axis indicates the soft-thresholding power. The y-axis of the right panel displays the mean connectivity and the x-axis also represents the soft-thresholding power. (D) Analysis of network topology for various soft-thresholding powers in RAA. (E) The construction of module cluster tree in LAA. In the picture, branches correspond to the coexpression modules with highly interconnected groups of genes. (F) The construction of module cluster tree in RAA. LAA, left atrial appendage; PCA, principal component analysis; RAA, right atrial appendage.
Discovery of the Modules With Best Biological Implications
Module eigengene metrics corresponds to the first principal component of a given module and is considered as the most representative gene expression in module. The correlation between ME and AF was estimated by CC metrics. Significant results were displayed in the blue (CC = 0.51, p = 0.0076) and yellow (CC = 0.51, p = 0.023) modules of LAA, and in the yellow (CC = 0.51, p = 0.0099), brown (CC = 0.71, p = 0.0099), and magenta (CC = 0.51, p = 0.014) modules of RAA (Figures 3A,B).
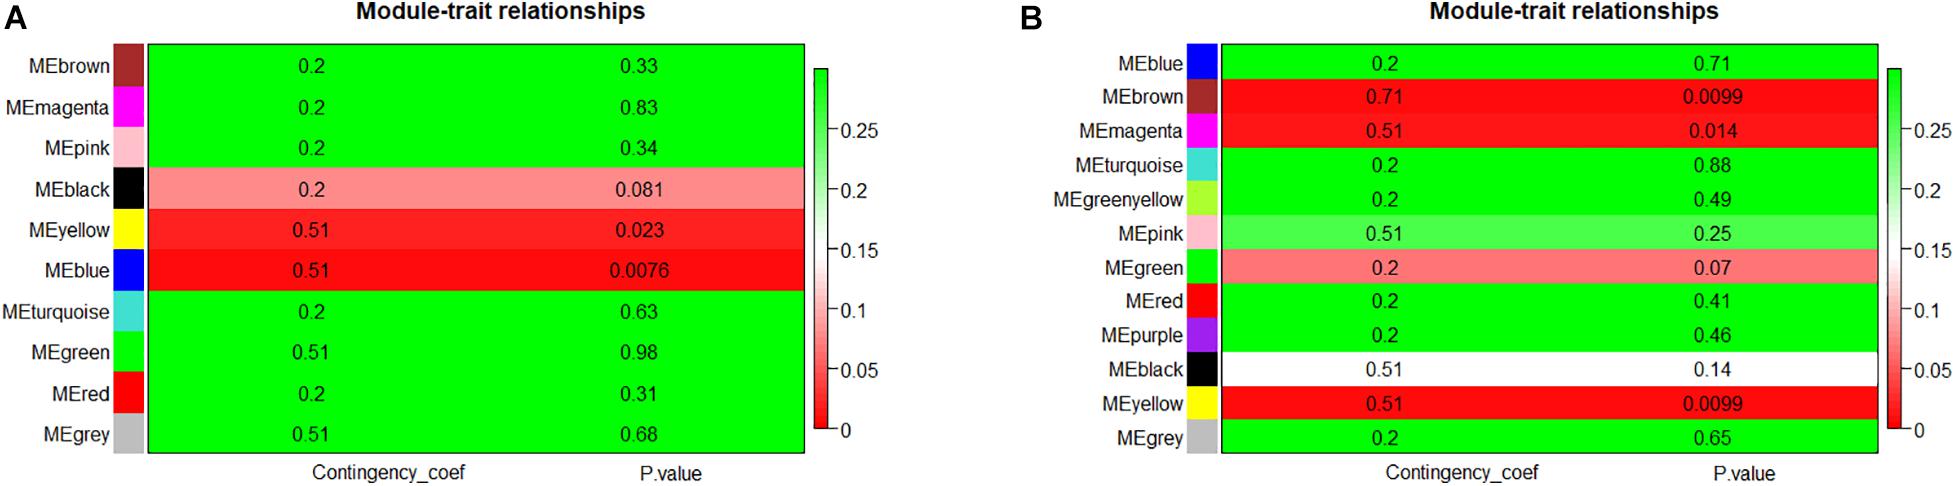
Figure 3. The module–trait associations of networks. (A) Module–trait associations in LAA. Row represents a module eigengene, column indicates disease status – AF or SR. Each cell contained the corresponding correlation and p-value. The table was color-coded by p-value according to the color legend. (B) Module–trait associations in RAA. LAA, left atrial appendage; RAA, right atrial appendage.
To incorporate the AF trait into the network modules, we introduced GS measure. Theoretically, an increased GS value of the i-th gene leads to enhanced biological significance of the i-th gene. GS metrics captures the difference between AF and SR groups for each gene by p-values of hypothesis testing. MM measures how tightly a special gene fits into its module and thus reflects the module cohesiveness. Furthermore, the relationship between GS and MM verifies the biological significance of module. As shown in Figures 4A,B, significantly positive correlations were observed in the blue (R = 0.44, p = 2.2E–16) and yellow (R = 0.55, p = 2.2E–16) modules of LAA, and likewise showed in the yellow (R = 0.48, p = 2.2E–16), brown (R = 0.48, p = 2.2E–16), and magenta (R = 0.58, p = 2.2E–16) modules of RAA, suggesting that the modules were strongly associated with AF.
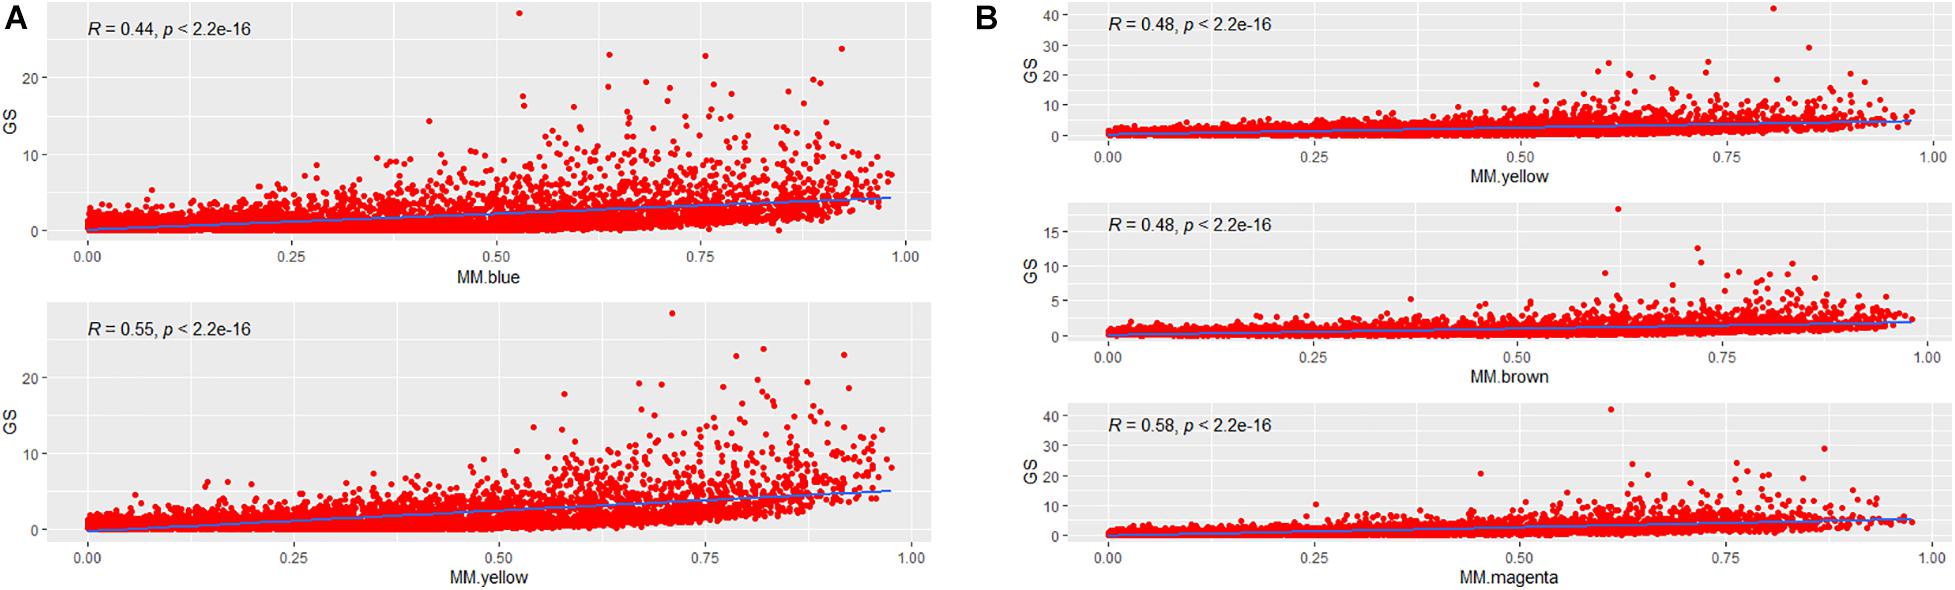
Figure 4. The correlation between MM and GS. (A) The correlation between MM and GS for each of two AF-associated modules in LAA. MM for each module is plotted against GS. (B) The correlation between MM and GS for each of three AF-associated modules in RAA. GS, gene significance; LAA, left atrial appendage; RAA, right atrial appendage.
Differential Expression Profiles and Enrichment Pathways of LAA and RAA
The Venn plot constructed by five modules associated with AF showed 429 and 304 genes with high propensity to aggregate, respectively, in LAA and RAA (Figure 5). However, only 137 genes were overlapped between LAA and RAA, suggesting the difference of expression profiles of left and right hearts for AF. In addition, in LAA, GSEA showed that the transcriptome data were enriched in the pathways such as calcium signaling pathway (p = 0, FDR = 0.017), collagen containing extracellular matrix (p = 0, FDR = 0.2), mitochondrial respiratory chain complex (p = 0.002, FDR = 0.01), and potassium channel activity (p = 0, FDR = 0.02) (Figure 6A). In RAA, data demonstrated that the pathways such as cardiac muscle cell contraction (p = 0, FDR = 0.002), collagen containing extracellular matrix (p = 0, FDR = 0.0005), extracellular structure organization (p = 0, FDR = 0.17), and oxidative phosphorylation (p = 0, FDR = 0) were enriched (Figure 6B). These results suggest that the pathogenesis of AF is related to the factors such as the increase of atrial fibrosis, the decrease of channel protein function, and mitochondrial dysfunction. All GSEA-related data are included in Supplementary File 2.
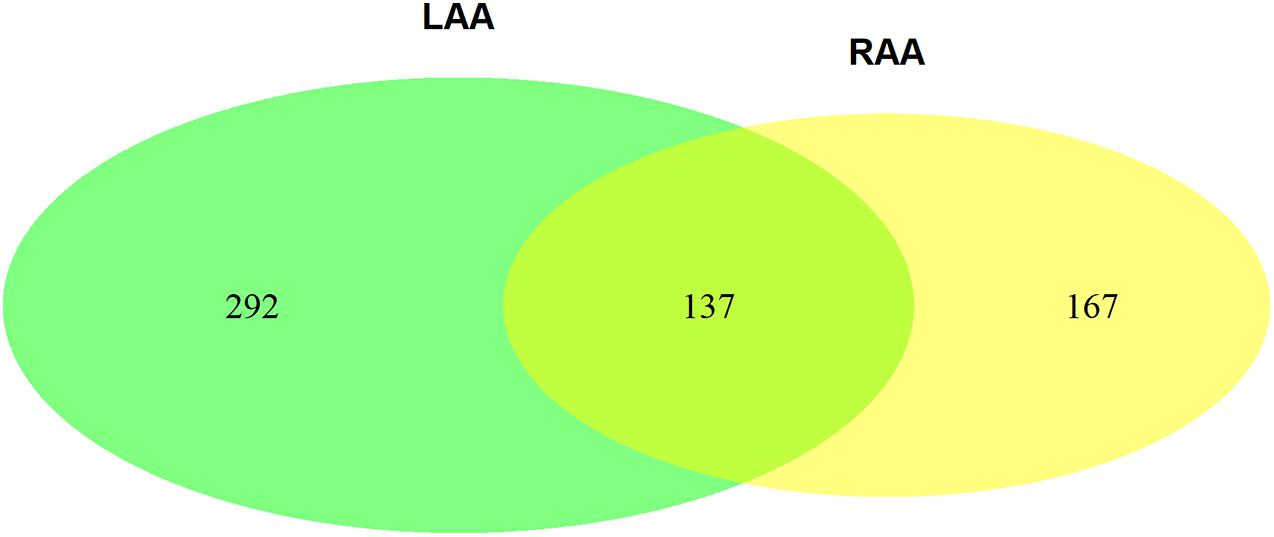
Figure 5. The Venn plot constructed by two AF-associated modules in LAA and three AF-associated modules in RAA (GS > 2). GS, gene significance; LAA, left atrial appendage; RAA, right atrial appendage.
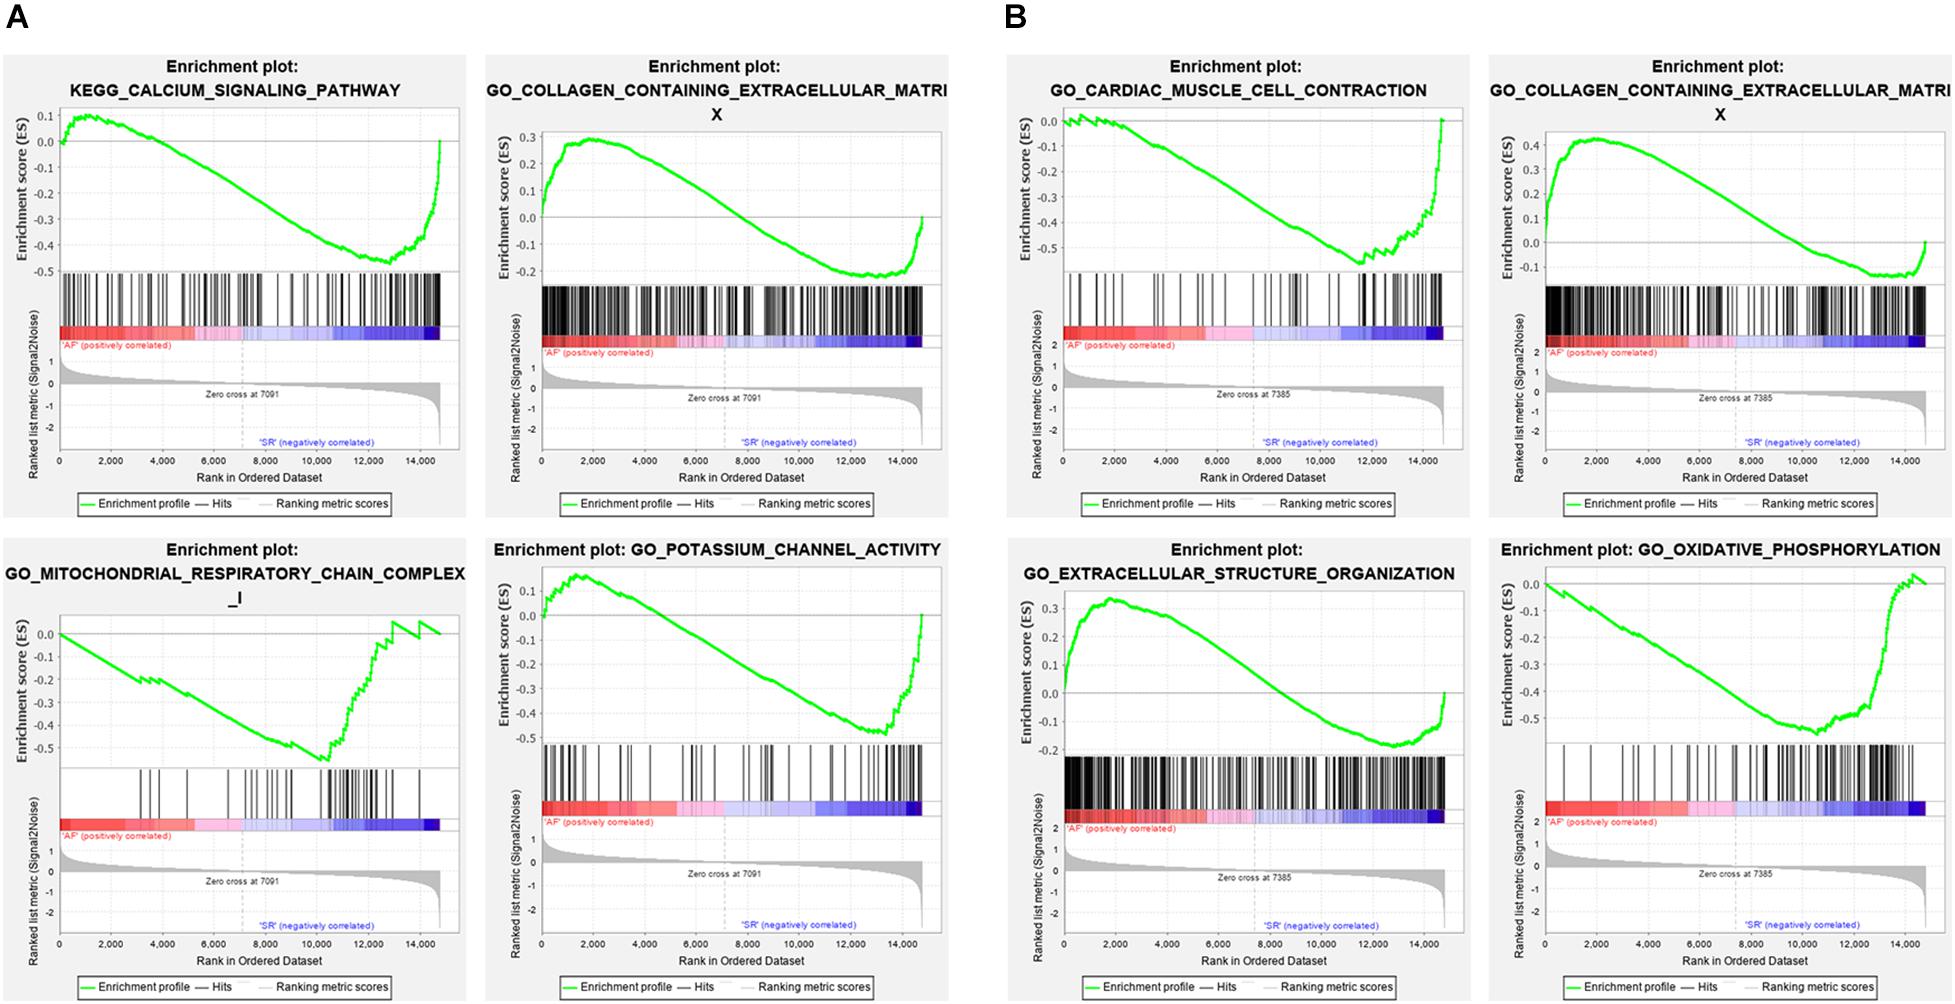
Figure 6. The enrichment pathways from GSEA. (A) The enrichment pathways from GSEA in LAA. (B) The enrichment pathways from GSEA in RAA. LAA, left atrial appendage; RAA, right atrial appendage.
Determination of Newly AF-Associated Biomarkers
One of the advantages of Cytoscape is the ability to intuitively and visually demonstrate connections between genes with association evidence by TOM. In LAA, the edge file “Blueyellow.edges” (Supplementary File 3) reflecting the weight relationships between the blue plus yellow module genes was obtained by the “exportNetworkToCytoscape” function in WGNNA package and was as an input file of Cytoscape. Setting the weight cutoff value of the edge to 0.15, we observed 130 genes crosslinked with each other in the network, and 22 core genes (the octagon nodes) are presented in Figure 7A. By the GWAS test set, the AF-associated gene MYH7 (adj pdis = 7.6E–6, adj ptest = 0.014, GS = 3.95) confirmed in previous studies was identified, while four novel biomarkers associated with AF were determined, including ERBB2 (adj pdis = 5.1E–7, adj ptest = 0.013, GS = 3.34), HERC4 (adj pdis = 6E–6, adj ptest = 0.0042, GS = 3.0), MYPN (adj pdis = 0.0004, adj ptest = 0.02, GS = 2.07), and PBXIP1 (adj pdis = 0.00036, adj ptest = 0.0002, GS = 3.3). Following the same steps mentioned previously (the edge file “Yellowbrowmagenta.edges” seen in Supplementary File 4), we just obtained eight core genes and eventually get one AF-associated gene LOXL1 (adj pdis = 0.047, adj ptest = 0.07, GS = 3.0) in RAA (Figure 7B). Taken together, these results could indicate that the triggering and maintenance of AF is incline to the left atrium. Subsequently, the six AF-associated loci were verified from the LAA of 30 clinical patients by RT-qPCR, and the data showed that the expression of ERBB2, MYH7, and MYPN in AF group had significant change compared with that in SR group, while that of HERC4, LOXL1, and PBXIP1 had no change (Figure 8).
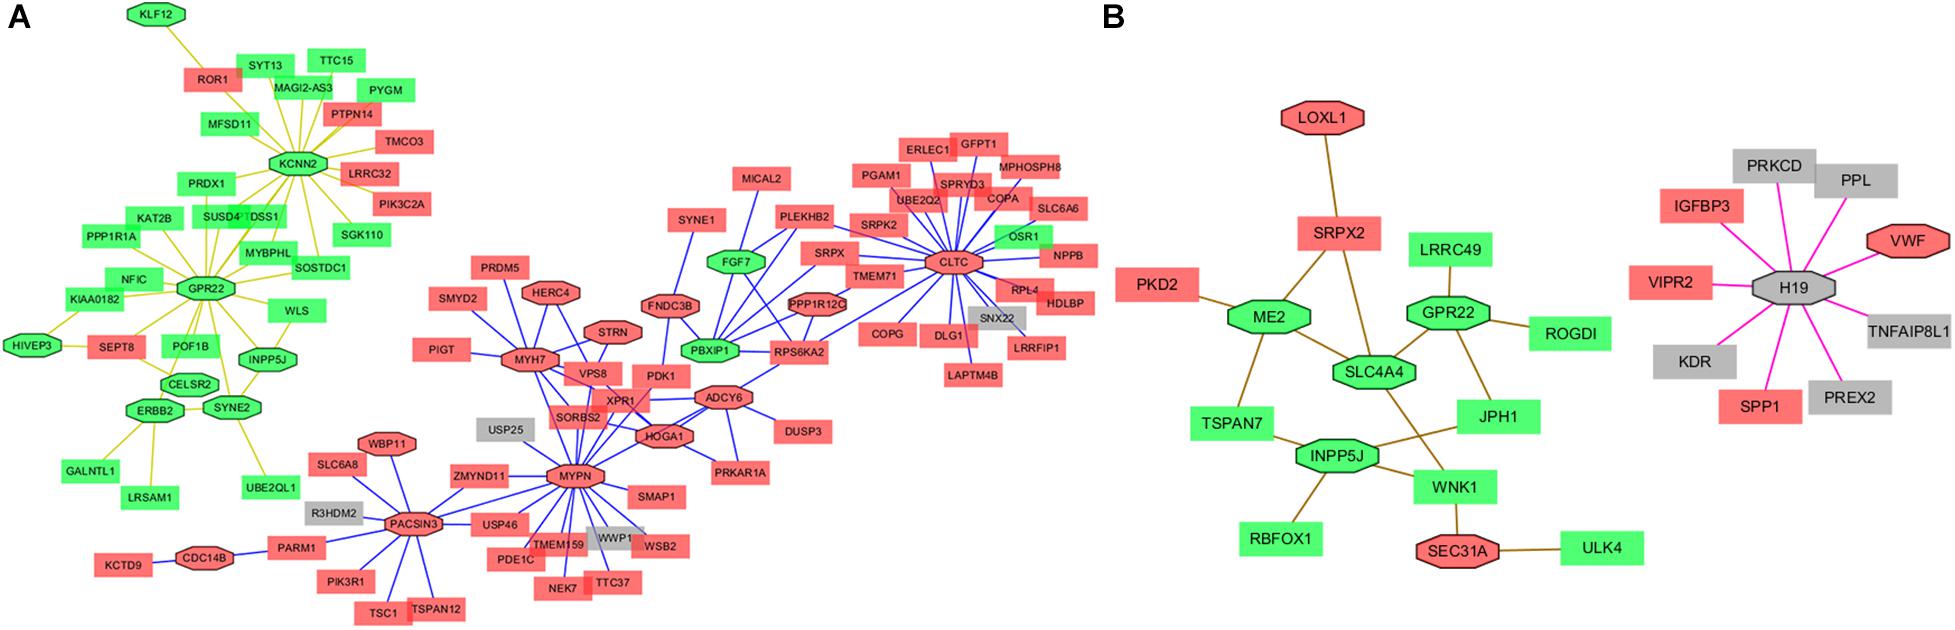
Figure 7. The Network view from Cytoscape. (A) The Network view from Cytoscape in LAA. (B) Network view from Cytoscape in RAA. The module edge > 0.15. Green color represents downregulated genes with GS > 2, red color represents upregulated genes with GS > 2, and gray color represents the genes with GS < 2. Octagon nodes represent core genes. GS, gene significance; LAA, left atrial appendage; RAA, right atrial appendage.
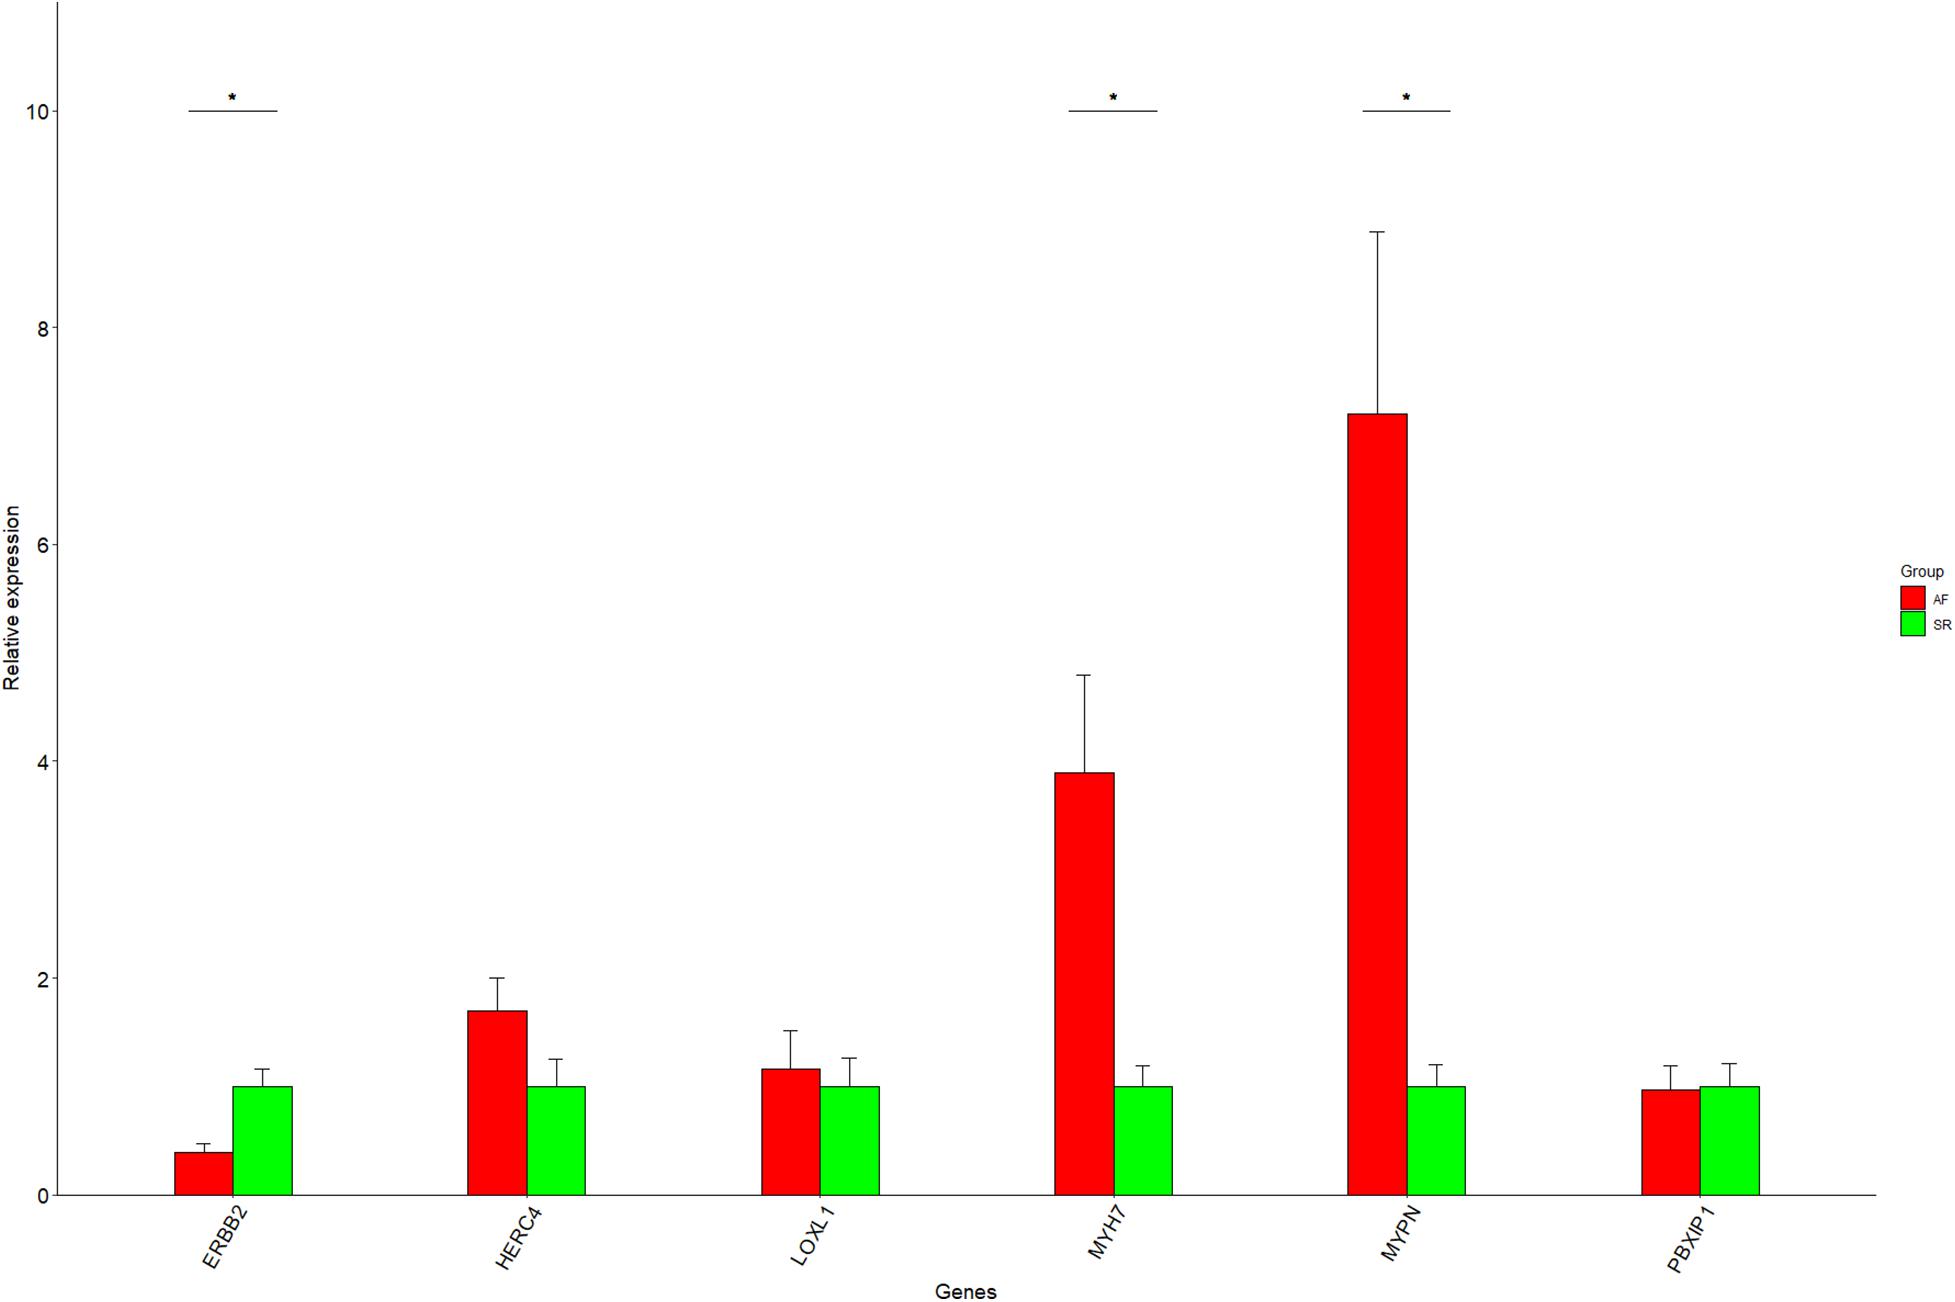
Figure 8. The RT-qPCR results for six genes. Data are shown as mean ± SE, and each sample is in triplicate. AF, atrial fibrillation; SR, sinus rhythm. *P < 0.05.
Discussion
In the present study, we first combined GWAS with gene expression profile data from the LAA and RAA of patients to dig newly AF-associated biomarkers by ProxyGeneLD and WGCNA. In LAA and RAA, five AF-associated modules were identified and were verified by the relationships between MM and GS. In the GWAS discovery set, 30 core genes which exhibited GWAS nominal evidence for AF associations (adj pdis < 0.05) were visually shown in the network constructed by Cytoscape, and six AF-associated genes were determined (LAA: 5 and RAA: 1) by the GWAS test set. Using RT-qPCR, two novel genes associated with AF ERBB2 and MYPN are eventually identified. The scheme of this study is shown in Figure 9 and other WGCNA-related data in this study are illustrated in Supplementary File 5.
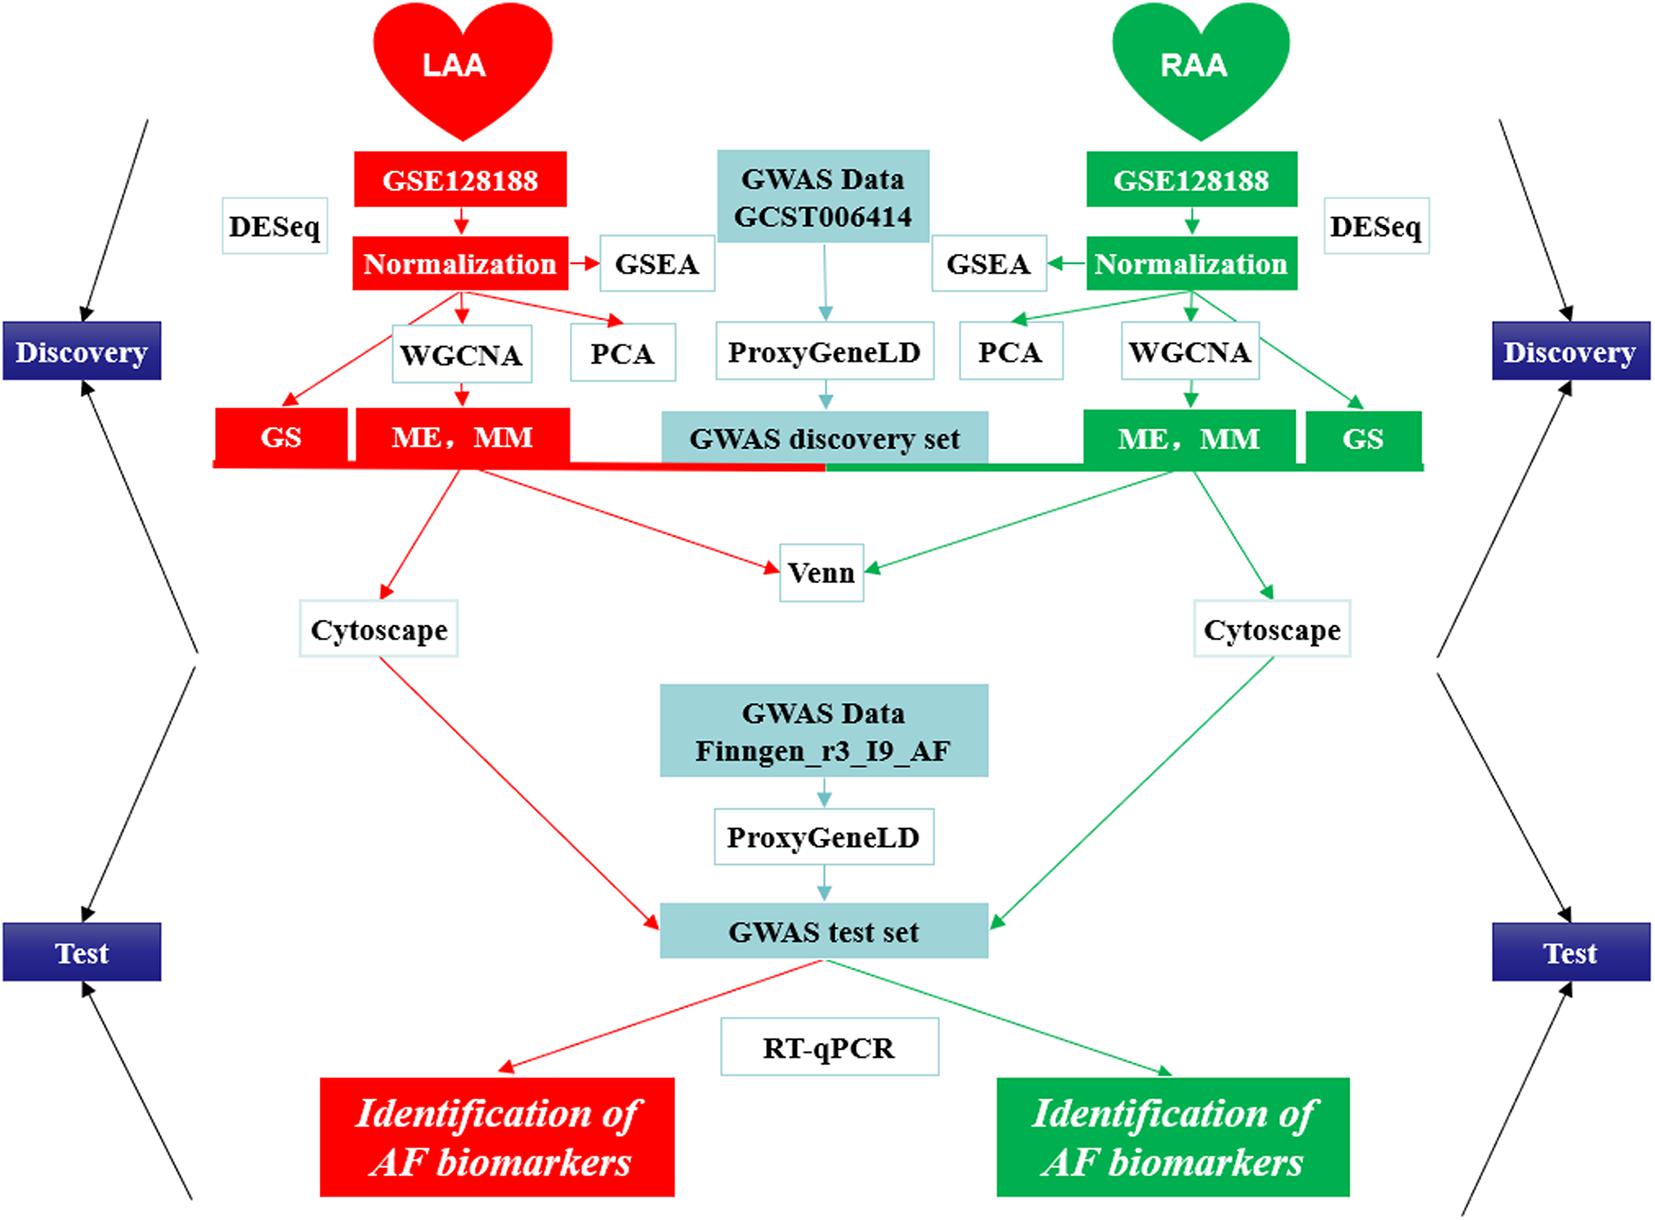
Figure 9. The design scheme of this study. GS, gene significance; LAA, left atrial appendage; ME, module eigengene; MM, module membership; PCA, principal component analysis; RAA, right atrial appendage.
In recent years, some biomarkers associated with AF have been successfully identified by GWAS. However, the genetics of AF risk is still not fully elucidated, particularly the subtle-effect genes associated with AF (p > 5E–08). Although network-based analyses such as GO and KEGG can be applied to identify subtle-effect genes, they do not consider the mutual interconnection between genes (Ritchie, 2009; Torkamani and Schork, 2009). Farber (2013) combined GWAS with WGCNA to explore network modules and new biomarkers relative to osteoporosis, which inspired the implementation of the analysis for AF, with some modification. In this study, we applied the combination of GWAS with expression profile data on AF and obtained useful network modules and core genes by taking into account unsupervised clustering, flexible soft thresholds, the connections between genes, and the reduced dimensionality of thousands of expressed genes. The combination of ProxyGeneLD and WGCNA may provide a new perspective for revealing more hidden biomarkers associated with AF.
Using WGCNA, our results repeated most of the differentially expressed genes in the original literature (Thomas et al., 2019) (the upregulated/downregulated in LAA: KCNJ2 and PRKAR1A/FGFR2 and PTPRU, the upregulated/downregulated in RAA: COL12A1 and RPL3L/CADM2 and COG5, and the simultaneously expressed in LAA and RAA: the GPR22, PPP1R1A, and RGS6). Similarly, the results of pathway analysis were also reproduced in the original literature, such as cation channel and plasma membrane in LAA, and collagen-, extracellular matrix-, clathrin-, and Golgi-related pathways in RAA. The aforementioned data suggest the reliability and repeatability of WGCNA and GSEA. Besides, our results showed that multiple pathways related to AF were not present in the original text, including calcium signaling pathway, collagen-containing extracellular matrix, mitochondrial respiratory chain complex, and potassium channel activity in LAA, most of which are complicated in either atrial structural or electrical remodeling (Jalife and Kaur, 2015), suggesting that GSEA taking into account gene expression values could have an advantage over classic enrichment pathway software such as GO or KEGG.
Based on the study protocol published by Farber (2013), with small modifications, we mined potential AF-associated genes using GWAS and transcriptome expression profile data on left–right atrial appendages, and the six confirmed and newly AF-associated biomarkers were identified and validated. Previous studies have reported that in atrium the upregulated MYH7, a ventricular-myosin heavy chain isoform, are associated with AF, which might improve economy of contraction by the increase in metabolic demand of AF (Barth et al., 2005). In our study, the significant expression elevation was observed for this gene, not only in our data-mining process using bioinformatics but also in our experimental verification using RT-qPCR. Although the adj ptest value of LOXL1, as the only candidate marker of RAA associated with AF in this study, is greater than 0.05, it plays a key role in extracellular matrix homeostasis and remodeling, family members of which participate in heart failure, myocardial infarction, cardiac hypertrophy, dilated cardiomyopathy, and AF (Philp et al., 2018; Rodriguez and Martinez-Gonzalez, 2019). It was not observed that the expression of this gene changed in human LAA by RT-qPCR, similar to our data-mining result. However, whether the gene is differentially expressed in human RAA still needs to be further verified by subsequent experiments.
In this study, the four AF markers, ERBB2, HERC4, MYPN, and PBXIP1, have not been reported in previous studies. ERBB2, associated with heart failure, can improve mammalian heart regeneration, and promote cardiomyocyte dedifferentiation and proliferation (D’Uva et al., 2015). Belmonte et al. (2015) reported that its overexpression can upregulate antioxidant enzymes, reduce basal levels of reactive oxygen species, and thus protect the myocardium. Our data mining and RT-qPCR results showed that the expression level of ERBB2 is downregulated, indicating that the gene may increase reactive oxygen species, decrease antioxidant enzymes, and diminish the ability of cardiomyocytes to regenerate, and thus that it could be one of AF remodeling substrates. MYPN as a messenger gene links structural and gene regulatory molecules to the nucleus in cardiomyocyte by translocation from the I-bands or Z-disk. It is clear that numerous mutation loci in the gene are associated with hypertrophic, dilated, and restrictive cardiomyopathy (Chen et al., 2017). One study demonstrated that MYPN knockout mice exhibited a 48% reduction in myofiber cross-sectional area and significantly increased fiber number, compared with wild-type controls (Filomena et al., 2020). Our results showed that this gene is upregulated, suggesting that it may induce abnormal atrial myocardial fibrosis and therefore be associated with the occurrence of AF. Furthermore, our data from RT-qPCR showed that HERC4 as a tumor suppressor (Xu et al., 2019) and PBXIP1 (Arrington et al., 2012) contributing to tumor cell growth and migration are not related to AF, and further studies are needed.
Because there is only a small amount of genome-wide expression profile data available for AF in public databases, especially containing both LAA and RAA of individuals, the statistical efficacy may be limited in this study. However, studies using WGCNA to analyze small sample data are comparatively abundant, and convincing results have been obtained from previous studies (Gargalovic et al., 2006; Gong et al., 2007; Farber, 2013), and our data-mining results were confirmed by RT-qPCR. In addition, although no stratification of clinic types of AF was conducted in our study, we expected that this problem be solved using a larger sample in the future. Furthermore, the lack of RAA samples limits our verification of AF markers in RAA, which will be improved in subsequent studies. However, as a powerful bioinformatic method, coexpressed nodes of WGCNA may have interdependent mechanistic relationships that are not yet appreciated, which may lead to the co-identification of genes in associated studies (Liu et al., 2015a). Of note, the present study did not identify all the genes that were known in the previous GWAS, as it was only a supplementary work for exploring biomarkers related to AF.
Conclusion
In summary, we revealed effectively two newly AF-associated genes ERBB2 and MYPN by integrating GWAS with expression profile data using theories and methods of systems biology, and based our hypothesis on the missing heritability generated by GWAS data. These findings highlight the value of the network approach in the acquisition of newly AF-associated genes and provide insights into the pathological mechanisms of AF.
Data Availability Statement
The datasets presented in this study can be found in online repositories. The names of the repository/repositories and accession number(s) can be found in the article/Supplementary Material.
Ethics Statement
The studies involving human participants were reviewed and approved by The IRB of Zhengzhou No. 7 People’s Hospital. The patients/participants provided their written informed consent to participate in this study.
Author Contributions
XM and YY: study conception and design, analysis of data, and drafting of manuscript. JZ: interpretation of data. YN, KW, and CF: acquisition of data, sample collection and testing, and critical revision. All authors read and approved the final manuscript.
Funding
This work was supported by the National Natural Science Foundation of China (U1404833) and by Joint Construction Project of Medical Science and Technology Research Plan of Henan Province (LHGJ20191111).
Conflict of Interest
The authors declare that the research was conducted in the absence of any commercial or financial relationships that could be construed as a potential conflict of interest.
Acknowledgments
We acknowledge the participants and investigators of the FinnGen study.
Supplementary Material
The Supplementary Material for this article can be found online at: https://www.frontiersin.org/articles/10.3389/fgene.2021.696591/full#supplementary-material
Footnotes
References
Acciarresi, M., Paciaroni, M., Agnelli, G., Falocci, N., Caso, V., Becattini, C., et al. (2017). Prestroke CHA2DS2-VASc score and severity of acute stroke in patients with atrial fibrillation: findings from RAF study. J. Stroke Cerebrovasc. Dis. 26, 1363–1368. doi: 10.1016/j.jstrokecerebrovasdis.2017.02.011
Arrington, C. B., Dowse, B. R., Bleyl, S. B., and Bowles, N. E. (2012). Non-synonymous variants in pre-B cell leukemia homeobox (PBX) genes are associated with congenital heart defects. Eur. J. Med. Genet. 55, 235–237. doi: 10.1016/j.ejmg.2012.02.002
Askland, K., Read, C., and Moore, J. (2009). Pathways-based analyses of whole-genome association study data in bipolar disorder reveal genes mediating ion channel activity and synaptic neurotransmission. Hum. Genet. 125, 63–79. doi: 10.1007/s00439-008-0600-y
Bapat, A., Anderson, C. D., Ellinor, P. T., and Lubitz, S. A. (2018). Genomic basis of atrial fibrillation. Heart 104, 201–206. doi: 10.1136/heartjnl-2016-311027
Barrios, V., Calderon, A., Escobar, C., and de la Figuera, M., and Primary Care Group in the Clinical Cardiology Section of the Spanish Society of Cardiology (2012). Patients with atrial fibrillation in a primary care setting: Val-FAAP study. Rev. Esp. Cardiol. 65, 47–53. doi: 10.1016/j.recesp.2011.08.008
Barth, A. S., Merk, S., Arnoldi, E., Zwermann, L., Kloos, P., Gebauer, M., et al. (2005). Reprogramming of the human atrial transcriptome in permanent atrial fibrillation: expression of a ventricular-like genomic signature. Circ. Res. 96, 1022–1029. doi: 10.1161/01.RES.0000165480.82737.33
Belmonte, F., Das, S., Sysa-Shah, P., Sivakumaran, V., Stanley, B., Guo, X., et al. (2015). ErbB2 overexpression upregulates antioxidant enzymes, reduces basal levels of reactive oxygen species, and protects against doxorubicin cardiotoxicity. Am. J. Physiol. Heart Circ. Physiol. 309, H1271–H1280. doi: 10.1152/ajpheart.00517.2014
Bulik-Sullivan, B. K., Loh, P. R., Finucane, H. K., Ripke, S., and Yang, J., Schizophrenia Working Group of the Psychiatric Genomics Consortium, et al. (2015). LD Score regression distinguishes confounding from polygenicity in genome-wide association studies. Nat. Genet. 47, 291–295. doi: 10.1038/ng.3211
Chen, Y. C., Guo, Y. F., He, H., Lin, X., Wang, X. F., Zhou, R., et al. (2016). Integrative analysis of genomics and transcriptome data to identify potential functional genes of BMDs in females. J. Bone Miner. Res. 31, 1041–1049. doi: 10.1002/jbmr.2781
Chen, Y., Barajas-Martinez, H., Zhu, D., Wang, X., Chen, C., Zhuang, R., et al. (2017). Novel trigenic CACNA1C/DES/MYPN mutations in a family of hypertrophic cardiomyopathy with early repolarization and short QT syndrome. J. Transl. Med. 15:78. doi: 10.1186/s12967-017-1180-1
Christophersen, I. E., Rienstra, M., Roselli, C., Yin, X., Geelhoed, B., Barnard, J., et al. (2017). Large-scale analyses of common and rare variants identify 12 new loci associated with atrial fibrillation. Nat. Genet. 49, 946–952. doi: 10.1038/ng.3843
D’Uva, G., Aharonov, A., Lauriola, M., Kain, D., Yahalom-Ronen, Y., Carvalho, S., et al. (2015). ERBB2 triggers mammalian heart regeneration by promoting cardiomyocyte dedifferentiation and proliferation. Nat. Cell Biol. 17, 627–638. doi: 10.1038/ncb3149
Elbers, C. C., van Eijk, K. R., Franke, L., Mulder, F., van der Schouw, Y. T., Wijmenga, C., et al. (2009). Using genome-wide pathway analysis to unravel the etiology of complex diseases. Genet. Epidemiol. 33, 419–431. doi: 10.1002/gepi.20395
Farber, C. R. (2010). Identification of a gene module associated with BMD through the integration of network analysis and genome-wide association data. J. Bone Miner. Res. 25, 2359–2367. doi: 10.1002/jbmr.138
Farber, C. R. (2013). Systems-level analysis of genome-wide association data. G3 3, 119–129. doi: 10.1534/g3.112.004788
Filomena, M. C., Yamamoto, D. L., Caremani, M., Kadarla, V. K., Mastrototaro, G., Serio, S., et al. (2020). Myopalladin promotes muscle growth through modulation of the serum response factor pathway. J. Cachexia Sarcopenia Muscle 11, 169–194. doi: 10.1002/jcsm.12486
Finucane, H. K., Bulik-Sullivan, B., Gusev, A., Trynka, G., Reshef, Y., Loh, P. R., et al. (2015). Partitioning heritability by functional annotation using genome-wide association summary statistics. Nat. Genet. 47, 1228–1235. doi: 10.1038/ng.3404
Gargalovic, P. S., Imura, M., Zhang, B., Gharavi, N. M., Clark, M. J., Pagnon, J., et al. (2006). Identification of inflammatory gene modules based on variations of human endothelial cell responses to oxidized lipids. Proc. Natl. Acad. Sci. U.S.A. 103, 12741–12746. doi: 10.1073/pnas.0605457103
Gong, K. W., Zhao, W., Li, N., Barajas, B., Kleinman, M., Sioutas, C., et al. (2007). Air-pollutant chemicals and oxidized lipids exhibit genome-wide synergistic effects on endothelial cells. Genome Biol. 8:R149. doi: 10.1186/gb-2007-8-7-r149
He, J., Zhu, W., Yu, Y., Hu, J., and Hong, K. (2018). Variant rs2200733 and rs10033464 on chromosome 4q25 are associated with increased risk of atrial fibrillation after catheter ablation: evidence from a meta-analysis. Cardiol. J. 25, 628–638. doi: 10.5603/CJ.a2017.0143
Hong, M. G., Pawitan, Y., Magnusson, P. K., and Prince, J. A. (2009). Strategies and issues in the detection of pathway enrichment in genome-wide association studies. Hum. Genet. 126, 289–301. doi: 10.1007/s00439-009-0676-z
Jalife, J., and Kaur, K. (2015). Atrial remodeling, fibrosis, and atrial fibrillation. Trends Cardiovasc. Med. 25, 475–484. doi: 10.1016/j.tcm.2014.12.015
Jannot, A. S., Ehret, G., and Perneger, T. (2015). P < 5 x 10(-8) has emerged as a standard of statistical significance for genome-wide association studies. J. Clin. Epidemiol. 68, 460–465. doi: 10.1016/j.jclinepi.2015.01.001
Jia, P., Wang, L., Fanous, A. H., Pato, C. N., and Edwards, T. L., International Schizophrenia Consortium, et al. (2012). Network-assisted investigation of combined causal signals from genome-wide association studies in schizophrenia. PLoS Comput. Biol. 8:e1002587. doi: 10.1371/journal.pcbi.1002587
Kong, J., Wang, T., Zhang, Z., Yang, X., Shen, S., and Wang, W. (2019). Five core genes related to the progression and prognosis of hepatocellular carcinoma identified by analysis of a coexpression network. DNA Cell Biol. 38, 1564–1576. doi: 10.1089/dna.2019.4932
Langfelder, P., and Horvath, S. (2008). WGCNA: an R package for weighted correlation network analysis. BMC Bioinformatics 9:559. doi: 10.1186/1471-2105-9-559
Lin, S. H., Chen, M. K., Chang, J. H., Velmurugan, B. K., Annamanedi, M., Su, S. C., et al. (2019). Impact of polymorphisms in casein kinase 1 epsilon and environmental factors in oral cancer susceptibility. J. Cancer 10, 5065–5069. doi: 10.7150/jca.34592
Liu, R., Guo, C. X., and Zhou, H. H. (2015a). Network-based approach to identify prognostic biomarkers for estrogen receptor-positive breast cancer treatment with tamoxifen. Cancer Biol. Ther. 16, 317–324. doi: 10.1080/15384047.2014.1002360
Liu, R., Lv, Q. L., Yu, J., Hu, L., Zhang, L. H., Cheng, Y., et al. (2015b). Correlating transcriptional networks with pathological complete response following neoadjuvant chemotherapy for breast cancer. Breast Cancer Res. Treat. 151, 607–618. doi: 10.1007/s10549-015-3428-x
Nielsen, J. B., Thorolfsdottir, R. B., Fritsche, L. G., Zhou, W., Skov, M. W., Graham, S. E., et al. (2018). Biobank-driven genomic discovery yields new insight into atrial fibrillation biology. Nat. Genet. 50, 1234–1239. doi: 10.1038/s41588-018-0171-3
Philp, C. J., Siebeke, I., Clements, D., Miller, S., Habgood, A., John, A. E., et al. (2018). Extracellular matrix cross-linking enhances fibroblast growth and protects against matrix proteolysis in lung fibrosis. Am. J. Respir. Cell Mol. Biol. 58, 594–603. doi: 10.1165/rcmb.2016-0379OC
Ritchie, M. D. (2009). Using prior knowledge and genome-wide association to identify pathways involved in multiple sclerosis. Genome Med. 1:65. doi: 10.1186/gm65
Rodriguez, C., and Martinez-Gonzalez, J. (2019). The role of lysyl oxidase enzymes in cardiac function and remodeling. Cells 8:1483. doi: 10.3390/cells8121483
Roselli, C., Chaffin, M. D., Weng, L. C., Aeschbacher, S., Ahlberg, G., Albert, C. M., et al. (2018). Multi-ethnic genome-wide association study for atrial fibrillation. Nat. Genet. 50, 1225–1233. doi: 10.1038/s41588-018-0133-9
Shannon, P., Markiel, A., Ozier, O., Baliga, N. S., Wang, J. T., Ramage, D., et al. (2003). Cytoscape: a software environment for integrated models of biomolecular interaction networks. Genome Res. 13, 2498–2504. doi: 10.1101/gr.1239303
Subramanian, A., Tamayo, P., Mootha, V. K., Mukherjee, S., Ebert, B. L., Gillette, M. A., et al. (2005). Gene set enrichment analysis: a knowledge-based approach for interpreting genome-wide expression profiles. Proc. Natl. Acad. Sci. U.S.A. 102, 15545–15550. doi: 10.1073/pnas.0506580102
Thomas, A. M., Cabrera, C. P., Finlay, M., Lall, K., Nobles, M., Schilling, R. J., et al. (2019). Differentially expressed genes for atrial fibrillation identified by RNA sequencing from paired human left and right atrial appendages. Physiol. Genomics 51, 323–332. doi: 10.1152/physiolgenomics.00012.2019
Torkamani, A., and Schork, N. J. (2009). Pathway and network analysis with high-density allelic association data. Methods Mol. Biol. 563, 289–301. doi: 10.1007/978-1-60761-175-2_16
Wang, Y., Li, H., Ma, J., Fang, T., Li, X., Liu, J., et al. (2019). Integrated bioinformatics data analysis reveals prognostic significance of SIDT1 in triple-negative breast cancer. Onco Targets Ther. 12, 8401–8410. doi: 10.2147/OTT.S215898
Xu, Y., Ji, K., Wu, M., Hao, B., Yao, K. T., and Xu, Y. (2019). A miRNA-HERC4 pathway promotes breast tumorigenesis by inactivating tumor suppressor LATS1. Protein Cell 10, 595–605. doi: 10.1007/s13238-019-0607-2
Keywords: atrial fibrillation, genome-wide association study, single nucleotide polymorphism, systems biology, transcriptome
Citation: Meng X, Nie Y, Wang K, Fan C, Zhao J and Yuan Y (2021) Identification of Atrial Fibrillation-Associated Genes ERBB2 and MYPN Using Genome-Wide Association and Transcriptome Expression Profile Data on Left–Right Atrial Appendages. Front. Genet. 12:696591. doi: 10.3389/fgene.2021.696591
Received: 17 April 2021; Accepted: 03 June 2021;
Published: 30 June 2021.
Edited by:
Henry H. Q. Heng, Wayne State University School of Medicine, United StatesReviewed by:
Said El Shamieh, Beirut Arab University, LebanonNancy Monroy-Jaramillo, National Institute of Neurology and Neurosurgery, Mexico
Copyright © 2021 Meng, Nie, Wang, Fan, Zhao and Yuan. This is an open-access article distributed under the terms of the Creative Commons Attribution License (CC BY). The use, distribution or reproduction in other forums is permitted, provided the original author(s) and the copyright owner(s) are credited and that the original publication in this journal is cited, in accordance with accepted academic practice. No use, distribution or reproduction is permitted which does not comply with these terms.
*Correspondence: Yiqiang Yuan, eWlxaWFuZzIwMTlAMTI2LmNvbQ==; Juntao Zhao, MzIyNjQ1NEBxcS5jb20=