 Yi Yang
 Kar-Fu Yeung
 Jin Liu
- Centre for Quantitative Medicine, Program in Health Services and Systems Research, Duke-NUS Medical School, Singapore, Singapore
Motivation: Genome-wide association studies (GWAS) have achieved remarkable success in identifying SNP-trait associations in the last decade. However, it is challenging to identify the mechanisms that connect the genetic variants with complex traits as the majority of GWAS associations are in non-coding regions. Methods that integrate genomic and transcriptomic data allow us to investigate how genetic variants may affect a trait through their effect on gene expression. These include CoMM and CoMM-S2, likelihood-ratio-based methods that integrate GWAS and eQTL studies to assess expression-trait association. However, their reliance on individual-level eQTL data render them inapplicable when only summary-level eQTL results, such as those from large-scale eQTL analyses, are available.
Result: We develop an efficient probabilistic model, CoMM-S4, to explore the expression-trait association using summary-level eQTL and GWAS datasets. Compared with CoMM-S2, which uses individual-level eQTL data, CoMM-S4 requires only summary-level eQTL data. To test expression-trait association, an efficient variational Bayesian EM algorithm and a likelihood ratio test were constructed. We applied CoMM-S4 to both simulated and real data. The simulation results demonstrate that CoMM-S4 can perform as well as CoMM-S2 and S-PrediXcan, and analyses using GWAS summary statistics from Biobank Japan and eQTL summary statistics from eQTLGen and GTEx suggest novel susceptibility loci for cardiovascular diseases and osteoporosis.
Availability and implementation: The developed R package is available at https://github.com/gordonliu810822/CoMM.
1 Introduction
Genome-wide association studies (GWAS) have identified a large number of genetic risk variants associated with complex traits, with over 250,000 single nucleotide polymorphism (SNP)-trait associations tagged as significant in the NHGRI-EBI GWAS Catalog (Buniello et al., 2018). However, the specific biological mechanisms through which the identified genetic variants affect these traits have yet to be elucidated. Genetic variants may influence complex traits by altering gene expression and, consequently, protein abundance. These genetic variants may be within the regulatory sequences or secondary motifs of the target gene (cis regulation), or may affect genes at larger genomic distances by modifying upstream regulators which interact with the cis-regulatory sequences (Williams et al., 2007).
Transcriptome-wide association studies (TWAS) aim to provide insights into the specific mechanisms through which variants affect traits. In TWAS, the gene expression of GWAS samples is predicted with the aid of an eQTL dataset; the predicted expression is then analysed for any association with the trait of interest. Unlike approaches that examine gene expression and genetic variants in a pairwise manner, TWAS consider the combinatory effects of all genetic variants within a pre-defined window of the target gene, hence it is especially effective at detecting novel susceptibility loci when multiple variants influence expression. TWAS have proved useful as a stepping stone to generate new insights to a range of complex traits, including schizophrenia (Gusev et al., 2018), glioma (Strunz et al., 2020), prostate cancer (Mancuso et al., 2018), and age-related macular degeneration (Atkins et al., 2019).
Existing TWAS methods can be categorised into two groups, depending on whether they use individual-level or summary-level GWAS data. PrediXcan (Gamazon et al., 2015) and CoMM (Yang et al., 2018) use individual-level GWAS data, while S-PrediXcan (Barbeira et al., 2018) and CoMM-S2 (Yang et al., 2020) use summary-level GWAS data in conjunction with a matching reference panel to estimate linkage disequilibrium. Both CoMM and CoMM-S2 account for the imputation uncertainty in the prediction step and thus are more powerful in identifying expression-trait associations than other methods. However, these methods are limited by the availability of individual-level transcriptome data, and they neglect the ready accessibility of summary-level eQTL datasets. Datasets of eQTL summary statistics are maintained by various consortia including the eQTLGen Consortium (Võsa et al., 2018) and the GTEx Consortium (The GTEx Consortium, 2020). The ability to integrate summary-level eQTL data and summary-level GWAS data would broaden the scope of studies to which TWAS can be applied.
Here we introduce a powerful strategy that integrates eQTL summary statistics (SNP-expression correlation), GWAS summary statistics (SNP-phenotype correlation), and linkage disequilibrium information from reference panels (SNP-SNP correlation) to assess the association between the cis component of expression and trait. We extend CoMM-S2, a likelihood-based method which uses individual-level eQTL data to assess expression-trait association, and propose a probabilistic model, Collaborative Mixed Models using Summary Statistics from eQTL and GWAS (CoMM-S4). Compared with CoMM-S2, a major advantage of CoMM-S4 is its ability to use summary-level eQTL data and integrate them with GWAS summary statistics. In CoMM-S4, a joint likelihood is constructed using summary statistics from GWAS and eQTL studies, as well as SNP correlation information from reference panels representative of the GWAS and eQTL populations. We develop an efficient algorithm based on variational Bayes expectation-maximization and parameter expansion (PX-VBEM). To examine the expression-trait association, a likelihood ratio test is constructed.
The performance of CoMM-S4 is assessed in simulated data, and is also applied to traits from the NFBC1966 cohort (Sabatti et al., 2009) and Biobank Japan (Ishigaki et al., 2020). The TWAS analysis using GWAS summary statistics from NFBC1966 and eQTL summary statistics from eQTLGen suggest novel susceptibility loci for lipid traits, glucose levels, insulin levels and C-reactive protein, when compared against known susceptibility loci in the GWAS Catalog (Buniello et al., 2018). Moreover, the TWAS analysis using GWAS summary statistics from Biobank Japan and eQTL summary statistics from eQTLGen and GTEx reiterate the importance of MHC molecules, interferon-gamma signalling and apoptosis for several autoimmune and infection-related traits (rheumatoid arthritis, Graves’ disease, chronic hepatitis B and chronic hepatitis C), and suggest novel susceptibility loci for cardiovascular traits (congestive heart failure, ischemic stroke, peripheral artery disease) and osteoporosis.
2 Materials and Methods
2.1 Notation
We denote the individual-level eQTL dataset for n1 samples by {Y, W1}, where Y is the gene expression matrix for g genes and W1 is the genotype matrix for m SNP positions. For the j-th gene, let yj denote the gene expression vector, and
We have the summary statistics, in the form of z-scores, from the analysis of genetic variant-gene expression pairs in the eQTL dataset. We also have the summary statistics from single-variate analysis in the GWAS dataset. We denote the eQTL z-scores for the j-th gene by
2.2 Model
The relationship between the j-th gene expression yj and genotype W1j is modelled as
where
where
Let
where
where
and the complete-data likelihood can be written as
where
We are primarily interested in the effect αj of gene expression on trait. Notably, testing the hypothesis of whether αj = 0 is equivalent to testing whether
2.3 Parameter Expansion-Variational Bayes Expectation-Maximization Algorithm
An efficient algorithm is needed to estimate the parameters of the model. Although the EM algorithm is widely used and has a highly stable performance, it requires inverting the matrix
where the
where
We adopt the mean-field form of the variational posterior distribution
to speed up the computational process. The analytical form of the variational posterior distribution is obtained by minimizing the KL divergence, and the derived variational parameters are plugged back into the ELBO. The model parameters are then updated by setting the derivative of the ELBO with respect to the parameters equal to zero. By maximizing the ELBO with respect to the expanded parameter τ, we are able to further increase the ELBO and speed up the convergence process. Since the parameter-expanded model reduces to the original model when τ = 1, the original model can be recovered by incorporating τ into the model parameters, as outlined in the Supplementary Material.
2.4 Likelihood Ratio Test to Evaluate Expression-Trait Association
We perform a likelihood ratio test for expression-trait association:
with the assumption of no horizontal pleiotropy. This is equivalent to testing
since cj ≠ 0. The test statistic for the j-th gene is
where
3 Results
3.1 Simulation Studies
In the simulation studies, we primarily focus on a) comparing the likelihood ratio test statistics from CoMM-S4 and CoMM-S2, b) assessing the type-I error of CoMM-S4 under the null hypothesis (
3.1.1 Simulation Settings
When comparing the test statistic and type-I error of CoMM-S4 with CoMM-S2, the sample sizes of the eQTL and GWAS datasets are n1 = 5, 000 and n2 = 5, 000 respectively. In the power comparison with CoMM-S2 and S-PrediXcan, the sample sizes are n1 = 500 and n2 = 10, 000 respectively. For all simulation scenarios, the sample size of the reference panels for the eQTL and GWAS datasets are n3 = 400 and n4 = 400 respectively.
A multivariate normal distribution with the covariance structure
We generate gene expression values according to yj = W1jγj + e1, where
The corresponding summary statistics were generated by applying a simple linear regression to the individual-level eQTL and GWAS datasets. Further details on the simulation procedure are in the Supplementary Material.
3.1.2 Simulation Results
There is a high concordance between the likelihood ratio test statistics from CoMM-S4 and CoMM-S2, which suggests that eQTL summary statistics can generally provide comparable power as individual-level data. In the scatter plot of CoMM-S4 and CoMM-S2 test statistics, the R2 value is greater than 80% and the simple linear regression slope ranges from 0.88 to 1 (Figure 1 and Supplementay Figures S1–S6). Moreover, the QQ plots indicate that the observed p-values from CoMM-S4 are close to the expected p-values under the null hypothesis of no expression-trait association (Figure 2, Supplementary Figures S7–S9), indicating good type-I error control.
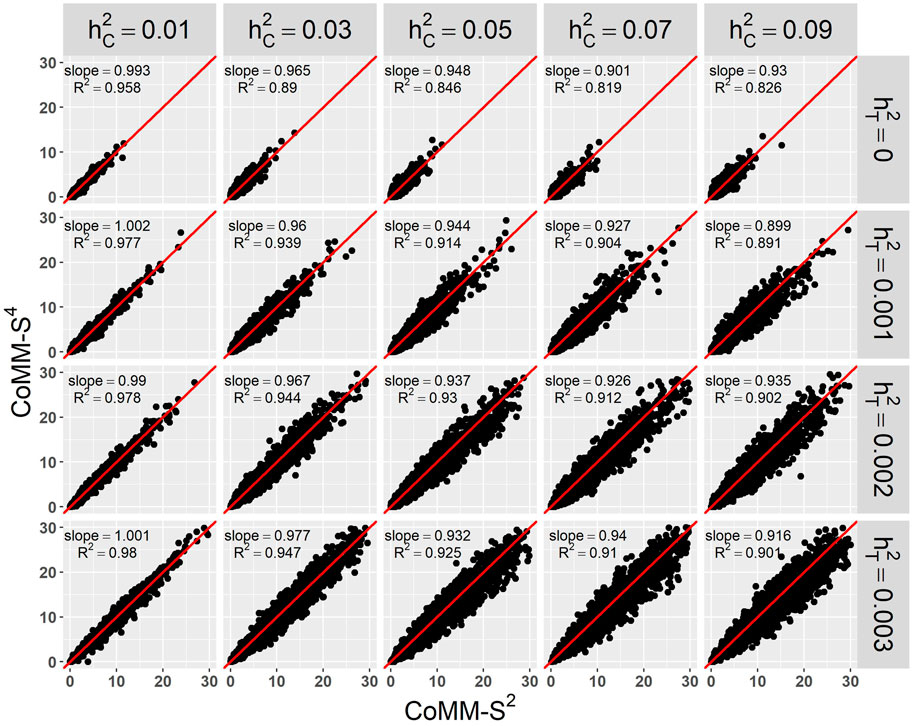
FIGURE 1. The scatter plot of CoMM-S4 vs. CoMM-S2, the model setting is n1 = 5,000, n2 = 5,000, n3 = 400, n4 = 400, mj = 100, ρ = 0.5, π = 0.2, the number of replication is 2,000.
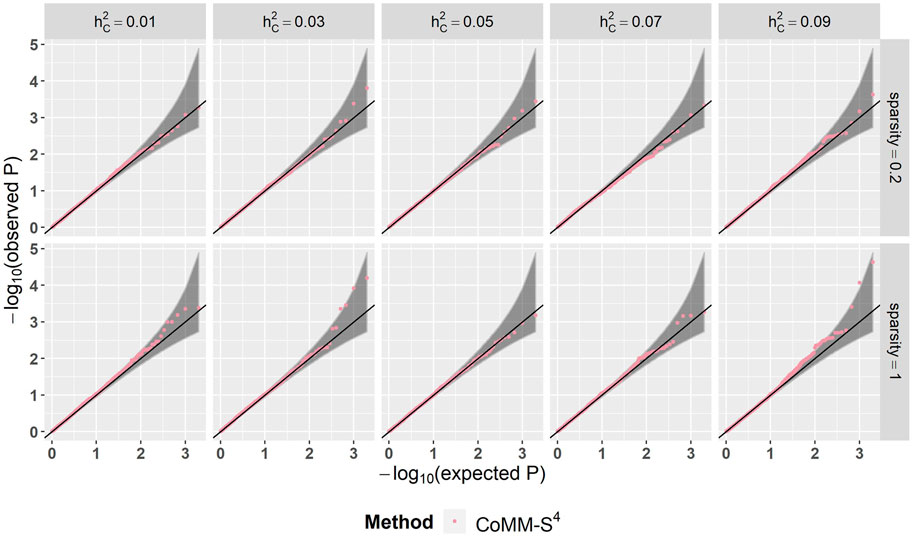
FIGURE 2. The QQ plot of CoMM-S4, the model setting is n1 = 5,000, n2 = 5,000, n3 = 400, n4 = 400, ρ = 0.5, the number of replication is 2,000.
The power of CoMM-S4, CoMM-S2 and S-PrediXcan is also evaluated in the following scenarios: i) the eQTL and GWAS populations have the same LD structure, ii) the eQTL and GWAS populations have different LD structures, and iii) the eQTL and GWAS populations have different LD structures and different gene expression architectures, i.e. the set of cis-SNPs for the two populations only partially overlap (Figure 3, Supplementary Figures S10–S14; simulation details in Supplementary Material).
Across the scenarios considered, the greatest gains in power were observed when the cellular heritability is low (
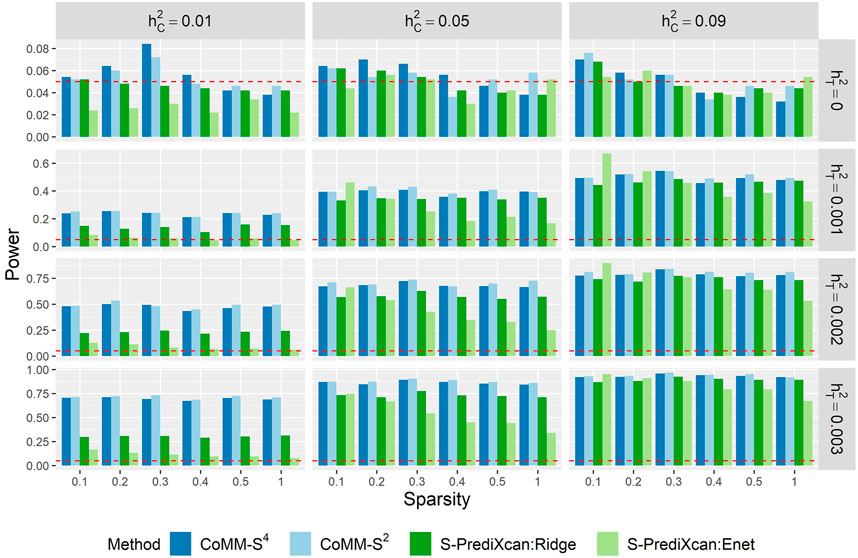
FIGURE 3. The empirical type I error (
When the cellular heritability is large (
3.2 Real Data Analysis
3.2.1 NFBC1966 Cohort
In the real data analysis, we apply CoMM-S4 to the NFBC1966 dataset (Sabatti et al., 2009). The NFBC1966 dataset contains phenotype data for the following ten traits: body mass index (BMI), systolic blood pressure (SysBP), diastolic blood pressure (DiaBP), high-density lipoprotein cholesterol (HDL-C), low-density lipoprotein cholesterol (LDL-C), triglycerides (TG), total cholesterol (TC), insulin levels, glucose levels and C-reactive protein (CRP). The summary statistics were generated by applying simple linear regression to individual-level NFBC1966 using plink (Purcell et al., 2007). Summary statistics of cis-eQTLs from eQTLGen Consortium (Võsa et al., 2018) were used. In addition, linkage disequilibrium for the eQTL and GWAS datasets was estimated using the 1,000 Genomes dataset (The 1000 Genomes Project Consortium, 2015) and 400 NFBC subsamples, respectively.
The genomic inflation factor is between 0.91 and 1.09, and the number of significant genes (p-value < 5 × 10⁻⁶) identified by CoMM-S4 is between 0 and 64 (Table 1). For the trait HDL, CoMM-S4 identified 61 genes, of which 20 are reported to be associated with HDL in NHGRI-EBI GWAS Catalog (Buniello et al., 2018). For the trait LDL, CoMM-S4 detected 64 genes, of which 13 are reported in GWAS Catalog. The corresponding QQ plots for these ten traits are illustrated in Supplementary Figure S15.
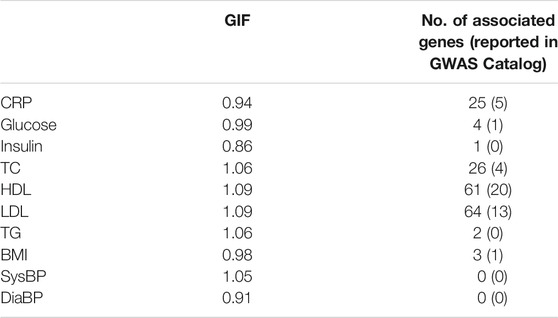
TABLE 1. The genomic inflation factor (GIF) and the number of associated genes (p-value <5 × 10⁻⁶) found by CoMM-S4 for the ten NFBC traits. The number within the parentheses is the number of associated genes reported in the NHGRI-EBI GWAS Catalog (Buniello et al., 2018).
3.2.2 Biobank Japan
We apply CoMM-S4 to GWAS summary statistics from Biobank Japan (BBJ) (Ishigaki et al., 2020). We considered two autoimmune traits (Graves’ disease, rheumatoid arthritis), four cardiovascular traits (cerebral aneurysm, congestive heart failure, ischemic stroke, peripheral artery disease), two infection-related traits (chronic hepatitis B, chronic hepatitis C) and osteoporosis. The TWAS analysis is performed using whole-blood cis-eQTL summary statistics from two studies, eQTLGen (Võsa et al., 2018) and GTEx (v8) (The GTEx Consortium, 2020), to assess the robustness of TWAS results to choice of eQTL dataset. The GTEx and eQTLGen datasets contain association results for 19,599 and 19,176 genes respectively, of which 16,692 genes are in common. Linkage disequilibrium corresponding to the GWAS and eQTL datasets were estimated using Japanese and European samples from the 1,000 Genomes Project (The 1000 Genomes Project Consortium, 2015), respectively. As population differences in eQTL architecture may reduce gene expression imputation accuracy for the GWAS samples, it is preferable for the eQTL and GWAS data to be collected from the same population (Keys et al., 2020). However, the availability of highly-powered eQTL studies may be limited for the population of interest. Moreover, populations that are closely related still provide good power to detect associations between gene expression and trait (Keys et al., 2020), and the relatively high concordance rate (68.8%) of cis-regulation in European and Japanese eQTL studies (Narahara et al., 2014) suggest that European eQTL studies could serve as a reasonable proxy.
TWAS was performed to find genetic loci that may be associated with the traits of interest. For traits where TWAS identified more than 100 statistically significant genes, we further carried out an enrichment analysis based on gene ontology (GO) terms using Enrichr (Chen et al., 2013). The genomic inflation factor is between 1.06 and 1.30 when eQTL summary statistics were obtained from eQTLGen, and between 0.87 and 1.26 when eQTL summary statistics were obtained from GTEx (v8) whole blood (Table 2). The number of identified genes (p-value < 5 × 10⁻⁶) ranged from 2 to 450, and there is a high degree of overlap between the genes identified in the two analyses (Table 2), indicating robustness to eQTL dataset choice. Moreover, around half or more of the genes identified by CoMM-S4 have not been previously reported as significant in the GWAS Catalog or the Biobank GWAS analysis (Table 2).
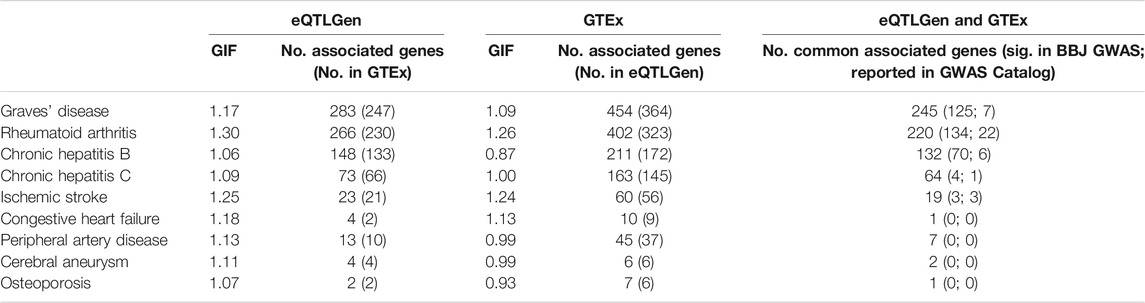
TABLE 2. The genomic inflation factor and number of associated genes (p-value <5 × 10⁻⁶) for 9 traits in the Biobank Japan dataset. Two eQTL datasets were used: eQTLGen and GTEx. In parentheses are the number of associated genes that are also present in the other eQTL dataset’s gene set. The last column shows the number of associated genes that are common to both the eQTLGen and GTEx analyses; in parentheses are the number of associated genes that are statistically significant in the GWAS analysis (p-value <5 × 10⁻⁸), and the number of associated genes reported in the GWAS Catalog.
The TWAS results recapitulate known or proposed biological mechanisms that give rise to the studied traits. GWAS and animal model studies have implicated MHC molecules, interferon-gamma signalling and apoptosis in the development of Graves’ disease (Morshed and Davies, 2015; Okada et al., 2015; Smith and Hegedüs, 2016), rheumatoid arthritis (Castañeda-Delgado et al., 2017; Okada et al., 2019), and chronic hepatitis B infection (Ebert et al., 2015; Zhu et al., 2016). Pathway enrichment analyses recapitulate these findings. For Graves’ disease, 143 of the 245 associated genes (TWAS p-value < 5 × 10⁻⁸) are involved in GO biological processes, and the 23 significantly enriched processes (FDR <0.05, Supplementary Table S3) include interferon-gamma-mediated signaling pathway (p = 6.86 × 10⁻¹⁰), as well as antigen processing and presentation of peptide antigen via MHC class I (p = 3.14 × 10⁻⁸) and via MHC class II (p = 2.76 × 10⁻⁶). For rheumatoid arthritis, 137 of the 220 associated genes are involved in GO biological processes, and the 25 significantly enriched processes (Supplementary Table S4) include interferon-gamma-mediated signaling pathway (p = 1.20 × 10⁻¹¹), and antigen processing and presentation of exogenous peptide antigen via MHC class II (p = 4.21 × 10⁻¹¹). For chronic hepatitis B, 91 of the 132 associated genes are involved in GO biological processes, and the 32 significantly enriched processes (Supplementary Table S5) include antigen processing and presentation of exogenous peptide antigen via MHC class II (p = 2.28 × 10⁻⁷) and positive regulation of apoptotic cell clearance (p = 9.21 × 10⁻⁶).
Moreover, CoMM-S4 is able to identify novel susceptibility loci by aggregating the contributions of SNPs with smaller effect sizes. A comparison of the GWAS results with CoMM-S4 results based on the highly-powered eQTLGen study shows that the TWAS signal is larger than the GWAS signal at chr17q12 for congestive heart failure (CHF), chr17p13.1 for peripheral artery disease (PAD), chr17q21.31 for ischemic stroke, and chr6q22.33 for osteoporosis (Supplementary Figures S17–S25). Plausible mechanisms can be identified for genes at these loci, which may serve as a stepping stone for further investigation. For CHF, the second largest signal at chr17q12 corresponds to FBXL20 (p = 1.33 × 10⁻⁵), which negatively regulates autophagy (Mathiassen and Cecconi, 2017). Reduced autophagy contributes to accelerated cardiac ageing and heart failure (Nishida et al., 2009; Abdellatif et al., 2018; Dong et al., 2019), and may serve as a link between FBXL20 and CHF. For PAD, the second largest signal at chr17p13.1 corresponds to GABARAP (p = 8.63 × 10⁻⁸), which is involved in autophagy initiation and autophagosome-lysosome fusion (Schaaf et al., 2016). Impaired autophagy aggravates atherosclerosis (De Meyer et al., 2015), and may serve as a link between GABARAP and PAD.
For ischemic stroke, the TWAS signal is larger than the GWAS signal at chr17q21.31. The top association corresponds to HEXIM1 (p = 1.07 × 10⁻⁶), which modulates hypoxia-inducible factor-1 alpha and vascular endothelial growth factor (Ogba et al., 2010; Ketchart et al., 2013), angiogenic factors which may influence stroke risk by mediating neovascularization in atherosclerotic lesions, potentially precipitating thrombi that obstruct blood flow to the brain (Bentzon et al., 2014; Chistiakov et al., 2015; Camaré et al., 2017). For osteoporosis, the TWAS signal is larger than the GWAS signal at chr6q22.33. The top association corresponds to RNF146 (p = 1.05 × 10⁻⁸), which was shown to promote osteoblast development while antagonizing osteoclast differentiation in mice (Matsumoto et al., 2017). Notably, none of the genes described above are reported as significant in the GWAS Catalog or the Biobank Japan GWAS analysis, thus highlighting the potential utility of applying CoMM-S4 to identify relevant genes.
On the other hand, the TWAS results are limited by the data availability in the eQTL dataset. Although the TWAS results recapitulate most GWAS results, the Manhattan plots also show some GWAS signals without corresponding TWAS signals (Supplementary Figures S17–S25), in part due to the relative sparsity of genes in the eQTL dataset. A further limitation is that TWAS provide information about association, rather than causality. In the present analysis, TMEM184C and PRMT10 showed significant association with cerebral aneurysm. However, a previous report has indicated that these are not the causal genes. Instead, the likely causal gene is EDNRA, which is in the same locus as TMEM184C and PRMT10 and regulates response to hemodynamic stress (Low et al., 2012). As EDNRA is not present in any of the eQTL datasets, it could not be evaluated in this analysis.
In addition, we compare the CoMM-S4 results with S-PrediXcan (elastic net) results for the 9 Biobank Japan traits. For S-PrediXcan, gene expression prediction weights for GTEx (v8) whole blood were obtained from the elastic net model in PredictDB (http://predictdb.org/), and the covariance matrix used to calculate the test statistics is based on Japanese samples from the 1,000 Genomes Project. To allow for fair comparison, we consider only genes that are common to both the CoMM-S4 and S-PrediXcan analyses. Compared with S-PrediXcan (elastic net), CoMM-S4 identifies a similar number of statistically significant genes for 5 Biobank Japan traits (cerebral aneurysm, congestive heart failure, ischemic stroke, peripheral artery disease, and osteoporosis), and more statistically significant genes for 4 Biobank Japan traits (Graves’ disease, rheumatoid arthritis, chronic hepatitis C, and chronic hepatitis B) (Supplementary Table S2). The tail behaviour in the QQ plots indicate that the p-values tend to be smaller for statistically significant genes (Supplementary Figure S16). The higher number of identified genes in the Biobank Japan traits is consistent with the higher power demonstrated in simulations.
4 Discussion
In this article, we have developed a collaborative mixed model using both summary statistics from eQTL and GWAS to examine the expression-trait associations in transcriptome-wide association studies. We compared the performance between CoMM-S4 and CoMM-S2, and simulation results demonstrate that CoMM-S4 performs as well as CoMM-S2 even though the former uses only summary-level data. Moreover, our analysis of the NFBC1966 cohort has suggested novel susceptibility loci for glucose levels, insulin levels, C-reactive protein, BMI and lipid traits. Our analysis of Biobank Japan traits has similarly suggested novel susceptibility loci for congestive heart failure, ischemic stroke, peripheral artery disease and osteoporosis, and has also recapitulated known and putative mechanisms for Graves’ disease, rheumatoid arthritis, chronic hepatitis B and chronic hepatitis C.
CoMM-S4 has several advantages over CoMM-S2 and S-PrediXcan. Compared to stage-wise methods like S-PrediXcan, CoMM-S4 accounts for imputation uncertainty, which makes it statistically more powerful in identifying expression-trait associations. Moreover, CoMM-S4 requires only summary-level data (z-scores) from eQTL studies, instead of individual-level data. This allows us to make use of eQTL large-scale studies and meta-analyses where individual-level data may be unavailable.
On the other hand, likelihood-ratio tests are less computationally efficient than score-based tests; the relationship between these tests in the context of individual-level data (CoMM and SKAT, respectively) are discussed in detail in (Yang et al., 2018). To reduce the computational time of CoMM-S4, we have estimated the parameters using variational inference and parameter expansion. Finally, CoMM-S4, like S-PrediXcan, is not able to distinguish between causal relationship and horizontal pleiotropy. In practice, we can first perform a TWAS to identify regions that show association with the trait of interest, and then apply Mendelian randomization analysis to draw causal conclusions.
Data Availability Statement
Publicly available datasets were analyzed in this study. Biobank Japan GWAS summary statistics were obtained from http://jenger.riken.jp/en/result; eQTLGen summary statistics were obtained from https://www.eqtlgen.org/; GTEx eQTL summary statistics were obtained from https://www.ebi.ac.uk/eqtl/Studies/.
Author Contributions
JL conceived and supervised the study. YY developed the algorithm. KY and YY performed the data analyses and wrote the manuscript with input from JL. All authors have reviewed and approved the final manuscript.
Funding
This work was supported by grant R-913-200-098-263 from the Duke-NUS Graduate Medical School, and AcRF Tier 2 (MOE2018-T2-1-046 and MOE2018-T2-2-006) from the Ministry of Education, Singapore. The computational work for this article was partially performed on resources of the National Supercomputing Centre, Singapore (https://www.nscc.sg).
Conflict of Interest
The authors declare that the research was conducted in the absence of any commercial or financial relationships that could be construed as a potential conflict of interest.
Publisher’s Note
All claims expressed in this article are solely those of the authors and do not necessarily represent those of their affiliated organizations, or those of the publisher, the editors and the reviewers. Any product that may be evaluated in this article, or claim that may be made by its manufacturer, is not guaranteed or endorsed by the publisher.
Supplementary Material
The Supplementary Material for this article can be found online at: https://www.frontiersin.org/articles/10.3389/fgene.2021.704538/full#supplementary-material
References
Abdellatif, M., Sedej, S., Carmona-Gutierrez, D., Madeo, F., and Kroemer, G. (2018). Autophagy in Cardiovascular Aging. Circ. Res. 123, 803–824. doi:10.1161/circresaha.118.312208
Atkins, I., Kinnersley, B., Ostrom, Q. T., Labreche, K., Il’yasova, D., Armstrong, G. N., et al. (2019). Transcriptome-Wide Association Study Identifies New Candidate Susceptibility Genes for Glioma. Cancer Res. 79, 2065–2071. doi:10.1158/0008-5472.can-18-2888
Barbeira, A. N., Dickinson, S. P., Bonazzola, R., Zheng, J., Wheeler, H. E., Torres, J. M., et al. (2018). Exploring the Phenotypic Consequences of Tissue Specific Gene Expression Variation Inferred From Gwas Summary Statistics. Nat. Commun. 9, 1825. doi:10.1038/s41467-018-03621-1
Bentzon, J. F., Otsuka, F., Virmani, R., and Falk, E. (2014). Mechanisms of Plaque Formation and Rupture. Circ. Res. 114, 1852–1866. doi:10.1161/circresaha.114.302721
Buniello, A., MacArthur, J. A. L., Cerezo, M., Harris, L. W., Hayhurst, J., Malangone, C., et al. (2018). The Nhgri-Ebi Gwas Catalog of Published Genome-Wide Association Studies, Targeted Arrays and Summary Statistics 2019. Nucleic Acids Res. 47, D1005–D1012. doi:10.1093/nar/gky1120
Camaré, C., Pucelle, M., Nègre-Salvayre, A., and Salvayre, R. (2017). Angiogenesis in the Atherosclerotic Plaque. Redox Biol. 12, 18–34. doi:10.1016/j.redox.2017.01.007
Castañeda-Delgado, J. E., Bastián-Hernandez, Y., Macias-Segura, N., Santiago-Algarra, D., Castillo-Ortiz, J. D., Alemán-Navarro, A. L., et al. (2017). Type I Interferon Gene Response Is Increased in Early and Established Rheumatoid Arthritis and Correlates With Autoantibody Production. Front. Immunol. 8, 285. doi:10.3389/fimmu.2017.00285
Chen, E. Y., Tan, C. M., Kou, Y., Duan, Q., Wang, Z., Meirelles, G. V., et al. (2013). Enrichr: Interactive and Collaborative Html5 Gene List Enrichment Analysis Tool. BMC bioinformatics. 14, 1–14. doi:10.1186/1471-2105-14-128
Chistiakov, D. A., Orekhov, A. N., and Bobryshev, Y. V. (2015). Contribution of Neovascularization and Intraplaque Haemorrhage to Atherosclerotic Plaque Progression and Instability. Acta Physiol. 213, 539–553. doi:10.1111/apha.12438
De Meyer, G. R., Grootaert, M. O., Michiels, C. F., Kurdi, A., Schrijvers, D. M., and Martinet, W. (2015). Autophagy in Vascular Disease. Circ. Res. 116, 468–479. doi:10.1161/circresaha.116.303804
Dong, Y., Chen, H., Gao, J., Liu, Y., Li, J., and Wang, J. (2019). Molecular Machinery and Interplay of Apoptosis and Autophagy in Coronary Heart Disease. J. Mol. Cell. Cardiol. 136, 27–41. doi:10.1016/j.yjmcc.2019.09.001
Ebert, G., Preston, S., Allison, C., Cooney, J., Toe, J. G., Stutz, M. D., et al. (2015). Cellular Inhibitor of Apoptosis Proteins Prevent Clearance of Hepatitis B Virus. Proc. Natl. Acad. Sci. 112, 5797–5802. doi:10.1073/pnas.1502390112
Gamazon, E. R., Wheeler, H. E., Shah, K. P., Mozaffari, S. V., Aquino-Michaels, K., Carroll, R. J., et al. (2015). A Gene-Based Association Method for Mapping Traits Using Reference Transcriptome Data. Nat. Genet. 47, 1091. doi:10.1038/ng.3367
Gusev, A., Ko, A., Shi, H., Bhatia, G., Chung, W., Penninx, B. W., et al. (2016). Integrative Approaches for Large-Scale Transcriptome-Wide Association Studies. Nat. Genet. 48, 245. doi:10.1038/ng.3506
Gusev, A., Mancuso, N., Won, H., Kousi, M., Finucane, H. K., Reshef, Y., et al. (2018). Transcriptome-Wide Association Study of Schizophrenia and Chromatin Activity Yields Mechanistic Disease Insights. Nat. Genet. 50, 538–548. doi:10.1038/s41588-018-0092-1
Hormozdiari, F., Kostem, E., Kang, E. Y., Pasaniuc, B., and Eskin, E. (2014). Identifying Causal Variants at Loci With Multiple Signals of Association. Genetics. 198, 497–508. doi:10.1534/genetics.114.167908
Huang, J., Jiao, Y., Liu, J., and Yang, C. (2021). Remi: Regression With Marginal Information and its Application in Genome-Wide Association Studies. Stat. Sin. 31, 1–20. doi:10.5705/ss.202019.018
Ishigaki, K., Akiyama, M., Kanai, M., Takahashi, A., Kawakami, E., Sugishita, H., et al. (2020). Large-Scale Genome-Wide Association Study in a Japanese Population Identifies Novel Susceptibility Loci across Different Diseases. Nat. Genet. 52, 669–679. doi:10.1038/s41588-020-0640-3
Ketchart, W., Smith, K. M., Krupka, T., Wittmann, B. M., Hu, Y., Rayman, P. A., et al. (2013). Inhibition of Metastasis by Hexim1 Through Effects on Cell Invasion and Angiogenesis. Oncogene. 32, 3829–3839. doi:10.1038/onc.2012.405
Keys, K. L., Mak, A. C., White, M. J., Eckalbar, W. L., Dahl, A. W., Mefford, J., et al. (2020). On the Cross-Population Generalizability of Gene Expression Prediction Models. PLoS Genet. 16, e1008927. doi:10.1371/journal.pgen.1008927
Liu, C., Rubin, D. B., and Wu, Y. N. (1998). Parameter Expansion to Accelerate Em: the Px-Em Algorithm. Biometrika. 85, 755–770. doi:10.1093/biomet/85.4.755
Low, S.-K., Takahashi, A., Cha, P.-C., Zembutsu, H., Kamatani, N., Kubo, M., et al. (2012). Genome-Wide Association Study for Intracranial Aneurysm in the Japanese Population Identifies Three Candidate Susceptible Loci and a Functional Genetic Variant at Ednra. Hum. Mol. Genet. 21, 2102–2110. doi:10.1093/hmg/dds020
Mancuso, N., Gayther, S., Gusev, A., Zheng, W., Penney, K. L., Kote-Jarai, Z., et al. (2018). Large-Scale Transcriptome-Wide Association Study Identifies New Prostate Cancer Risk Regions. Nat. Commun. 9, 1–11. doi:10.1038/s41467-018-06302-1
Mathiassen, D., and Cecconi, F. (2017). Autophagy and the Cell Cycle: a Complex Landscape. Front. Oncol. 7, 51. doi:10.3389/fonc.2017.00051
Matsumoto, Y., La Rose, J., Lim, M., Adissu, H. A., Law, N., Mao, X., et al. (2017). Ubiquitin Ligase Rnf146 Coordinates Bone Dynamics and Energy Metabolism. J. Clin. Invest. 127, 2612–2625. doi:10.1172/jci92233
Morshed, S. A., and Davies, T. F. (2015). Graves’ Disease Mechanisms: The Role of Stimulating, Blocking, and Cleavage Region Tsh Receptor Antibodies. Horm. Metab. Res. 47, 727–734. doi:10.1055/s-0035-1559633
Narahara, M., Higasa, K., Nakamura, S., Tabara, Y., Kawaguchi, T., Ishii, M., et al. (2014). Large-Scale East-Asian Eqtl Mapping Reveals Novel Candidate Genes for Ld Mapping and the Genomic Landscape of Transcriptional Effects of Sequence Variants. PloS one. 9, e100924. doi:10.1371/journal.pone.0100924
Nishida, K., Kyoi, S., Yamaguchi, O., Sadoshima, J., and Otsu, K. (2009). The Role of Autophagy in the Heart. Cel Death Differ. 16, 31–37. doi:10.1038/cdd.2008.163
Ogba, N., Doughman, Y. Q., Chaplin, L. J., Hu, Y., Gargesha, M., Watanabe, M., et al. (2010). Hexim1 Modulates Vascular Endothelial Growth Factor Expression and Function in Breast Epithelial Cells and Mammary Gland. Oncogene. 29, 3639–3649. doi:10.1038/onc.2010.110
Okada, Y., Eyre, S., Suzuki, A., Kochi, Y., and Yamamoto, K. (2019). Genetics of Rheumatoid Arthritis: 2018 Status. Ann. Rheum. Dis. 78, 446–453. doi:10.1136/annrheumdis-2018-213678
Okada, Y., Momozawa, Y., Ashikawa, K., Kanai, M., Matsuda, K., Kamatani, Y., et al. (2015). Construction of a Population-Specific Hla Imputation Reference Panel and its Application to Graves’ Disease Risk in Japanese. Nat. Genet. 47, 798–802. doi:10.1038/ng.3310
Purcell, S., Neale, B., Todd-Brown, K., Thomas, L., Ferreira, M. A., Bender, D., et al. (2007). Plink: a Tool Set for Whole-Genome Association and Population-Based Linkage Analyses. Am. J. Hum. Genet. 81, 559–575. doi:10.1086/519795
Sabatti, C., Service, S. K., Hartikainen, A.-L., Pouta, A., Ripatti, S., Brodsky, J., et al. (2009). Genome-Wide Association Analysis of Metabolic Traits in a Birth Cohort From a Founder Population. Nat. Genet. 41, 35. doi:10.1038/ng.271
Schaaf, M. B., Keulers, T. G., Vooijs, M. A., and Rouschop, K. M. (2016). Lc3/Gabarap Family Proteins: Autophagy-(un)Related Functions. FASEB J. 30, 3961–3978. doi:10.1096/fj.201600698r
Smith, T. J., and Hegedüs, L. (2016). Graves’ Disease. New Engl. J. Med. 375, 1552–1565. doi:10.1056/nejmra1510030
Strunz, T., Lauwen, S., Kiel, C., den Hollander, A., and Weber, B. H. (2020). A Transcriptome-Wide Association Study Based on 27 Tissues Identifies 106 Genes Potentially Relevant for Disease Pathology in Age-Related Macular Degeneration. Scientific Rep. 10, 1–16. doi:10.1038/s41598-020-58510-9
The 1000 Genomes Project Consortium (2015). A Global Reference for Human Genetic Variation. Nature. 526, 68–74. doi:10.1038/nature15393
The GTEx Consortium (2020). The Gtex Consortium Atlas of Genetic Regulatory Effects across Human Tissues. Science. 369, 1318–1330. doi:10.1126/science.aaz1776
Võsa, U., Claringbould, A., Westra, H.-J., Bonder, M. J., Deelen, P., Zeng, B., et al. (2018). Unraveling the Polygenic Architecture of Complex Traits Using Blood Eqtl Meta-Analysis. bioRxiv., 447367.
Williams, R. B., Chan, E. K., Cowley, M. J., and Little, P. F. (2007). The Influence of Genetic Variation on Gene Expression. Genome Res. 17, 1707–1716. doi:10.1101/gr.6981507
Yang, C., Wan, X., Lin, X., Chen, M., Zhou, X., and Liu, J. (2018). CoMM: a Collaborative Mixed Model to Dissecting Genetic Contributions to Complex Traits by Leveraging Regulatory Information. Bioinformatics. 35, 1644. doi:10.1093/bioinformatics/bty865
Yang, Y., Shi, X., Jiao, Y., Huang, J., Chen, M., Zhou, X., et al. (2020). CoMM-S2: a Collaborative Mixed Model Using Summary Statistics in Transcriptome-Wide Association Studies. Bioinformatics. 36, 2009–2016. doi:10.1093/bioinformatics/btz880
Zhu, M., Dai, J., Wang, C., Wang, Y., Qin, N., Ma, H., et al. (2016). Fine Mapping the Mhc Region Identified Four Independent Variants Modifying Susceptibility to Chronic Hepatitis B in Han Chinese. Hum. Mol. Genet. 25, 1225–1232. doi:10.1093/hmg/ddw003
Keywords: summary statistics, genome-wide association studies, variational bayesian, parameter expanded expectation-maximization (PX-EM) algorithm, transcriptome-wide association studies
Citation: Yang Y, Yeung K-F and Liu J (2021) CoMM-S4: A Collaborative Mixed Model Using Summary-Level eQTL and GWAS Datasets in Transcriptome-Wide Association Studies. Front. Genet. 12:704538. doi: 10.3389/fgene.2021.704538
Received: 03 May 2021; Accepted: 03 September 2021;
Published: 20 September 2021.
Edited by:
Jiebiao Wang, University of Pittsburgh, United StatesReviewed by:
Xiangyu Luo, Renmin University of China, ChinaHuwenbo Shi, Harvard University, United States
Copyright © 2021 Yang, Yeung and Liu. This is an open-access article distributed under the terms of the Creative Commons Attribution License (CC BY). The use, distribution or reproduction in other forums is permitted, provided the original author(s) and the copyright owner(s) are credited and that the original publication in this journal is cited, in accordance with accepted academic practice. No use, distribution or reproduction is permitted which does not comply with these terms.
*Correspondence: Jin Liu, amluLmxpdUBkdWtlLW51cy5lZHUuc2c=
†These authors have contributed equally to this work and share first authorship