 Beatrice E. Gee1,2,3
 Andrea Pearson4Iris Buchanan-Perry1,3
 Roger P. Simon4,5,6
 David R. Archer7
 Robert Meller4*
- 1Department of Pediatrics, Morehouse School of Medicine, Atlanta, GA, United States
- 2Morehouse School of Medicine, Cardiovascular Research Institute, Atlanta, GA, United States
- 3Children’s Healthcare of Atlanta, Atlanta, GA, United States
- 4Translational Stroke Program, Neuroscience Institute, Morehouse School of Medicine, Atlanta, GA, United States
- 5Grady Memorial Hospital, Atlanta, GA, United States
- 6Department of Neurology, Morehouse School of Medicine, Atlanta, GA, United States
- 7Aflac Cancer and Blood Disorders Center of Emory University and Children’s Healthcare of Atlanta, Atlanta, GA, United States
Whole transcriptome RNA-sequencing was performed to quantify RNA expression changes in whole blood samples collected from steady state sickle cell anemia (SCA) and control subjects. Pediatric SCA and control subjects were recruited from Atlanta (GA)—based hospital(s) systems and consented for RNA sequencing. RNA sequencing was performed on an Ion Torrent S5 sequencer, using the Ion Total RNA-seq v2 protocol. Data were aligned to the hg19 reference genome and analyzed in the Partek Genomics studio package (v7.0). 223 genes were differentially expressed between SCA and controls (± 1.5 fold change FDR p < 0.001) and 441 genes show differential transcript expression (± 1.5 fold FDR p < 0.001). Differentially expressed RNA are enriched for hemoglobin associated genes and ubiquitin-proteasome pathway genes. Further analysis shows higher gamma globin gene expression in SCA (33-fold HBG1 and 49-fold HBG2, both FDR p < 0.05), which did not correlate with hemoglobin F protein levels. eQTL analysis identified SNPs in novel non-coding RNA RYR2 gene as having a potential regulatory role in HBG1 and HBG2 expression levels. Gene expression correlation identified JHDM1D-AS1(KDM7A-DT), a non-coding RNA associated with angiogenesis, enhanced GATA1 and decreased JAK-STAT signaling to correlate with HBG1 and HBG2 mRNA levels. These data suggest novel regulatory mechanisms for fetal hemoglobin regulation, which may offer innovative therapeutic approaches for SCA.
Introduction
Sickle cell anemia (SCA) is a genetically inherited blood disorder. Homozygous hemoglobin SS is characterized by a single point mutation (T to A) of the beta hemoglobin gene (Hbb), resulting in a non-conservative protein mutation at the sixth codon (Glu to Val) (Pauling et al., 1949; Ingram, 1958). This mutation results in polymerization of the hemoglobin molecules under low oxygen conditions, and the classic sickling morphology of red blood cells (Scriver and Waugh, 1930). Despite a single genetic mutation being the root cause, there is considerable heterogeneity between each individual’s disease severity, and predicting who is at heightened risk of vascular complications is challenging. Circulating immune cells are in contact with the vasculature and are involved in cardiovascular diseases. Using these circulating cells as sentinels, one can diagnose various brain insults using RNA expression patterns in peripheral blood, including stroke (Sharp et al., 2007; Sharp et al., 2011; Meller et al., 2016), with high accuracy and the sensitivity to different causes of stroke (Jickling et al., 2011; Jickling et al., 2012; Jickling et al., 2013). A recent study described a link between such peripheral blood transcriptome profiles with patient mortality in sickle disease (Desai et al., 2017). To date, published studies have used microarray technology to assess known gene expression profiles in sickle cell disease (Jison et al., 2004; Raghavachari et al., 2007; Raghavachari et al., 2009; Raghavachari et al., 2012; Desai et al., 2017). Based on the number of inflammatory derangements described in sickle cell disease [for a review see (Balandya et al., 2016)], we expect that, in comparison to people without SCA, circulating immune cells from SCA subjects will express distinctly different genes that mediate the disease phenotype. In order to further study the pathologic mechanisms of SCA, and identify potential therapeutic targets, we investigated peripheral blood whole transcriptome profiling in pediatric patients with SCA.
Methods
Study Approval
All procedures were reviewed and approved by Institutional Review Boards at Children’s Healthcare of Atlanta and Morehouse School of Medicine (14-125 CHOA). All participants or guardians gave written informed consent prior to their enrollment in the study. Samples were de-identified prior to analysis.
Participant Recruitment
African American children and young adults (3–21 years old) were recruited from Children’s Healthcare of Atlanta Aflac Sickle Cell Clinics and Morehouse Healthcare Pediatrics Clinic, Atlanta, GA. Subjects with SCA had Hemoglobin SS or S-β0-thalassemia, without transfusions in the past 3 months or hydroxyurea therapy in the past 6 months. Healthy controls were self-identified African American children or young adults (3–21 years old), with hemoglobin genotypes AA, AS, AC, or β-thalassemia trait confirmed by electrophoresis (Quest Diagnostics). Exclusions included acute illness, chronic diseases other than SCA, pregnancy, and history of cardiovascular risk factors (BMI >95th %ile for age, high cholesterol or other hyperlipidemia, diabetes, cigarette smoking more than five per day, or hypertension treated with medications). Whole blood (3 ml) was collected in PAXgene RNA tubes. Clinical data were extracted from the medical record included anthropometrics, complete blood count, and medical history.
RNA-Seq Library Assembly
RNA was extracted from 3 ml samples of blood (stored in Paxgene tubes at −20°C) using the Pre-Analytix RNA extraction kit (Qiagen). RNA-seq libraries were constructed using the Ion Total RNA-Seq Kit v2 (ThermoFisher Scientific) with 500 ng total RNA as starting material (not globin depleted). RNA was sheared using RNaseIII, ligated to adapters, and reverse transcribed with Super ScriptTMIII. cDNA was size selected using Ampure XL beads (Beckman Coulter) and amplified using Platinum™ DNA polymerase (15 cycles) with IonXpress barcode primers (1–16). Libraries were quantified using High Sensitivity DNA Bioanalyzer chips, pooled, and cloned onto sequencing spheres using an Ion OneTouch2. Templated spheres were loaded on Ion 540 chips and sequenced on an Ion Torrent S5 DNA sequencer, using the RNA-Seq analysis plugin. Data were aligned to the hg19 reference genome using STAR and Bowtie2. Resultant Bam data files were uploaded to Partek Genomics Studio software (v 7.0). Gene and transcript expression values were determined using the Ensemble v87 annotation guide for Hg19 (downloaded 01/2018). (Original data has been submitted to dbGAP. For other data request please contact cm1lbGxlckBNU00uZWR1).
Differential Expression Analysis
Gene and transcript expression was calculated as reads per kilobase of transcript per million mapped reads (RPKM) using Partek Genomic Suite (V 7.0). Genes with a fewer than 10 aligned reads in 25% of samples were filtered out. The data were normalized using trimmed mean method. Data were subjected to one-way analysis of variance (2-way ANCOVA) using clinical SCA status as the factor, corrected for age, and sex in the linear model. We did not correct for weight, because one control had that data missing. Data with a 1.5-fold difference in expression levels and passing a false discovery rate (FDR) of 0.001 were considered significantly expressed and considered for further analysis. PCA and hierarchical clustering was performed in Partek genomics suite using gene expression values of significantly regulated genes and transcripts. Volcano plot was generated using enhancedVolcano, by importing the ANOVA output data sheet and selecting the contrast specific p value and the fold change. Gene Set Ontology Analysis was performed using Partek Genomics suite (v7.0) and ClueGo App for Cytoscape (Bindea et al., 2009). Partek Genomics Suite’s linear support vector machine (SVM) classifiers with shrinking centroids was used to train models for predicting CA diagnosis. Models with a normalized correct rate greater than 85% were then tested using two level cross-validation (full leave one out and groups of 10) to determine accuracy, sensitivity, and specificity.
Correlation Analysis
Correlation analysis was performed on the normalized rpkm values of HGB1 and HGB2 vs the rest of the transcriptome using Spearman correlation in Partek Gene studio (v 7.0) correlation images were prepared in R using the Hmisc package. Data were initially correlated together, and then for SCA and Control groups separately. Significance was corrected for repeated measures using the Benjamini-Hochberg/Bonferroni correction. An adjusted p value of 0.05 was accepted as significant. Data for individual gene pairs were plotted in Graphpad.
eQTL Analysis
Data were analyzed using MATRIXeQTL in R (Shabalin, 2012). SNP calls were generated and processed in Partek, using the detect nucleotide variation workflow. Data were called if LOR greater or equal to 50, and then filtered for a mean number of reads of 20. Data were annotated with known SNP (dbSNP151) identifiers in Partek. The resultant base call matrix was saved as a text file (available on request from R.Meller) and transferred into R for processing as a numerical matrix using the SNPready package. Gene expression data and co-variates data were also prepared as numeric databases (see attached script). Data were analyzed for SNPS affecting HBG1 and HBG2 expression, using a linear model, correcting for age, sex, and SCA status. Data were plotted using CMplot (Yin et al., 2021). Significant genes were plotted against base calls using Graphpad Prism v6. A script of R based procedures is included in the Supplementary Material.
Statistics
The target number of subjects enrolled was based on power analysis of previous data (Meller et al., 2016). Thirty subjects in SCA and Control groups would enable detection of over 75% of 1.2-fold differences in gene expression, if the between group differences were comparable to African American adults with or without stroke. Normality, t-test, chi square, Mann Whitney U, Wilcoxon signed rank, and Fisher’s exact tests were performed with GraphPad Prism (v6.0). A p-value <0.05 was considered significant. Analysis of variance (ANOVA) was performed on TMM normalized RPKM values to determine differential expression using Partek Genomics Suite at a significance cutoff of ± 1.5 fold change and a post-hoc False Discovery Rate (FDR) correction (p < 0.001). Principal component analysis and hierarchical clustering were used to assess clustering of the data (gene or transcript expression values). Accuracy, sensitivity, specificity, and area under the curve (AUC) for the prediction models were also determined using Partek Genomics Suite (v 7).
Results
Participant Enrollment
We recruited 48 subjects for this study, 31 with SCA and 18 controls. One participant was withdrawn from the study because on subsequent chart review it was determined they were being medicated with hydroxyurea (HU) therapy at the time of blood sample collection (above exclusion criteria). All HU-free SCA subjects were homozygous for the HbSS genotype, based on medical history and confirmed by SNP analysis of the sixth codon of the HBB gene. Patients heterozygous for the sickle cell causing Hbb gene mutation (HbAS) were grouped with the control samples (HbAA). All analysis was performed on mixed sex samples corrected for age and sex (see Table 1). The age of SCA patients was lower than controls, (8 vs. 12 years, p = 0.0054 Mann Whitney U test: Table 1). Control subjects had a higher average BMI than SCA (20.27 ± 3.6 vs. 16.67 ± 2.7, p < 0.001 Student’s t test; Table 1). Average hemoglobin concentration for controls was 13.09 g/dl, compared to 8.8 in SCA (Table 1), and 8.2 in SCA with cerebral arteriopathy (not shown). Average fetal hemoglobin was significantly higher for SCA subjects compared to controls (14.9 ± 7.6% vs. < 1%, p < 0.0001, Wilcoxon Signed Rank test; g/dl shown in Table 1). There was no difference in the mean corpuscular volume between controls and SCA (Table 1).
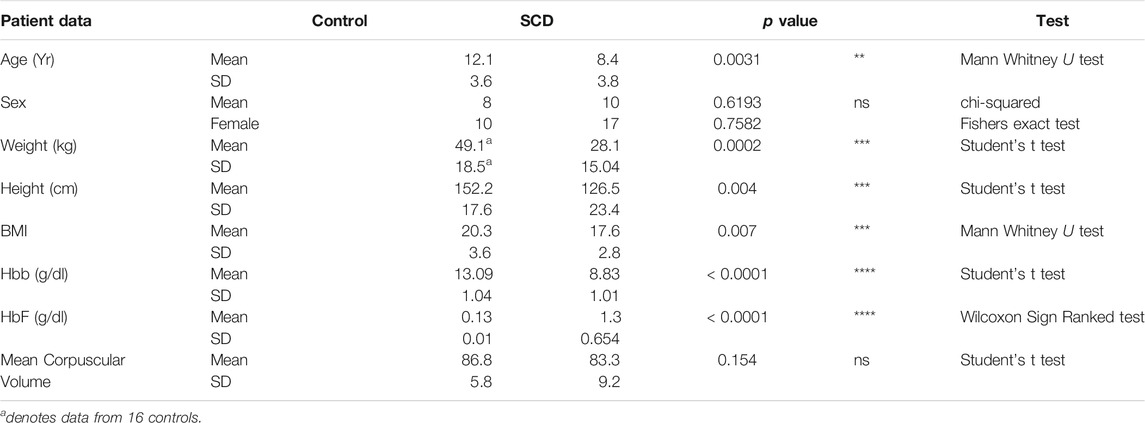
TABLE 1. Patient information. Data provided on 46 participants who were sequenced and subjected to further analysis.
Alignment and Mapping Statistics
We noted a higher yield of RNA extracted from SCA patients’ blood samples than controls (10.8 vs. 2.3 µg/3 ml blood sample, p < 0.001 Student’s t test: Figure 1A). Three samples failed our sequencing QC, either due to poor RNA library with evidence of degradation (1), or low number of reads < 5 million (2: annotated with an * in Figure 1B). These data, and that from the HU treated subject, were excluded from further analysis.
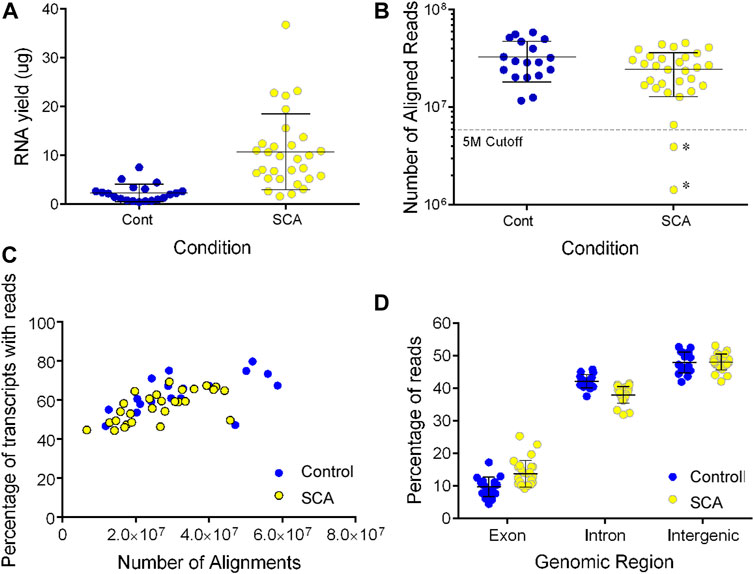
FIGURE 1. RNA sequencing of SCA(26) and control blood samples (18). (A) RNA was extracted from 3 ml whole blood samples using the preAnalytix isolation kit and quantified by absorbance. Yield was calculated as µg in 18 control (blue) and 30 SCA (yellow) samples (Note three samples were excluded from further study. (B) Following sequencing, the number of reads aligned to the hg19 reference genome was determined using Partek Genome Studio (V7.0). Samples marked as * show two additional samples below our five million aligned reads cutoff value, and were excluded from further analysis, data were not significantly different (p = 0.07; unpaired t-test). (C) The number of gene transcripts identified in SCA (yellow) and controls (blue) were shown with respect to the depth of sequencing (number of aligned reads). (D). Following alignment and mapping, the number of reads aligning to exonic, intronic, or intergenic genomic regions was determined in Partek genomics studio. Data were analyzed using 1 way ANOVA with post-hoc Sidak’s multiple comparison test subjected to (** denotes p < 0.001).
Following alignment, we observed no significant difference in the number of aligned reads between control of SCA patients (32.8 vs. 26.2 million aligned reads, p > 0.05; Figure 1B). There was no effect of age on the number of aligned reads (data not shown). The detection of transcripts plateaued to approximately 68% of transcripts in all samples (1/2 max at five million reads: Figure 1C). The ratio of exonic, intronic, and intergenic reads was similar to our previous blood transcriptome estimates (Meller et al., 2016; Hardy et al., 2017). When we compared the mapping statistics, we observed a significantly higher mapping of RNA to exonic regions in libraries prepared from SCA subjects compared to those prepared from controls. There was a converse reduction of intronic mapping of reads in SCA-derived libraries compared to control-derived libraries (Figure 1D; both p < 0.001 1 way ANOVA with Sidak’s multiple comparison test). There was no difference in intergenic mapping between groups.
Differential Expression Analysis
We determined differential gene and transcript expression between SCA and Control groups. Analysis revealed 557 genes with ± 1.5-fold differential expression in SCA patients compared to controls, which was decreased to 223 differentially expressed genes when corrected for age and sex [2-way ANCOVA (correcting for age and sex); FDR p < 0.001 (Benjamini-Hochberg)]. Many genes showed higher expression in SCA compared to control (Figure 2A). There was an enrichment of differential expression in Chr1, Chr17, and Chr19, and an underrepresentation of Chr13, Chr21 and ChrY (Figure 2B). The differentially expressed genes were subjected to hierarchical clustering, and principal component analysis (Figures 2C,D). Hierarchical clustering of the samples shows a clear clustering of the controls and the SCA subjects based on gene expression values, with the exception of one SCA patient (red denotes increased expression). Three principal components account for 80.3% of the variability between the samples (Figure 2D). Of note the first principal component accounted for the effect of SCA status.
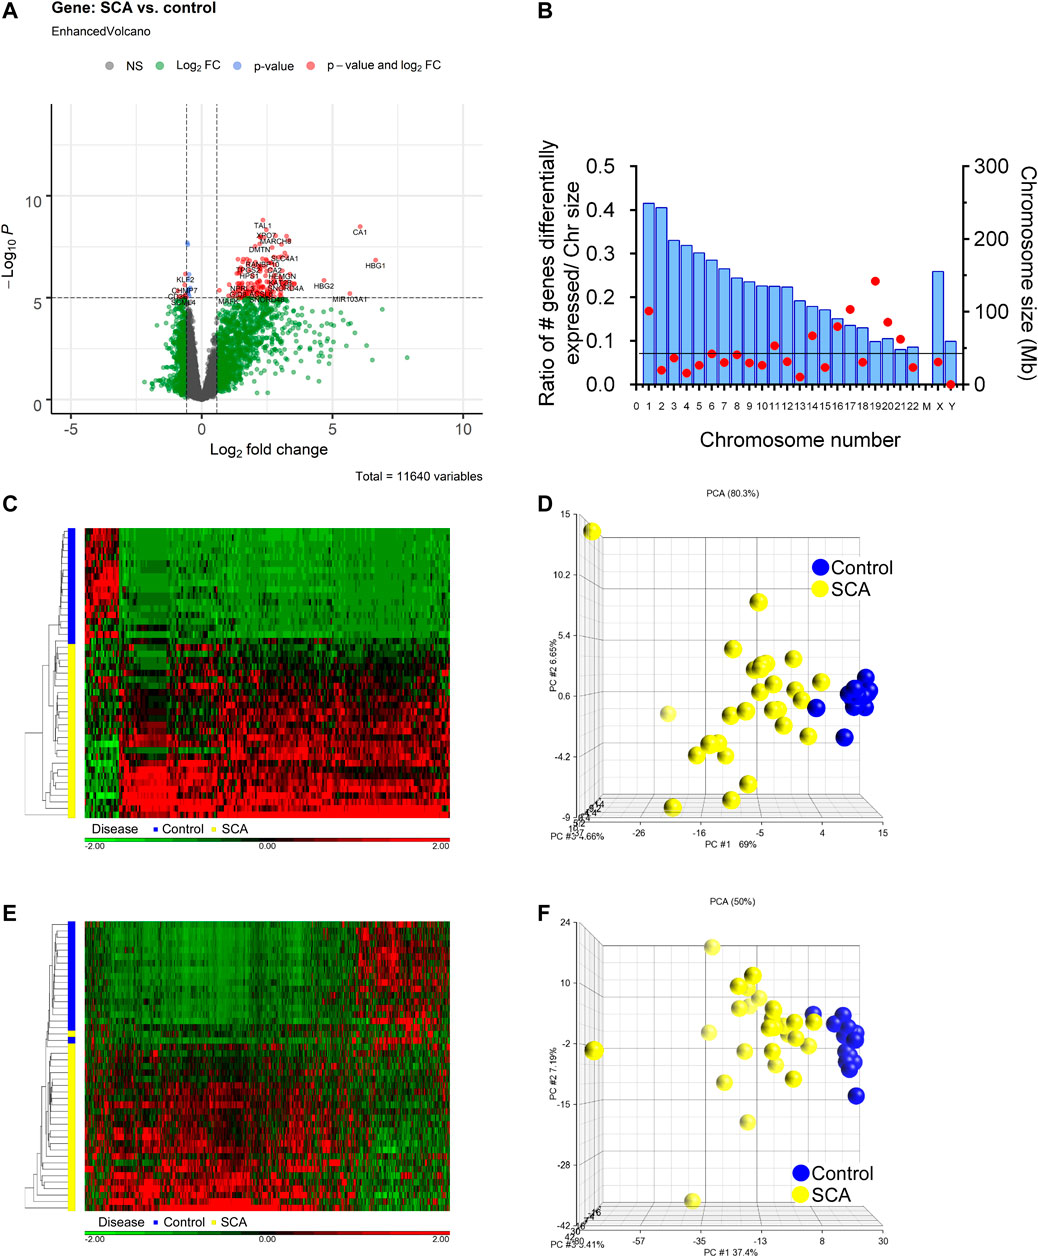
FIGURE 2. Differential gene expression and transcript splicing in SCA patients. (A) Volcano plot showing differentially expressed RNAs, as a measure of fold change and p-value. Data in gray denote data with less than 1.5 fold change, or not significantly different [ANCOVA (correcting for age and sex) with adjusted FDR p < 0.001]. Data in red show up or down-regulated genes passing fold change and p value cutoff. (B) Chromosome location of differentially expressed genes. Chromosome size is shown in blue bars. The number of differentially expressed genes were expressed as a ratio with respect to chromosome size. The line denotes expected ratio of all genes and all chromosome sizes. (C) Hierarchical cluster of 557 differentially expressed genes Red denotes genes with increased expression, and green denotes decreased expression. On the vertical axis blue and yellow bars denote control and SCA patient samples, respectively. Black denotes patients with CA. (D) Principal component analysis of gene expression data shows 73.7% of the variability within the samples is accounted by three principal components (calculated using Partek). Note clustering of SCA (yellow) vs. Controls (blue). (E) Hierarchical cluster of differential transcript expression. Red denotes increased transcript splicing, and green denotes decreased splicing. On the vertical axis blue and yellow bars denote control and SCA patient samples, respectively. (F) Principal component analysis of differential transcript expression data shows 69.6% of the variability within the samples is accounted by three principal components. Note clustering of SCA (yellow) vs. Controls (blue).
Analysis of transcript expression revealed 441 transcripts to be differentially expressed (alternatively spliced) in SCA compared to controls (1-way ANCOVA ± 1.5 fold change with FDR p < 0.001). These data cluster with respect to SCA or control conditions (Figure 2E). Principal component analysis shows three components account for 50% of the variability (Figure 2F). The differentially expressed transcripts (441) were mapped to genes (223). When we compare the genes with differential expression and the genes with alternative splicing, we find 204 genes overlap 46% of transcripts map to differentially expressed genes, and 91% of DEGs map to alternatively spliced transcripts (not shown). This suggests that most genes with differential expression also show differential transcript usage in SCA. Additionally, multiple genes express more than one alternative spliced transcript. It was noted that multiple hemoglobin-associated genes (HBB, HBD, HBG1, HBG2, and HBM) show differential isoform usage in SCA.
Functional Analysis of SCA-Regulated Genes
Pathway analysis was performed on differentially expressed genes using GO enrichment module of Partek Genomics Studio. The two most prominent, most enriched pathways were associated with hemoglobin complexes and protein ubiquitination (Table2). The identification of hemoglobin is unsurprising given multiple hemoglobin family of genes showed higher RNA levels in SCA patients. In addition, pathways associated with gas transport and hemoglobin synthesis (porphyrin and tetrapyrrole synthesis) were also enriched (Table 2). Genes associated with protein ubiquitination and small molecule conjugation were enhanced in the list of differentially expressed genes, consistent with previous reports of enhanced ubiquitin proteasome system activity in SCA (Anjum et al., 2013; Warang et al., 2018). Many of these proteins were associated with E3-ligase activity and proteasome pathways, for example, SIAH2 and TRIM10. The last major grouping of enriched pathways was associated with cytoplasm and cytoskeletal structure. Results were verified using the online DAVID gene function tool, and similar results were obtained (not shown), except for the identification of trypanosomiasis and malaria disease pathways. Pathway analysis of the transcript splicing data set reveals similar hemoglobin and protein ubiquitination regulation functions (see Supplementary Material). Pathways were visualized using ClueGO (Bindea et al., 2009) (Figure 3).
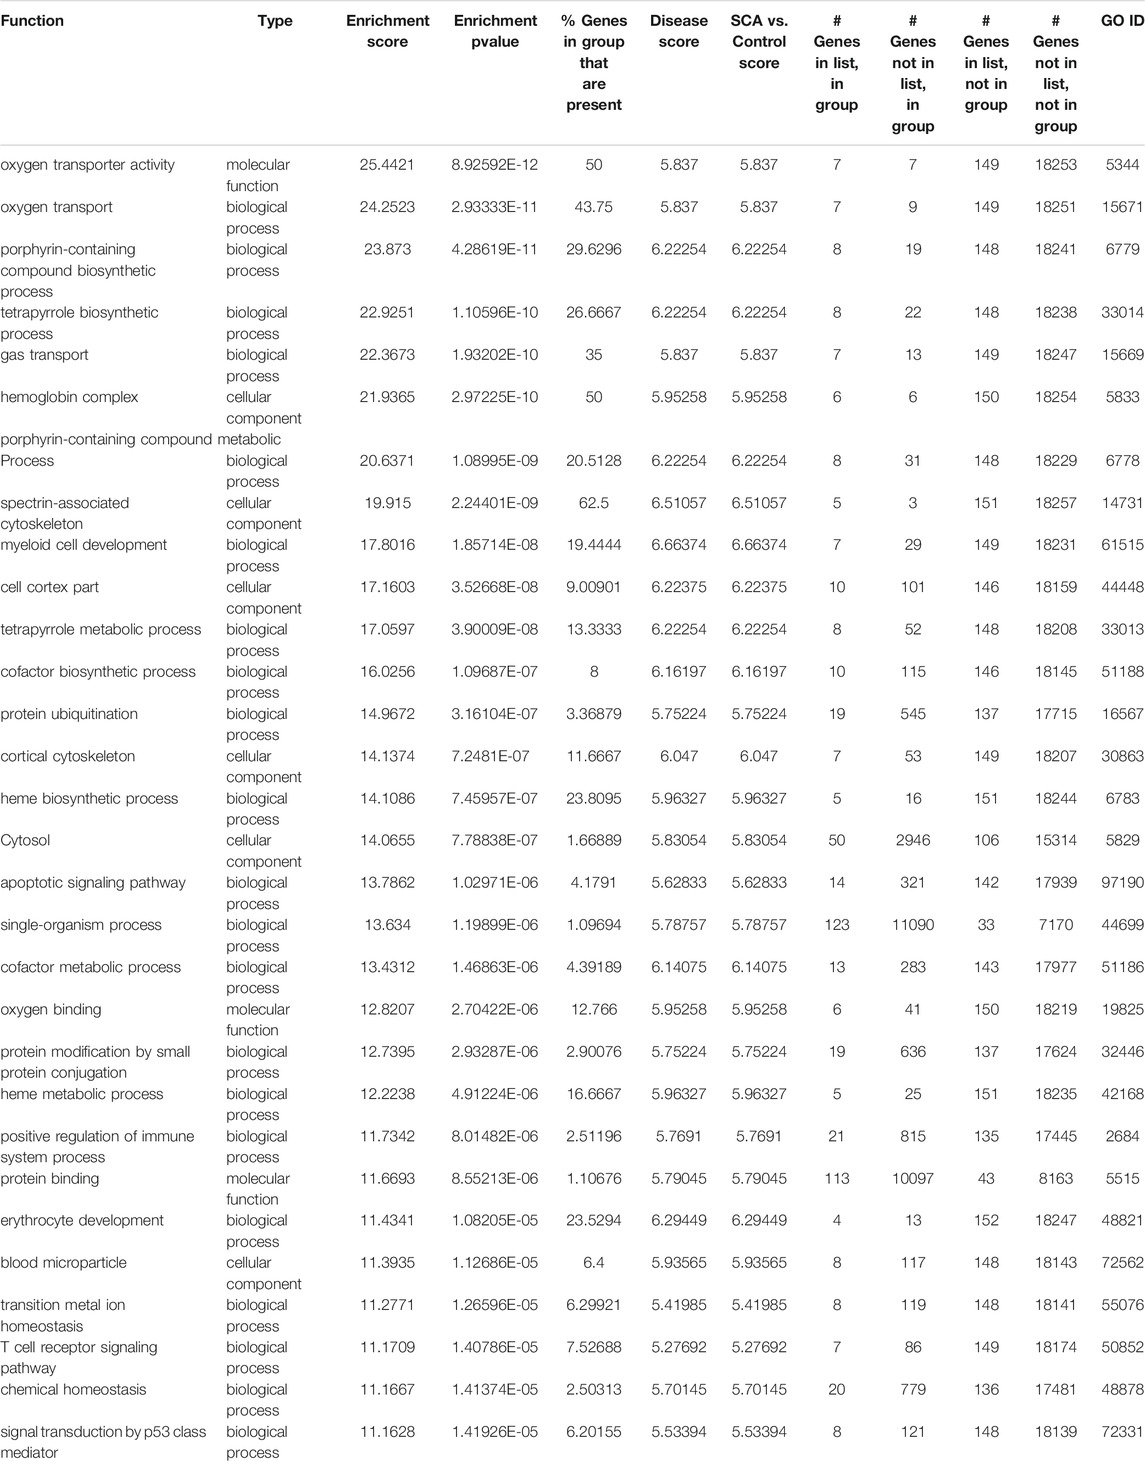
TABLE 2. Gene Ontology categories (Top 30) for enriched pathways, based on differential gene expression analysis between SCA and Controls.
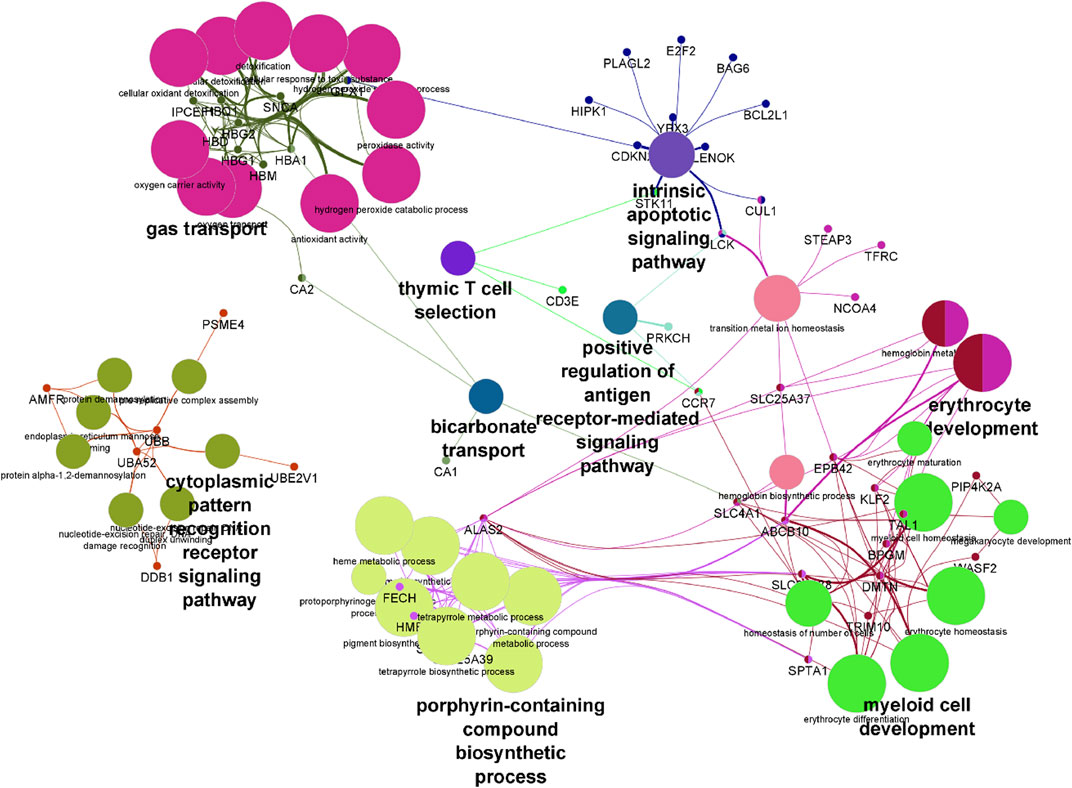
FIGURE 3. Visualization of differentially expressed genes following pathway enrichment in ClueGo. A list of differentially expressed genes were loaded into ClueGO and analyzed using the KEGG biological data base. Nodes of features are depicted by the larger shapes, and smaller circles represent individual genes.
Regulation of Hemoglobin Genes
We observed increased hemoglobin gene expression and alternative splicing in SCA subjects compared to controls, and oxygen transport and Hb associated pathways were regulated in GO analysis. Therefore, we asked whether RNA expression of the beta globin gene and the gamma (1 and 2) globin genes correlated to their protein levels. Protein levels of hemoglobin beta was significantly lower in SCA subjects compared to controls (Table 1, p < 0001). In contrast, HBB RNA levels were higher in SCA compared to controls (p < 0.0001 Student’s t-test) and RNA and protein levels appear inversely correlated (r2 = 0.2239, Figure 4A).
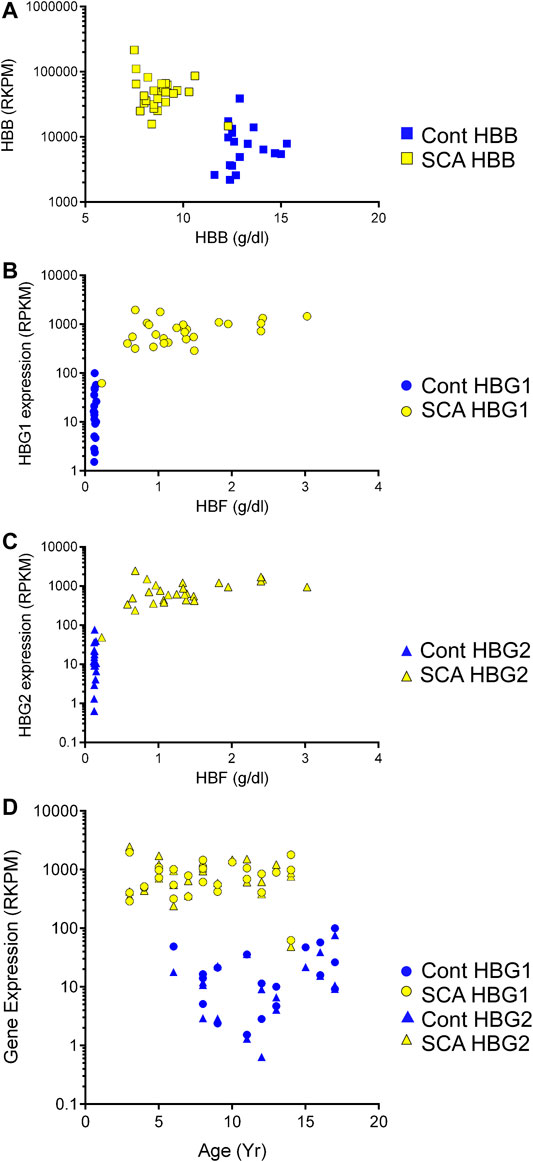
FIGURE 4. Expression of mRNA and protein of hemoglobin genes in SCA. We compared the expression of HBB, HBG1, and HBG2 with the plasma protein levels of these gene products in SCA (yellow) and controls (blue). (A) HBB gene expression and plasma protein levels appear inversely correlated. (B, C) HBG1 and HBG2 mRNA and Hbf protein levels do not correlate. (D) Comparison of HBG1 and HBG2 mRNA expression with participant age in controls (blue and SCA). Note the >10 fold difference in control to SCA levels of HBG1 and HBG2 gene expression values (RPKM).
Fetal hemoglobin (HbF) is developmentally regulated and encoded by two RNAs (HBG1 and HBG2). Fetal hemoglobin (HBF) protein levels in controls were below detection limits (< 1%). Fetal hemoglobin levels are significantly higher in SCA subjects compared to controls (p < 0.001, Table 1). Even though there is a range of HBF protein levels in blood of SCA subjects, the protein concentration does not show a clear linear correlation with either HBG1 or HBG2 mRNA expression levels (Figures 4B,C). When compared to subject age, HBG1 and HGB2 mRNA expression levels did not significantly correlate with age in either SCA or control subjects (Figure 4D). Together, these data show a disconnect between HBG protein levels and mRNA expression, which may be associated with cell composition of the blood, or different cells being responsible for the measured HBG protein and mRNA.
Recent human genome data suggest that single nucleotide variants may regulate gene expression and translation (GTEx Consortium, 2017; Robert and Pelletier, 2018). To find potential novel regulators of HBG we performed a targeted eQTL analysis of RNA seq data, to identify identified potential SNPS regulating HBG1 and HBG2 gene expression in SCA. Single nucleotide variations were called using Partek Genomics Studio from the RNA-Seq data, and filtered (> 20 coverage). First, basecalls were correlated to all gene expression values using matrix eQTL using disease status, age and sex as covariates (see appendix for script). Combining the data from controls and SCA together, we identified 58 and 287,111 locations potential trans and cis eQTL events (passing post-hoc FDR p < 0.05). The chromosomal locations of these cis and trans SNVs are represented in CMplots in Figures 5A–C.
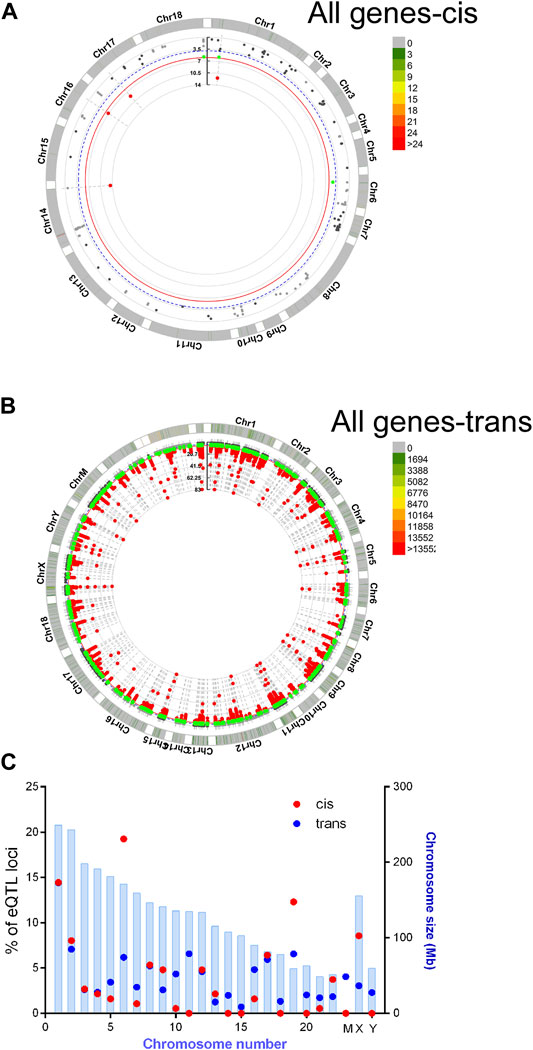
FIGURE 5. Basecalls and RPKM gene expression data were extracted using Partek and correlated using matrix eQTL package for R. Resultant data were plotted using CMplots in R (CMplot). (A) cis Eqtl sites (B) trans eQTL sites vs. entire genome expression data. (C) Enrichment of cis eQTLs on chr 6 and 19. The size of the chromosome in Mbp is shown in blue bars. % of identified eQTL loci/chromosome is represented by red (cis) or blue (trans) circles.
We then investigated whether any SNPs correlated with the expression of HBG1 and HBG2. We performed matrix eQTL using disease status, age and sex as covariates. No cis eQTLs significantly mapped to either HBG1 or HBG2. In contrast there were 9 trans eQTLs that correlate with HBG1 (4) and HBG2 (5) gene expression patterns, and three of these overlap (Table 3) (FDR corrected p < 0.05). The call of the SNVs is shown in Figure 5D using the genomic coordinates, we identify that these SNVs are all known SNVs (i.e., they are contained in clinVar/dbSNP), and associate with HBB, RYR2, HLA1, ARHGEF18, and Mir663A (Figure 5D). The HBB result (hemoglobin S mutation) is consistent with higher HbF levels in SCA. Interestingly, many of the other loci were intronic or intergenic RNAs (Table 3). We highlight one intronic eQTL loci that appears to be a novel non-coding RNA contained within the intron of the RYR2 gene (Figure 6B), and the loci is a known SNV (dbSNP 155v2; hg19; rs201281534) (Figure 6B).
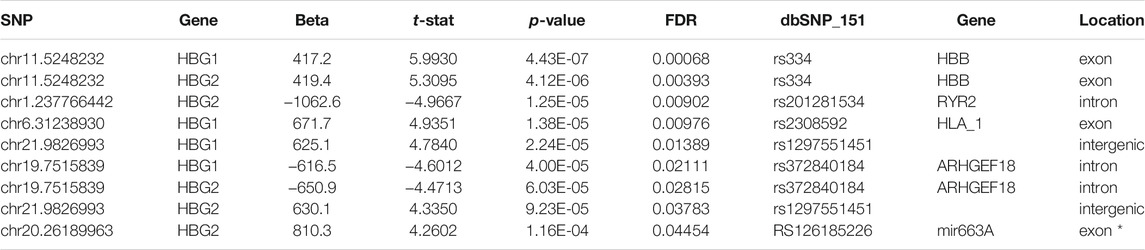
TABLE 3. Trans-SNPs identified in Matrix eQTL as correlating with HBG1 or HBG2 expression.
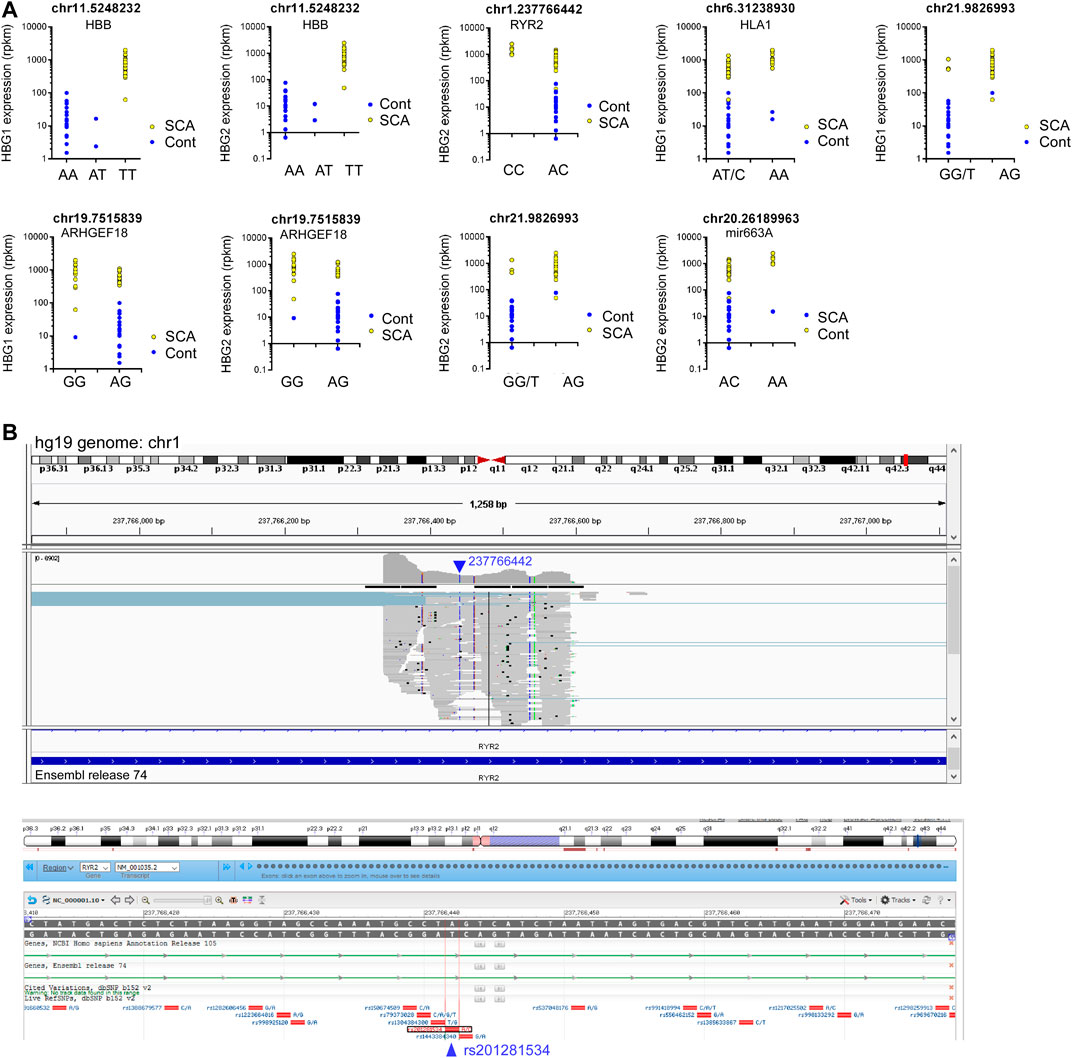
FIGURE 6. eQTL analysis of SCA RNA-Seq data reveals novel RNAs regulating HBG1 and HBG2 gene expression. (A) Nine loci correlated significantly with HBG1 or HBG2 gene expression (FDR adjusted p < 0.05). Genotype is depicted in the x axis, and HBG1 or HBG2 gene expression on the Y axis. Data show control (blue) and SCA patients (yellow). (B) Identification of novel intronic RNA from RYR2 visualized using the integrated genome browser (Broad Institute). The Blue arrow depicts the location of 23776642 on chr1. The gray bars represent the pile-up of reads aligning with this region. The annotation guide from ensemble release 74, depicts the region as part of an intron of RYR2. Below shows the NCBI browser screen shot depicting know SNPs in this region. The location 237766442 aligns with rs201281534 in bdSNP 152v2.
Finally, we repeated out analysis using just the splitting the SCA and control data into two individual analyses, to overcome the potential effect of using HBG1/2 gene expression as a surrogate for SCA status. Matrix eQTL analysis using age and sex as covariates did not yield any significant trans or cis eQTLs. These data suggest that SNPs associated with non-coding, or novel RNAs may play a role in either HBG1/HBG2 gene expression, but may also correlate to SCA status of a patient, and therefore deserve further investigation.
We further investigated our data set for genes whose expression may correlate with HBG genes, to identify potential regulatory elements/factors. Correlation analysis was performed to determine whether genes associated with HBG1 or HBG2 mRNA expression were regulated in SCA. SCA and controls data were subjected to Spearman correlation (to reduce the influence of outliers) and correlation coefficients were grouped using hierarchical clustering (Figures 6A,B: The distributions of correlation coefficients is shown in a histogram inset). The control data appears more co-regulated, as determined by clusters within the heatmap, with a trend towards lower correlation values in the SCA data set. The difference between the control and SCA data was also determined, from this analysis we do not observe a strong-coordinated correlation shift between the data (most data are distributed around 0: Figure 7C inset). These data suggest that gene expression is less correlated in SCA.
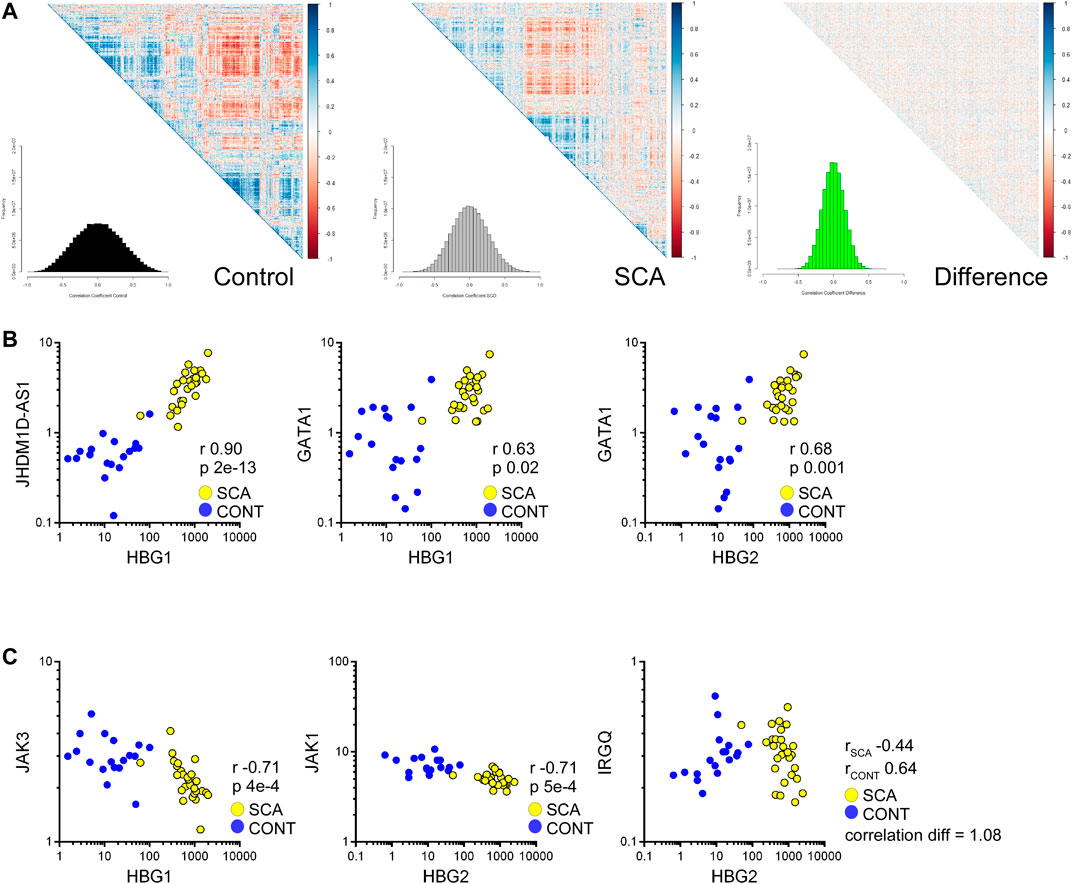
FIGURE 7. Correlation analysis of RNA-Seq data reveals reduced coordination in SCA and identifies pathways regulating HBG1 and HBG2 expression. (A) Heatmap of correlation matrices of gene expression values in control and SCA. The difference was normalized to 1 and also plotted. The frequency of correlation values was determined using the histogram package, and plotted as inset. Note the reduced correlation in the SCA data. (B) Correlation between HBG1 and HBG2 with JHDM1D-AS1 and GATA1 across all data sets: Control (blue) and SCA(yellow). Correlation r values and p values (Bonferroni corrected) are shown inset. (C) Inverse correlation of HBG1 with Jak3 and HBG2 with Jak1. IRGQ showed the greatest change in correlation between the two patient groups, changing from a positive correlation in Controls to a negative correlation in SCA (yellow) subjects. Spearman Correlation performed in Partek Genomics Studio, all p-values were p < 0.05 following Bonferroni correction for multiple testing.
We prepared a list of genes whose correlation changes by 0.5 and subjected the lists to pathway analysis. The most differentially regulated was IRGQ (Figure 7E) with a correlation change of 1.0 (from 0.63 to 0.44 controls to SCA). Genes that show a reduced correlation in SCA compared to control are enriched for transcription and translation regulation pathways (Supplementary Material). In contrast, no obvious key mechanisms appeared to be overrepresented in the increased correlation data set (Supplementary Material). This suggests that although RNA expression is increased overall in SCA, it is less coordinated with respect to biological pathways.
From these data, we searched for genes that correlate with γ-globin genes, specifically potential transcription or translation regulating genes, and microRNAs associated with these regulators, or with direct correlation to the hemoglobin genes. We found 1381 genes expression values correlated with either HBG1 or HBG2 (Bonferroni corrected p-value p < 0.05). From these we subjected the gene lists to Gene Ontology analysis. When we split the data into SCA or control we observe the positively correlated genes associated with protein ubiquitination associated pathways, including E2 and E3 ligases (Supplementary Material). We also identified within this list GATA1 expression levels correlating with HBG1 and HBG2 expression levels (Figure 6B), suggesting an increased GATA 1 drive associated with higher expression of fetal hemoglobin genes. In contrast, the negatively associated genes appear to involve immune responses to interleukins, and specifically members of the JAK-STAT signaling pathway (Supplementary Material: Figure 7B). JAK inhibitors have recently been investigated as potential therapies for sickle cell disease (Pecoraro et al., 2015). Again, whilst these correlations appear provocative, further follow study is required.
Discussion
In this study, we performed whole transcriptome analysis of peripheral blood in children with sickle cell anemia and identified differential gene and transcript expression in SCA. We also identified potential eQTL loci which may be responsible for higher γ-globin RNA expression in SCA subjects, and potential novel regulators of HBG1 and HBG2 RNA expression. While this is a relatively small study, our observations regarding the overall transcriptomic effect of sickle cell anemia appear consistent with multiple previous reports. Children with sickle cell anemia show fundamental changes in their blood transcriptome, with differential mapping, and approximately 8% of the detected transcriptome showing differential expression (Figure 2). This suggests that some of the pathophysiologic responses of SCA may be due to this considerable change in transcription. Furthermore, the disorder appears to de-regulate the co-expression networks of multiple genes. Similar to other published blood transcriptome studies in adults (see below), we observe changes in hemoglobin expression, and enhanced expression of proteins associated with protein degradation (ubiquitin proteasome system), cytoskeletal compensation, and autophagy/mitophagy. This last biological pathway is currently under investigation to reduce the mitochondria content of red blood cells (Archer et al., 2015).
We observe both genes encoding γ-globin (HBG1 and HBG2) are increased in SCA compared to controls, and the SCA subjects in this study have higher HbF protein levels compared to controls. To avoid treatment effects, we recruited SCA subjects who were not receiving chronic red cell transfusions or hydroxyurea; this approach selects for less symptomatic subjects who may have higher Hb F levels. It is of note that hydroxyurea increases both mRNA and protein levels two fold (Italia et al., 2013), whereas the absolute difference between HBG1 and HBG2 mRNAs in SCA subjects vs. controls in our study is in the order of 48 and 70 fold, respectively.
Multiple transcriptional regulatory elements enhance or inhibit the globin gene loci. Expression of known drivers of HBG1 and HBG2 genes, such as KLF10 and SIRT1 were not significantly increased in our samples (not shown) (Borg et al., 2012; Dai et al., 2017). We also did not find any significant differences in expression of the common inhibitory regulators of HBG1 and HBG2 gene [KLF1 (Zhou et al., 2010; Grieco et al., 2015; Vinjamur et al., 2016), ALAS1, Bcl11A, HGC1, and BGLT3 (Ivaldi et al., 2018)]. Furthermore, there was no correlation between Hb F protein levels and either HBG1 or HBG2 RNA expression levels. This suggests that the mechanisms driving HBG1 and HBG2 mRNA expression in whole blood samples appear different from those driving red blood cell γ-globin translation and protein expression. Recent studies have attempted to regulate HbF at the translational level (Hahn and Lowrey, 2014). Together, this mismatch between γ-globin gene and protein expression suggests that yet unidentified factors may contribute to HbF transcription and translation and these could make novel therapeutic targets.
In order to identify potential regulators of HBG1 and HBG2 RNA expression, we performed both eQTL and expression correlation investigations. SNPs in the promotor of these genes were associated with HbF expression in a Brazilian SCA study (Barbosa et al., 2010). In our study, we did not identify any cis (local) SNPs associated with differential HBG1 or HBG2 expression. We found some trans SNPs that correlate with HBG1/HBG2 expression. These RNAs appear to be novel non-coding regulatory RNAs, and were not found in the current human genome annotation guides (ensembl), however all of the SNVs were found in the current SNP database (dbSNP v 152). The identification of these novel RNAs was only possible with whole transcriptome RNA-seq methodology, and offer the potential for novel approaches to regulate fetal hemogobin expression.
We performed correlation analysis on controls and SCA datasets to identify gene relationships within our dataset, and potential regulators of HBG1 and HBG2. Such an approach has not yet been performed on SCA blood data sets. HBG1 showed a highest correlation with JHDM1D-As1, a long-noncoding RNA associated with angiogenesis (Kondo et al., 2017). GATA 1, a driver of globin gene expression (Testa, 2009), was modestly positively correlated with HBG1 and HBG2 in SCA compared to control. Correlation analysis of HBG1 and HBG2 with the rest of the transcriptome reveals a negative correlation with JAK-STAT signaling pathway members (JAK1 and JAK2), which is consistent with reports identifying enhanced fetal γ-globin levels in cells treated by JAK stat inhibitors (Pecoraro et al., 2015). This suggests both a loss of repression and a promoting effect of GATA1 may drive the increase in HBG gene expression in SCA, which could be further investigated for therapeutic synergy.
Comparison to Previous Transcriptome Studies
Previous microarray studies in SCA using platelets, PBMCs, and whole blood reveal similar patterns as those reported here (Desai et al., 2017; Raghavachari et al., 2009; Raghavachari et al., 2007; Raghavachari et al., 2012; Hounkpe et al., 2015). An increase in platelet RNA expression is observed in SCA patients (220 genes were identified as DE, FC ± 5.0, FDR < 0.2) compared to controls (Raghavachari et al., 2007). We observe multiple platelet associated RNAs in our whole blood RNA-seq data (for example, PPBP, PF4, and NRGN), suggesting a component of whole blood RNA signal is derived from platelets. RNA expression in adult SCA whole blood cells was analyzed using microarray [compare Figure 2A this study vs. Figure 6A (Raghavachari et al., 2009)]. They identified 112 genes with differential expression (FC ± 2, FDR < 0.2), and in particular multiple hemoglobin genes showing increased expression in SCA (including HBM, HBG, and HBBP1) (Raghavachari et al., 2009). The same group showed RNA-Seq identifies novel transcripts and differential expression in SCA, although this study had lower depth of sequencing than our study, and only investigated four samples. In general, microarray responses show a smaller fold change compared to RNA-Seq studies (Raghavachari et al., 2012). Our study identified more differentially expressed genes, probably due to the larger number of samples in our study, and second due to our study using whole transcriptome analysis with a newer reference, versus polyA transcripts (Raghavachari et al., 2012).
A recent meta-analysis of sickle cell disease gene expression data sets has been performed on previously reported microarray data (Hounkpe et al., 2015). One of these studies (GEO accession number GEO35007) investigated blood RNA expression in children with SCA, both in acute crisis and steady state. The meta-analysis identified similar pathways of enriched genes following differential expression analysis, including immune response, autophagy, stress, heme metabolism, and synthesis (Hounkpe et al., 2015), consistent with our observations. Meta-analysis also confirms a general trend of increased gene expression in SCA vs. controls. Interestingly, a recent study applied transcriptomic findings to enhance clinical diagnosis (mortality prediction) in SCA (Desai et al., 2017).
Limitations
We acknowledge that our study has a small sample size (due to patient cohort size), which may affect the power of some observations. To correct for this all data were subjected to post hoc correction. We did observe significant gene expression and transcript usage changes in SCA vs. controls. We did not perform validation of our expression results with PCR because we noticed strong consistency with similar studies (Raghavachari et al., 2007; Raghavachari et al., 2009; Raghavachari et al., 2012; Hounkpe et al., 2015; Desai et al., 2017).
In summary, while we identified some patterns of differential gene expression observed in prior microarray and RNAseq studies, our study is distinguished by several features. By limiting our study to children not receiving HU or red cell transfusion therapy, this group with higher baseline hemoglobin F levels enabled discovery of potential novel γ-globin regulators. The use of whole transcriptome, non-ribosome/globin depleted RNA enables the identification of novel RNAs and the correlation to hemoglobin genes. We chose not to remove globin mRNA from our samples based on our experiences of ribosomal reduction techniques in PAXgene tube derived RNA, and the observations of others (Liu et al., 2006; Raghavachari et al., 2012). This permitted discovery of red cell gene expression while also identifying many of the genes revealed in globin depleted microarray studies, suggesting a potential advantage of RNA-seq methodology without globin mRNA depletion. Other sickle cell transcriptome studies have not previously applied eQTL and gene expression correlation analysis. These methods confirmed known γ-globin regulators, GATA 1 and JAK 1 and JAK 2, and identified two non-coding sequences strongly associated with HBG expression. Lastly, the lack of association between HBG1 and HGB2 gene and Hemoglobin F protein expression suggest that there is post-translational regulation of fetal hemoglobin synthesis, potentially mediated by the upregulated ubiquitin-proteasome pathways. Taken together, these data show the depth of biological information to be extracted from RNA-sequencing studies of SCA patients.
Data Availability Statement
Data are available at dbGAP, Accession: phs002687.v1.p1 (http://www.ncbi.nlm.nih.gov/projects/gap/cgi-bin/study.cgi?study_id=phs002687.v1.p1). Further queries can be directed to the corresponding author.
Ethics Statement
The authors acknowledge that the data presented in this study must be deposited and made publicly available in an acceptable repository, prior to publication. Data are available at dbGAP [Study title: RNA-seq of whole blood from pediatric Sickle Cell Anemia (SCA) patients] or requested directly from R. Meller. SNP analysis data available from R. Meller.
Author Contributions
Contribution: AP performed sequencing experiments; RM analyzed results and made the figures; BG, IB-P, and DA recruited patients, performed consent, and extracted clinical data. BG, RS, and RM designed the research and wrote the paper.
Funding
This work was supported by grants from the National Institutes of Health (P50HL117929 BG, U54CA118638, and MD007602 RM). Additional institutional support provided in the form of grants from the NIH (MD000101 and MD007602). The sponsors of this study are public or nonprofit organizations that support science in general.
Conflict of Interest
The authors declare that the research was conducted in the absence of any commercial or financial relationships that could be construed as a potential conflict of interest.
Publisher’s Note
All claims expressed in this article are solely those of the authors and do not necessarily represent those of their affiliated organizations, or those of the publisher, the editors and the reviewers. Any product that may be evaluated in this article, or claim that may be made by its manufacturer, is not guaranteed or endorsed by the publisher.
Acknowledgments
The authors thank the study volunteers and clinical research staff of the Morehouse School of Medicine Cardiovascular Research Institute and Children’s Healthcare of Atlanta Aflac Sickle Cell Program.
Supplementary Material
The Supplementary Material for this article can be found online at: https://www.frontiersin.org/articles/10.3389/fgene.2021.737741/full#supplementary-material
References
Anjum, F., Lazar, J., Soh, J., Albitar, M., Gowda, S., Hussain, M. M., et al. (2013). Dysregulation of Ubiquitin-Proteasome Pathway and Apolipoprotein A Metabolism in Sickle Cell Disease-Related Pulmonary Arterial Hypertension. Pulm. Circ. 3, 851–855. doi:10.1086/674763
Archer, N., Galacteros, F., and Brugnara, C. (2015). 2015 Clinical Trials Update in Sickle Cell Anemia. Am. J. Hematol. 90, 934–950. doi:10.1002/ajh.24116
Balandya, E., Reynolds, T., Obaro, S., and Makani, J. (2016). Alteration of Lymphocyte Phenotype and Function in Sickle Cell Anemia: Implications for Vaccine Responses. Am. J. Hematol. 91, 938–946. doi:10.1002/ajh.24438
Barbosa, C. G., Goncalves-Santos, N. J., Souza-Ribeiro, S. B., Moura-Neto, J. P., Takahashi, D., Silva, D. O., et al. (2010). Promoter Region Sequence Differences in the A and G Gamma Globin Genes of Brazilian Sickle Cell Anemia Patients. Braz. J. Med. Biol. Res. 43, 705–711. doi:10.1590/s0100-879x2010007500062
Bindea, G., Mlecnik, B., Hackl, H., Charoentong, P., Tosolini, M., Kirilovsky, A., et al. (2009). ClueGO: a Cytoscape Plug-In to Decipher Functionally Grouped Gene Ontology and Pathway Annotation Networks. Bioinformatics 25, 1091–1093. doi:10.1093/bioinformatics/btp101
Borg, J., Phylactides, M., Bartsakoulia, M., Tafrali, C., Lederer, C., Felice, A. E., et al. (2012). KLF10 Gene Expression Is Associated with High Fetal Hemoglobin Levels and with Response to Hydroxyurea Treatment in β-hemoglobinopathy Patients. Pharmacogenomics 13, 1487–1500. doi:10.2217/pgs.12.125
Dai, Y., Chen, T., Ijaz, H., Cho, E. H., and Steinberg, M. H. (2017). SIRT1activates the Expression of Fetal Hemoglobin Genes. Am. J. Hematol. 92, 1177–1186. doi:10.1002/ajh.24879
Desai, A. A., Lei, Z., Bahroos, N., Maienschein-Cline, M., Saraf, S. L., Zhang, X., et al. (2017). Association of Circulating Transcriptomic Profiles with Mortality in Sickle Cell Disease. Blood 129, 3009–3016. doi:10.1182/blood-2016-11-752279
Grieco, A. J., Billett, H. H., Green, N. S., Driscoll, M. C., and Bouhassira, E. E. (2015). Variation in Gamma-Globin Expression before and after Induction with Hydroxyurea Associated with BCL11A, KLF1 and TAL1. PLoS One 10, e0129431. doi:10.1371/journal.pone.0129431
GTEx Consortium (2017). Genetic effects on gene expression across human tissues. Nature 550, 204–213. doi:10.1038/nature24277
Hahn, C. K., and Lowrey, C. H. (2014). Induction of Fetal Hemoglobin through Enhanced Translation Efficiency of γ-globin mRNA. Blood 124, 2730–2734. doi:10.1182/blood-2014-03-564302
Hardy, J. J., Mooney, S. R., Pearson, A. N., McGuire, D., Correa, D. J., Simon, R. P., et al. (2017). Assessing the Accuracy of Blood RNA Profiles to Identify Patients with post-concussion Syndrome: A Pilot Study in a Military Patient Population. PLoS One 12, e0183113. doi:10.1371/journal.pone.0183113
Hounkpe, B. W., Fiusa, M. M. L., Colella, M. P., Nilkenes Gomes da Costa, L., Benatti, R. d. O., Olalla Saad, S. T., et al. (2015). Role of Innate Immunity-Triggered Pathways in the Pathogenesis of Sickle Cell Disease: a Meta-Analysis of Gene Expression Studies. Sci. Rep. 5, 17822. doi:10.1038/srep17822
Ingram, V. M. (1958). Abnormal Human Haemoglobins. Biochim. Biophys. Acta 28, 539–545. doi:10.1016/0006-3002(58)90516-x
Italia, K., Jijina, F., Merchant, R., Swaminathan, S., Nadkarni, A., Gupta, M., et al. (2013). Comparison of In-Vitro and In-Vivo Response to Fetal Hemoglobin Production and γ-mRNA Expression by Hydroxyurea in Hemoglobinopathies. Indian J. Hum. Genet. 19, 251–258. doi:10.4103/0971-6866.116128
Ivaldi, M. S., Diaz, L. F., Chakalova, L., Lee, J., Krivega, I., and Dean, A. (2018). Fetal γ-globin Genes Are Regulated by the BGLT3 Long Noncoding RNA Locus. Blood 132, 1963–1973. doi:10.1182/blood-2018-07-862003
Jickling, G. C., Ander, B. P., Stamova, B., Zhan, X., Liu, D., Rothstein, L., et al. (2013). RNA in Blood Is Altered Prior to Hemorrhagic Transformation in Ischemic Stroke. Ann. Neurol. 74, 232–240. doi:10.1002/ana.23883
Jickling, G. C., Stamova, B., Ander, B. P., Zhan, X., Liu, D., Sison, S.-M., et al. (2012). Prediction of Cardioembolic, Arterial, and Lacunar Causes of Cryptogenic Stroke by Gene Expression and Infarct Location. Stroke 43, 2036–2041. doi:10.1161/strokeaha.111.648725
Jickling, G. C., Stamova, B., Ander, B. P., Zhan, X., Tian, Y., Liu, D., et al. (2011). Profiles of Lacunar and Nonlacunar Stroke. Ann. Neurol. 70, 477–485. doi:10.1002/ana.22497
Jison, M. L., Munson, P. J., Barb, J. J., Suffredini, A. F., Talwar, S., Logun, C., et al. (2004). Blood Mononuclear Cell Gene Expression Profiles Characterize the Oxidant, Hemolytic, and Inflammatory Stress of Sickle Cell Disease. Blood 104, 270–280. doi:10.1182/blood-2003-08-2760
Kondo, A., Nonaka, A., Shimamura, T., Yamamoto, S., Yoshida, T., Kodama, T., et al. (2017). Long Noncoding RNA JHDM1D-AS1 Promotes Tumor Growth by Regulating Angiogenesis in Response to Nutrient Starvation. Mol. Cel Biol 37, e00125-17. doi:10.1128/MCB.00125-17
Liu, J., Walter, E., Stenger, D., and Thach, D. (2006). Effects of Globin mRNA Reduction Methods on Gene Expression Profiles from Whole Blood. J. Mol. Diagn. 8, 551–558. doi:10.2353/jmoldx.2006.060021
Meller, R., Pearson, A. N., Hardy, J. J., Hall, C. L., McGuire, D., Frankel, M. R., et al. (2016). Blood Transcriptome Changes after Stroke in an African American Population. Ann. Clin. Transl Neurol. 3, 70–81. doi:10.1002/acn3.272
Pauling, L., Itano, H. A., Singer, S. J., and Wells, I. C. (1949). Sickle Cell Anemia, a Molecular Disease. Science 110, 543–548. doi:10.1126/science.110.2865.543
Pecoraro, A., Troia, A., Vitrano, A., Di Maggio, R., Sacco, M., Maggio, A., et al. (2015). Study on the Efficacy of a JAK Inhibitor Pharmacological Agent as Inducer of Fetal Hemoglobin Production in Cultured Erythroid Precursors from Sickle Cell and Beta-Thalassemia Patients. Blood 126, 2048. doi:10.1182/blood.v126.23.2048.2048
Raghavachari, N., Barb, J., Yang, Y., Liu, P., Woodhouse, K., Levy, D., et al. (2012). A Systematic Comparison and Evaluation of High Density Exon Arrays and RNA-Seq Technology Used to Unravel the Peripheral Blood Transcriptome of Sickle Cell Disease. BMC Med. Genomics 5, 28. doi:10.1186/1755-8794-5-28
Raghavachari, N., Xu, X., Harris, A., Villagra, J., Logun, C., Barb, J., et al. (2007). Amplified Expression Profiling of Platelet Transcriptome Reveals Changes in Arginine Metabolic Pathways in Patients with Sickle Cell Disease. Circulation 115, 1551–1562. doi:10.1161/circulationaha.106.658641
Raghavachari, N., Xu, X., Munson, P. J., and Gladwin, M. T. (2009). Characterization of Whole Blood Gene Expression Profiles as a Sequel to Globin mRNA Reduction in Patients with Sickle Cell Disease. PLoS One 4, e6484. doi:10.1371/journal.pone.0006484
Robert, F., and Pelletier, J. (2018). Exploring the Impact of Single-Nucleotide Polymorphisms on Translation. Front. Genet. 9, 507. doi:10.3389/fgene.2018.00507
Scriver, J. B., and Waugh, T. R. (1930). Studies on a Case of Sickle-Cell Anaemia. Can. Med. Assoc. J. 23, 375–380.
Shabalin, A. A. (2012). Matrix eQTL: Ultra Fast eQTL Analysis via Large Matrix Operations. Bioinformatics 28, 1353–1358. doi:10.1093/bioinformatics/bts163
Sharp, F. R., Jickling, G. C., Stamova, B., Tian, Y., Zhan, X., Liu, D., et al. (2011). Molecular Markers and Mechanisms of Stroke: RNA Studies of Blood in Animals and Humans. J. Cereb. Blood Flow Metab. 31, 1513–1531. doi:10.1038/jcbfm.2011.45
Sharp, F. R., Xu, H., Lit, L., Walker, W., Pinter, J., Apperson, M., et al. (2007). Genomic Profiles of Stroke in Blood. Stroke 38, 691–693. doi:10.1161/01.str.0000247940.27518.38
Testa, U. (2009). Fetal Hemoglobin Chemical Inducers for Treatment of Hemoglobinopathies. Ann. Hematol. 88, 505–528. doi:10.1007/s00277-008-0637-y
Vinjamur, D. S., Alhashem, Y. N., Mohamad, S. F., Amin, P., Williams, D. C., and Lloyd, J. A. (2016). Krüppel-Like Transcription Factor KLF1 Is Required for Optimal γ- and β-Globin Expression in Human Fetal Erythroblasts. PLoS One 11, e0146802. doi:10.1371/journal.pone.0146802
Warang, P., Homma, T., Pandya, R., Sawant, A., Shinde, N., Pandey, D., et al. (2018). Potential Involvement of Ubiquitin-Proteasome System Dysfunction Associated with Oxidative Stress in the Pathogenesis of Sickle Cell Disease. Br. J. Haematol. 182, 559–566. doi:10.1111/bjh.15437
Yin, L., Zhang, H., Tang, Z., Xu, J., Yin, D., Zhang, Z., et al. (2021). rMVP: A Memory-Efficient, Visualization-Enhanced, and Parallel-Accelerated Tool for Genome-wide Association Study. Genomics Proteomics Bioinformatics S1672-0229, 00050-4. doi:10.1016/j.gpb.2020.10.007
Keywords: sickle cell disease, RNA-sequencing, transcriptome, eQTL analysis, pathway analysis
Citation: Gee BE, Pearson A, Buchanan-Perry I, Simon RP, Archer DR and Meller R (2022) Whole Blood Transcriptome Analysis in Children with Sickle Cell Anemia. Front. Genet. 12:737741. doi: 10.3389/fgene.2021.737741
Received: 07 July 2021; Accepted: 20 October 2021;
Published: 13 January 2022.
Edited by:
Joseph Borg, University of Malta, MaltaReviewed by:
Jianxiang Shi, Zhengzhou University, ChinaCiaran Michael Lee, University College Cork, Ireland
Copyright © 2022 Gee, Pearson, Buchanan-Perry, Simon, Archer and Meller. This is an open-access article distributed under the terms of the Creative Commons Attribution License (CC BY). The use, distribution or reproduction in other forums is permitted, provided the original author(s) and the copyright owner(s) are credited and that the original publication in this journal is cited, in accordance with accepted academic practice. No use, distribution or reproduction is permitted which does not comply with these terms.
*Correspondence: Robert Meller, cm1lbGxlckBtc20uZWR1