 Lei Zhu
 Fugui Yang
 Xinrui Li
 Qinchuan Li2*
- 1Department of Neurosurgery, Shanghai East Hospital, School of Medicine, Tongji University, Shanghai, China
- 2Department of Thoracic Surgery, Shanghai East Hospital, School of Medicine, Tongji University, Shanghai, China
- 3Department of Neurology, Shanghai East Hospital, School of Medicine, Tongji University, Shanghai, China
Background: Esophageal cancer is one of the most leading and lethal malignancies. Glycolysis and the tumor microenvironment (TME) are responsible for cancer progressions. We aimed to study the relationships between glycolysis, TME, and therapeutic response in esophageal adenocarcinoma (EAC).
Materials and Methods: We used the ESTIMATE algorithm to divide EAC patients into ESTIMATE high and ESTIMATE low groups based on the gene expression data downloaded from TCGA. Weighted gene co-expression network analysis (WGCNA) and Gene Set Enrichment Analysis (GSEA) were performed to identify different glycolytic genes in the TME between the two groups. The prognostic gene signature for overall survival (OS) was established through Cox regression analysis. Impacts of glycolytic genes on immune cells were assessed and validated. Next, we conducted the glycolytic gene mutation analysis and drug therapeutic response analysis between the two groups. Finally, the GEO database was employed to validate the impact of glycolysis on TME in patients with EAC.
Results: A total of 78 EAC patients with gene expression profiles and clinical information were included for analysis. Functional enrichment results showed that the genes between ESTIMATE high and ESTIMATE low groups (N = 39, respectively) were strongly related with glycolytic and ATP/ADP metabolic pathways. Patients in the low-risk group had probabilities to survive longer than those in the high-risk group (p < 0.001). Glycolytic genes had significant impacts on the components of immune cells in TME, especially on the T-cells and dendritic cells. In the high-risk group, the most common mutant genes were TP53 and TTN, and the most frequent mutation type was missense mutation. Glycolysis significantly influenced drug sensitivity, and high tumor mutation burden (TMB) was associated with better immunotherapeutic response. GEO results confirmed that glycolysis had significant impacts on immune cell contents in TME.
Conclusion: We performed a comprehensive study of glycolysis and TME and demonstrated that glycolysis could influence the microenvironment and drug therapeutic response in EAC. Evaluation of the glycolysis pattern could help identify the individualized therapeutic regime.
Introduction
Esophageal cancer is the eighth most common malignancy and the sixth cause of cancer death globally, which accounts for more than 570,000 new cases and 500,000 deaths annually (Bray et al., 2018; Wang et al., 2018). Esophageal adenocarcinoma (EAC) is the predominant pathological type in western countries, with an increasing proportion from 35 to 61% over the past 30 years (Alsop and Sharma, 2016). The global incidence rate of EAC is approximately 0.7/100,000 person-years, and the 5-year survival rate is merely less than 20%, although multidisciplinary treatments have been applied, including esophagectomy, radiation, and chemotherapy (Arnold et al., 2015; Markar et al., 2017; Smyth et al., 2017; Zhao et al., 2019). Considering the chemotherapeutic resistance, several targeted agents have been applied in patients with EAC, such as imatinib (Mayr et al., 2012). Unfortunately, the efficacy is still not satisfactory. Recently, immunotherapy-targeting PD-1 has revolutionized the therapy in cancer patients. However, not all patients with EAC respond to immunotherapy (Däster et al., 2020). Therefore, there is an urgent necessity to better understand the molecular characteristics and genetic features that could help predict accurate survival and identify suitable patients who will benefit from immunotherapy.
The tumorigenesis and development of EAC is a highly complex biology, involving the tumor cell-intrinsic and cell-extrinsic factors (Quante et al., 2018; Talukdar et al., 2018). Genetic alterations are the primary mechanisms that drive the initiation and progression of EAC, not only conferring tumor cells infinite proliferative abilities but also reprogramming metabolic pathways to adapt to the hostile environment, such as aerobic glycolysis (Hochwald and Zhang, 2017; Talukdar et al., 2018). The seminal discovery of tumor glycolysis has been considered a hallmark of cancer, proposed by Otto Warburg in 1923 (Warburg and Minami, 1923). The glycolytic phenotype renders cancer cells selective advantages by unlimited growth and attenuated apoptosis (Xu et al., 2017). In addition, it is gradually evident that elevated glycolysis is closely related to the immune escape by changing the microenvironment and inhibiting the functions of immune cells (Jiang et al., 2019a). Mounting evidence from cell-based assays has linked glycolysis to TME, and preclinical investigations have demonstrated the effectiveness targeting glycolysis in some cancers (Lim et al., 2017; Kornberg et al., 2018; Jiang et al., 2019a; Jiang et al., 2019b; Kang et al., 2020).
Genetic mutation results in the rewire of the glucose metabolism decreased cancer cell apoptosis and immortal growth. Consequently, these events bring about the component reconstruction in the tumor microenvironment (TME), thus changing the purity of the tumor. Reciprocally, the intimate interactions between glycolytic cells and the extracellular matrix further exacerbate the remodeling of TME, including the stromal and immune cells. It is well accepted that the tumor is highly dependent on TME, which is preponderant on prognosis and impacts the therapeutic efficacy profoundly, such as the immune checkpoint therapy (Wu and Dai, 2017; Alsina et al., 2018; Taube et al., 2018; Hinshaw and Shevde, 2019; Li et al., 2020). However, there are few studies exploring the associations between glycolysis and TME in EAC, and far less is known about how genetic mutations orchestrate the glycolysis under these aberrant TME conditions. Herein, we investigated the effects of glycolysis on immune cells and revealed the genetic mutation diversity. Our study unraveled that glycolysis could influence TME under the driver of genetic mutation and could serve as prognostic biomarkers. Moreover, we constructed the risk score system to predict drug sensitivity and immunotherapeutic response. The results hold great promise in targeting glycolysis and utilizing TME to improve the treatment in patients with EAC.
Materials and Methods
Data Acquisition
Gene expression data and clinical information were downloaded from the Cancer Genome Atlas (TCGA) database (https://portal.gdc.cancer.gov/). The mRNA expression profiles were log2 normalized for further analysis. Clinical information included gender, age, stage, survival status, and follow-up time.
Tumor Microenvironment and Glycolysis
TME is composed of resident stromal cells and infiltrating immune cells (IICs), reflecting tumor purity. With the increase of stromal cells and IICs, the tumor purity becomes lower. The stromal score, immune score, and ESTIMATE score were calculated by applying the ESTIMATE algorithm (Chakraborty and Hossain, 2018). The ESTIMATE score is the comprehensive parameter of the stromal and immune scores. Then, patients with EAC were classified into ESTIMATE high and ESTIMATE low groups according to the median of the ESTIMATE score. The differently expressed genes (DEGs) were screened by the weighted gene co-expression network analysis (WGCNA) with the false discovery rate (FDR) ≤0.05 and log2 fold change (log2FC)| >2.
To explore whether glycolysis affects tumor purity, we performed gene set enrichment analysis (GSEA) between the ESTIMATE high and ESTIMATE low groups. Five glycolysis-related gene sets, namely, Hallmark, BioCarta, KEGG, GO, and Reactome, were downloaded from the Molecular Signatures Database (http://www.gsea-msigdb.org/gsea/msigdb) and analyzed using the GSEA software (version 4.1.0). The permutation number was set as 1,000 for every phenotype. The gene sets were considered statistically significant when the nominal (NOM) p-value ≤0.05, FDR ≤0.05, and normalized enrichment score |(NES)| >1. Finally, the intersection genes (IGs) from the WGCNA and GSEA gene sets were identified for further analysis.
Gene Interaction Analysis and Enrichment Analysis
Gene interaction analysis was performed through the “corrplot” package in R software (version 4.1.0). Hub genes were screened with “cytoHubba” in Cytoscape software.
The IGs based on TME and glycolysis were analyzed for Gene Ontology (GO) and Kyoto Encyclopedia of Genes and Genomes (KEGG) by the “clusterProfiler” R package. GO analysis has three functional parts, including the biology process (BP), cellular component (CC), and molecular function (MF).
Next, we performed functional similarity analysis, which was measured through the “GOSemSim” R package (Wang et al., 2007). Functional similarity could be used for the purpose of assessing the intimacy and relationship between each gene and its partners by evaluating the function and location.
Establishment of Prognostic Signatures
First, univariate Cox regression analysis was used to identify IGs which were related to patients’ overall survival (OS). Then, statistically significant IGs (p < 0.05) were enrolled into the multivariate Cox regression. Finally, patients were divided into high- and low-risk groups according to the median of the risk score, in which the risk score was calculated as follows:
TME and Gene Mutation
Next, we selected the prognostic glycolysis-related genes and hub genes to investigate their relations with IICs between the two groups through single-sample gene set enrichment analysis (ssGSEA) using the “GSVA” R package. The effects of OGG on immune cells were assessed using the linear regression.
To analyze why glycolysis affects TME, we calculated the glycolytic gene mutation frequency, variant classification, variant type, and single nucleotide variants (SNVs) between the ESTIMATE high and ESTIMATE low groups. Additionally, to fully understand the role of gene mutation in TME, we performed tumor mutation burden (TMB) analyses and explored their relationships with IICs through the simple nucleotide variation data from TCGA and cBioPortal online databases (http://www.cbioportal.org/).
Drug Sensitivity Analysis and Immunotherapy Response
The drug sensitivity of each patient with EAC was predicted by the Genomics of Drug Sensitivity in Cancer database (GDSC; https://www.cancerrxgene.org/). The half-maximal inhibitory concentration (IC50) was calculated through the “pRRophetic” R package, and the IC50 differences between the high- and low-risk groups were compared (Geeleher et al., 2014).
The response to immunotherapy was estimated using the Tumor Immune Dysfunction and Exclusion website (TIDE; http://tide.dfci.harvard.edu/login/). The TIDE and PDL-1 scores were compared between the high- and low-risk groups.
External Cohort Validation
The impacts of glycolysis on TME in EAC were validated through the Gene Expression Omnibus (GEO) database (https://www.ncbi.nlm.nih.gov/gds/). The study was considered eligible for external cohort validation according to the following criteria: 1) studies with Homo sapiens samples and 2) studies with a sample number more than 50, and 3) studies with detailed experiment information and complete expression profiles. The primary goal of validation was to confirm whether the ESTIMATE algorithm method is suitable for patients with EAC, and the secondary goals were to determine whether glycolysis could influence the components of the microenvironment and affect drug sensitivity. The overall design of this study is shown in Figure 1.
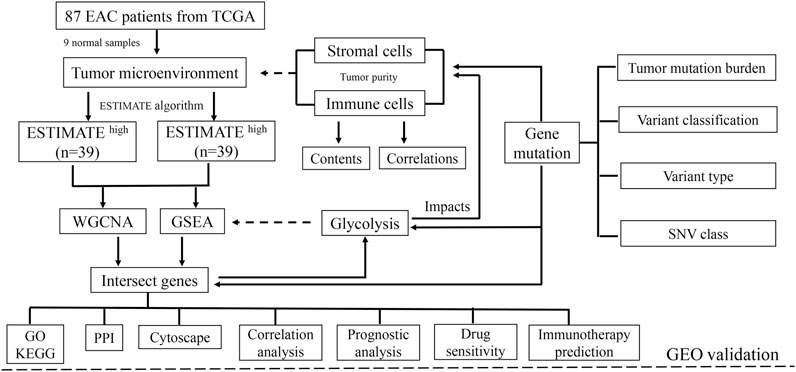
FIGURE 1. Schematic of the study design. A total of 78 EAC patients were recruited for further study. TME is mainly composed of tumor cells, stromal cells, and immune cells. With higher stromal and immune cells, the tumor purity is low.
Statistical Analysis
All statistical analyses were performed by the R software (version 4.1.0). The DEG analysis between the ESTIMATE high and ESTIMATE low groups was carried out by applying the unpaired t-test. Cox regression analysis was used to determine the prognostic factors. Kaplan–Meier (K-M) curves and log-rank tests were utilized to assess the prognostic outcome. The Mann–Whitney U test was used to compare the immune score, immune cell infiltrations, and immune signatures. Spearman’s correlation analysis was used to evaluate the interactions. p < 0.05 was considered significant.
Results
Identification of Tumor Purity and Glycolysis
A total of 87 EAC samples and gene expression data were available from the TCGA database, including 9 normal and 78 EAC cases. Based on the ESTIMATE algorithm, the stromal score ranged from –2,315.387 to 1903.167 and the immune score ranged from –1,224.491 to 3,362.338. The range of the comprehensive ESTIMATE score was from –3,375.446 to 5,265.505 (Supplementary Table S1). According to the median of the ESTIMATE score, 78 patients with EAC were categorized into the ESTIMATE high and ESTIMATE low groups (39 cases, respectively). There are 8,135 DEGs between two groups according to WGCNA results (Figures 2A–C) (Supplementary Table S2).
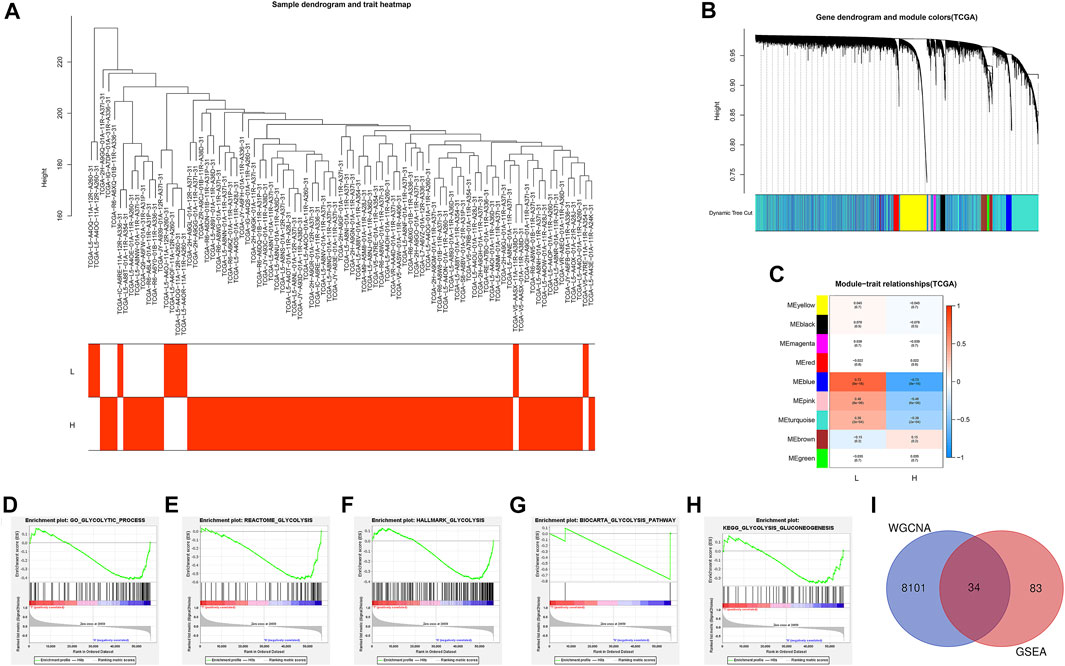
FIGURE 2. Identification of the intersection genes. (A) 78 EAC sample clustering. All samples were clustered, and difference analysis was performed. (B) Gene dendrogram and dynamic tree cuts. Each color represents a module, and genes with similar expression patterns will be classified into the same module. (C) Module-trait relationships. Every row represents a module eigengene (ME). The red module corresponds to the significant positive correlation, and blue corresponds to the significant negative correlation. (D) GO glycolytic process gene set. (E) Reactome glycolysis gene set. (F) Hallmark glycolysis gene set. (G) Biocarta glycolysis pathway. (H) KEGG glycolysis gluconeogenesis. (I) Venn diagram shows the 34 IGs (intersection genes from WGCNA and GSEA). L: ESTIMATE low; H: ESTIMATE high.
Then, GSEA was conducted to assess the glycolytic differences between the ESTIMATE high and ESTIMATE low groups. The results showed that the GO glycolytic process (NES = −1.54, NOM p = 0.050, FDR = 0.050) and Reactome glycolysis (NES = −1.83, NOM p = 0.008, FDR = 0.008) were significantly enriched in ESTIMATE high group patients (Figures 2D,E). There were no significant enrichments in the Hallmark (NES = −1.44, NOM p = 0.067, FDR = 0.067), BioCarta (NES = −1.23, NOM p = 0.227, FDR = 0.227), and KEGG (NES = −1.20, NOM p = 0.228, FDR = 0.228) pathways (Figures 2F–H). There were 117 DEGs between GO and Reactome glycolysis gene sets. After screening, a total of 34 IGs were selected from WGCNA and GSEA for further analysis (Table 1) (Figure 2I). The details about IGs in each EAC sample are shown in Supplementary Table S3.
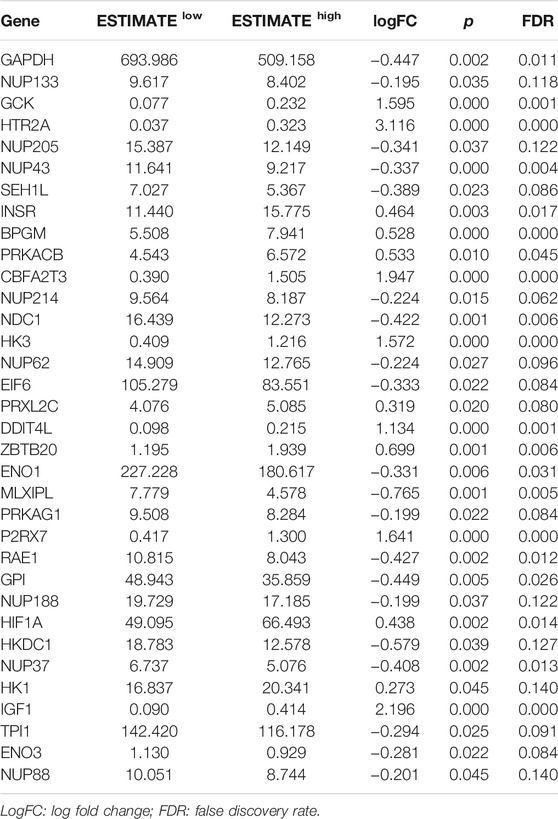
TABLE 1. Significant IG expression levels in the ESTIMATE low and ESTIMATE high tissues.
Gene Interaction Networks and Functional Enrichment Analysis
To explore the correlation between the IGs, we calculated their coefficients. Gene interaction analysis showed that GAPDH and TPI1 had the strongest positive correlation (coef = 0.81), whereas PRKACB and RAE1 had the strongest negative correlation (coef = −0.48) (Figure 3A). To explore the IG functions, we performed GO and KEGG enrichment analyses using R packages. GO results showed that IGs were significantly enriched in the glycolytic and ATP/ADP metabolic pathways. In addition, nuclear-, glucose-, and carbohydrate-related activities were closely associated with CC and MF terms (Figure 3B). KEGG results demonstrated that carbon, gluconeogenesis, and HIF−1 signaling pathways were enriched (Figure 3C).
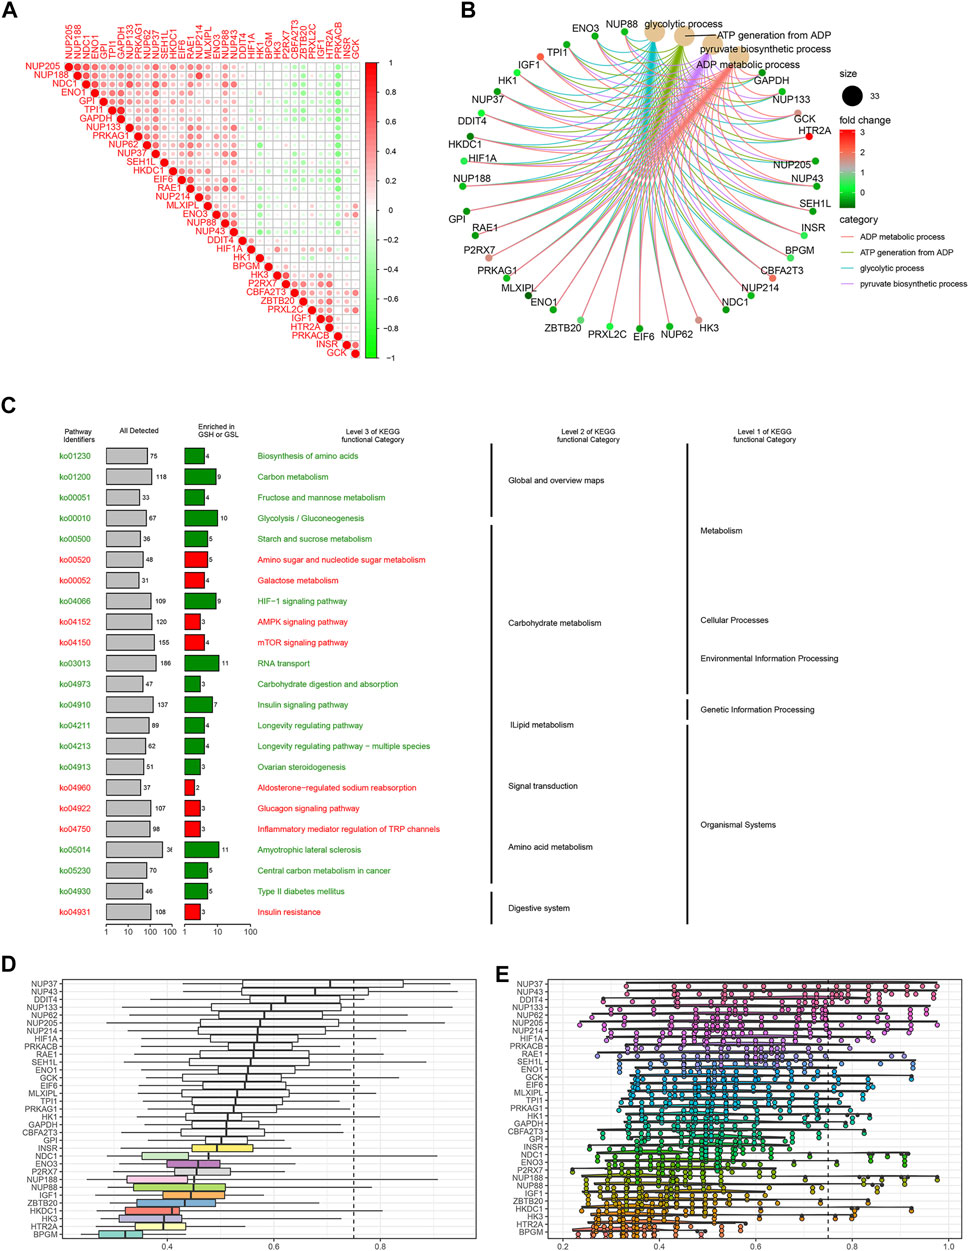
FIGURE 3. Gene interaction analysis and functional enrichment. (A) Gene interaction network. Red represents positive correlation, while negative correlation is represented in green. (B) GO enrichment analysis, including the biological process (BP), cellular component (CC), and molecular function (MF). Every term shows top 10 pathways. (C) Kyoto Encyclopedia of Genes and Genomes (KEGG) pathways enriched in the IGs. IG network analysis. (D) Summary of OGG similarities. The boxes indicated the middle 50% of the similarities, and the upper and lower boundaries show the 75th and 25th percentiles, respectively. (E) Raincloud plots of OGG. Data are expressed as the mean and standard error. Each dot represents the single gene. The dashed line represents the cutoff value (0.75).
Based on the GO analysis and semantic similarities, we ranked the genes by average functional similarities between IGs and their partners, with the cutoff value at 0.75. The box plots and raincloud plots are demonstrated in Figures 3D,E. From the pictures, we can clearly see that NUP43, NUP37, and DDIT4 had strong similarities and weak correlation with BPGM.
Prognostic IG Signatures
Univariate Cox regression analysis revealed that NUP88, RAE1, SEH1L, NUP37, and NUP43 were significantly associated with patients’ OS (all p < 0.05) (Figure 4A). After multivariate Cox regression analysis, three IGs (NUP88, SEH1L, and NUP37) were used to develop the risk score based on the following formula: risk score = 0.637 * expression of NUP88 + 0.494 * expression of SEH1L + 0.657 * expression of NUP37. Also, the three genes were all risk genes with hazard ratio (HR) > 1. A total of 78 patients with EAC were classified into low- and high-risk groups according to the median risk score (n = 39). The K-M survival plot showed that patients in the low-risk group had significant probabilities to survive longer than those in the high-risk group (median time = 1.75 vs 0.745 years, p < 0.001) (Figure 4B).
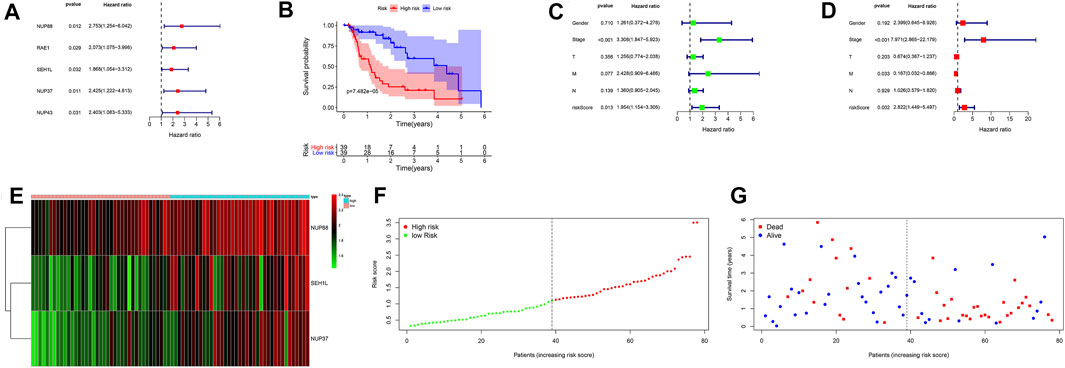
FIGURE 4. Prognostic signatures of OS in EAC patients. (A) Forest plot of univariate Cox regression analysis based on IGs. (B) K-M survival plot of high- and low-risk score patients. (C) Forest plot of univariate Cox regression analysis based on the clinical information and risk score. (D) Forest plot of multivariate Cox regression analysis based on the clinical information and risk score. (E) Heatmap of NUP88, NUP37, and SEH1L in EAC patients. Green represents low gene expression, and red represents high expression. (F) Risk score curve of high- and low-risk score patients. The dotted line represents every individual, and patients are categorized into low-risk and high-risk groups at the inflection point. (G) Survival status and time distributed by the risk score. The red dot represents the dead, and blue represents the living. With an increase in time, more and more patients died. T: tumor; M: metastasis; N: lymph node.
In order to evaluate the prognostic values of clinical information in OS, we integrated the patients’ clinical features with IGs. Univariate Cox regression analysis showed that the tumor stage (HR = 3.308, p < 0.001) and risk score (HR = 1.954, p = 0.013) were significantly associated with OS (Figure 4C). Multivariate Cox regression analysis results demonstrated that tumor stage (HR = 7.971, p < 0.001), metastasis (HR = 0.167, p = 0.033), and risk score (HR = 2.822, p = 0.002) were independent risk factors for OS (Figure 4D). In addition, the distributions of each patient and their survival statuses are shown in Figures 4E–G. We can clearly see that patients in the low-risk group had a better prognosis than those in the high-risk group.
Effect of Glycolytic Genes on IICs
We selected three prognostic genes and five hub genes (NUP88, SEH1L, NUP37, GCK, NUP62, NUP155, NUP205, and NUP214) to assess whether glycolysis affects the IICs in TME. The results demonstrated that NUP62, NUP155, NUP205, and SEH1L had significant impacts on the IIC expression level, especially on the T-cells and mast cells (all p < 0.05). The details are shown in Figure 5A.
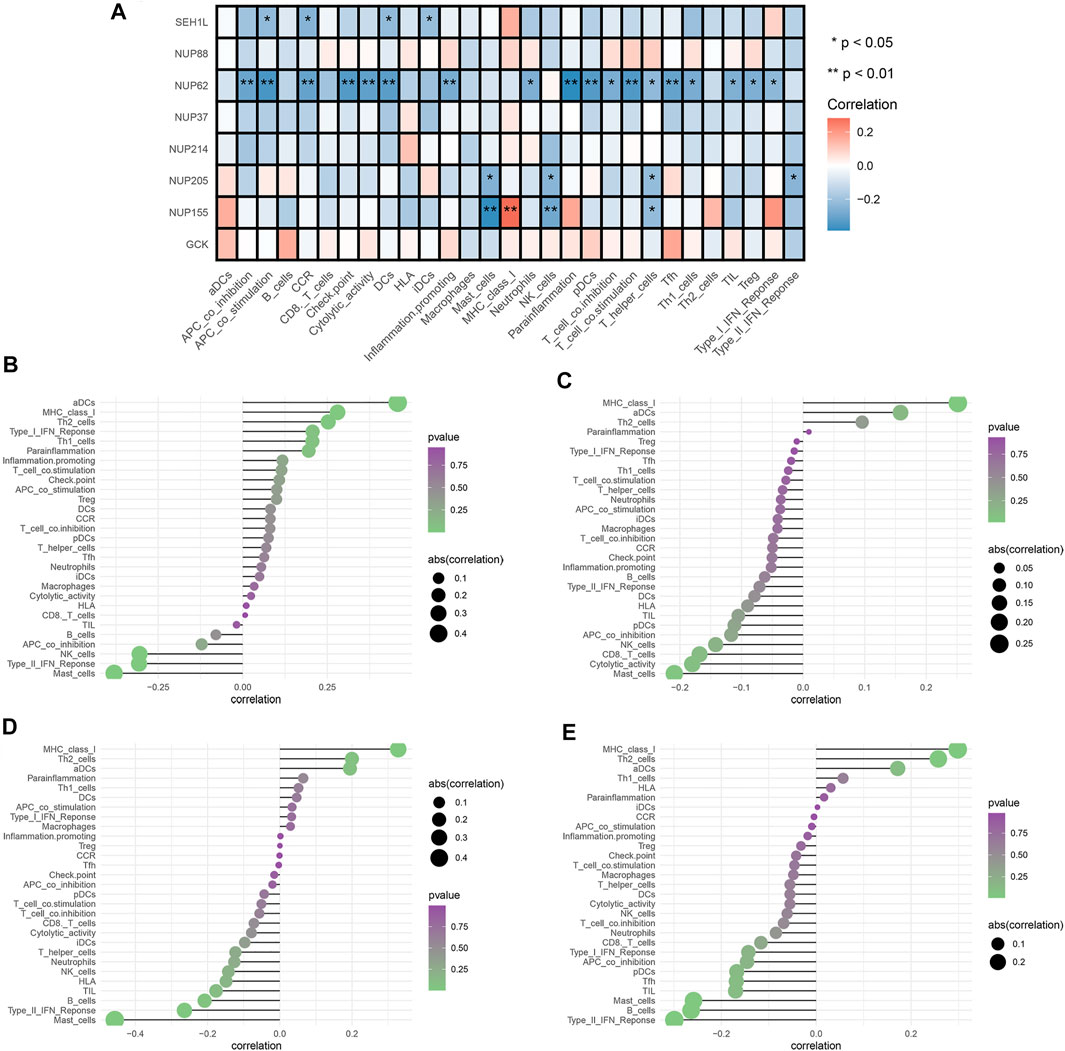
FIGURE 5. Analysis of glycolytic gene effects on immune signatures. (A) Heatmap demonstrating the correlation between 8 genes and the ssGSEA scores of 29 immune signatures. (B) NUP62 and immune signatures. (C) NUP155 and immune signatures. (D) NUP205 and immune signatures. (E) SEH1L and immune signatures. Spearman’s correlation analysis was used to evaluate the relations with p < 0.05.
To fully explore the relationships between these genes and IICs, we performed Spearman correlation analysis by using the “Limma” package. The results showed that NUP62 was strongly associated with T-cells, dendritic cells, and antigen-presenting cells (all p < 0.05) (Figure 5B). NUP155 had a close relationship with T-cells, mast cells, and MHC class I activity (all p < 0.05) (Figure 5C). NUP205 showed close relationships with T-cells, mast cells, and type I IFN response (all p < 0.05) (Figure 5D). SEH1L exhibited significant associations with dendritic cells, antigen-presenting cells, and chemokine receptors (CCR) (all p < 0.05) (Figure 5E). Collectively, these findings suggested that the IGs had profound effects on immune cells and immunological functions.
Genetic Mutation and the Tumor Microenvironment
Gene mutations were analyzed for further investigation into the mechanisms that TME is affected by gene alteration. The genetic mutations are significantly different between the ESTIMATE high and ESTIMATE low groups. In the ESTIMATE high group, the five most common mutant genes were TP53, TTN, HMCN1, DNAH5, and SYNE1, and the most common mutational type was missense mutation (Figures 6A,C). In the ESTIMATE low group, the most common mutant genes were TP53, TTN, MUC16, SYNE1, and PCLO. The most common mutational type was also missense mutation (Figures 6B,F). The frequencies of missense mutation were significantly lower than that in the ESTIMATE high group, indicating that the glycolytic level and tumor purity were different from those of the ESTIMATE high group (Figures 6A,B). Single-nucleotide polymorphism (SNP) had the highest frequency in the variant type (Figures 6D,G). G > A was the most frequent type in the SNV class (Figures 6E,H). The results imply that these mutant genes drive a higher glycolytic level, consequently changing the tumor purity in the microenvironment.
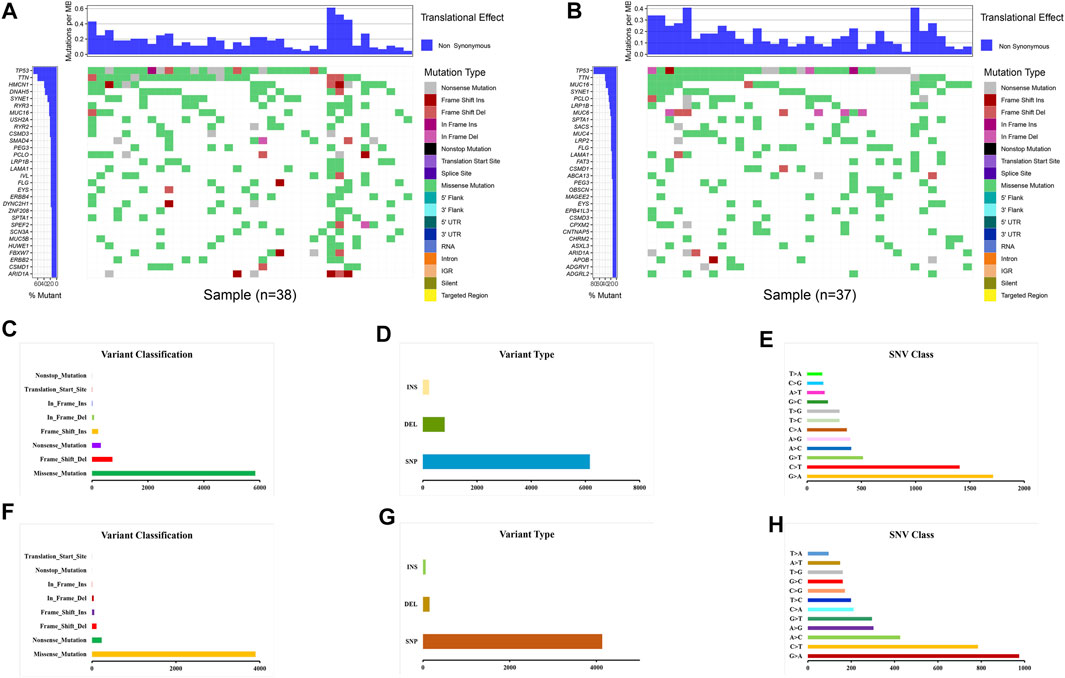
FIGURE 6. Landscape of gene mutations in EAC patients. (A) Waterfall plot of mutational genes in the ESTIMATE high group. (B) Waterfall plot of mutational genes in the ESTIMATE low group. The left panel shows the gene mutational frequencies, and the right panel represents the mutational type. (C) Variant classification and frequency of gene mutations in the ESTIMATE high group. (D) Variant type in the ESTIMATE high group. (E) Frequency of SNV classes in the ESTIMATE high group. (F) Variant classification and frequency of gene mutations in the ESTIMATE low group. (G) Variant type in the ESTIMATE low group. (H) Frequency of SNV classes in the ESTIMATE low group.
To broaden the understanding of the glycolytic gene mutations, the cBioPortal database was applied to validate these findings. We selected the most common glycolytic genes (TP53, TTN, HMCN1, DNAH5, SYNE1, MUC16, and PCLO) for further verification. Consistent with the above findings, the results from the cBioPortal database showed that TP53, TTN, and MUC16 possessed the highest mutation frequencies (87, 42, and 26%, respectively), and missense mutation was the commonest type (Figure 7).
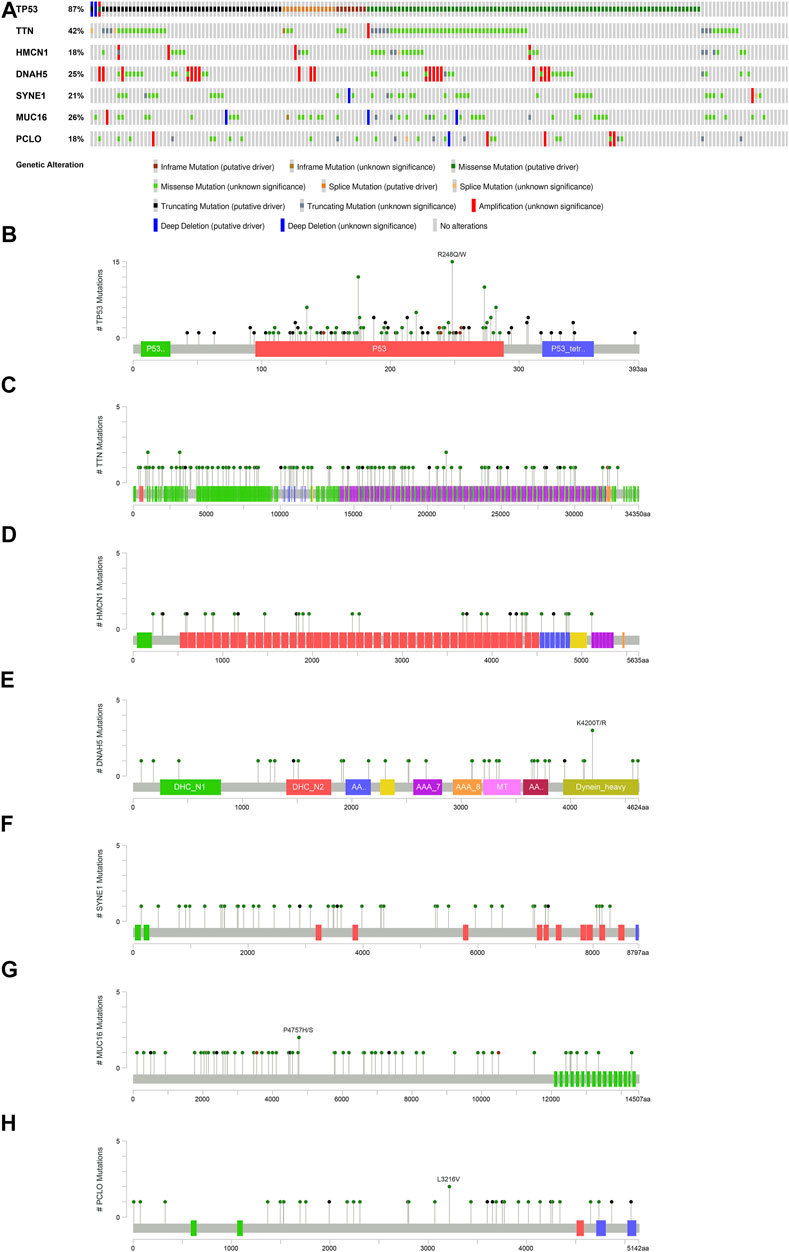
FIGURE 7. Overview of the seven most common mutant genes in EAC patients. (A) Proportion and mutation type of genes. Different color bars represent different mutational types. (B) TP53-specific mutation site. (C) TTN-specific mutation site. (D) HMCN1-specific mutation site. (E) DNAH5-specific mutation site. (F) SYNE1-specific mutation site. (G) MUC16-specific mutation site. (H) PCLO-specific mutation site.
Tumor Mutation Burden Analysis and Immunotherapy Response
TMB refers to the total number of mutations per mega base in tumor tissues. By analyzing the SNP data downloaded from TCGA, we calculated the TMB frequency in each patient with EAC. The range of TMB is from 0.053 to 41.053 in EAC. Moreover, we further analyzed the effect of TMB on survival in patients with EAC. A total of 78 patients were classified into high- and low-TMB groups according to the median TMB. As shown in the K-M curves, patients in the high-TMB group had significantly higher mortality than those in the low-TMB group (p = 0.05) (Figure 8A). To exhibit the relationships between TMB, glycolysis, and TME (ESTIMATE score), we applied the Sankey diagram to visualize their correlations with the “ggalluvial” package in R. The result is shown in Figure 8B.
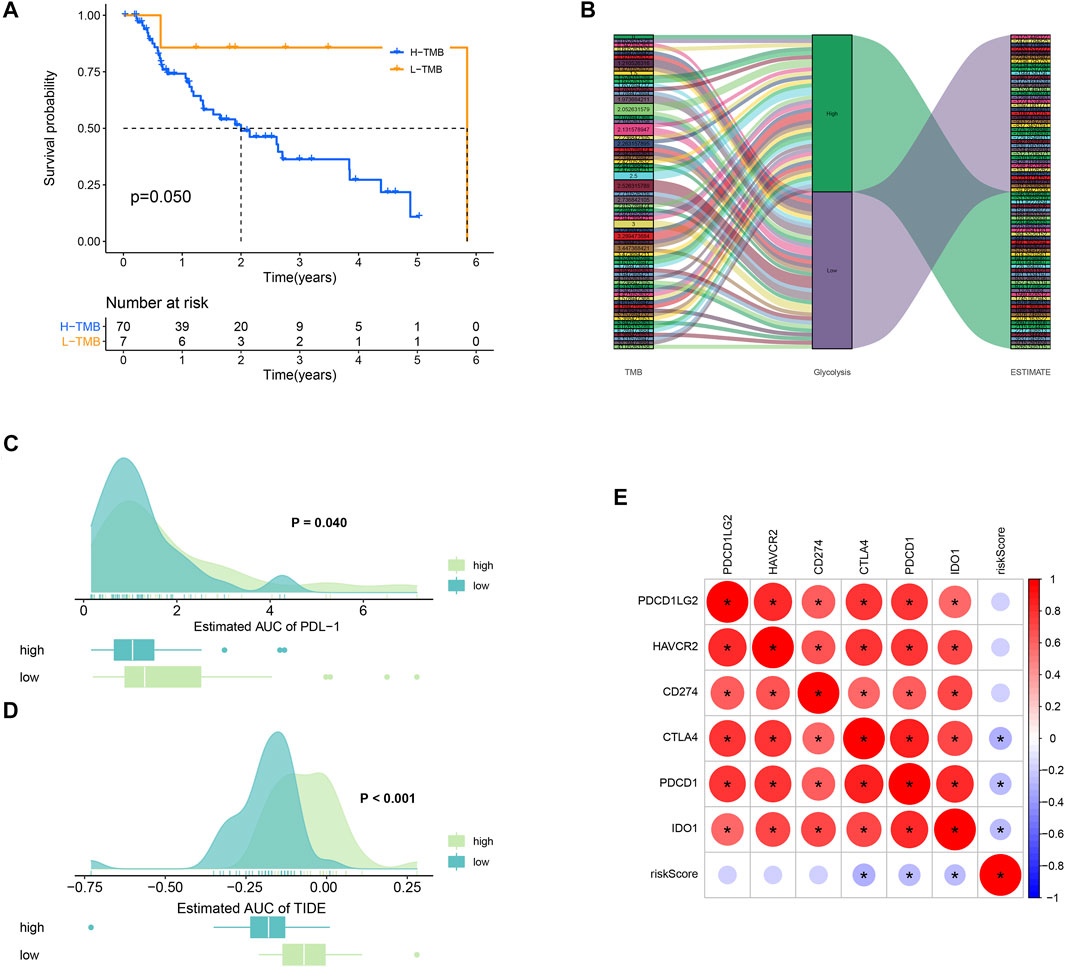
FIGURE 8. TMB and immunotherapy response. (A) K-M survival plot. Patients with low TMB have significant probabilities to survive longer than those with high TMB. (B) Sankey diagram showing the relations between TMB, glycolysis, and the ESTIMATE score. (C) PD-L1 score comparison between high- and low-TMB groups. (D) TIDE algorithm analysis showed that patients with high TMB had better immunotherapeutic response than those with low TMB. (E) Correlations plots between the immune checkpoints.
Low TMB usually implies poor response for immunotherapy (Chan et al., 2019). To explore whether TMB will influence the immunotherapy response, we compared the PDL-1 and TIDE scores between high- and low-TMB groups. As a result, patients in the high-TMB group significantly responded to anti–PDL-1 therapy (p = 0.040) (Figure 8C). In Figure 8D, patients with high TMB had a higher TIDE score than those with low TMB (p = 0.000). In addition, the correlations between the immune checkpoints are also explored in Figure 8E.
Drug Sensitivity Analysis
We compared the IC50 differences of chemotherapeutic and targeted drugs between high- and low-risk score groups, including bexarotene (Figure 9A), camptothecin (Figure 9B), gemcitabine (Figure 9C), imatinib (Figure 9D), methotrexate (Figure 9E), and vorinostat (Figure 9F). The results demonstrated that there were higher IC50 levels of bexarotene and imatinib in the high-risk score group, which indicated that patients with a low-risk score were more sensitive to the two drugs. Oppositely, the IC50 levels of camptothecin, gemcitabine, methotrexate, and vorinostat were higher in the low-risk score group, implying that patients in the high-risk score group were more sensitive to the four drugs.
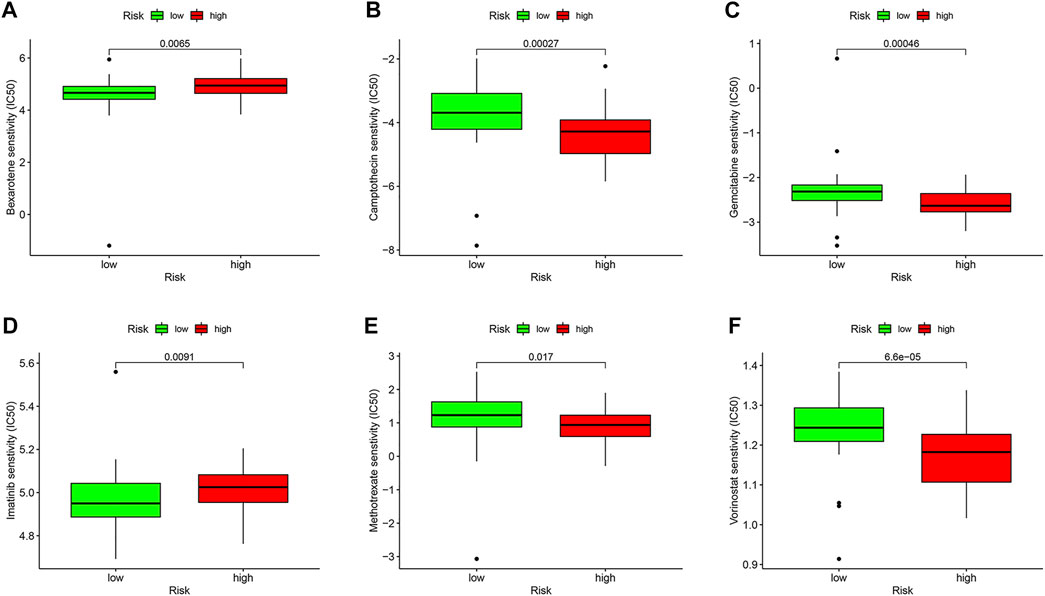
FIGURE 9. Drug sensitivity analysis in the TCGA database. Box plots demonstrate the estimated IC50 values of bexarotene (A), camptothecin (B), gemcitabine (C), imatinib (D), methotrexate (E), and vorinostat (F). The lower the IC50 value, the higher is the sensitivity to the drug.
Validation of Glycolysis and Its Impact on TME
For external cohort validation, GSE12898 was employed, which consisted of 75 EAC samples. Consistent with the classification result of the ESTIMATE algorithm in TCGA, this method successfully divided 75 patients with EAC into the ESTIMATE high and ESTIMATE low groups (n = 38 and 37, respectively). There were 3,428 genes between the two groups, including 52 significantly different glycolysis-related genes (Supplementary Table S4). The correlation analysis showed that 28 glycolytic genes had significant impacts on immune cells in the microenvironment, and the majority were B-cell and T-cell subtypes. The details are shown in Table 2.
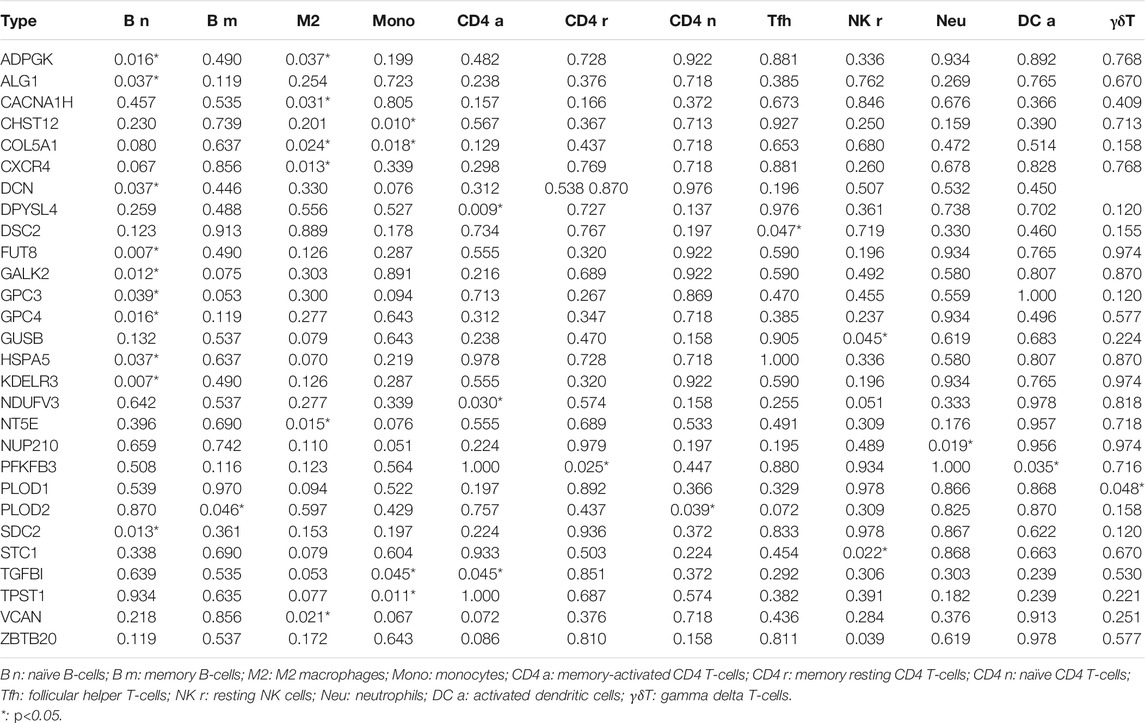
TABLE 2. Impacts of glycolytic genes on immune cells in TME.
Furthermore, the drug sensitivities were also analyzed between the ESTIMATE high and ESTIMATE low groups. The results showed that the IC50 level of bexarotene (Figure 10A) was higher in the ESTIMATE high group. However, the IC50 levels of camptothecin (Figure 10B), gemcitabine (Figure 10C), and vorinostat (Figure 10F) were lower in the ESTIMATE high group, implying that the patients in the ESTIMATE high group were more sensitive to the four drugs. There were no significant differences regarding IC50 in imatinib (Figure 10D) and methotrexate (Figure 10E). Taken together, glycolysis directly changed TME and indirectly influenced drug sensitivity.
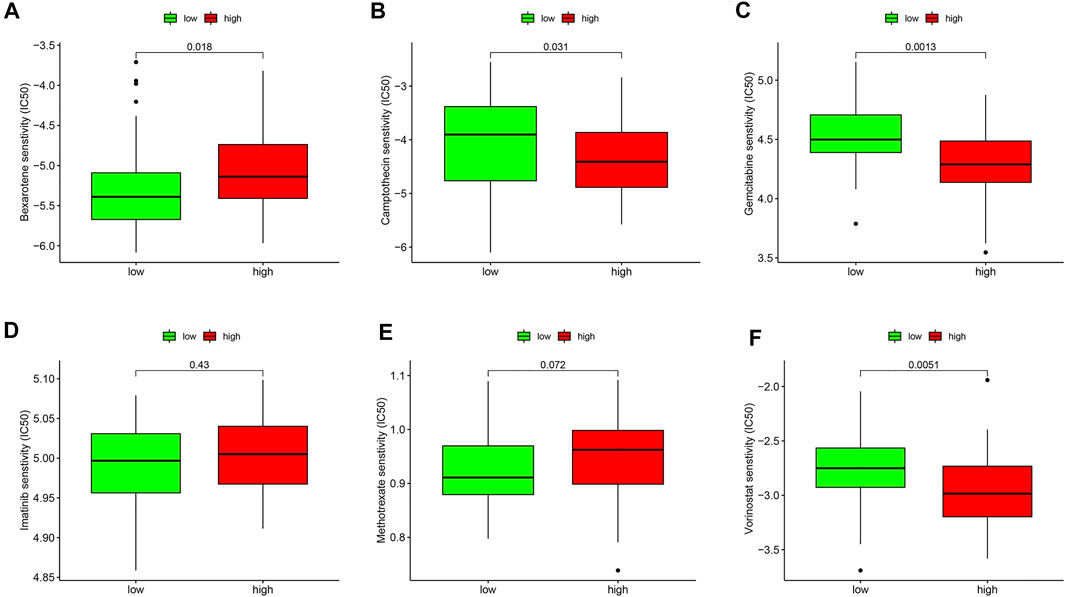
FIGURE 10. Validation of drug sensitivity analysis in the GEO database. Box plots demonstrate the estimated IC50 values of bexarotene (A), camptothecin (B), gemcitabine (C), imatinib (D), methotrexate (E), and vorinostat (F). The lower the IC50 value, the higher is the sensitivity to the drug.
Discussion
The abilities of cancer cells to switch metabolisms and evade the immunity system in TME are well-documented characteristics in tumors. Elevated glycolysis is commonly observed in cancer progression and is associated with significant disruptions of a previous finely tuned microenvironment (Chang et al., 2015; Jiang et al., 2019a). As the tumors develop, they constantly interact with neighboring cells, such as stromal cells and immune cells, under the driver of genetic mutations, thus altering their phenotypes and functions (Butturini et al., 2019). In the context of these intricate crosstalks between malignant cells and non-malignant cells, the impacts of increased glycolysis and a dysregulated TME on immune response and effective therapy are of vital importance (Roma-Rodrigues et al., 2019). Although the research studies focusing on the tumor glycolysis and TME have exploded exponentially in recent years, the underlying mechanisms of how they act both independently and synergistically still remain elusive. In this study, we explored systematically the links between glycolysis and TME in patients with EAC as well as the relations with genetic mutations. In the present study, we found that the glycolytic level was higher in the ESTIMATE high group, reasonably reflecting the fact that glycolysis may change the tumor purity. By constructing the predictive survival model based on IG signatures, we discovered that three genes (NUP88, SEH1L, and NUP37) may serve as independent prognostic biomarkers for OS in EAC. In addition, we revealed that gene mutation types and frequencies were distinct between the different ESTIMATE score groups, lending us a hypothesis that genetic alteration may drive TME changes. In addition, our data suggested that glycolysis could influence drug sensitivity and immunotherapeutic response.
Several studies have confirmed the close relationships between glycolysis and EAC (Lynam-Lennon et al., 2014; Harada et al., 2020; Kang et al., 2020). Consistent with these findings, our functional enrichment analysis results showed that IGs were strongly enriched in the glycolytic processes, ATP generation, the HIF−1 signal pathway, RNA activities, and so on. The presence of aerobic glycolysis under normal conditions efficiently promotes tumor cell growth by the following mechanisms: 1) the rate of glycolysis is accelerated at 100 times compared to oxidative phosphorylation to compensate for the mathematical disadvantage in terms of net ATP production (glucose oxidative phosphorylation although mitochondria generate 18 times ATP compared to glycolysis) (Pfeiffer et al., 2001); 2) glycolysis provides sufficient and essential intermediates, such as NADPH and ribose-5-phosphate, which are indispensable for biosynthesis to meet avid proliferative requirements (Boroughs and DeBerardinis, 2015); 3) lactate, the obligatory product derived from glycolysis, could activate the HIF−1 signal pathway to induce vascular endothelial growth factor (VEGF) expression to stimulate angiogenesis in the microenvironment (Sonveaux et al., 2012). In addition, lactate is crucial to reorganize the tumor physical architectures in TME, and the accumulation of extracellular lactate is detrimental for normal healthy cells, such as immune cells (Romero-Garcia et al., 2016; Cassim and Pouyssegur, 2019). The study about how RNA interacts precisely with glycolysis is still in its infancy. However, Hua Q et al. gave us a hint that long non-coding RNA may promote glycolysis by sponging miRNA (Hua et al., 2019). Hence, it is reasonable to speculate that certain mutational genes regulated and modified by RNA may be involved in the glycolysis in EAC (Hochwald and Zhang, 2017).
The prognostic signature of glycolysis in EAC was established based on three genes (NUP88, SEH1L, and NUP37). NUP88, located at chromosome 17p13, encodes Nup88 protein (Zhao et al., 2012). Nup88 is a nucleoporin comprising nuclear pore complexes (NPCs) and plays critical roles in maintaining the spindle stability and preventing aneuploidy formation during mitosis (Hashizume et al., 2010). Unanimously, the GO results in our study also illustrated that glycolytic genes had intimacy with the nuclear pore, emphasizing the importance of nuclear proteins in glycolysis. The Nup88 overexpression is highly associated with tumor development and decreased survival, suggesting that NUP88 acts as an oncogene (Martínez et al., 1999; Naylor et al., 2016). In line with these studies, our results also proved that NUP88 was a risk factor for OS (HR > 1). Another prognostic gene is NUP37, which shares similarities with NUP88 and is also a member of NPC. It exerts primary functions of sustaining NPC integrity and modulates the cell cycle (Chen et al., 2019). Previous studies showed that the elevated expression of NUP37 is associated with worsened survival rates in liver cancer (Uhlen et al., 2017). In addition, a latest study by Huang L et al. demonstrates that NUP37 silencing induces inhibition of lung cancer cell proliferation (Huang et al., 2020). These findings were in agreement with our results, pointing out that NUP37 played an oncogenic role in OS (HR > 1). Nonetheless, the function of NUP37 in EAC has never been explored and needs further experiments to confirm in vitro and in vivo. SEH1L, also known as Seh1, is a part of NPC as well. However, the field is still in its infancy, and only a handful of animal models have been developed to investigate the role of SEH1L. Studies have shown that Seh1 could promote oligodendrocyte differentiation (Liu et al., 2019; Raices and D’Angelo, 2019). However, little is known about how it works in EAC. Undeniably, more research studies are warranted to understand the specific effects of SEH1L on EAC.
The notion that glycolysis has profound impacts on immune cells in TME is well recognized. The investigation linking metabolic demands and immune cells was first documented in neutrophils and macrophages (Alonso and Nungester, 1956; Newsholme et al., 1986). Immune cells hold a resemblance with tumor cells to engage glycolysis, which require rapid energy sources to produce immune-mediators for migration and phagocytosis. Our study demonstrated that NUP88 had significant correlation with B-cells and mast cells (all p < 0.05) and NUP37 had positive correlation with T-cells and negative correlation with dendritic cells (DCs) and macrophages (all p < 0.05). These findings enforced the concept that glycolysis contributes to dramatic alterations of immune cells in TME, hence influencing the immune response and immune-based treatments. Glycolytic tumor cells compete with T-cells for glucose and impair T-cell activation (Peng et al., 2016). In addition, IFN-γ secreted by Th1 cells is sensitive and is unstable to lactate. Noteworthily, this could polarize the T-cells toward differentiating into the Th2 subpopulation that favors tumor progression by inhibiting the antitumor effect of M1 macrophages (Kareva and Hahnfeldt, 2013). Paradoxically, direct evidence from in vivo experiments supports that glycolysis could promote Th1 cell differentiation through an epigenetic mechanism (Peng et al., 2016). This calls for further studies aiming to shed light on the characteristics of glycolysis on T-cells. The divergent effects of glycolysis on DC are also observed. Glycolysis produces excessive lactate and lowers the pH in TME. Lactate together with decreased pH suppresses DC differentiation and consequently abolishes the antigen-presenting functions to T-cells (Harmon et al., 2020). However, inhibition of glycolysis also blocks DC maturation through HIF−1α. This highlights the multiple roles of DC in glycolysis and needs to be carefully interpreted in a context-dependent manner.
Gene mutations facilitate tumor cell metabolic plasticity to create favorable microenvironments beneficial to uncontrolled proliferation. Deepening our knowledge about the differences of gene alterations between different TMEs may allow for the development of therapeutic strategies. Spurred by this promising target, we explored upon this issue and showed that ESTIMATE high and ESTIMATE low groups manifested different gene mutation profiles, in which TP53 and TTN were the most prevalent mutant genes. Moreover, the most common type is missense mutation. Mutant TP53 endows tumor cells with adaptabilities to cope with the harsh microenvironment by providing adequate nutrients, thereby escaping from antitumor immune attack. Experimental mice models in the study by Basu S et al. testified that mutant TP53 could rewire the tumor glycolytic metabolism and enhance metastasis in TME (Basu et al., 2018). Mutant TP53 has additional impacts on TME beyond changing tumor metabolic phenotypes. Myriad studies have indicated that mutant TP53 can remodel TME by several mechanisms. First, mutant TP53 could induce neo-angiogenesis by stimulating VEGF secretion (Kieser et al., 1994). Second, mutant TP53 could regulate chemokines that are involved in the homeostatic microenvironment (Yeudall et al., 2012). Last but not the least, mutant TP53 could reprogram the infiltrating immune cells and reshape the microenvironment (Cooks et al., 2018). TTN is located on chromosome 2q31, consisting of 364 exons, and it is the longest described coding gene (Chauveau et al., 2014). TTN ranks the third most abundant protein in both cardiac and skeletal muscle tissues, followed by actin and myosin (Chauveau et al., 2014). However, its mutation is not a rare entity in various cancers. Consistent with prior investigation by Cheng X et al., we also found that TTN missense mutation was a rather frequent type (Cheng et al., 2019). In addition, TTN and TP53 co-mutation is often accompanied during tumorigenesis and may serve as a prognostic biomarker either alone or in combination [61-63].
Current guidelines recommend adjuvant chemotherapy for patients at an advanced stage. However, how to select suitable patients who will benefit more from the chemotherapeutic regime is the prior concern. Our data demonstrated that patients with a high-risk score were more sensitive to camptothecin, gemcitabine, methotrexate, and vorinostat, suggesting that targeting glycolysis may alleviate the chemotherapeutic resistance. Despite immunotherapy bringing about a breakthrough for cancer patients, only a minority of patients could reap survival benefits actually. The TMB analysis in our study will accurately and effectively identify which patients will respond to immunotherapy in patients with EAC. Collectively, the proposed risk score system in our study has potency to help clinicians devise an individualized treatment strategy.
The strength of the present study is such that we performed a systematic analysis about glycolysis and TME in EAC for the first time based on the National Public Database, which provides robust data and statistical support. This study draws a close link between tumor glycolysis and the microenvironment and tentatively explains the mechanisms from the viewpoint of genetic alteration. Meanwhile, there are several limitations. First of all, TME is a complex mixture of parenchymal cells, the extracellular matrix, and numerous cytokines except for tumor and immune cells. These are not available from the public database and may greatly affect the analysis. Second, the results are not validated in in vitro and in vivo experiments. Last, the methods proposed in this study may not be applicable to all tumors as a result of heterogeneity. Notwithstanding its limitations, our study does provide an overview of glycolysis and TME in EAC, and this lays the foundation for further basic research in the area of metabolism and the microenvironment.
In summary, we found that glycolysis could change the microenvironment under the driver of genetic mutation and influence the immunotherapy in EAC. New efforts target that EAC should incorporate the idea that the glycolytic metabolism could reshape TME. Further studies are necessary to confirm our conclusion.
Data Availability Statement
The original contributions presented in the study are included in the article/Supplementary Material; further inquiries can be directed to the corresponding authors.
Author Contributions
LZ contributed to conception, design, and data acquisition of the study. FY contributed to interpretation and data analysis. XL contributed to data collection and interpreted the results. QL conceived and designed the study protocol. CZ reviewed and approved the final version of the manuscript. All authors contributed to the article and approved the submitted version.
Funding
This study was supported by the National Natural Science Foundation of China (NSFC, No. 81773266) and the Key Discipline Group Construction Project of Pudong Health Bureau of Shanghai, China (No. PWZxq 2017-13) to QL.
Conflict of Interest
The authors declare that the research was conducted in the absence of any commercial or financial relationships that could be construed as a potential conflict of interest.
Publisher’s Note
All claims expressed in this article are solely those of the authors and do not necessarily represent those of their affiliated organizations or those of the publisher, the editors, and the reviewers. Any product that may be evaluated in this article or claim that may be made by its manufacturer is not guaranteed or endorsed by the publisher.
Acknowledgments
We would like to thank all the authors listed for their contribution to the present study.
Supplementary Material
The Supplementary Material for this article can be found online at https://www.frontiersin.org/articles/10.3389/fgene.2021.743133/full#supplementary-material
Abbreviations
EAC, esophageal adenocarcinoma; TME, tumor microenvironment; TCGA, the cancer genome atlas; IICs, infiltrating immune cells; DEGs, differently expressed genes; FDR, false discovery rate; log2FC, log2 fold change; GSEA, gene set enrichment analysis; NOM, nominal; NES: normalized enrichment score; IGs, intersection genes; GO: gene ontology; KEGG, Kyoto encyclopedia of genes and genomes; BP, biological process; CC, cellular component; MF, molecular function; OS, overall survival; SNV, single nucleotide variant; TMB, tumor mutation burden; K-M, Kaplan–Meier; GDSC, genomics of drug sensitivity in cancer; TIDE, tumor immune dysfunction and exclusion; GEO, gene expression omnibus; VEGF, vascular endothelial growth factor; NPCs, nuclear pore complexes; HR, hazard ratio; SNP, single-nucleotide polymorphism; NPCs, nuclear pore complexes.
References
Alonso, D., and Nungester, W. J. (1956). Comparative Study of Host Resistance of Guinea Pigs and Rats V. The Effect of Pneumococcal Products on Glycolysis and Oxygen Uptake by Polymorphonuclear Leucocytes. J. Infect. Dis. 99 (2), 174–181. doi:10.1093/infdis/99.2.174
Alsina, M., Moehler, M., and Lorenzen, S. (2018). Immunotherapy of Esophageal Cancer: Current Status, Many Trials and Innovative Strategies. Oncol. Res. Treat. 41 (5), 266–271. doi:10.1159/000488120
Alsop, B. R., and Sharma, P. (2016). Esophageal Cancer. Gastroenterol. Clin. North America 45 (3), 399–412. doi:10.1016/j.gtc.2016.04.001
Arnold, M., Soerjomataram, I., Ferlay, J., and Forman, D. (2015). Global Incidence of Oesophageal Cancer by Histological Subtype in 2012. Gut 64 (3), 381–387. doi:10.1136/gutjnl-2014-308124
Basu, S., Gnanapradeepan, K., Barnoud, T., Kung, C.-P., Tavecchio, M., Scott, J., et al. (2018). Mutant P53 Controls Tumor Metabolism and Metastasis by Regulating PGC-1α. Genes Dev. 32 (3-4), 230–243. doi:10.1101/gad.309062.117
Boroughs, L. K., and DeBerardinis, R. J. (2015). Metabolic Pathways Promoting Cancer Cell Survival and Growth. Nat. Cell Biol 17 (4), 351–359. doi:10.1038/ncb3124
Bray, F., Ferlay, J., Soerjomataram, I., Siegel, R. L., Torre, L. A., and Jemal, A. (2018). Global Cancer Statistics 2018: GLOBOCAN Estimates of Incidence and Mortality Worldwide for 36 Cancers in 185 Countries. CA: A Cancer J. Clinicians 68 (6), 394–424. doi:10.3322/caac.21492
Butturini, E., Carcereri de Prati, A., Boriero, D., and Mariotto, S. (2019). Tumor Dormancy and Interplay with Hypoxic Tumor Microenvironment. Ijms 20 (17), 4305. doi:10.3390/ijms20174305
Cassim, S., and Pouyssegur, J. (2019). Tumor Microenvironment: A Metabolic Player that Shapes the Immune Response. Ijms 21 (1), 157. doi:10.3390/ijms21010157
Chakraborty, H., and Hossain, A. (2018). R Package to Estimate Intracluster Correlation Coefficient with Confidence Interval for Binary Data. Comp. Methods Programs Biomed. 155, 85–92. doi:10.1016/j.cmpb.2017.10.023
Chan, T. A., Yarchoan, M., Jaffee, E., Swanton, C., Quezada, S. A., Stenzinger, A., et al. (2019). Development of Tumor Mutation burden as an Immunotherapy Biomarker: Utility for the Oncology Clinic. Ann. Oncol. 30 (1), 44–56. doi:10.1093/annonc/mdy495
Chang, C.-H., Qiu, J., O’Sullivan, D., Buck, M. D., Noguchi, T., Curtis, J. D., et al. (2015). Metabolic Competition in the Tumor Microenvironment Is a Driver of Cancer Progression. Cell 162 (6), 1229–1241. doi:10.1016/j.cell.2015.08.016
Chauveau, C., Rowell, J., and Ferreiro, A. (2014). A Rising Titan:TTNReview and Mutation Update. Hum. Mutat. 35 (9), 1046–1059. doi:10.1002/humu.22611
Chen, J., Wo, D., Ma, E., Yan, H., Peng, J., Zhu, W., et al. (2019). Deletion of Low-Density Lipoprotein-Related Receptor 5 Inhibits Liver Cancer Cell Proliferation via Destabilizing Nucleoporin 37. Cell Commun Signal 17 (1), 174. doi:10.1186/s12964-019-0495-3
Cheng, X., Yin, H., Fu, J., Chen, C., An, J., Guan, J., et al. (2019). Aggregate Analysis Based on TCGA: TTN Missense Mutation Correlates with Favorable Prognosis in Lung Squamous Cell Carcinoma. J. Cancer Res. Clin. Oncol. 145 (4), 1027–1035. doi:10.1007/s00432-019-02861-y
Cooks, T., Pateras, I. S., Jenkins, L. M., Patel, K. M., Robles, A. I., Morris, J., et al. (2018). Mutant P53 Cancers Reprogram Macrophages to Tumor Supporting Macrophages via Exosomal miR-1246. Nat. Commun. 9 (1), 771. doi:10.1038/s41467-018-03224-w
Däster, S., Eppenberger-Castori, S., Mele, V., Schäfer, H. M., Schmid, L., Weixler, B., et al. (2020). Low Expression of Programmed Death 1 (PD-1), PD-1 Ligand 1 (PD-L1), and Low CD8+ T Lymphocyte Infiltration Identify a Subgroup of Patients with Gastric and Esophageal Adenocarcinoma with Severe Prognosis. Front. Med. 7, 144. doi:10.3389/fmed.2020.00144
Geeleher, P., Cox, N., and Huang, R. S. (2014). pRRophetic: an R Package for Prediction of Clinical Chemotherapeutic Response from Tumor Gene Expression Levels. PLoS One 9 (9), e107468. doi:10.1371/journal.pone.0107468
Harada, K., Wu, C. C., Wang, X., Mizrak Kaya, D., Amlashi, F. G., Iwatsuki, M., et al. (2020). Total Lesion Glycolysis Assessment Identifies a Patient Fraction with a High Cure Rate Among Esophageal Adenocarcinoma Patients Treated with Definitive Chemoradiation. Ann. Surg. 272 (2), 311–318. doi:10.1097/SLA.0000000000003228
Harmon, C., O’Farrelly, C., and Robinson, M. W. (2020). The Immune Consequences of Lactate in the Tumor Microenvironment. Adv. Exp. Med. Biol. 1259, 113–124. doi:10.1007/978-3-030-43093-1_7
Hashizume, C., Nakano, H., Yoshida, K., and Wong, R. W. (2010). Characterization of the Role of the Tumor Marker Nup88 in Mitosis. Mol. Cancer 9, 119. doi:10.1186/1476-4598-9-119
Hinshaw, D. C., and Shevde, L. A. (2019). The Tumor Microenvironment Innately Modulates Cancer Progression. Cancer Res. 79 (18), 4557–4566. doi:10.1158/0008-5472.CAN-18-3962
Hochwald, J., and Zhang, J. (2017). Glucose Oncometabolism of Esophageal Cancer. Acamc 17 (3), 385–394. doi:10.2174/1871520616666160627092716
Hua, Q., Jin, M., Mi, B., Xu, F., Li, T., Zhao, L., et al. (2019). LINC01123, a C-Myc-Activated Long Non-coding RNA, Promotes Proliferation and Aerobic Glycolysis of Non-small Cell Lung Cancer through miR-199a-5p/c-Myc axis. J. Hematol. Oncol. 12 (1), 91. doi:10.1186/s13045-019-0773-y
Huang, L., Wang, T., Wang, F., Hu, X., Zhan, G., Jin, X., et al. (2020). NUP37 Silencing Induces Inhibition of Cell Proliferation, G1 Phase Cell Cycle Arrest and Apoptosis in Non-small Cell Lung Cancer Cells. Pathol. - Res. Pract. 216 (3), 152836. doi:10.1016/j.prp.2020.152836
Jiang, L., Zhao, L., Bi, J., Guan, Q., Qi, A., Wei, Q., et al. (2019). Glycolysis Gene Expression Profilings Screen for Prognostic Risk Signature of Hepatocellular Carcinoma. Aging 11 (23), 10861–10882. doi:10.18632/aging.102489
Jiang, Z., Liu, Z., Li, M., Chen, C., and Wang, X. (2019). Increased Glycolysis Correlates with Elevated Immune Activity in Tumor Immune Microenvironment. EBioMedicine 42, 431–442. doi:10.1016/j.ebiom.2019.03.068
Kang, H., Wang, N., Wang, X., Zhang, Y., Lin, S., Mao, G., et al. (2020). A Glycolysis-Related Gene Signature Predicts Prognosis of Patients with Esophageal Adenocarcinoma. Aging 12 (24), 25828–25844. doi:10.18632/aging.104206
Kareva, I., and Hahnfeldt, P. (2013). The Emerging "hallmarks" of Metabolic Reprogramming and Immune Evasion: Distinct or Linked? Cancer Res. 73 (9), 2737–2742. doi:10.1158/0008-5472.CAN-12-3696
Kieser, A., Weich, H. A., Brandner, G., Marmé, D., and Kolch, W. (1994). Mutant P53 Potentiates Protein Kinase C Induction of Vascular Endothelial Growth Factor Expression. Oncogene 9 (3), 963–969.
Kornberg, M. D., Bhargava, P., Kim, P. M., Putluri, V., Snowman, A. M., Putluri, N., et al. (2018). Dimethyl Fumarate Targets GAPDH and Aerobic Glycolysis to Modulate Immunity. Science 360 (6387), 449–453. doi:10.1126/science.aan4665
Li, D., Jiao, W., Liang, Z., Wang, L., Chen, Y., Wang, Y., et al. (2020). Variation in Energy Metabolism Arising from the Effect of the Tumor Microenvironment on Cell Biological Behaviors of Bladder Cancer Cells and Endothelial Cells. Biofactors 46 (1), 64–75. doi:10.1002/biof.1568
Lim, Y., Bang, J.-I., Han, S.-W., Paeng, J. C., Lee, K.-H., Kim, J. H., et al. (2017). Total Lesion Glycolysis (TLG) as an Imaging Biomarker in Metastatic Colorectal Cancer Patients Treated with Regorafenib. Eur. J. Nucl. Med. Mol. Imaging 44 (5), 757–764. doi:10.1007/s00259-016-3577-0
Liu, Z., Yan, M., Liang, Y., Liu, M., Zhang, K., Shao, D., et al. (2019). Nucleoporin Seh1 Interacts with Olig2/Brd7 to Promote Oligodendrocyte Differentiation and Myelination. Neuron 102 (3), 587–601. e7. doi:10.1016/j.neuron.2019.02.018
Lynam-Lennon, N., Connaughton, R., Carr, E., Mongan, A.-M., O’Farrell, N. J., Porter, R. K., et al. (2014). Excess Visceral Adiposity Induces Alterations in Mitochondrial Function and Energy Metabolism in Esophageal Adenocarcinoma. BMC Cancer 14, 907. doi:10.1186/1471-2407-14-907
Markar, S. R., Noordman, B. J., Mackenzie, H., Findlay, J. M., Boshier, P. R., Ni, M., et al. (2017). Multimodality Treatment for Esophageal Adenocarcinoma: Multi-center Propensity-Score Matched Study. Ann. Oncol. 28 (3), 519–527. doi:10.1093/annonc/mdw560
Martínez, N., Alonso, A., Moragues, M. D., Pontón, J., and Schneider, J. (1999). The Nuclear Pore Complex Protein Nup88 Is Overexpressed in Tumor Cells. Cancer Res. 59 (21), 5408–5411. doi:10.1172/JCI82277
Mayr, M., Becker, K., Schulte, N., Belle, S., Hofheinz, R., Krause, A., et al. (2012). Phase I Study of Imatinib, Cisplatin and 5-fluoruracil or Capecitabine in Advanced Esophageal and Gastric Adenocarcinoma. BMC Cancer 12, 587. doi:10.1186/1471-2407-12-587
Naylor, R. M., Jeganathan, K. B., Cao, X., and van Deursen, J. M. (2016). Nuclear Pore Protein NUP88 Activates Anaphase-Promoting Complex to Promote Aneuploidy. J. Clin. Invest. 126 (2), 543–559. doi:10.1172/JCI82277
Newsholme, P., Curi, R., Gordon, S., and Newsholme, E. A. (1986). Metabolism of Glucose, Glutamine, Long-Chain Fatty Acids and Ketone Bodies by Murine Macrophages. Biochem. J. 239 (1), 121–125. doi:10.1042/bj2390121
Peng, M., Yin, N., Chhangawala, S., Xu, K., Leslie, C. S., and Li, M. O. (2016). Aerobic Glycolysis Promotes T Helper 1 Cell Differentiation through an Epigenetic Mechanism. Science 354 (6311), 481–484. doi:10.1126/science.aaf6284
Pfeiffer, T., Schuster, S., and Bonhoeffer, S. (2001). Cooperation and Competition in the Evolution of ATP-Producing Pathways. Science 292 (5516), 504–507. doi:10.1126/science.1058079
Quante, M., Graham, T. A., and Jansen, M. (2018). Insights into the Pathophysiology of Esophageal Adenocarcinoma. Gastroenterology 154 (2), 406–420. doi:10.1053/j.gastro.2017.09.046
Raices, M., and D’Angelo, M. A. (2019). Nuclear Pore Complexes Are Key Regulators of Oligodendrocyte Differentiation and Function. Neuron 102 (3), 509–511. doi:10.1016/j.neuron.2019.04.025
Roma-Rodrigues, C., Mendes, R., Baptista, P., and Fernandes, A. (2019). Targeting Tumor Microenvironment for Cancer Therapy. Ijms 20 (4), 840. doi:10.3390/ijms20040840
Romero-Garcia, S., Moreno-Altamirano, M. M. B., Prado-Garcia, H., and Sánchez-García, F. J. (2016). Lactate Contribution to the Tumor Microenvironment: Mechanisms, Effects on Immune Cells and Therapeutic Relevance. Front. Immunol. 7, 52. doi:10.3389/fimmu.2016.00052
Smyth, E. C., Lagergren, J., Fitzgerald, R. C., Lordick, F., Shah, M. A., Lagergren, P., et al. (2017). Oesophageal Cancer. Nat. Rev. Dis. Primers 3, 17048. doi:10.1038/nrdp.2017.48
Sonveaux, P., Copetti, T., De Saedeleer, C. J., Végran, F., Verrax, J., Kennedy, K. M., et al. (2012). Targeting the Lactate Transporter MCT1 in Endothelial Cells Inhibits Lactate-Induced HIF-1 Activation and Tumor Angiogenesis. PLoS One 7 (3), e33418. doi:10.1371/journal.pone.0033418
Talukdar, F. R., di Pietro, M., Secrier, M., Moehler, M., Goepfert, K., Lima, S. S. C., et al. (2018). Molecular Landscape of Esophageal Cancer: Implications for Early Detection and Personalized Therapy. Ann. N.Y. Acad. Sci. 1434 (1), 342–359. doi:10.1111/nyas.13876
Taube, J. M., Galon, J., Sholl, L. M., Rodig, S. J., Cottrell, T. R., Giraldo, N. A., et al. (2018). Implications of the Tumor Immune Microenvironment for Staging and Therapeutics. Mod. Pathol. 31 (2), 214–234. doi:10.1038/modpathol.2017.156
Uhlen, M., Zhang, C., Lee, S., Sjöstedt, E., Fagerberg, L., Bidkhori, G., et al. (2017). A Pathology Atlas of the Human Cancer Transcriptome. Science 357 (6352), eaan2507. doi:10.1126/science.aan2507
Wang, J. Z., Du, Z., Payattakool, R., Yu, P. S., and Chen, C.-F. (2007). A New Method to Measure the Semantic Similarity of GO Terms. Bioinformatics 23 (10), 1274–1281. doi:10.1093/bioinformatics/btm087
Wang, Y., Cheng, J., Xie, D., Ding, X., Hou, H., Chen, X., et al. (2018). NS1-binding Protein Radiosensitizes Esophageal Squamous Cell Carcinoma by Transcriptionally Suppressing C-Myc. Cancer Commun. 38 (1), 33. doi:10.1186/s40880-018-0307-y
Warburg, O., and Minami, S. (1923). Versuche an Überlebendem Carcinom-Gewebe. Klin Wochenschr 2 (17), 776–777. doi:10.1007/BF01712130
Wu, T., and Dai, Y. (2017). Tumor Microenvironment and Therapeutic Response. Cancer Lett. 387, 61–68. doi:10.1016/j.canlet.2016.01.043
Xu, D., Jin, J., Yu, H., Zhao, Z., Ma, D., Zhang, C., et al. (2017). Chrysin Inhibited Tumor Glycolysis and Induced Apoptosis in Hepatocellular Carcinoma by Targeting Hexokinase-2. J. Exp. Clin. Cancer Res. 36 (1), 44. doi:10.1186/s13046-017-0514-4
Yeudall, W. A., Vaughan, C. A., Miyazaki, H., Ramamoorthy, M., Choi, M.-Y., Chapman, C. G., et al. (2012). Gain-of-function Mutant P53 Upregulates CXC Chemokines and Enhances Cell Migration. Carcinogenesis 33 (2), 442–451. doi:10.1093/carcin/bgr270
Zhao, Q., Yu, J., and Meng, X. (2019). A Good Start of Immunotherapy in Esophageal Cancer. Cancer Med. 8 (10), 4519–4526. doi:10.1002/cam4.2336
Zhao, Z.-R., Zhang, L.-J., Wang, Y. Y., Li, F., Wang, M.-W., and Sun, X.-F. (2012). Increased Serum Level of Nup88 Protein Is Associated with the Development of Colorectal Cancer. Med. Oncol. 29 (3), 1789–1795. doi:10.1007/s12032-011-0047-1
Appendix A
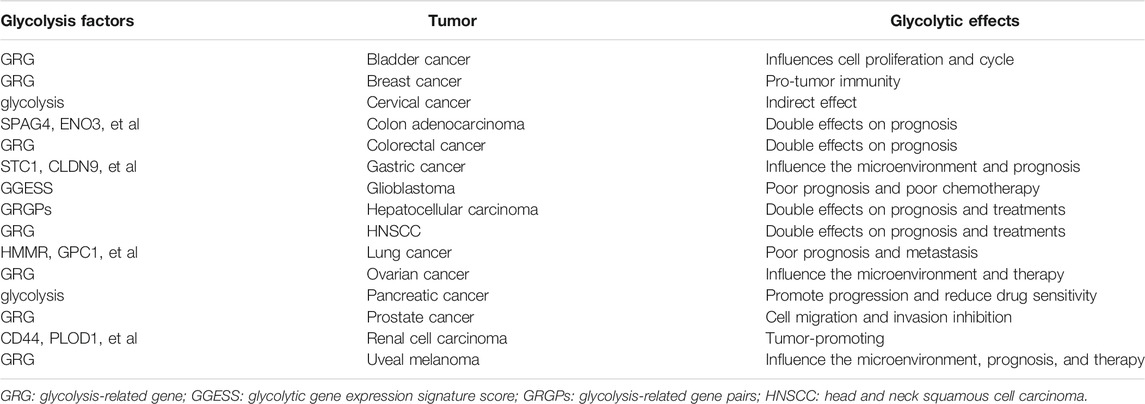
TABLE A1. R Glycolytic Effects in Other Cancers
Keywords: glycolysis, tumor microenvironment, immunotherapy, drug response, esophageal adenocarcinoma
Citation: Zhu L, Yang F, Li X, Li Q and Zhong C (2021) Glycolysis Changes the Microenvironment and Therapeutic Response Under the Driver of Gene Mutation in Esophageal Adenocarcinoma. Front. Genet. 12:743133. doi: 10.3389/fgene.2021.743133
Received: 17 July 2021; Accepted: 25 October 2021;
Published: 08 December 2021.
Edited by:
Jesús Espinal-Enríquez, Instituto Nacional de Medicina Genómica (INMEGEN), MexicoReviewed by:
Divya Mundackal Sivaraman, Sree Chitra Tirunal Institute for Medical Sciences and Technology (SCTIMST), IndiaEspiridión Ramos-Martínez, Universidad Nacional Autónoma de México, Mexico
Copyright © 2021 Zhu, Yang, Li, Li and Zhong. This is an open-access article distributed under the terms of the Creative Commons Attribution License (CC BY). The use, distribution or reproduction in other forums is permitted, provided the original author(s) and the copyright owner(s) are credited and that the original publication in this journal is cited, in accordance with accepted academic practice. No use, distribution or reproduction is permitted which does not comply with these terms.
*Correspondence: Qinchuan Li, cWluY2h1YW5saUB0b25namkuZWR1LmNu; Chunlong Zhong, ZHJjaHVubG9uZ3pob25nQDEyNi5jb20=
†These authors have contributed equally to this work