 Hanjing Liu
 Yuli Zhang1†
 Yingjuan Su
 Ting Wang
- 1School of Life Sciences, Sun Yat-sen University, Guangzhou, China
- 2Research Institute of Sun Yat-sen University in Shenzhen, Shenzhen, China
- 3College of Life Sciences, South China Agricultural University, Guangzhou, China
Cephalotaxus oliveri is an endemic conifer of China, which has medicinal and ornamental value. However, the limited molecular markers and genetic information are insufficient for further genetic studies of this species. In this study, we characterized and developed the EST-SSRs from transcriptome sequences for the first time. The results showed that a total of 5089 SSRs were identified from 36446 unigenes with a density of one SSR per 11.1 kb. The most common type was trinucleotide repeats, excluding mononucleotide repeats, followed by dinucleotide repeats. AAG/CTT and AT/AT exhibited the highest frequency in the trinucleotide and dinucleotide repeats, respectively. Of the identified SSRs, 671, 1125, and 1958 SSRs were located in CDS, 3′UTR, and 5′UTR, respectively. Functional annotation showed that the SSR-containing unigenes were involved in growth and development with various biological functions. Among successfully designed primer pairs, 238 primer pairs were randomly selected for amplification and validation of EST-SSR markers and 47 primer pairs were identified as polymorphic. Finally, 28 high-polymorphic primers were used for genetic analysis and revealed a moderate level of genetic diversity. Seven natural C. oliveri sampling sites were divided into two genetic groups. Furthermore, the 28 EST-SSRs had 96.43, 71.43, and 78.57% of transferability rate in Cephalotaxus fortune, Ametotaxus argotaenia, and Pseudotaxus chienii, respectively. These markers developed in this study lay the foundation for further genetic and adaptive evolution studies in C. oliveri and related species.
Introduction
Usually, successful conservation strategies require obtaining the genetic information, of which genetic diversity and population structure are essential parts. Molecular markers become useful tools to study genetic diversity and population structure of natural germplasm resources in non-model plants with no reference genomes (Parida et al., 2009). Compared to the other makers, SSRs possess the advantages of relative abundance, high polymorphism, codominant inheritance, and reproducibility, which have gained considerable importance in plant genetics and breeding (Taheri et al., 2018). In addition, SSRs have also been applied for discovering quantitative trait loci (QTL), linkage map construction between gene and marker, marker assisted selection for desired traits (MAS), and so forth (Kalia et al., 2011).
According to the source, SSRs are classed into genomic SSRs (gSSRs) and expressed sequence tag SSRs (EST-SSRs), the latter of which are located in the genic transcribed regions and are identified by NGS technology (Varshney et al., 2005; Wei et al., 2011). In general, EST-SSRs have been found to be more development-inexpensive, more evolutionarily conserved, and have higher transferability to related species than traditional anonymous gSSRs (Scott et al., 2000; Gadissa et al., 2018). Moreover, they are expected to be less polymorphic than gSSRs because of greater DNA sequence conservation in transcribed regions, but also less prone to null alleles (Postolache et al., 2014). The location of EST-SSRs determines their functional roles. EST-SSRs in CDSs affect the inactivated or activated genes or truncate proteins, in 3′UTR are involved in gene silencing or transcription slippage, and in 5′UTR impact gene transcription and/or translation (Lawson and Zhang, 2006; Gao et al., 2013).
Cephalotaxus oliveri (Cephalotaxaceae) is an endemic conifer species of China. It is a perennial shrub or small tree which is 4 m tall with white stomatal bands between the midvein and marginal bands of abaxial leaves. This plant can be cultivated as an ornamental in gardens, and its wood can be used for the manufacture of farm tools and furniture (Fu et al., 1999). Moreover, a variety of plant alkaloids (such as anticancer alkaloid harringtonine) can be extracted from leaves, branches, seeds, and roots, which have certain curative effects on leukemia and lymphoid sarcoma (Ni et al., 2016; Xiao et al., 2019). The species is distributed in broad-leaved or coniferous forests to the south of Qinling mountains–Huaihe River line and west of Wuyi Mountains at an altitude of 300–1800 m, and the distribution locations mainly include southeastern and northeastern Yunnan, Guizhou, southern and western Sichuan, northwestern Hubei, Hunan, eastern Jiangxi, and northern Guangdong (Fu et al., 1999). However, its natural population sizes decreased significantly in the recent years due to overexploitation, deforestation, and climate change. This species has been listed as vulnerable in the IUCN Red List. Thus, effective strategies are important to ensure the conservation and scientific utilization of C. oliveri. EST-SSRs have been widely developed and applied to numerous coniferous species. Zhang et al. (2015) developed nine EST-SSRs of Larix gmelinii and used them to evaluate the genetic parameters and transferability to three related species. Zeng et al. (2018) developed 11 EST-SSRs of T. grandis, which revealed a moderate level of genetic diversity and two different genetic groups within this species. Li et al. (2021) also investigated the genetic variation and population structure of 20 EST-SSRs. All these studies proved that EST-SSRs are effective molecular markers for studying the genetic diversity of conifers with high transferability. Although, hitherto, few SSRs (Pan et al., 2011; Miao et al., 2012) and ISSRs (Wang et al., 2016) have been developed and applied, there have been no reports on EST-SSR markers for C. oliveri, even for Cephalotaxaceae, using transcriptome data, greatly limiting research on genetic diversity, germplasm preservation, and molecular breeding of this species.
In this study, we used the leaf transcriptome data by Illumina sequencing from C. oliveri, and the objectives were to 1) characterize frequency, distribution, and function of the SSR motifs from transcriptome unigenes; 2) develop and characterize novel EST-SSRs and examine the level of polymorphism; 3) analyze the cross-species transferability of the polymorphic EST-SSRs; and 4) explore the genetic diversity and structure of C. oliveri by polymorphic EST-SSRs.
Materials and Methods
Plant Materials and DNA Extraction
In 2019, 134 C. oliveri individuals from seven natural sampling sites in China were collected for development and characterization of EST-SSRs; detail sample information is shown in Supplementary Figure S1 and Supplementary Table S1. Young leaves were sampled and placed into sealed bags containing dry silica gel and stored at 20°C for later use. The distance between individuals was more than 10 m. Total genomic DNA was extracted using the modified cetyltrimethylammonium bromide (CTAB) method (Su et al., 2005). DNA quality and concentration were determined by 1% agarose gel electrophoresis and Nanodrop 2000c (Thermo scientific, MA, United States), respectively. Then, all samples of DNA were diluted to a desired working concentration (50 ng/μl) and maintained at −20°C for PCR amplification.
Our sampling study complies with the laws of the People’s Republic of China. Voucher specimens were maintained at the Herbarium of Sun Yat-sen University (No: bzsjs-2019-1001∼bzsjs-2019-1007, bds-2018-1001, shs-2017-1001, sjs-2020-1001).
EST-SSR Detection and Primer Design
The unigenes of leaf transcriptome data used for SSR development in this study came from the study conducted in our laboratory by He et al. (He et al., 2021) (Accession Number: SRR12058210). Potential SSRs were detected from 36446 unigenges using the the microsatellite tool (MISA, http://pgrc.ipk-gatersleben.de/misa/misa.html). The identification criteria for SSRs were set at a minimum number of 10, 6, 5, 5, 5, and 5 repeat units for mono, di, tri, tetra, penta, and hexanucleotide motifs, respectively. Primers were designed using Primer 3 software with major parameters as follows: primer length of 18–27 bp, PCR product size ranging from 100 to 280 bp, GC content of 40–60%, and annealing temperature ranging from 57 to 62°C.
Functional Annotations and Classification of EST-SSRs
All unigenes containing SSRs were compared against six public databases by BLAST, including NCBI nonredundant protein sequences (NR), NCBI nonredundant nucleotide sequences (NR), Kyoto Encyclopedia of Genes and Genomes (KEGG), SWISS-PROT, Protein family (Pfam), and Clusters of eukaryotic Orthologous Groups (KOG). Blast2GO was used to perform Gene Ontology (GO) terms based on the Nr annotation (Conesa et al., 2005).
EST-SSR Amplification and Validation
Totally, 238 pairs of primers were randomly selected (SSRs containing mononucleotides were not considered because of the high error rate of PCR product) and synthesized by TSINGKE Biological Technology Co., Ltd. (Beijing, China) for polymorphic EST-SSR development. PCR amplification was performed in a total reaction volume of 25 μl that included 1 μl of template DNA (50 ng/μl), 12.5 μl of 2×Taq Master Mix (Vazyme Biotech; Nanjing, China), 0.5 μl of each primer (10 μM), and 10.5 μl of ddH2O. Amplifications were carried out applying the following procedures: 5 min at 95°C for initial denaturation, followed by 30 cycles of 30 s at 95°C, 30 s at the annealing temperature, 30 s at 72°C, and 10 min at 72°C for final extension. The successfully amplified products were processed in 6% denaturing polyacrylamide gel electrophoresis for polymorphism screening by 14 individuals from seven sampling sites of C. oliveri. Polymorphic primers were further used for genotyping, and the PCR products with fluorescence labeling were separated on an ABI 3730xl DNA Analyzer (Applied Biosystems, CA, United States), using GeneScan LIZ500 (Applied Biosystems) as the internal lane size standard. The genotyping data were obtained through GeneMapper v5 (Applied Biosystems).
Analysis of Data
We used the 28 EST-SSR markers to analyze genetic diversity and structure among 134 individuals from seven sampling sites. POPGENE v1.32 (Yeh et al., 1999) was used to calculate population genetic parameters, including the number of alleles (A), number of effective alleles (Ae), observed heterozygosity (Ho), expected heterozygosity (He), and Shannon’s information index (I). The polymorphism information contents (PICs) of each marker were calculated using PIC_CALC v0.6 (Botstein et al., 1980). MICRO-CHECKER 2.2.3 (Van Oosterhout et al., 2004) was used to estimate the null allele frequency for each marker. Linkage disequilibrium (LD) for locus pair and the departure from Hardy–Weinberg equilibrium (HWE) were detected by GENEPOP v4.7 ((Raymond and Rousset, 1995), Bonferroni corrections were performed to determine significance levels for all tests at p-value < 0.05 (Rice, 1989). Analysis of molecular variance (AMOVA) and principal coordinate analysis (PCoA) were performed in GenAlEx v6.5 (Peakall and Smouse, 2012).
Based on Bayesian clustering analysis, STRUCTURE v2.3.4 (Pritchard et al., 2000) with the default setting of the admixture model was used to analyze the genetic structure of natural populations within the species. Ten independent runs were performed with K from 1 to 10. Each run was estimated with Markov chain Monte Carlo steps of 100,000 iterations and burn-in period of 100,000 iterations. The optimal K value was evaluated in STRUCTURE HARVESTER (http://taylor0.biology.ucla.edu/structureHarvester/). CLUMPP (Jakobsson and Rosenberg, 2007) and Distruct (Rosenberg, 2004) were used to estimate the averaged admixture coefficients for each K value and visualize the clustering results, respectively.
Transferability in Cross-Species
Three different species, namely, C. fortunei, Ametotaxus argotaenia, and P. chienii were used to analyze the transferability of the 28 EST-SSR markers. Young leaves of 17, 12, and 12 individuals were collected. Genomic DNA extraction, PCR amplification, and separation and size reading of target products for all these samples were performed as described above.
Results
Frequency and Distribution of EST-SSRs
Of the 36446 unigenes that we identified, 4352 sequences contained 5089 SSRs with 261 sequences in compound formation and 578 sequences containing more than 1 SSR. An overall density of 1 SSR/11.1 kb of the sequences was determined (Supplementary Table S2). The mononucleotides (2686, 52.78%) were the most abundant type of repeat motifs, followed by trinucleotides (1333, 26.19%), dinucleotides (781, 15.35%), hexanucleotides (219, 4.30%), pentanucleotides (36, 0.71%), and tetranucleotides (34, 0.67%), with the number of repeat units from 5 to 82. The largest number of repeat units was 10 (1222, 24.01%), followed by 5 (1105, 21.71%), 6 (642, 12.62%), 11 (604, 11.87%), and 12 (367, 7.21%). Most (99.33%) of the motifs had 5–24 repeats, while motifs with more than 24 repeats only accounted for 0.67% (Figure 1).
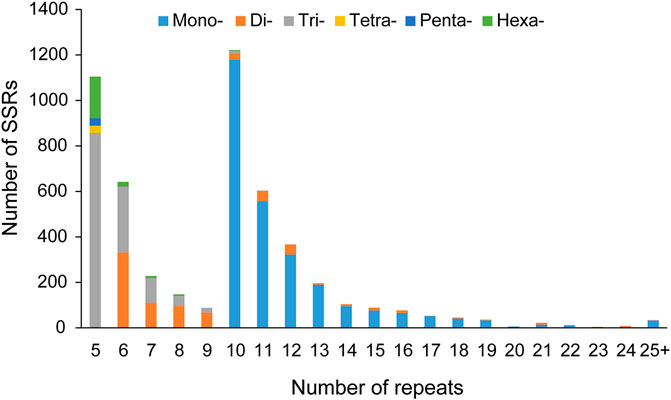
FIGURE 1. Number of repeats in each different unit length in C. oliveri.
Among 109 different repeat motifs, A/T (2656, 52.19% of all motifs) was the most abundant motif in mononucleotide repeats, followed by C/G (30, 0.59%). In dinucleotide repeats, the most abundant type was AT/AT (536, 10.53%) followed by AG/CT (168, 3.30%). Among the trinucleotide repeats, the most frequent motif was AAG/CTT (331, 6.50%), followed by AGC/CTG (302, 5.93%) and AGG/CCT (236, 4.64%). AAAT/ATTT (8, 0.16%), AAGGC/CCTTG (10, 0.20%), and AAGAGG/CCTCTT (15, 0.29%) were identified as the top motifs in the hexanucleotide, pentanucleotide, and hexanucleotide repeats, respectively (Table 1).
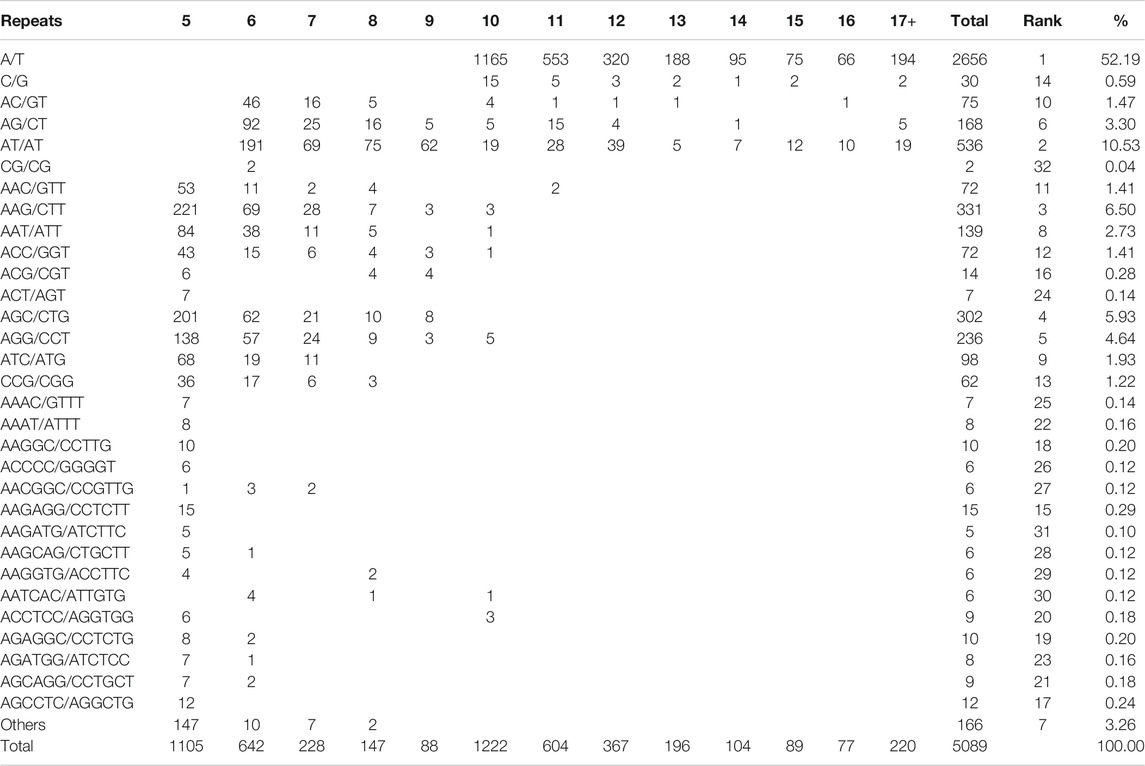
TABLE 1. Frequencies of different repeat motifs in C. oliveri SSR loci.
In addition, the physical positions of these 5089 SSRs in the unigenes were also identified, and 671, 1125, and 1958 SSRs were located in CDS, 3′UTR, and 5′UTR, respectively, while the remaining 1335 SSRs had no sufficient information to determine their position. In CDS, trinucleotide repeats were the dominant type. Most of mononucleotide and dinucleotide repeats were located in 3′UTR and 5′UTR, whereas trinucleotide repeats were also abundant in 5′UTR (Figure 2).
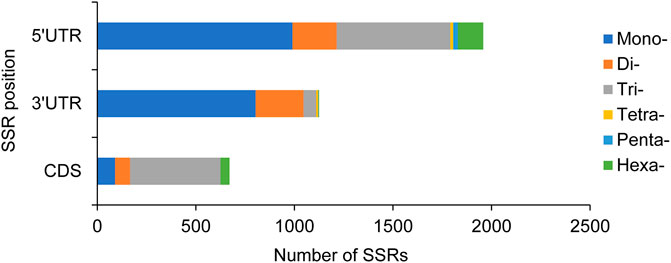
FIGURE 2. Distribution of six repeat motifs in different unigene positions.
SSR Annotation and Classification
To explore the potential function of SSR-containing unigenes, all these unigenes were annotated by comparison against the seven functional databases: Nr, Nt, KEGG, Swiss-Prot, Pfam, KOG, and GO. As indicated in Table 2, a total of 3774 (86.72%) unigenes were annotated in at least one database and 584 (13.42%) were annotated in all databases. For each database, 3569 (82.01%) of unigenes were matched in Nr, 2076 (47.70%) in Nt, 1488 (34.19%) in KEGG, 2902 (66.68%) in SWISS-PROT, 2919 (67.07%) in Pfam, 2919 (67.07%) in GO, and 1188 (27.30%) in KEGG.
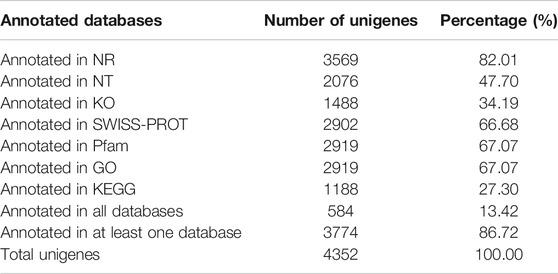
TABLE 2. Summary of functional annotation results of SSR-containing unigenes in C. oliveri transcriptome.
Classification of all SSR-containing unigenes was performed using their annotations with GO, KEGG, and KOG databases. These SSR-containing unigenes were classified to three major GO functional categories: biological process (7287, 44.14%), cellular component (5350, 32.40%), and molecular function (3874, 23.46%), which were further classified into 25, 16, and 11 different sub-categories, respectively (Figure 3). Of these, unigenes related to cellular process, metabolic process, and single-organism process accounted for the largest proportion in biological processes. In the cellular component, the most enriched sub-category was the cell part, followed by the cell and membrane. The molecular function category mainly represented the genes involved in binding, catalytic activity, and transporter activity.
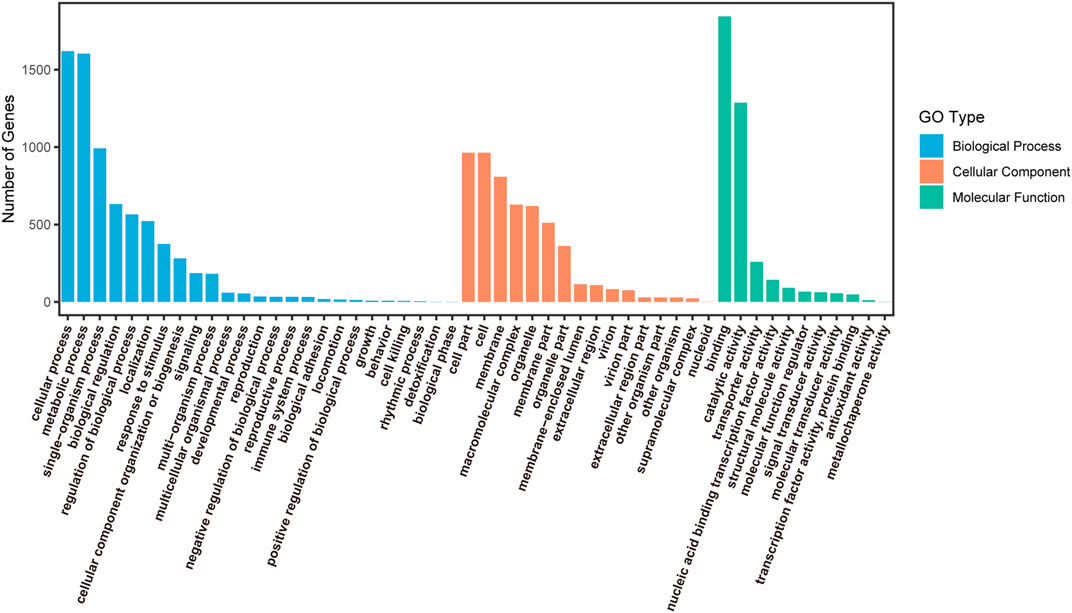
FIGURE 3. Level 2 GO classification of the annotated SSR-containing unigenes.
The unigenes were annotated in 115 KEGG metabolism pathways that were classified into five categories, including cellular processes (55, 4.47%), environmental information processing (71, 5.77%), genetic information processing (379, 30.79%), metabolism (678, 55.08%), and organismal systems (48, 3.90%) (Figure 4). In the second level of the pathway, carbohydrate metabolism represented the largest pathway, followed by translation and transcription. Among these 115 pathways, the top five were spliceosome, plant hormone signal transduction, starch and sucrose metabolism, mRNA surveillance pathway, and plant-pathogen interaction.
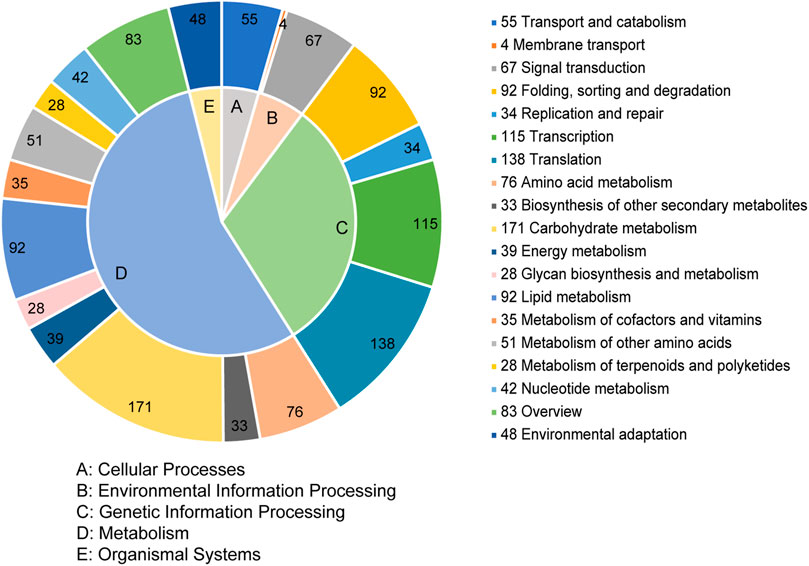
FIGURE 4. KEGG classification of the SSR-containing unigenes.
The 1341 unigenes annotated by KOG were classified into 24 categories. The largest category was general function prediction only (239, 17.82%), followed by RNA processing and modification (161, 12.01%), posttranslational modification, protein turnover, chaperones (134, 9.99%), transcription (97, 7.23%), and signal transduction mechanisms (94, 7.01%) (Figure 5). The proportion in cell mobility (3, 0.22%) was the least, along with defense mechanisms (5, 0.37%) and nuclear structure (6, 0.45%).
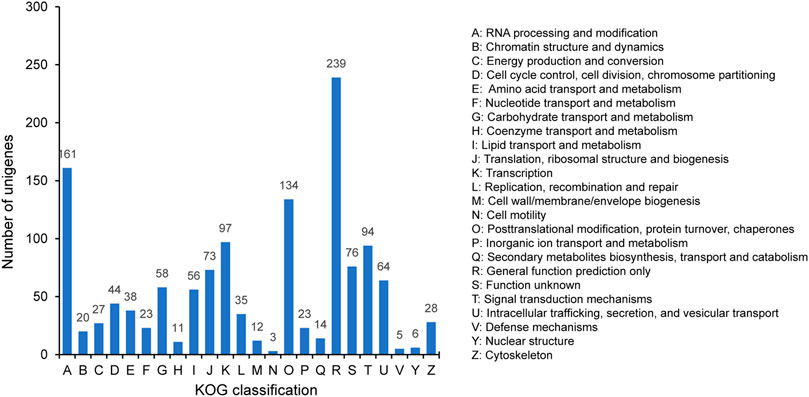
FIGURE 5. KOG classification of the SSR-containing unigenes.
Development and Validation of EST-SSR Markers
Among the 5089 SSRs, 3900 pairs of primers were successfully designed. 238 pairs of primers were randomly selected for amplification and validation, and the results showed that 127 (53.36%) primers produced expected size bands. Of these 127 pairs of primers, 80 were monomorphic and 47 were identified as polymorphic. Finally, 28 high-polymorphic primers were selected and used for genetic analysis (Table 3).
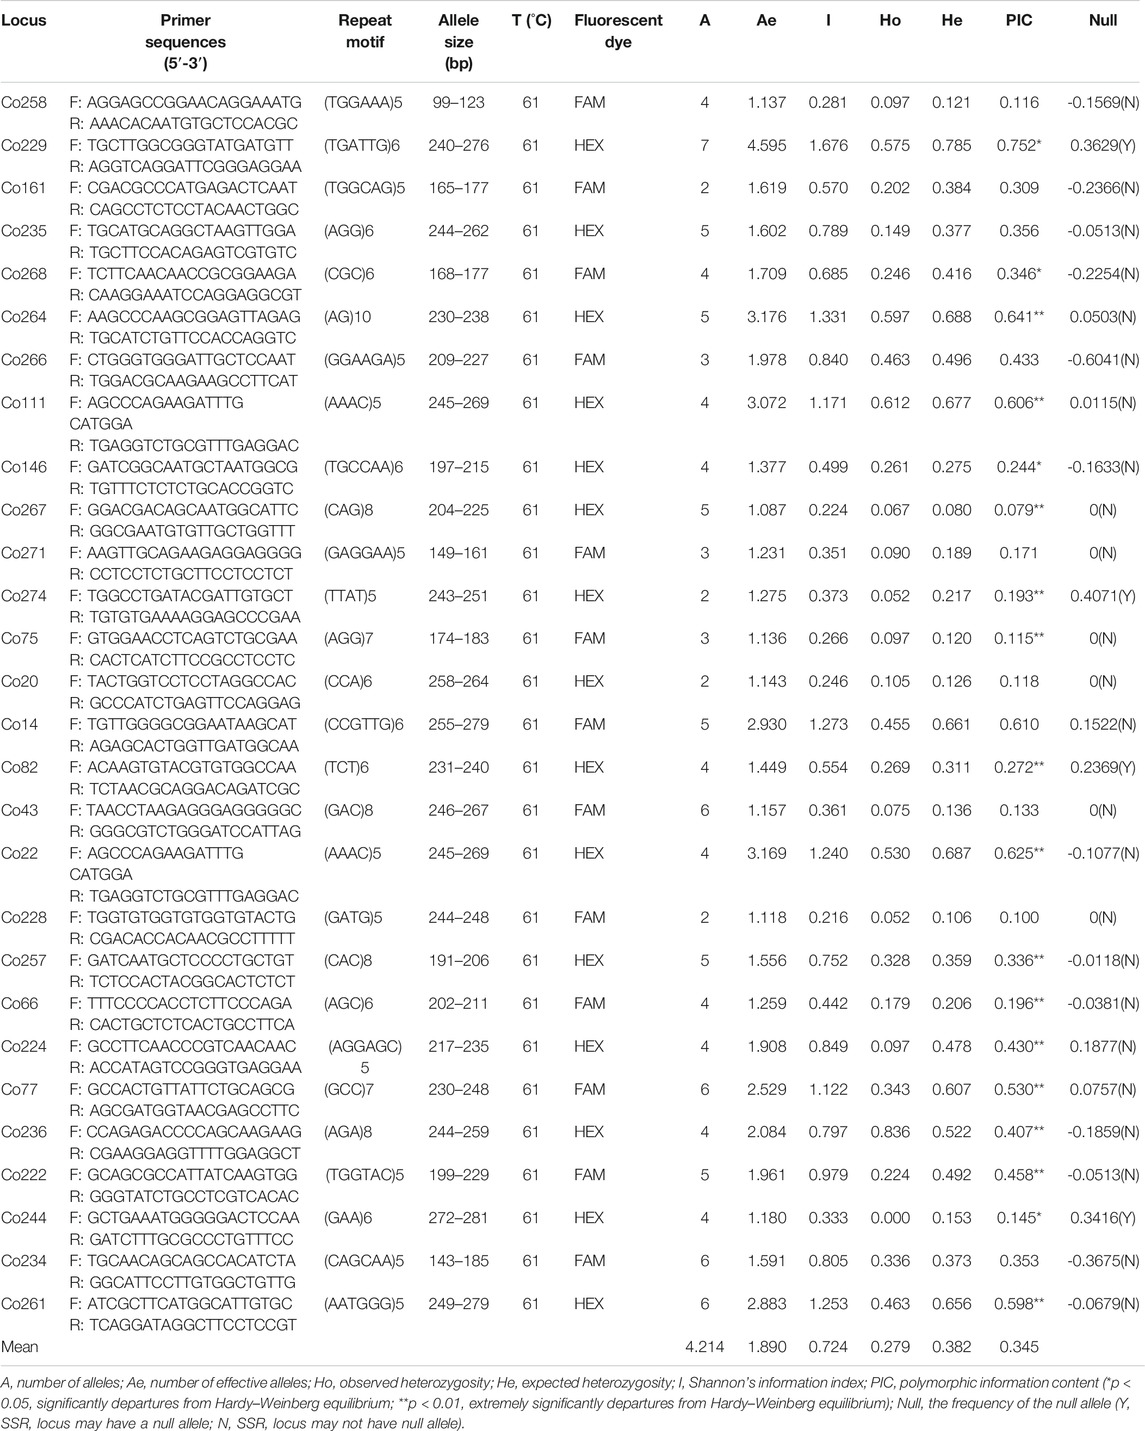
TABLE 3. Characteristics of 28 newly developed polymorphic EST-SSR markers in C. oliveri.
In total, 118 alleles were detected in all samples by the 28 EST-SSR markers. A per locus ranged from 2 to 7 with an average of 4.214. Ae ranged from 1.087 to 4.595, with an average value of 1.889. I varied from 0.215 to 1.676, with an average value of 0.724. Ho and He were calculated as 0.279 and 0.382, ranging from 0.052 to 0.836 and 0.080 to 0.785, respectively. The PIC ranged from 0.079 to 0.752, with an average of 0.345. In addition, four loci (Co229, Co274, Co82, and Co244) were found to have null alleles. Significant departures from HWE were detected for 18 of 28 EST-SSR loci (Table 3). Among 378 pairs of loci, 44 pairs showed LD and only two (Co14&Co257 and Co229&Co222) remained significant after Bonferroni correction (p-value < 0.05), indicating that the EST-SSR loci used in this study were independent of each other.
Genetic Diversity and Structure
For each sampling site, the mean A, Ae, I, Ho, and He ranged from 2.071 to 2.679, 1.451 to 1.720, 0.396 to 0.587, 0.208 to 0.311, and 0.243 to 0.352, respectively. Overall, SX had the greatest genetic diversity, whereas the lowest genetic diversity was found in PB (Supplementary Table S3). AMOVA showed that 71% of the variation was found within populations and 29% among populations (Supplementary Table S4).
The population structure of C. oliveri was analyzed in STRUCTURE, and the optimal K value was observed at K = 2 with maximum Delta K value (Figure 6A). The seven sampling sites were divided into two genetic groups (Figure 6B and Supplementary Figure S1). Group Ⅰ included the sites, namely, SX, HNG, WYH, LP, EMS, and WGS, while Group Ⅱ only included site PB. Consistent with the STRUCTURE analysis, the result of PCoA also revealed two groups based on genetic distance (Figure 7). The first and second axes explained 29.55 and 12.75% of the total variation, respectively. HWE was further tested for these two genetic groups, and the result showed that 13 loci deviated from HWE in Group Ⅰ, while only one locus was deviated from HWE in Group Ⅱ (Supplementary Table S5).
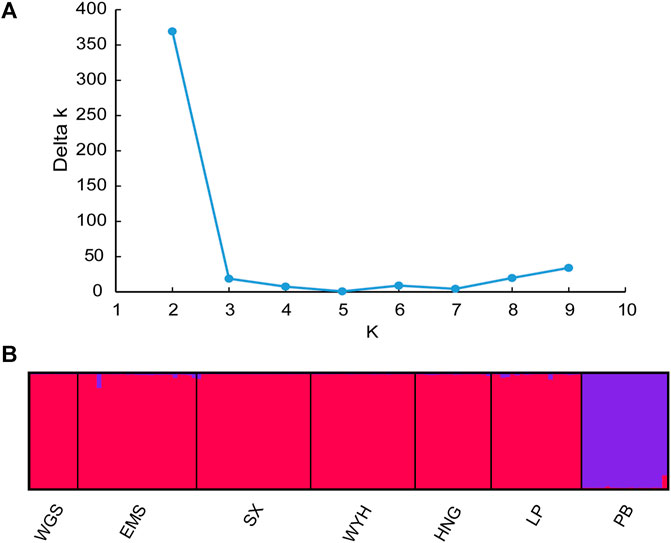
FIGURE 6. Structure analysis of C. oliveri. (A) Estimation of population using Delta k value with cluster K ranging from 1 to 10. (B) Estimation of the population structure based on STRUCTURE analysis.
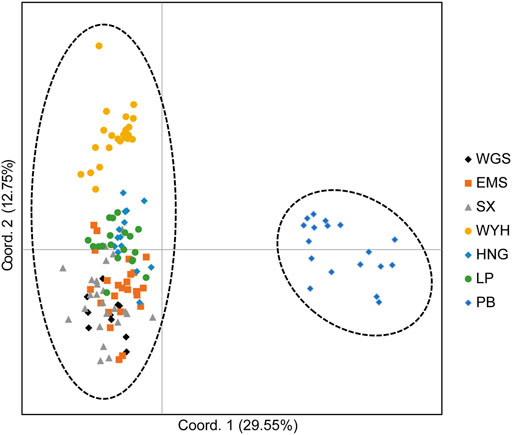
FIGURE 7. Principal coordinate analysis (PCoA) based on genetic distance.
Cross-Species Transferability
The 28 pairs of primers were also evaluated for transferability in the three species (C. fortune, A. argotaenia and P. chienii). The results showed that 15 primer pairs were successfully amplified in all species (all the templates). Twenty-seven pairs were applicable for (had transferability in) C. fortunei, with the highest rate of 96.43%. 20 (71.43%) and 22 (78.57%) pairs had transferability in A. argotaenia and P. chienii, respectively (Supplementary Table S6).
Discussion
Currently, transcriptome sequencing through the Illumina platform is the most widely utilized NGS technology for EST-SSR marker development in non-model plants, particularly in conifers with large genomes (Zalapa et al., 2012; Postolache et al., 2014; Vieira et al., 2016). In this study, a total of 36446 unigenes were used to detect SSRs, and finally 4352 unigenes containing 5089 SSRs were identified. The distribution frequency was 11.94%, which was similar to that of C. hainanensis (11.39%) (Qiao et al., 2014) and P. chienii (11.15%) (Xu et al., 2020), higher than that of P. bungeana (9.21%) (Duan et al., 2017), Torreya grandis (2.75%) (Zeng et al., 2018), A. argotaenia (7.68%) (Ruan et al., 2019), and P. koraiensis (6.84%) (Li et al., 2021), lower than that of Lycium barbarum (27.93%) (Chen et al., 2017), Dalbergia odorifera (23.31%) (Liu et al., 2019), and peony (20.38%) (He et al., 2020). The average density of SSRs was 1/11.1 kb, lower than that of C. hainanensis (1/8.08 kb) (Qiao et al., 2014), Glyptostrobus pensilis (1/7.59 kb) (Li et al., 2019), and P. chienii (1/9.18 kb) (Xu et al., 2020), while higher than that in P. dabeshanensis (1/23.08 kb) (Xiang et al., 2015), P. koraiensis (1/17.38 kb) (Du et al., 2017), and L. principis-rupprechtii (1/26.8 kb) (Dong et al., 2018). The differences in frequency and density might be caused by several factors, including dataset size, SSR mining tools, search criteria, and genome structure (Varshney et al., 2005).
A microsatellite locus typically varies in length between 5 and 40 repeats, but longer strings of repeats are possible (Selkoe and Toonen, 2006). In this study, the repeat units of 10, 5, 6, 11, and 12 accounted for 77.42% of the total SSR loci, with the size mainly ranging from 10 to 18 bp. The predominant type was trinucleotide repeats (26.19%), followed by dinucleotide repeats (15.35%) and hexanucleotide repeats (4.30%). This result was similar to that of pervious reports that trinucleotide repeats were the abundant type for other conifers, including C. hainanensis (Qiao et al., 2014), A. argotaenia (Ruan et al., 2019), P. koraiensis (Li et al., 2020), and P. chienii (Xu et al., 2020). Among the trinucleotide repeats, the most abundant motif was AAG/CTT, which was identical to previous findings in Cryptomeria japonica (Ueno et al., 2012), P. halepensis (Pinosio et al., 2014), L. gmelinii (Zhang et al., 2015), T. grandis (Zeng et al., 2018), A. argotaenia (Ruan et al., 2019), and P. chienii (Xu et al., 2020). In addition, this motif was the second abundant motif in C. hainanensis (Qiao et al., 2014) and P. dabeshanensis (Xiang et al., 2015). These results showed that AAG/CTT was conserved in conifers. Of the dinucleotide repeats, AT/AT and AG/CT exhibited high frequency. However, like most conifers, including T. contorta (Majeed et al., 2019) and P. koraiensis (Li et al., 2020), the CG/CG motif was found to be rare in this study. It might be due to methylation of cytosine in CpG sequences, which might potentially inhibit transcription (Gonzalez-Ibeas et al., 2007; Xing et al., 2017).
Some studies have shown that SSRs are much more abundant in the UTRs than in the CDSs of many plants (Li et al., 2004). In the present study, 17.85% of SSRs were found to be located in CDSs in contrast to 82.13% in UTRs. Moreover, trinucleotide repeats were mostly accumulated in the CDSs and other types had a small proportion. This result was consistent with those of the studies in T. contorta (Majeed et al., 2019), Elaeagnus mollis (Liu et al., 2020), and P. chienii (Xu et al., 2020). This might explain that non-trinucleotides negatively selected frameshift mutations in coding regions, contributing to changes in SSR length, and therefore to expression. In contrast, trinucleotides did not generate frameshifts and did not affect gene expression through single-motif length mutations (Metzgar et al., 2000; Taheri et al., 2019).
All SSR-containing unigenes in leaves of C. oliveri were annotated through seven functional databases. 86.72% of these unigenes were annotated in at least one database, which was similar to the annotation result of all unigenes in leaf (He et al., 2021). In the GO classification, most of SSR-containing unigenes were categorized in the cellular process, metabolic process, single-organism process, cell part, cell, binding, and catalytic activity, which are involved in the basic metabolism in the plant cells. Furthermore, KEGG and KOG classification suggested that SSR-containing unigenes were involved in growth and development of C. oliveri with various biological functions.
In this study, among the 238 pairs of randomly designed primers, 127 (53.36%) were of expected size bands. Forty-seven (19.75%) were identified as polymorphic among 14 individuals from seven C. oliveri sampling sites. This polymorphism rate was higher than the results reported for T. grandis (10.38%) (Zeng et al., 2018), P. koraiensis (6.67%) (Li et al., 2020), G. pensilis (13.53%) (Li et al., 2019), and P. chienii (10.67%) (Xu et al., 2020), but lower than the results of P. dabeshanensis (Xiang et al., 2015) (23.17%) and L. principis-rupprechtii (21.67%) (Dong et al., 2018). In conifers with huge genome structure, most EST-SSRs might locate within repetitive DNA, which caused EST-SSRs difficult to be amplified and the polymorphism rate to be low (Wagner et al., 2012).
The transferability rate of the markers corresponds to genomic similarity and can reflect the genetic relationships and extent of sequence conservation between species (Zhang et al., 2014). EST-SSR markers are expected to have a high transferability rate due to conservation of transcribed regions among related species (Kalia et al., 2011). In this study, the transferability of 28 EST-SSRs from C. oliveri to C. fortune was 96.43%, confirming that C. oliveri had a closer relationship with C. fortune than the other two species. This transferability rate was consistent with that of Taxodium 'zhongshansa' (100%) (Cheng et al., 2015), while higher than that of Abies alba (75–81%) (Postolache et al., 2014) and P. chienii (70%) (Xu et al., 2020). Significantly, the transferability rate was more than 70% both for A. argotaenia and P. chienii belonging to Taxaceae, indicating that there may be a high genomic similarity between C. oliveri and Taxaceae species. These results indicated that the markers developed in this study would provide a powerful molecular tool for evolutionary adaptation and genetic relationship analysis in C. fortune, A. argotaenia, and P. chienii.
Genetic diversity is an important indicator in the conservation and management of plant genetic resources (Chen et al., 2018).In this study, genetic parameters were detected in 134 individuals by the 28 EST-SSRs. The mean PIC value was 0.345, indicating a mean level of genetic information, and similar results were observed in C. japonica (0.325) (Ueno et al., 2012), A. argotaenia (0.455) (Ruan et al., 2019), and P. koraiensis (0.404) (Li et al., 2021). Mean A (4.214) was higher than that reported for T. grandis (2.636) (Zeng et al., 2018) and L. principis-rupprechtii (3.850) (Dong et al., 2018), but lower than that for P. koraiensis (6.45) (Li et al., 2020) and P. chienii (6.4) (Xu et al., 2020). The average of Ho and He were 0.279 and 0.382, respectively, which was lower than that for P. dabeshanensis (0.445 and 0.486) (Xiang et al., 2015) and L. principis-rupprechtii (0.487 and 0.490) (Dong et al., 2018). These results revealed that the 134 individuals had a moderate level of genetic diversity, which might be caused by small population size and fragmentation; meanwhile, habitat heterogeneity might restrict gene flow between populations and had an impact on genetic diversity (Wang et al., 2014). However, this study on genetic diversity of C. oliveri showed a lower level than that in the previous study employing gSSRs (Ho = 0.570, He = 0.568) (Miao et al., 2012). These differences might be due to the different types and numbers of genetic markers used in the studies or to the different populations and sample sizes (Tong et al., 2020). Furthermore, the genetic diversity of the population level was lower than that at the species level, which might be due to limited numbers of SSR loci and small population size.
The distribution geographic range, habitat types, and species characteristics may have a significant influence on the population structure, as well as genetic diversity (Jia et al., 2016; Li et al., 2019). A previous report found that 22 populations of C. oliveri were clustered into two groups by constructing a dendrogram, and the YNdws population (Yunnan Province) was clustered into the separated group (Wang et al., 2016). In this study, STRUCTURE and PCoA analyses also revealed a distinct genetic population (site PB) among the seven sampling sites of C. oliveri. The main reason was that site PB was in the southern edge of the distribution area, as the most geographically distant population, which limited the gene flow between site PB and other sites. However, detailed reasons for the population structure need to be further investigated with an increased number of population and materials.
According to the results of genetic diversity and population structure of C. oliveri, we gained the following management implications and recommendations: for the sites (SX, LP) with higher genetic diversity, in situ conservation strategies should be designed to protect the habitats from human disturbance and prevent the loss of genetic diversity. Ex situ conservation programs should be carried out for the sites (EMS, PB) with lower genetic diversity in order to increase the species numbers of these sampling sites and improve their adaptability to the environment. Furthermore, special attention should be given to site PB because of its isolation from the other sampling sites; it is necessary to save the seeds of this site for breeding.
Conclusion
In this study, 5089 EST-SSRs were identified from transcriptome data of C. oliveri, and the distribution, frequency, location, and function of motifs were characterized and evaluated., Twenty-eight EST-SSR markers were developed for C. oliveri with abundant polymorphisms and showed a moderate level of genetic diversity. Genetic structure and PCoA analysis revealed two different genetic groups of natural C. oliveri. In addition, more than 70% of these EST-SSRs could be transferred to other species. These EST-SSRs would enable further genetic investigation in C. oliveri and related species and could be used to ensure effective conservation and breeding applications of C. oliveri in the future.
Data Availability Statement
Publicly available datasets were analyzed in this study. These data can be found here: Twenty-eight EST-SSR sequences generated for this study were deposited at GenBank with Accession numbers MZ773613-MZ773640.
Author Contributions
HL and YZ performed the experiments and wrote the manuscript, and the two authors contributed equally to this study. ZW analyzed the data. YS and TW conceived and designed the experiments and revised the manuscript.
Funding
This study was supported by the National Natural Science Foundation of China (31670200, 31770587, 31872670, and 32071781), Guangdong Basic and Applied Basic Research Foundation (2021A1515010911), and the Project of Department of Science and Technology of Shenzhen City, Guangdong, China (JCYJ20190813172001780).
Conflict of Interest
The authors declare that the research was conducted in the absence of any commercial or financial relationships that could be construed as a potential conflict of interest.
Publisher’s Note
All claims expressed in this article are solely those of the authors and do not necessarily represent those of their affiliated organizations, or those of the publisher, the editors, and the reviewers. Any product that may be evaluated in this article, or claim that may be made by its manufacturer, is not guaranteed or endorsed by the publisher.
Supplementary Material
The Supplementary Material for this article can be found online at: https://www.frontiersin.org/articles/10.3389/fgene.2021.759557/full#supplementary-material
References
Botstein, D., White, R. L., Skolnick, M., and Davis, R. W. (1980). Construction of a Genetic Linkage Map in Man Using Restriction Fragment Length Polymorphisms. Am. J. Hum. Genet. 32 (3), 314–331. doi:10.1016/0165-1161(81)90274-0
Chen, C., Xu, M., Wang, C., Qiao, G., Wang, W., Tan, Z., et al. (2017). Characterization of the Lycium barbarum Fruit Transcriptome and Development of EST-SSR Markers. Plos One 12 (11), e0187738. doi:10.1371/journal.pone.0187738
Chen, T., Hu, Y.-y., Chen, Q., Wang, Y., Zhang, J., Tang, H.-R., et al. (2018). Molecular and Morphological Data Reveals New Insights into Genetic Diversity and Population Structure of Chinese Cherry (Prunus pseudocerasus Lindl.) Landraces. Genet. Resour. Crop Evol. 65 (8), 2169–2187. doi:10.1007/s10722-018-0683-9
Cheng, Y., Yang, Y., Wang, Z., Qi, B., Yin, Y., and Li, H. (2015). Development and Characterization of EST-SSR Markers in Taxodium 'zhongshansa'. Plant Mol. Biol. Rep. 33 (6), 1804–1814. doi:10.1007/s11105-015-0875-9
Conesa, A., Gotz, S., Garcia-Gomez, J. M., Terol, J., Talon, M., and Robles, M. (2005). Blast2GO: A Universal Tool for Annotation, Visualization and Analysis in Functional Genomics Research. Bioinformatics 21 (18), 3674–3676. doi:10.1093/bioinformatics/bti610
Dong, M., Wang, Z., He, Q., Zhao, J., Fan, Z., and Zhang, J. (2018). Development of EST-SSR Markers in Larix principis-rupprechtii Mayr and Evaluation of Their Polymorphism and Cross-Species Amplification. Trees 32 (6), 1559–1571. doi:10.1007/s00468-018-1733-9
Du, J., Zhang, Z., Zhang, H., and Junhong, T. (2017). EST-SSR Marker Development and Transcriptome Sequencing Analysis of Different Tissues of Korean Pine (Pinus koraiensis Sieb. et Zucc.). Biotechnol. Biotechnological Equipment 31 (4), 1–11. doi:10.1080/13102818.2017.1331755
Duan, D., Jia, Y., Yang, J., and Li, Z.-H. (2017). Comparative Transcriptome Analysis of Male and Female Conelets and Development of Microsatellite Markers in Pinus bungeana, an Endemic Conifer in China. Genes 8 (12), 393. doi:10.3390/genes8120393
Fu, L. G., Li, N., and Mill, R. R. (1999). “Cephalotaxaceae,” in Flora of China. Editors Z. Y. Wu, and P. H. Raven (Beijing: Science Press), 85–88.
Gadissa, F., Tesfaye, K., Dagne, K., and Geleta, M. (2018). Genetic Diversity and Population Structure Analyses of Plectranthus edulis (Vatke) Agnew Collections from Diverse Agro-Ecologies in Ethiopia Using Newly Developed EST-SSRs Marker System. BMC Genet. 19, 92. doi:10.1186/s12863-018-0682-z
Gao, C., Ren, X., Mason, A. S., Li, J., Wang, W., Xiao, M., et al. (2013). Revisiting An Important Component of Plant Genomes: Microsatellites. Funct. Plant Biol. 40 (7), 645–661. doi:10.1071/fp12325
Gonzalez-Ibeas, D., Blanca, J., Roig, C., González-To, M., Picó, B., Truniger, V., et al. (2007). MELOGEN: An EST Database for Melon Functional Genomics. Bmc Genomics 8, 306. doi:10.1186/1471-2164-8-306
He, D., Zhang, J., Zhang, X., He, S., Xie, D., Liu, Y., et al. (2020). Development of SSR Markers in Paeonia Based on De Novo Transcriptomic Assemblies. Plos One 15 (1), e0227794. doi:10.1371/journal.pone.0227794
He, Z., Su, Y., and Wang, T. (2021). Full-length Transcriptome Analysis of Four Different Tissues of Cephalotaxus oliveri. Ijms 22 (2), 787. doi:10.3390/ijms22020787
Jakobsson, M., and Rosenberg, N. A. (2007). CLUMPP: A Cluster Matching and Permutation Program for Dealing with Label Switching and Multimodality in Analysis of Population Structure. Bioinformatics 23 (14), 1801–1806. doi:10.1093/bioinformatics/btm233
Jia, H., Yang, H., Sun, P., Li, J., Zhang, J., Guo, Y., et al. (2016). De Novo Transcriptome Assembly, Development of EST-SSR Markers and Population Genetic Analyses for the Desert Biomass Willow, Salix psammophila. Sci. Rep. 6, 3959. doi:10.1038/srep39591
Kalia, R. K., Rai, M. K., Kalia, S., Singh, R., and Dhawan, A. K. (2011). Microsatellite Markers: An Overview of the Recent Progress in Plants. Euphytica 177 (3), 309–334. doi:10.1007/s10681-010-0286-9
Lawson, M., and Zhang, L. (2006). Distinct Patterns of SSR Distribution in the Arabidopsis thaliana and rice Genomes. Genome Biol. 7 (2), R14. doi:10.1186/gb-2006-7-2-r14
Li, S., Wang, Z., Su, Y., and Wang, T. (2021). EST‐SSR‐based Landscape Genetics of Pseudotaxus chienii, A Tertiary Relict Conifer Endemic to China. Ecol. Evol. 11 (14), 9498–9515. doi:10.1002/ece3.7769
Li, X., Lin, X., Ruhsam, M., Chen, L., Wu, X., Wang, M., et al. (2019). Development of Microsatellite Markers for the Critically Endangered Conifer Glyptostrobus pensilis (Cupressaceae) Using Transcriptome Data. Silvae Genet. 68 (1), 41–44. doi:10.2478/sg-2019-0007
Li, X., Liu, X., Wei, J., Li, Y., Tigabu, M., and Zhao, X. (2020). Development and Transferability of EST-SSR Markers for Pinus koraiensis from Cold-Stressed Transcriptome Through Illumina Sequencing. Genes 11 (5), 500. doi:10.3390/genes11050500
Li, Y.-C., Korol, A. B., Fahima, T., and Nevo, E. (2004). Microsatellites Within Genes: Structure, Function, and Evolution. Mol. Biol. Evol. 21 (6), 991–1007. doi:10.1093/molbev/msh073
Liu, F.-M., Hong, Z., Yang, Z.-J., Zhang, N.-N., Liu, X.-J., and Xu, D.-P. (2019). De Novo Transcriptome Analysis of Dalbergia odorifera and Transferability of SSR Markers Developed From the Transcriptome. Forests 10 (2), 98. doi:10.3390/f10020098
Liu, Y., Li, S., Wang, Y., Liu, P., and Han, W. (2020). De Novo Assembly of the Seed Transcriptome and Search for Potential EST-SSR Markers for an Endangered, Economically Important Tree Species: Elaeagnus mollis Diels. J. For. Res. 31 (3), 759–767. doi:10.1007/s11676-019-00917-w
Majeed, A., Singh, A., Choudhary, S., and Bhardwaj, P. (2019). Transcriptome Characterization and Development of Functional Polymorphic SSR Marker Resource for Himalayan Endangered Species, Taxus contorta (Griff). Ind. Crops Prod. 140, 111600. doi:10.1016/j.indcrop.2019.111600
Metzgar, D., Bytof, J., and Wills, C. (2000). Selection Against Frameshift Mutations Limits Microsatellite Expansion in Coding DNA. Genome Res. 10 (1), 72–80. doi:10.1101/gr.10.1.72
Miao, Y., Lang, X., Li, S., Su, J., and Wang, Y. (2012). Characterization of 15 Polymorphic Microsatellite Loci for Cephalotaxus oliveri (Cephalotaxaceae), A conifer of Medicinal Importance. Ijms 13 (9), 11165–11172. doi:10.3390/ijms130911165
Ni, L., Schinnerl, J., Bao, M.-F., Zhang, B.-j., Wu, J., and Cai, X.-H. (2016). Two Key Biogenetic Intermediates of Cephalotaxus Alkaloids from Cephalotaxus oliveri and C. lanceolata. Tetrahedron Lett. 57 (47), 5201–5204. doi:10.1016/j.tetlet.2016.10.026
Pan, H.-W., Guo, Y.-R., Su, Y.-J., and Wang, T. (2011). Development of Microsatellite Loci for Cephalotaxus oliveri (Cephalotaxaceae) and Cross-Amplification in Cephalotaxus. Am. J. Bot. 98 (8), E229–E232. doi:10.3732/ajb.1100128
Parida, S. K., Kalia, S. K., Kaul, S., Dalal, V., Hemaprabha, G., Selvi, A., et al. (2009). Informative Genomic Microsatellite Markers for Efficient Genotyping Applications in Sugarcane. Theor. Appl. Genet. 118 (2), 327–338. doi:10.1007/s00122-008-0902-4
Peakall, R., and Smouse, P. E. (2012). GenAlEx 6.5: Genetic Analysis in Excel. Population Genetic Software for Teaching and Research--An Update. Bioinformatics 28 (19), 2537–2539. doi:10.1093/bioinformatics/bts460
Pinosio, S., González-Martínez, S. C., Bagnoli, F., Cattonaro, F., Grivet, D., Marroni, F., et al. (2014). First Insights into the Transcriptome and Development of New Genomic Tools of a Widespread Circum-Mediterranean Tree Species, Pinus halepensis Mill. Mol. Ecol. Resour. 14 (4), 846–856. doi:10.1111/1755-0998.12232
Postolache, D., Leonarduzzi, C., Piotti, A., Spanu, I., Roig, A., Fady, B., et al. (2014). Transcriptome Versus Genomic Microsatellite Markers: Highly Informative Multiplexes for Genotyping Abies alba Mill. And Congeneric Species. Plant Mol. Biol. Rep. 32 (3), 750–760. doi:10.1007/s11105-013-0688-7
Pritchard, J. K., Stephens, M., and Donnelly, P. (2000). Inference of Population Structure Using Multilocus Genotype Data. Genetics 155 (2), 945–959. doi:10.1093/genetics/155.2.945
Qiao, F., Cong, H., Jiang, X., Wang, R., Yin, J., Qian, D., et al. (2014). De Novo Characterization of a Cephalotaxus hainanensis Transcriptome and Genes Related to Paclitaxel Biosynthesis. Plos One 9 (9), e106900. doi:10.1371/journal.pone.0106900
Raymond, M., and Rousset, F. (1995). GENEPOP (Version 1.2): Population Genetics Software for Exact Tests and Ecumenicism. J. Hered. 86, 248–249. doi:10.1093/oxfordjournals.jhered.a111573
Rice, W. R. (1989). Analyzing Tables of Statistical Tests. Evolution 43, 223–225. doi:10.1111/j.1558-5646.1989.tb04220.x
Rosenberg, N. A. (2004). DISTRUCT: A Program for the Graphical Display of Population Structure. Mol. Ecol. Notes 4 (1), 137–138. doi:10.1046/j.1471-8286.2003.00566.x
Ruan, X., Wang, Z., Wang, T., and Su, Y. (2019). Characterization and Application of EST-SSR Markers Developed from the Transcriptome of Amentotaxus argotaenia (Taxaceae), A Relict Vulnerable Conifer. Front. Genet. 10, 1014. doi:10.3389/fgene.2019.01014
Scott, K. D., Eggler, P., Seaton, G., Rossetto, M., Ablett, E. M., Lee, L. S., et al. (2000). Analysis of SSRs Derived from Grape ESTs. Theor. Appl. Genet. 100 (5), 723–726. doi:10.1007/s001220051344
Selkoe, K. A., and Toonen, R. J. (2006). Microsatellites for Ecologists: A Practical Guide to Using and Evaluating Microsatellite Markers. Ecol. Lett. 9 (5), 615–629. doi:10.1111/j.1461-0248.2006.00889.x
Su, Y.-J., Wang, T., Zheng, B., Jiang, Y., Chen, G.-P., Ouyang, P.-Y., et al. (2005). Genetic Differentiation of Relictual Populations of Alsophila pinulosa in Southern China Inferred from cpDNA trnL-F Noncoding Sequences. Mol. Phylogenet. Evol. 34 (2), 323–333. doi:10.1016/j.ympev.2004.10.016
Taheri, S., Abdullah, T. L., Rafii, M. Y., Harikrishna, J. A., Werbrouck, S. P. O., Teo, C. H., et al. (2019). De Novo Assembly of Transcriptomes, Mining, and Development of Novel EST-SSR Markers in Curcuma alismatifolia (Zingiberaceae Family) Through Illumina Sequencing. Sci. Rep. 99, 3047. doi:10.1038/s41598-019-53129-x10.1038/s41598-019-39944-2
Taheri, S., Lee Abdullah, T., Yusop, M., Hanafi, M., Sahebi, M., Azizi, P., et al. (2018). Mining and Development of Novel SSR Markers Using Next Generation Sequencing (NGS) Data in Plants. Molecules 23 (2), 399. doi:10.3390/molecules23020399
Tong, Y. W., Lewis, B. J., Zhou, W. M., Mao, C. R., Wang, Y., Zhou, L., et al. (2020). Genetic Diversity and Population Structure of Natural Pinus koraiensis Populations. Forests 11 (1), 39. doi:10.3390/f11010039
Ueno, S., Moriguchi, Y., Uchiyama, K., Ujino-Ihara, T., Futamura, N., Sakurai, T., et al. (2012). A Second Generation Framework for the Analysis of Microsatellites in Expressed Sequence Tags and the Development of EST-SSR Markers for a Conifer, Cryptomeria japonica. Bmc Genomics 13, 136. doi:10.1186/1471-2164-13-136
Van Oosterhout, C., Hutchinson, W. F., Wills, D. P. M., and Shipley, P. (2004). Micro-Checker: Software for Identifying and Correcting Genotyping Errors in Microsatellite Data. Mol. Ecol. Notes 4, 535–538. doi:10.1111/j.1471-8286.2004.00684.x
Varshney, R. K., Graner, A., and Sorrells, M. E. (2005). Genic Microsatellite Markers in Plants: Features and Applications. Trends Biotechnol. 23 (1), 48–55. doi:10.1016/j.tibtech.2004.11.005
Vieira, M. L. C., Santini, L., Diniz, A. L., and Munhoz, C. d. F. (2016). Microsatellite Markers: What They Mean and Why They Are So Useful. Genet. Mol. Biol. 39 (3), 312–328. doi:10.1590/1678-4685-gmb-2016-0027
Wagner, S., Gerber, S., and Petit, R. J. (2012). Two Highly Informative Dinucleotide SSR Multiplexes for the Conifer Larix decidua (European Larch). Mol. Ecol. Resour. 12 (4), 717–725. doi:10.1111/j.1755-0998.2012.03139.x
Wang, C. B., Wang, T., and Su, Y. J. (2014). Phylogeography of Cephalotaxus oliveri (Cephalotaxaceae) in Relation to Habitat Heterogeneity, Physical Barriers and the Uplift of the Yungui Plateau. Mol. Phylogenet. Evol. 80, 205–216. doi:10.1016/j.ympev.2014.08.015
Wang, T., Wang, Z., Xia, F., and Su, Y. (2016). Local Adaptation to Temperature and Precipitation in Naturally Fragmented Populations of Cephalotaxus oliveri, An Endangered Conifer Endemic to China. Sci. Rep. 6, 25031. doi:10.1038/srep25031
Wei, W., Qi, X., Wang, L., Zhang, Y., Hua, W., Li, D., et al. (2011). Characterization of the Sesame (Sesamum indicum L.) Global Transcriptome Using Illumina Paired-End Sequencing and Development of EST-SSR Markers. Bmc Genomics 12, 451. doi:10.1186/1471-2164-12-451
Xiang, X., Zhang, Z., Wang, Z., Zhang, X., and Wu, G. (2015). Transcriptome Sequencing and Development of EST-SSR Markers in Pinus dabeshanensis, an Endangered Conifer Endemic to China. Mol. Breed. 35 (8), 158. doi:10.1007/s11032-015-0351-0
Xiao, S., Mu, Z.-Q., Cheng, C.-R., and Ding, J. (2019). Three New Biflavonoids From the Branches and Leaves of Cephalotaxus oliveri and Their Antioxidant Activity. Nat. Product. Res. 33 (3), 321–327. doi:10.1080/14786419.2018.1448817
Xing, W., Liao, J., Cai, M., Xia, Q., Liu, Y., Zeng, W., et al. (2017). De Novo assembly of Transcriptome from Rhododendron latoucheae Franch. Using Illumina Sequencing and Development of New EST-SSR Markers for Genetic Diversity Analysis in Rhododendron. Tree Genet. Genomes 13 (53), 1–15. doi:10.1007/s11295-017-1135-y
Xu, R., Wang, Z., Su, Y., and Wang, T. (2020). Characterization and Development of Microsatellite Markers in Pseudotaxus chienii (Taxaceae) Based on Transcriptome Sequencing. Front. Genet. 11, 1–15. doi:10.3389/fgene.2020.574304
Yeh, F., Yang, R., and Boyle, T. (1999). POPGENE Version 1.32 Microsoft Windows-Based Freeware for Populations Genetic Analysis. Edmonton: University of Alberta.
Zalapa, J. E., Cuevas, H., Zhu, H., Steffan, S., Senalik, D., Zeldin, E., et al. (2012). Using Next-Generation Sequencing Approaches to Isolate Simple Sequence Repeat (SSR) Loci in the Plant Sciences. Am. J. Bot. 99 (2), 193–208. doi:10.3732/ajb.1100394
Zeng, J., Chen, J., Kou, Y., and Wang, Y. (2018). Application of EST-SSR Markers Developed From the Transcriptome of Torreya grandis (Taxaceae), A Threatened Nut-Yielding Conifer Tree. Peerj 6, e5606. doi:10.7717/peerj.5606
Zhang, G., Sun, Z., Zhou, D., Xiong, M., Wang, X., Yang, J., et al. (2015). Development and Characterization of Novel EST-SSRs From Larix gmelinii and Their Cross-Species Transferability. Molecules 20 (7), 12469–12480. doi:10.3390/molecules200712469
Keywords: Cephalotaxus oliveri, transcriptome, EST-SSRs, genetic diversity, population structure, transferability
Citation: Liu H, Zhang Y, Wang Z, Su Y and Wang T (2021) Development and Application of EST-SSR Markers in Cephalotaxus oliveri From Transcriptome Sequences. Front. Genet. 12:759557. doi: 10.3389/fgene.2021.759557
Received: 16 August 2021; Accepted: 25 October 2021;
Published: 17 November 2021.
Edited by:
Alison G Nazareno, Federal University of Minas Gerais, BrazilReviewed by:
Leilton Willians Luna, Federal University of Pará, BrazilLoreta Brandão de Freitas, Federal University of Rio Grande do Sul, Brazil
Copyright © 2021 Liu, Zhang, Wang, Su and Wang. This is an open-access article distributed under the terms of the Creative Commons Attribution License (CC BY). The use, distribution or reproduction in other forums is permitted, provided the original author(s) and the copyright owner(s) are credited and that the original publication in this journal is cited, in accordance with accepted academic practice. No use, distribution or reproduction is permitted which does not comply with these terms.
*Correspondence: Yingjuan Su, c3V5akBtYWlsLnN5c3UuZWR1LmNu; Ting Wang, dGluZ3dhbmdAc2NhdS5lZHUuY24=
†These authors have contributed equally to this work