 Pierce Rafter
 Isobel Claire Gormley
 Andrew C. Parnell
 Saeid Naderi
 Donagh P. Berry
- 1Animal & Grassland Research and Innovation Centre, Fermoy, Ireland
- 2School of Mathematics and Statistics, University College Dublin, Dublin, Ireland
- 3Hamilton Institute, Maynooth University, Maynooth, Ireland
- 4Irish Cattle Breeding Federation, Bandon, Ireland
The relative contributions of both copy number variants (CNVs) and single nucleotide polymorphisms (SNPs) to the additive genetic variance of carcass traits in cattle is not well understood. A detailed understanding of the relative importance of CNVs in cattle may have implications for study design of both genomic predictions and genome-wide association studies. The first objective of the present study was to quantify the relative contributions of CNV data and SNP genotype data to the additive genetic variance of carcass weight, fat, and conformation for 945 Charolais, 923 Holstein-Friesian, and 974 Limousin sires. The second objective was to jointly consider SNP and CNV data in a least absolute selection and shrinkage operator (LASSO) regression model to identify genomic regions associated with carcass weight, fat, and conformation within each of the three breeds separately. A genomic relationship matrix (GRM) based on just CNV data did not capture any variance in the three carcass traits when jointly evaluated with a SNP-derived GRM. In the LASSO regression analysis, a total of 987 SNPs and 18 CNVs were associated with at least one of the three carcass traits in at least one of the three breeds. The quantitative trait loci (QTLs) corresponding to the associated SNPs and CNVs overlapped with several candidate genes including previously reported candidate genes such as MSTN and RSAD2, and several potential novel candidate genes such as ACTN2 and THOC1. The results of the LASSO regression analysis demonstrated that CNVs can be used to detect associations with carcass traits which were not detected using the set of SNPs available in the present study. Therefore, the CNVs and SNPs available in the present study were not redundant forms of genomic data.
Introduction
Carcass value is an important component of both beef-on-beef (Connolly et al., 2016) and beef-on dairy (Berry et al., 2019) breeding objectives. The use of genomic data in estimating breeding values for cattle has the potential to further increase the efficiency of beef breeding strategies by shortening the generation interval thereby accelerating genetic gain (Meuwissen et al., 2001). Genomic predictions and genome-wide association studies in cattle tend to use single nucleotide polymorphism (SNP) data, and increasingly (imputed) whole genome sequence, as the genomic features (Gutierrez-Reinoso et al., 2021). While multiple genome-wide association studies of carcass traits in cattle have successfully identified genomic regions associated with carcass metrics using SNP genotype data (de Oliveira Silva et al., 2017; Hay and Roberts, 2018; Purfield et al., 2019), SNP genotypes are not the only type of genomic data that can be derived from SNP arrays. Copy number variants (CNVs) are a type of genetic variant formed by deletion or duplication of genomic DNA (Feuk et al., 2006); typically CNVs are defined to have a minimum genomic length of between 50 bp (Mills et al., 2011) and 1 kb (Feuk et al., 2006). Duplications or deletions below the minimum genomic length threshold of a CNV are usually referred to as insertion or deletions (InDels) (Werdyani et al., 2017). Several CNV association analyses in cattle have identified CNVs associated with important traits, including meat quality traits (da Silva et al., 2016), carcass merit (Zhou et al., 2016), and milk yield (Xu et al., 2014; Prinsen et al., 2017). While these CNV association analyses have identified genomic regions associated with important traits in cattle using only CNV data, it is not always clear whether those same genomic regions could have been detected using another type of genetic marker such as SNPs. A fundamental principle of genome-wide association studies is that linkage disequilibrium exists between the genetic markers and the causal mutation(s) affecting the trait of interest (Balding et al., 2006). Adding CNV information to existing SNP genotype data in genomic evaluations or genome-wide association analyses may not contribute any new information if the CNVs are in strong linkage disequilibrium with genotyped SNPs. Previous studies estimate that approximately 75% of deletion CNVs are in linkage disequilibrium with flanking SNP genotypes (Xu et al., 2014; Hay et al., 2018). However, imputation analyses demonstrated that CNVs cannot be consistently imputed with high reliability from flanking SNP haplotypes (Handsaker et al., 2015; Rafter et al., 2020); this implies that CNVs are frequently not in linkage disequilibrium with flanking SNP haplotypes. Given that there is some degree of incomplete linkage between CNVs and SNP genotypes, it could mean that genomic analyses that only use SNP genotypes as genetic markers may not detect associations where the causal variant is a CNV. Hay et al. (2018) carried out the first genomic predictions of carcass traits in cattle using both SNP and CNV data and found that, for some traits, exploiting CNV information increased the accuracy of the genomic predictions. While this study by Hay et al. (2018) did not directly calculate the additive genetic variance accounted for by CNVs, it suggests that CNVs do account for some of the additive genetic variance of carcass traits which cannot be accounted for by SNP data.
The objective of the present study was to quantify the relative contribution of CNV data and SNP genotype data to the additive genetic variance of carcass traits in cattle. A secondary objective was to jointly evaluate SNP genotypes and called CNVs in a least absolute selection and shrinkage operator (LASSO) regression model to identify genomic regions associated with carcass traits in cattle.
Materials and Methods
Genotype Data
All animals in the dataset were genotyped on the Illumina BovineHD (Illumina Inc. San Diego, CA) SNP genotype array (777,962 SNPs). The chromosome and positions of the SNPs were taken from the UMD3.1. (Zimin et al., 2009) assembly of the cattle genome. Animals which had less than 95% of their SNPs called were discarded from the dataset. Similarly, SNPs with a call-rate less than 95% were discarded, as were SNPs on the X and Y chromosomes, or SNPs without a recorded chromosome or position. A further 1,611 SNPs that deviated from expected Mendelian inheritance patterns in more than 2% of parent-progeny pairs (Purfield et al., 2015) were also discarded from the final dataset; these SNPs were detected using the 1,477 parent-progeny pairs in the dataset. After genotype edits, the dataset consisted of 1,324 Holstein-Friesians, 981 Charolais, and 1,129 Limousins, each with 712,555 SNPs.
Phenotype Data
Estimated breeding values (EBVs) for carcass weight, carcass fat, and carcass conformation were obtained for each genotyped animal in the dataset from the January 2019 national genetic evaluation of the Irish Cattle Breeding Federation (ICBF) database (Bandon, Co. Cork). Each of the animals in the present study were sires. The EBVs of these sires were estimated from their descendants; the EBVs of the sires were the equivalent to >150,000 effective phenotypic records. Carcass weight is the weight of the animal, in kg, after organs, visceral fat, limbs, and head have been removed (Englishby et al., 2016). Carcass fat and carcass conformation scores were obtained from video imaging analysis; these scores are based on the 15-point EU beef classification system (Pabiou et al., 2011). The EBVs of each of the three carcass traits were deregressed using Mix99 software (Stranden and Lidauer, 1999) using the Secant method (Stranden and Mantysaari, 2010). The effective record contribution of each animal in the population was calculated using the method described by Harris and Johnson (1998). Animals with an effective record contribution of <1 were excluded from the final dataset. The number of animals available in each breed for each of the three carcass traits after edits is in Table 1.
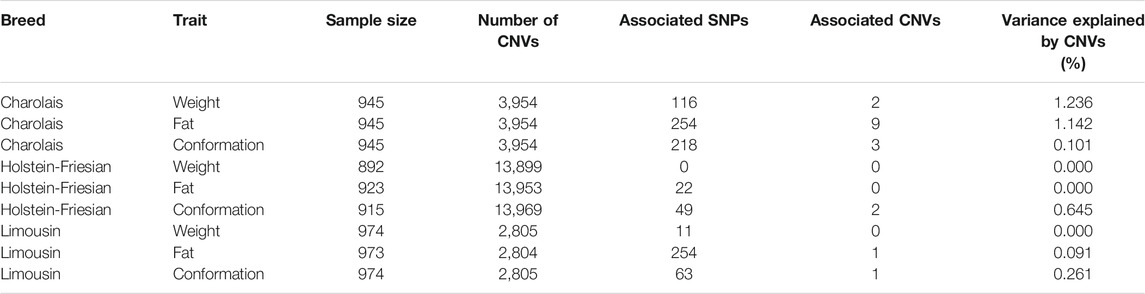
TABLE 1. The number of animals and copy number variants (CNVs) available for each breed and trait along with the number of SNPs and CNVs associated with each of the three carcass traits within breed, and the percentage of the genetic variance accounted for by the associated CNVs identified by the LASSO regression analysis for each breed and trait.
Copy Number Variant Detection
Copy number variants were called from the edited high-density SNP array (712,555 autosomal SNPs) data using PennCNV (Wang et al., 2007) and QuantiSNP (Colella et al., 2007). PennCNV and QuantiSNP were both used separately to call CNVs from each animal in the population; CNVs called by either PennCNV or QuantiSNP which contained at least 3 SNPs were retained in the dataset. Diskin et al. (2008) reported that the guanine-cytosine (GC) content of DNA biases CNV detection from SNP array data. An adjustment for GC bias in CNV detection was applied by both QuantiSNP and PennCNV, the GC content of the genome was calculated using the UMD3.1 assembly of the cattle genome, compiled as of June 2014. A CNV was considered to have been called by both PennCNV and QuantiSNP when the endpoints of the CNV called by one of the algorithms was within 1 SNP of the endpoints called by the other algorithm. A single SNP difference in endpoint identification between PennCNV and QuantiSNP was allowed for because if there is a difference between the true endpoint of a CNV and the called endpoint, the called endpoint is typically only a single SNP from the true endpoint of the CNV (Colella et al., 2007; Dellinger et al., 2010). Copy number variants called by either PennCNV or QuantiSNP were included in the dataset; CNVs called by both algorithms from the same animal were not double counted. Finally, CNVs had to be present in at least 3 animals within breed to be included in the final dataset. The final number of CNVs available for each breed and trait after edits is in Table 1.
Genomic Relationship Matrix
Genomic relationship matrices (GRMs) were calculated separately for the CNV data and the SNP genotype data within each of the three breeds using method 1 described in VanRaden (2008):
where M is the matrix of genetic marker genotypes recoded as -1, 0, 1 representing the homozygote, heterozygote, and the other homozygote, respectively, P is a matrix of allele frequencies for each genetic marker in the dataset, ith column vector of P is given by 2(
For each breed, the CNV-derived GRM was calculated twice using two separate procedures. In the first procedure, double-deletions and double-duplications were recoded as -1, single-deletions and single-duplications were recoded as 0, and the normal state (i.e. the absence of a CNV) was recoded as 1. In the case of mixed-CNVs (CNVs which are present as both deletions and duplications in the population), in order to avoid treating deletions and duplications as identical variants, each mixed-CNV was treated as two distinct loci, one to represent the deletions and the other to represent the duplications. For the deletion locus, duplications were recoded as normal state (i.e. no CNV); similarly for the duplication locus, any deletions were recoded as normal state. In the second procedure to calculate the CNV-derived GRM, mixed-CNVs were not treated as two distinct loci but instead all deletions were recoded as -1, the normal state was recoded as 0, and all duplications were recoding as 1.
Population Structure
A GRM of the entire population (i.e. the combined Charolais, Holstein-Friesian, and Limousin populations) was constructed using the imputed SNP genotype data (712,555 SNPs) for all available animals. Principal components analysis of this GRM was used to determine population substructure within the entire population of available animals (Patterson et al., 2006; Kelleher et al., 2017). Separately, principal components analysis was also carried out individually on the SNP-derived GRMs for the Charolais, Holstein-Friesian, and Limousin populations.
Variance Components Analysis
To calculate the relative contribution of CNV data and SNP genotype data to variance in the deregressed EBVs for each animal in the population, the variance explained by a SNP-derived GRM and the variance explained by a CNV-derived GRM were jointly considered in a linear mixed model. The fitted model was:
where dEBV was a vector of deregressed EBVs of each animal in the population. The intercept of the model was denoted by μ and was treated as a fixed effect, the vector a was a random effect with distribution N(0,
Linear mixed models with a single random effect were also used to estimate the total additive genetic variance that can be explained by the SNP-derived GRM, the CNV-derived GRM, and the GRM derived from the combined SNP and CNV data. The fitted model was:
where dEBV was a vector of deregressed EBVs, μ was the intercept term which was treated as a fixed effect, a was the polygenic random effect in the model which had the distribution N(0,G
The equation used to calculate the weighting on each deregressed EBV is presented by Garrick et al. (2009):
The heritability of each trait was denoted by h2, the reliability of the EBV for the ith animal was given by ri2. The value of c, which was the proportion of genetic variation not explained by the model, was set to 0.9 for each trait as per Purfield et al. (2015).
A log-likelihood ratio test was used to compare the model with the two random genetic effects versus a model with only one random effect. The log-likelihood ratio test was done separately for each trait and breed to determine if the CNV-derived GRM can account for any variance in the random polygenic effect between animals. All mixed models were solved using the software suit ASREML 4.2 (Gilmour et al., 2015).
Separately, a two-step procedure was also undertaken to quantify the additive genetic variance of carcass traits attributable to the CNV-derived GRM after accounting for the effect of the SNP-derived GRM. The first step of this procedure was to model the deregressed EBVs using a linear mixed model in which the covariance structure of the random effect was reflected by the SNP-derived GRM. In the second step of this procedure, the residual term from this first step (after adding back the intercept values) was used as the dependent variable in a second linear mixed model. The fitted model was:
where E is the sum of the residual and intercept term from the first model, μ was the intercept term which was treated as a fixed effect, a was the random effect vector which had the distribution N(0,
The variance component of the random effect of the second model,
Association Analyses
A LASSO regression model was conducted to jointly evaluate the association between individual SNPs and CNVs and the deregressed carcass EBVs. The principal components of the SNP-derived GRM and the CNV-derived GRM were also included in the model as covariates to account for population stratification. The LASSO models were solved separately for each breed and trait using the R package “glmnet” (Friedman et al., 2010). Only the SNPs and CNVs with non-zero coefficients in the LASSO model were considered to be associated with the trait. The equation for the LASSO model was:
The dependent variable, y, was the weighted deregressed EBVs for each animal. The matrix X consisted of the full set of SNPs and CNVs, the principal components the SNP and CNV GRMs, and an intercept term. The vector β was the effect of each independent variable in matrix X, λ was the penalty factor in the model, and the solutions,
Since none of the CNVs detected had at least 5 animals of a given breed carrying either a double-deletion or a single-deletion, the identified double-deletions were assumed as a single-deletion and were collapsed into a single deletion class. Similarly, all duplications were collapsed into a single duplication class and considered as single-duplications because there was no CNV with at least 5 animals within breed carrying either a double-duplication or a single-duplication. The number of animals and CNVs available for each breed and trait is in Table 1.
The LASSO model is a biased estimator of the regression coefficients for the associated genetic markers due to the inclusion of the penalty term in the LASSO model (Hastie et al., 2015). To obtain unbiased estimates of the regression coefficients, all of the genetic markers associated within breed for a particular trait were evaluated concurrently in a linear regression model without the penalty term used in the LASSO model; this process was carried out separately within breed for each trait analysed. This two-step procedure of identifying associated variants using the LASSO model and then obtaining unbiased estimates of the regression coefficients for the associated variants using simple linear regression is known as the relaxed-LASSO (Meinhausen, 2007; Hastie et al., 2015). The proportion of the genetic variance explained by associated CNVs was calculated separately for each CNV using the regression coefficients obtained from the unbiased model with the following equation:
where
To compare the results of the LASSO analysis with a more traditional genome-based association analysis, each of the associated variants identified by the LASSO analysis were individually re-analysed, within breed, using a linear mixed model approach. Along with an intercept term and the SNP genotype, the direct additive genetic effect of the animal was accounted for by fitting the SNP-derived GRM. The association of the genetic variant with the trait of interest was tested using a t-test under the null hypothesis that there was no association between the genetic variant and the trait of interest.
Quantitative Trait Loci
For each associated SNP and CNV, a quantitative trait locus (QTL) region was designated as 50 kb upstream and 50 kb downstream of the SNP or CNV. When an associated SNP or CNV was located within 50 kb of another associated SNP or CNV, respectively, then they were merged into the same QTL; the boundary of these QTLs were 50 kb upstream and 50 kb downstream of the outermost variants in the QTL. The genomic position for each associated SNP and CNV were updated to the genomic positions given in the ARS-UCD1.2 assembly of the cattle genome (Rosen et al., 2020) in order to identify genes, as per the Ensembl bovine genome browser (http://ensembl.org), which overlapped in genomic position with each of the QTLs.
Gene set enrichment analysis was performed on the set of genes that overlapped with the QTL regions of each of the associated CNVs and SNPs identified by the LASSO regression analysis using the Database for Annotation, Visualisation, and Integrated Discovery (DAVID). This enrichment analysis was carried out separately per breed for the QTLs associated with each of the three traits. The DAVID algorithm identifies clusters of genes, assigns an enrichment score for the gene cluster, and gives a p-value for the observed enrichment score under the null hypothesis that there is no gene set enrichment.
Results
The population structure of the entire population was examined using principal components analysis; the first principal component accounted for 6.2% of the total variance in the SNP-derived GRM and the second principal component accounted for 3.3% of the total variance in the SNP-derived GRM (Supplementary Figure S1). The top principal component of SNP-derived GRM for the Holstein-Friesians accounted for approximately 4.1% of the total variance. This was more than three times greater than the percentage variance explained by the top principal component of the SNP-derived GRMs for either the Charolais or the Limousin populations.
Variance Components Analysis
After edits 13,969, 3,954, and 2,805 CNVs were available to calculate the CNV-derived GRMs for the Holstein-Friesian, Charolais, and Limousin populations, respectively, whereas for each breed, 712,555 SNPs were used to calculate the SNP-derived GRMs. For each breed, the CNV-derived GRM was calculated twice using the two separate procedure described in the methods. The variance components analysis was conducted separately for these two sets of CNV-derived GRMs; there was no difference in the results of the variance components analysis using either of these two sets of CNV-derived GRMs. The proportion of the variance accounted for by the SNP-derived GRM when considered in a linear mixed model was between 0.032 and 0.291 for the three carcass traits analysed in the three breeds (Supplementary Table S1). In comparison, when considered singly, the CNV-derived GRM explained almost none of the variance in the deregressed EBVs; this was the case for all traits in all breeds (Supplementary Table S1). When the CNV-derived GRM and SNP-derived GRM were considered jointly in the same model, the CNV-derived GRM did not account for any of the variance in the deregressed EBVs for any trait in all three breeds. The marginal contribution of the CNV-derived GRM to the additive genetic variance of the carcass traits was also calculated using a stepwise approach in which the CNV-derived GRM was used to model the random polygenic effect of each animal after accounting for the effect of the SNP-derived GRM. The conclusion from this approach was the same as that from the joint evaluation of the CNV-derived GRM and SNP-derived GRM. Similarly, for all traits and all breeds, no difference in fit existed between a model that accounted for the polygenic random effect using only the SNP-derived GRM, or a model which accounted for the polygenic random effect using a single GRM derived from the combined SNP and CNV datasets.
Association Analyses
A total of 987 SNPs and 18 CNVs were associated with at least one of the three carcass traits in at least one of the three breeds analysed. The number of CNVs and SNPs associated with each of the three carcass traits per breed is given Table 1. None of the 18 associated CNVs were located within 50 kb of another associated CNV; hence there were 18 distinct CNV QTLs. The 987 SNPs formed 699 distinct SNP QTLs. One QTL harboured both an associated SNP and an associated CNV; therefore, overall 717 QTLs were identified in the present study. There was no gene set enrichment for any biological functions among the sets of genes which overlapped with the QTLs associated with each of the carcass traits within breed. A list of all 18 CNV QTLs is given in Table 2; 15 of the 18 CNV QTLs overlapped with a previously reported CNV region as per the Ensembl bovine genome browser. For each of the three carcass traits, the associated CNVs identified by the LASSO regression analysis cumulatively accounted for between 0.000% (carcass weight in the Holstein-Friesians) and 1.236% (carcass weight in the Charolais) of the total genetic variance. The genetic variance explained by the associated CNVs for each of the three carcass traits within breed is in Table 1. None of the CNVs were associated with more than one trait within breed or across breeds. Furthermore, none of the CNVs were associated with the same trait in more than one breed even though 10 of the 18 associated CNVs were present in more than one breed.
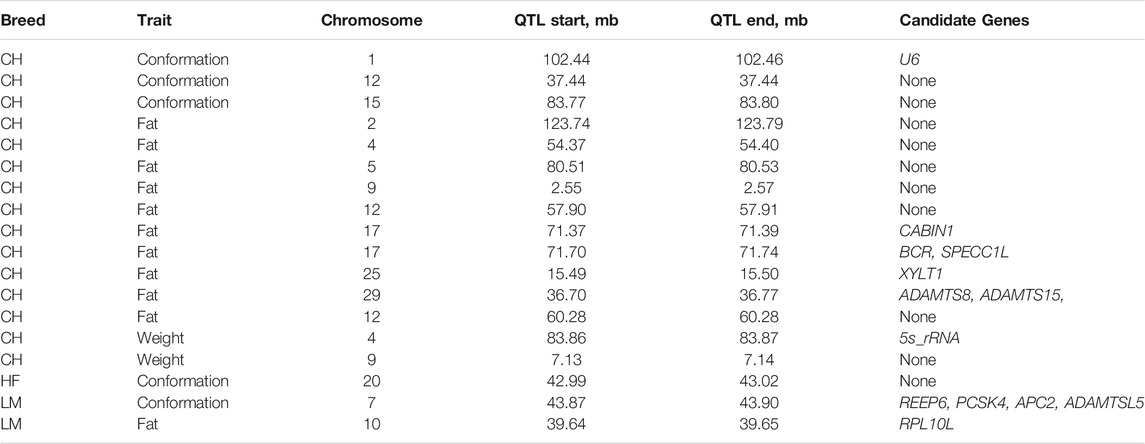
TABLE 2. Chromosome, position, and candidate gene(s) for each copy number variant (CNV) quantitative trait locus (QTL) associated with each of the carcass traits in Charolais (CH), Holstein-Friesian (HF), and Limousin (LM). When no genes overlapped the QTL region none is reported in the candidate gene column.
The QTL with an associated CNV and an associated SNP was associated with carcass fat in the Charolais and was located on chromosome 29 between 36.70 and 36.77 Mb. The CNV in this QTL was a duplication present in 8 animals and the associated SNP in this QTL, rs109364153, was located within the genomic position of the associated CNV; this QTL overlapped in genomic position with a single gene which was the RNA gene bta-mir-584-7. Single nucleotide polymorphisms close to this QTL region were also associated with carcass conformation and weight in the Limousins.
Twenty-eight SNP QTLs were associated with more than one trait within breed (Figure 1) and another 4 SNP QTLs were associated with the same trait in more than one breed (Figure 2). In the Charolais, the QTL with largest number of associated SNPs contained 8 SNPs associated with carcass fat. This QTL was located on chromosome 2 between 6.25 and 6.29 Mb and SNPs within this genomic region were also associated with carcass conformation and carcass weight in the Charolais. Similarly in the Limousins, a SNP QTL also associated with carcass fat was located on chromosome 2 between 6.14 and 6.25 Mb and contained 18 associated SNPs. In the Limousins, this QTL had the greatest number of SNPs associated with any trait; SNPs in the genomic region of this QTL were also associated with carcass conformation in the Limousins. The protein coding gene MSTN is the most likely candidate gene for these two QTLs identified in the Limousins and the Charolais. None of the 26 SNPs in the genomic region of these two QTLs were associated with any of the three carcass traits in the Holstein-Friesians, even though each of the 26 SNPs were segregating in the Holstein-Friesians. A list of the top five SNP QTLs associated with each of the three carcass traits within breed is given in Supplementary Tables S2–S4.
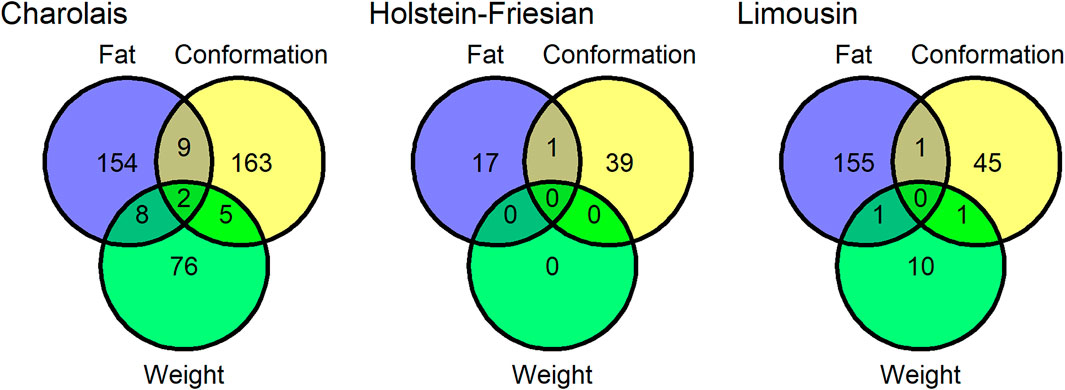
FIGURE 1. The number quantitative trait loci (QTLs) associated with carcass conformation, carcass fat and carcass weight in the Charolais, Holstein-Friesians, and Limousins. Quantitative trait loci that overlapped in genomic position with another QTL associated with a different trait in the same breed were considered a single QTL shared between the two traits.
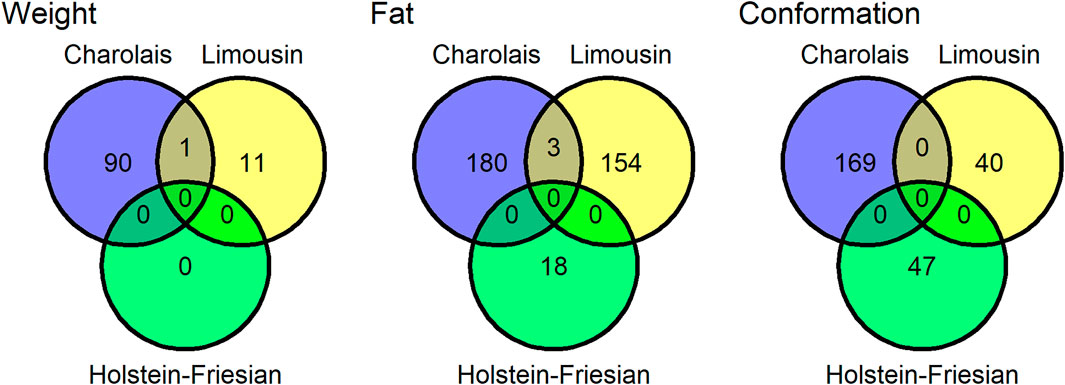
FIGURE 2. The number quantitative trait loci (QTLs) associated with carcass weight, carcass fat, and carcass conformation for the Charolais, Holstein-Friesian, and Limousin populations. Quantitative trait loci that overlapped in genomic position with another QTL associated with the same trait in another breed were considered a single QTL shared between the two breeds.
All of the associated SNPs and CNVs were re-analysed singly using a linear mixed model approach; the nominal p-values for each of the tested variants was between 0.027 and 1.4 × 10⁻¹⁵ (Supplementary Figure S2).
Discussion
Copy number variants have been documented to be associated with several performance traits in cattle such as meat quality (da Silva et al., 2016), carcass merit (Zhou et al., 2016), and milk yield (Xu et al., 2014; Prinsen et al., 2017). While these studies demonstrate that CNVs can be used to identify genomic regions associated with important traits in cattle, it is often uncertain whether CNVs uniquely identify these genomic regions or if SNP genotype data could have been used to detect the same genomic regions. Based on a population of 2,230 Nellore cattle, Hay et al. (2018) performed the first genomic predictions of carcass traits in cattle that used both SNP and CNV data; they found that, for some traits, the CNV data improved the accuracy of genomic predictions. However, it is still unclear how additive genetic variance is partitioned between CNVs and SNPs, or if CNV data can identify genomic regions in a genome-wide association analysis that would otherwise be undetected if SNP genotypes were the only genetic markers used in the analysis.
Based on the top two principal components of the SNP-derived GRM for the entire population (Supplementary Figure S1), two closely related clusters of animals existed in the Holstein-Friesian population, whereas for the Charolais and Limousin populations each breed consisted of only a single cluster of animals. This indicated that the Holstein-Friesian population in the present study was less homogeneous than either the Charolais or the Limousin populations which is not unexpected given that both Holstein and Friesian founder animals will have contributed to the Holstein-Friesian population in the present study. This may account for the greater number of observed CNVs in the Holstein-Friesian population when compared to the Charolais or the Limousin populations.
Copy Number Variant Association Analysis
Although the CNV-derived GRM could not account for any additive genetic variation in the three carcass traits, the LASSO regression model identified 18 CNVs associated with at least one of the three carcass traits across the three breeds analysed. While the results of LASSO analysis and the CNV-derived GRM analysis appear to be in opposition, in reality the associated CNVs identified by the LASSO regression analysis only explained between 0.000 and 1.236% of the total genetic variance for each of the three carcass traits analysed (Table 1). So the actual difference in the genetic variance explained by the variance components analysis and the LASSO regression analysis was small. Considering that the proportion of the genetic variance explained by the CNVs was small, it may be the case that a CNV-derived GRM is unable to detect this genetic variance when jointly evaluated in a model with a SNP-derived GRM. This may also explain why Hay et al. (2018) found that exploiting CNV information improved the accuracy of genomic predictions for some carcass traits because, in that study, the CNVs were modelled as fixed effects in the genomic prediction models. The LASSO model might be better suited at detecting the genetic variance explained by CNVs because CNVs which tend to have low population frequency (Supplementary Figure S3) and low reproducibility may be preferentially removed from the LASSO model. Genetic markers with low population frequencies have less power to detect associations in an association analysis (Bush and Moore, 2012) and errors in genotype assignment or CNV copy number assignment also reduce the power to detect associations when the error is independent of the phenotypic value (Pompanon et al., 2005; Cook et al., 2014; Hou et al., 2017). In a LASSO model, genetic markers with no detectable effect tend to be eliminated from the model (Hastie et al., 2015); therefore those CNVs which have no detectable effect should be preferentially removed from the LASSO model. Hence the LASSO model may be better suited to accounting for the genetic variance explained by CNVs rather than the variance components analysis.
Several of the associated CNVs overlapped in genomic position with genes and CNVs that have previously been associated with carcass traits in cattle. For instance, a deletion present in 3 animals in the Charolais, located on chromosome 5 between 80.51 and 80.76 Mb, was approximately 170 kb from FAR2. FAR2 is a gene related to fatty acid synthesis in mammals (Cheng et al., 2004) and has been associated with meat quality in Hanwoo cattle (Lim et al., 2016). A duplication CNV present in 4 animals in the Charolais population of the present study was associated with carcass fat and was located approximately 390 kb from the RNA gene Metazoa_SRP. Differential expression of this gene in Qinchuan cattle is related to the development of skeletal muscle (Li et al., 2016). A CNV located on chromosome 17 between 71.37 Mb and 71.39 Mb was associated with carcass fat in the Charolais and overlapped with CNVs identified in another study that were associated with stature in Holstein cattle (Sassi et al., 2016). The QTL on chromosome 17 between 71.37 Mb and 71.39 Mb was located approximately 310 kb from the protein coding gene PRAME which has previously been associated with carcass yield in a CNV association study (Zhou et al., 2016). The CNV on chromosome 17 between 71.37 Mb and 71.39 Mb was also located 340 kb from a second CNV between 71.70 Mb and 71.74 Mb which was also associated with carcass fat in the Charolais in the present study; both CNVs were called in different cohorts of animals. Furthermore, no other CNVs existed in the Charolais, Holstein-Friesian, or Limousin populations which overlapped the genomic position of both CNVs. This suggests that these two CNVs, despite being in close genomic proximity, were two distinct CNV regions. Given that some of the associated CNVs detected in the present study overlapped with (or were flanked by) genes and CNVs associated with carcass and related traits in cattle, it suggests that at least some of the 18 associated CNVs were true associations.
In addition to these genes which have previously been associated with carcass traits in cattle, several novel candidate genes also overlapped with CNV QTLs. The protein coding gene PTPRU was located approximately 450 kb from a CNV QTL on chromosome 2 between 123.74 and 123.79 Mb; this CNV was associated with carcass fat in the Charolais and none of the associated SNPs identified in the present study overlapped in genomic position with this QTL. This gene has not previously been associated with carcass traits in cattle although it has been associated with feed conversion rate in pigs (Horodyska et al., 2017) and wither height in Yaks (Jia et al., 2019).
Single Nucleotide Polymorphism Association Analysis
The fact that the Charolais and the Limousins shared more QTLs than either breed shared with the Holstein-Friesians substantiates the known shared genetic ancestry of these breeds (Bouquet et al., 2011; Kelleher et al., 2017). Several of the QTLs that were shared between breeds also overlapped in genomic position with genes which have previously been associated with carcass traits in cattle. The protein coding gene RSAD2 overlapped in genomic position with a SNP QTL located on chromosome 11 at 90.11 Mb which was associated with carcass fat in the Charolais and the Limousins. This gene has previously been associated with carcass traits in Nellore cattle (Silva-Vignato et al., 2017) and width of withers in Hereford cattle (Doyle et al., 2020).
In addition to the candidate genes which have previously been identified in genome-wide association studies of carcass traits in cattle, several novel candidate genes were also identified in the present study. The protein coding gene USP24 was located in close genomic proximity (<370 kb) to two SNP QTLs. The first SNP QTL was located on chromosome 3 between 90.89 and 90.90 Mb and was associated with carcass conformation in the Charolais; the second SNP QTL was located on chromosome 3 at 90.76 Mb and was associated carcass conformation in the Limousins. This gene has previously been associated with milk yield and mastitis resistance in cattle (Cai et al., 2020) and growth traits in pigs (Xiong et al., 2015), but has not previously been associated with carcass traits in cattle. The protein coding gene ACTN2 was located 230 kb from a SNP positioned on chromosome 28 at 9.09 Mb which was associated with carcass fat in the Charolais. ACTN2 also overlapped with a SNP on chromosome 28 at 9.35 Mb which was associated with carcass fat in the Limousins. In mammals, ACTN2 is highly expressed in skeletal and cardiac muscle (Lornage et al., 2019) and mutations in ACTN2 cause cardiac myopathy (Lornage et al., 2019) and muscular dystrophy (Lornage et al., 2019; Savarese et al., 2019) in humans. Another novel candidate gene identified in the present study was THOC1; this gene overlapped with a SNP QTL on chromosome 24 between 35.22 and 35.25 Mb which was associated with carcass fat in the Charolais and Limousins. THOC1 may have a role in muscle cell proliferation in pigs (Zappaterra et al., 2020).
The 28 SNP QTLs which were associated with more than one trait within breed may be contributing to the genetic correlation between carcass traits in cattle (Hickey et al., 2007; Kause et al., 2015). Two SNP QTLs were associated with all three carcass traits within a single breed, possibly contributing to the genetic correlation between all three traits. MSTN overlapped with a SNP QTL that was associated with all three traits in the Charolais as well as carcass fat and conformation in the Limousins. MSTN is known to have a large effect on carcass traits in cattle (Grobet et al., 1997; Kambadur et al., 1997; McPherron et al., 1997).
The dataset used in the present study had previously been used as part of a larger dataset which consisted of 28,470 sires across six different breeds with each of the sires imputed to 41,389,526 SNPs. This dataset was used by Purfield et al. (2019) to perform a traditional genome-based association analysis of carcass traits in cattle. A total of 55 SNP QTLs (7.7% of all QTLs) identified in the present study overlapped in genomic position with the QTLs identified by Purfield et al. (2019). In Purfield et al. (2019), as in the present study, the associated SNPs located near MSTN, NCAPG, and LCORL were associated with at least one of the carcass traits in the Charolais and the Limousin populations. Purfield et al. (2019) identified only one SNP QTL which was associated with carcass weight in the Holstein-Friesians; this SNP QTL was located on chromosome 14 between 24.49 and 25.33 Mb. This result was similar to the present study in which no SNPs or CNVs were associated with carcass weight in the Holstein-Friesians.
Conclusion
The CNV-derived GRM did not account for any additive genetic variance in the three carcass traits when jointly evaluated with a SNP-derived GRM in a linear mixed model for each of the three breeds. A LASSO regression analysis which jointly evaluated SNPs and CNVs did, however, identify 18 CNVs associated with at least one of the three carcass traits in the three breeds analysed although the proportion of genetic variance explained was small. Some of these associated CNVs overlapped with genes that have previously been associated with carcass traits, which suggests that these CNVs represent true associations. In addition to reaffirming candidate genes that have previously been associated with carcass traits in cattle, several novel candidate genes where also identified. Novel candidate genes which overlapped with CNV QTLs included PTPRU and novel candidate genes which overlapped with SNP QTLs included ACTN2, THOC1, and USP24.
Data Availability Statement
The data analyzed in this study is subject to the following licenses/restrictions: The phenotype and genotype data analyzed in the present study are the property of the Irish Cattle Breeding Federation (ICBF). Requests to access these datasets should be directed to DB, ZG9uYWdoLmJlcnJ5QHRlYWdhc2MuaWU=.
Ethics Statement
Ethical review and approval was not required for the animal study because the phenotype and genotype data analysed in the present study had previously been collected for commercial use by the Irish Cattle Breeding Federation (ICBF).
Author Contributions
Study design: IG, DB, PR, and AP. Manuscript preparation: PR, DB, IG, AP, and SN. All authors have read and approved the final manuscript.
Funding
This research was jointly funded by a research grant from Science Foundation Ireland, grant number 14/IA/2576, and a joint research grant from Science Foundation Ireland and the Irish Department of Agriculture, Food, and Marine, grand number 16/RC/3835 (VistaMilk; Dublin, Ireland). Andrew Parnell’s research is supported by a Science Foundation Ireland Career Development Award grant 17/CDA/4695 and a Science Foundation Ireland research centre grant 12/RC/2289_P2.
Conflict of Interest
The authors declare that the research was conducted in the absence of any commercial or financial relationships that could be construed as a potential conflict of interest.
Publisher’s Note
All claims expressed in this article are solely those of the authors and do not necessarily represent those of their affiliated organizations, or those of the publisher, the editors and the reviewers. Any product that may be evaluated in this article, or claim that may be made by its manufacturer, is not guaranteed or endorsed by the publisher.
Supplementary Material
The Supplementary Material for this article can be found online at: https://www.frontiersin.org/articles/10.3389/fgene.2021.761503/full#supplementary-material
References
Balding, D. J. (2006). A Tutorial on Statistical Methods for Population Association Studies. Nat. Rev. Genet. 7, 781–791. doi:10.1038/nrg191610.1038/nrg1916
Berry, D. P., Amer, P. R., Evans, R. D., Byrne, T., Cromie, A. R., and Hely, F. (2019). A Breeding index to Rank Beef Bulls for Use on Dairy Females to Maximize Profit. J. Dairy Sci. 102 (11), 10056–10072. doi:10.3168/jds.2019-16912
Bouquet, A., Venot, E., Laloë, D., Forabosco, F., Fogh, A., Pabiou, T., et al. (2011). Genetic Structure of the European Charolais and Limousin Cattle Metapopulations Using Pedigree Analysis. J. Anim. Sci., 89, 6, 1719–1730. doi:10.2527/jas.2010-3469
Bush, W. S., and Moore, J. H. (2012). Chapter 11: Genome-wide Association Studies. PLOS Comput. Biol. 8 (12), e1002822. doi:10.1371/journal.pcbi.1002822
Cai, Z., Dusza, M., Guldbrandtsen, B., Lund, M. S., and Sahana, G. (2020). Distinguishing Pleiotropy from Linked QTL between Milk Production Traits and Mastitis Resistance in Nordic Holstein Cattle. Genet. Selection Evol. 52, 19. doi:10.1186/s12711-020-00538-6
Cheng, J. B., and Russell, D. W. (2004). Mammalian Wax Biosynthesis: Identification of Two Fatty Acyl-Coenzyme a Reductases with Different Substrate Specifications and Tissue Distributions. J. Biol. Chem. 279 (36), 37789–37797. doi:10.1074/jbc.M406225200
Colella, S., Yau, C., Taylor, J. M., Mirza, G., Butler, H., Clouston, P., et al. . QuantiSNP: an Objective Bayes Hidden-Markov Model to Detect and Accurately Map Copy Number Variation Using SNP Genotyping Data. Nucleic Acids Res. 35 (6), 2013–2025. doi:10.1093/nar/gkm076
Connolly, S. M., Cromie, A. R., and Berry, D. P. (2016). Genetic Differences Based on a Beef Terminal index Are Reflected in Future Phenotypic Performance Differences in Commercial Beef Cattle. Animal 10 (5), 736–745. doi:10.1017/S175173115002827
Cook, K., Benitez, A., Fu, C., and Tintle, N. (2014). Evaluating the Impact of Genotype Errors on Rare Variant Tests of Association. Front. Genet. 5, 62. doi:10.3389/fgene.2014.00062
da Silva, V. H., de Almeida, R. L. C., Geistlinger, L., Giachetto, P. F., Brassaloti, R. A., Morosini, N. S., et al. (2016). Genome-wide Detection of CBNVs and Their Association with Meat Tenderness in Nelore Cattle. PLoS One 11 (6), e0157711. doi:10.1371/journal.pone.0157711
de Oliveira Silva, R. M., Stafuzza, N. B., de Oliveira Fragomeni, B., de Camargo, M. F., Ceacero, T. M., Cyrillo, J. N. S. G., et al. (2017). Genome-wide Association Study for Carcass Traits in an Experimental Nelore Cattle Population. PLoS One 12 (1), e0169860. doi:10.1371/journal.pone.0169860
Dellinger, A. E., Saw, S. M., Goh, L. K., Seielstad, M., Young, T. L., and Li, Y. J. (2010). Comparative Analyses of Seven Algorithms for Copy Number Variant Identification from Single Nucleotide Polymorphism Arrays. Nucleic Acids Res. 38 (9). doi:10.1093/nar/gkq040
Diskin, S. J., Li, M., Hou, C., Yang, S., Glessner, J., Hakonarson, H., et al. (2008). Adjustment of Genomic Waves in Signal Intensities from Whole-Genome SNP Genotyping Platforms. Nucleic Acids Res. 36, 19e126. doi:10.1093/nar/gkn556
Doyle, J. L., Berry, D. P., Veerkamp, R. F., Carthy, T. R., Walsh, S. W., Evans, R. D., et al. (2020). Genomic Regions Associated with Skeletal Type Traits in Beef and Dairy Cattle Are Common to Regions Associated with Carcass Traits, Feed Intake and Calving Difficulty. Fronteirs Genet. 11, 20. doi:10.3389/fgene.2020.00020
Englishby, T. M., Banos, G., Moore, K. L., Coffey, M. P., Evans, R. D., and Berry, D. P. (2016). Genetic Analysis of Carcass Traits in Beef Cattle Using Random Regression Models. J. Anim. Sci. 94 (4), 1354–1364. doi:10.2527/jas.2015-0246
Feuk, L., Carson, A. R., and Scherer, S. W. (2006). Structural Variation in the Human Genome. Nat. Rev. Genet. 7 (2), 85–97. doi:10.1038/nrg1767
Friedman, J. H., Hastie, T., and Tibshirani, R. (2010). Regularisation Paths for Generalised Linear Models via Coordinate Descent. J. Stat. Softw. 33, 1. doi:10.18637/jss.v033.i01
Garrick, D. J., Taylor, J. F., and Fernando, R. L. (2009). Deregression Estimated Breeding Values and Weighting Information for Genomic Regression Analyses. Genet. Selection Evol. 41, 55. doi:10.1186/1297-9686-41-55
Gilmour, A. R., Gogel, B. J., Cullis, B. R., Welham, S. J., and Thompson, R. (2015). User Guide Release 4.1 Structural Specification. Hemel Hempstead, UK: VSN Internal Ltd. www.vsni.co.
Grobet, L., Martin, L. J., Poncelet, D., Pirottin, D., Brouwers, B., Riquet, J., et al. (1997). A Deletion in the Bovine Myostatin Gene Causes the Double-Muscle Phenotype in Cattle. Nat. Genet. 17 (1), 71–74. doi:10.1038/ng0997-71
Gutierrez-Reinoso, M. A., Aponte, P. M., and Garcia-Herreros, M. (2021). Genomic Analysis, Progress and Future Perspectives in Dairy Cattle Selection: A Review. Animals 11, 599. doi:10.3390.ani1103059910.3390/ani11030599
Handsaker, R. E., Van Doren, V., Berman, J. R., Genovese, G., Kashin, S., Boettger, L. M., et al. (2015). Large Multi-Allelic Copy Number Variations in Humans. Nat. Genet. 47 (3), 296–303. doi:10.1038/ng.3200
Harris, B., and Johnson, D. (1998). Approximate Reliability of Genetic Evaluations under an Animal Model. J. Diary Sci. 81 (10), 2723–2728. doi:10.3168/jds.S0022-0302(98)75829-1
Hastie, T., Tibshirani, R., and Wainwright, M. (2015). Statistical Learning with Sparsity: The Lasso and Generalisations. Boca Raton, FL, USA, CRC Press.
Hay, E. H., and Roberts, A. (2018). Genome-wide Association Study for Carcass Traits in a Composite Beef Cattle Breed. Livestock Sci. 213, 35–43. doi:10.106/j.livsci.2018.04.01810.1016/j.livsci.2018.04.018
Hay, E. H., Utsunomiya, Y. T., Xu, L., Zhou, Y., Neves, H. H. R., Carvalheiro, R., et al. (2018). Genomic Predictions Combining SNP Markers and Copy Number Variations in Nellore Cattle. BMC Genomics 19, 441. doi:10.1186/s12864-018-4787-6
Hickey, J. M., Keane, M. G., Keny, D. A., Cromie, A. R., and Veerkamp, R. F. (2007). Genetic Parameters for EUROP Carcass Traits within Different Groups of Cattle in Ireland. J. Anim. Sci. 85 (2), 314–321. doi:10.2527/jas.2007-26310.2527/jas.2006-263
Horodyska, J., Hamill, R. M., Varley, P. F., Reyer, H., and Wimmers, K. (2017). Genome-wide Association Analysis and Functional Annotation of Positional Candidate Genes for Feed Conversion Efficiency and Growth Rate in Pigs. PLoS ONE 12 (6), e0173482. doi:10.1371/journal.pone.0173482
Hou, L., Sun, N., Mane, S., Sayward, F., Rajeevan, N., Cheung, K. H., et al. (2017). Impact of Genotyping Errors on Statistical Power of Association Tests in Genomic Analyses: A Case Study. Genet. Epidemiol. 41 (2), 152–162. doi:10.1002/gepi.22027
Jia, C., Li, C., Fu, D., Chu, M., Zan, L., Wang, H., et al. (2019). Identification of Genetic Loci Associated with Growth Traits at Weaning in Yak through a Genome-wide Association Study. Anim. Genet. 51, doi:10.1111/age.12897
Kambadur, R., Sharma, M., Smith, T. P. L., and Bass, J. J. (1997). Mutations in Myostatin (GDF8) in Double Muscled Belgian Blue and Piedmontese Cattle. Genome Res. 7, 910–915. doi:10.1101/gr.7.9.910
Kause, A., Mikkola, L., Stranden, I., and Sirkko, K. (2015). Genetic Parameters for Carcass Weight, Conformation and Fat in Five Cattle Breeds. Animal 9 (1), 35–42. doi:10.1017/S1751731114001992
Kelleher, M. M., Berry, D. P., Kearney, J. F., McParland, S., Buckley, F., and Purfield, D. C. (2017). Inference of Population Structure of Purebred Dairy and Beef Cattle Using High-Density Genotype Data, Infer of Popu Struct Of Purebred Dai, 11,
Li, H., Wei, X., Yang, J., Dong, D., Huang, Y., Lan, X., et al. (2016). Developmental Transcriptome Profiling of Bovine Muscle Tissue Reveals an Abundant GosB that Regulates Myoblast Proliferation and Apoptosis. Oncotarget 8 (19), 32083–32100. doi:10.18632/oncotarget.16644
Lim, D., Choi, B. H., Cho, Y. M., Chai, H. H., Jang, G. W., Gondro, C., et al. (2016). Analysis of Extended Haplotype in Korean Cattle (Hanwoo) Population. BMB Rep. 49 (9), 514–519. doi:10.5483/BMBRep.2016.49.9.074
Lornage, X., Romero, N. B., Grosgogeat, C. A., Malfatti, E., Donkervoort, S., Marchetti, M. M., et al. (2019). ACTN2 Mutations Cause “Multiple Structured Core Disease” (MsCD). Acta Neuropathologica 137, 501–519. doi:10.1007/s00401-019-01963-8
McPherron, A. C., and Lee, S. J. (1997). Double Muscling in Cattle Due to Mutations in the Myostatin Gene. PNAS 94 (23), 12457–12461. doi:10.1073/pnas.94.23.12457
Meinsausen, N. (2007). Relxed Lasso. Comput. Stat. Data Anal. 52, 374–393. doi:10.1016/j.csda.2006.12.019
Meuwissen, T. H., Hayes, B. J., and Goddard, M. E. (2001). Prediction of Total Genetic Value Using Genome-wide Dense Marker Maps. Genetics 157 (4), 1819–1829. doi:10.1093/genetics/157.4.1819
Mills, R. E., Walter, K., Stewart, C., Handsaker, R. E., Chen, K., Alkan, C., et al. (2011). Mapping Copy Number Variation by Population Scale Genome Sequencing. Nature 470, 733259–733265. doi:10.1038/nature09708
Pabiou, T., Fikse, W. F., Amer, P. R., Cromie, A. R., Nasholm, A., and Berry, D. P. (2011). Genetic Variation in Wholesale Carcass Cuts Predicted from Digital Images in Cattle. Animal 5 (11), 1720–1727. doi:10.1017/S1751731111000917
Patterson, N., Price, A. L., and Reich, D. (2006). Population Structure and Eigenanalysis. PLoS Genet. 2, doi:10.1371/journal.pgen.0020190
Pompanon, F., Bonin, A., Bellemain, E., and Taberlet, P. (2005). Genotyping Errors: Causes, Consequences and Solutions. Nat. Rev. Genet. 6 (11), 847–859. doi:10.1038/nrg1707
Prinsen, R. T. M. M., Rossoni, A., Gredler, B., Bieber, A., Bagnato, A., and Strillacci, M. G. (2017). A Genome Wide Association Study between CNVs and Quantitative Traits in Brown Swiss Cattle. Livestock Sci. 202, 7–12. doi:10.1016/j.livsci.2017.05.011
Purfield, D. C., Bradley, D. G., Evans, R. S., Kearney, F. J., and Berry, D. P. (2015). Genome-wide Association Study for Calving Performance Using High-Density Genotypes in Dairy and Beef Cattle. Genet. Selection Evol. 47 (1), 47. doi:10.1186/s12711-015-0126-4
Purfield, D. C., Evans, R. D., and Berry, D. P. (2019). Reaffirmation of Known Major Genes and the Identification of Novel Candidate Genes Associated with Carcass-Related Metrics Based on Whole Genome Sequence within a Large Multi-Breed Cattle Population. BMC Genomics 20, 720. doi:10.1186/s12864-019-6071-9
Rafter, P., Gormley, I. C., Parnell, A. C., Kearney, J. F., and Berry, D. P. (2020). Concordance Rate between Copy Number Variants Detected Using Either High or Medium-Density Single Nucleotide Polymorphism Genotype Panels and the Potential of Imputing Copy Number Variants from Flanking High-Density Single Nucleotide Polymorphism Haplotypes in Cattle. BMC Genomics 21, 205. doi:10.1186/s12864-020-6627-8
Rosen, B. D., Bickhart, D. M., Schnabel, R. D., Koren, S., Elsik, C. G., Tseng, E., et al. (2020). De Novo assembly of the Cattle Reference Genome with Single-Molecule Sequencing. Gigascience 9, 3. doi:10.1093/gigascience/giaa021
Sargolzaei, M., Chesnais, J. P., and Schenkel, F. S. (2014). A New Approach for Efficient Genotype Imputation Using Information from Relatives. BMC Genomics 15 (1), 478. doi:10.1186/1471-2164-15-478
Sassi, N. B., Gonzalez-Rico, O., de Paz-del Rio, R., Rodriguez-Ramilo, S. T., and Fernandez, A. I. (2016). Associated Effects of Copy Number Variants on Economically Important Traits in Spanish Holstein Dairy Cattle. J. Dairy Sci. 99 (8), 6371–6380. doi:10.3168/jds.2015-10487
Savarese, M., Palmio, J., Poza, J. J., Weinberg, J., Olive, M., Cobo, A. M., et al. (2019). Actininopathy: A New Muscular Dystrophy Caused by ACTN2 Dominant Mutations. Ann. Neurol. 85 (6), 899–906. doi:10.1002/ana.25470
Silva-Vignato, B., Coutinho, L. L., Cesar, A. S. M., Poleti, M. D., Regitano, L. C. A., and Balieiro, J. C. C. (2017). Comparative Muscle Transcriptome Associated with Carcass Traits in Nellore Cattle. BMC Genomics 18, 506. doi:10.1186/s12864-017-3897-x
Stranden, I., and Lidauer, M. (1999). Solving Large Mixed Linear Models Using Preconditioned Conjugate Gradient Iteration. J. Dairy Sci. 82 (12), 2779–2787. doi:10.3168/jds.S0022-0302(99)75535-9
Stranden, I., and Mantysaari, E. A. (2010). A Recipe for Multiple Trait Degression. Proc. 2010 Interbull Meet. 42, 21–24.
VanRaden, P. M. (2008). Efficient Methods to Compute Genomic Predictions. J. Dairy Sci. 91 (11), 4414–4423. doi:10.3168/jds.2007-0980
Wang, K., Li, M., Liu, R., Glessner, J., Grant, S. F. A., Hakonarson, H., et al. (2007). PennCNV: An Integrated Markov Model Designed for High-Resolution Copy Number Variation Detection in Whole-Genome SNP Genotyping Data. Genome Res. 17 (11), 1665–1674. doi:10.1101/gr.6861907
Werdyani, S., Yu, Y., Skardasi, G., Xu, J., Shestopaloff, K., Xu, W., et al. (2017). Germline INDELs and CNVs in a Cohort of Colorectal Cancer Patients: Their Characteristics, Associations with Relapse-free Survival Time, and Potential Time-Varying Effects on the Risk of Relapse. Cancer Med. 6 (6), 1220–1232. doi:10.1002/cam4.1074
Xiong, X., Yang, H., Yang, B., Chen, C., and Huang, L. (2015). Identification of Quantitative Trait Transcripts for Growth Traits in the Large Scales of Liver and Muscle Samples. Physiol. Genomics. 47, doi:10.1152/physiolgenomics.00005.2015
Xu, L., Cole, J. B., Bickhart, D. M., Hou, Y., Song, J., VanRaden, P. M., et al. (2014). Genome Wide CNV Analysis Reveals Additional Variants Associated with Milk Production Traits in Holsteins. BMC Genomics 15, 683. doi:10.1186/1471-2164-15-683
Zappaterra, M., Gioiosa, S., Chillemi, G., Zambonelli, P., and Davoli, R. (2020). Muscle Transcriptome Analysis Identifies Genes Involved in Ciliogenesis and the Molecular cascade Associated with Intramuscular Fat Content in Large White Heavy Pigs. PLoS Genet. 15, doi:10.1371/journal.pone.0233372
Zhou, Y., Utsunomiya, Y. T., Xu, L., Hay, E. H., Bickhart, D. M., Alexandre, P. A., et al. (2016). Genome-wide CNV Analysis Reveals Variants Associated with Growth Traits in. Bos indicusBMC Genomic 17, 419. doi:10.1186/s12864-016-2461-4
Keywords: CNV, Charolais, Holstein-Friesian, Limousin, SNP, LASSO
Citation: Rafter P, Gormley IC, Parnell AC, Naderi S and Berry DP (2021) The Contribution of Copy Number Variants and Single Nucleotide Polymorphisms to the Additive Genetic Variance of Carcass Traits in Cattle. Front. Genet. 12:761503. doi: 10.3389/fgene.2021.761503
Received: 19 August 2021; Accepted: 04 October 2021;
Published: 02 November 2021.
Edited by:
Francisco Peñagaricano, University of Wisconsin-Madison, United StatesReviewed by:
Fernanda Marcondes de Rezende, University of Florida, United StatesFernando Baldi, São Paulo State University, Brazil
Troy Rowan, The University of Tennessee, Knoxville, United States
Copyright © 2021 Rafter, Gormley, Parnell, Naderi and Berry. This is an open-access article distributed under the terms of the Creative Commons Attribution License (CC BY). The use, distribution or reproduction in other forums is permitted, provided the original author(s) and the copyright owner(s) are credited and that the original publication in this journal is cited, in accordance with accepted academic practice. No use, distribution or reproduction is permitted which does not comply with these terms.
*Correspondence: Donagh P. Berry, RG9uYWdoLkJlcnJ5QHRlYWdhc2MuaWU=