 Chuanshun Li
 Yuting Qi1†
 Chuanzhi Zhao
 Xingjun Wang
 Quan Zhang
- 1Shandong Provincial Key Laboratory of Plant Stress Research, College of Life Science, Shandong Normal University, Jinan, China
- 2Bio-Tech Research Center, Shandong Academy of Agricultural Sciences, Shandong Provincial Key Laboratory of Crop Genetic Improvement, Ecology and Physiology, Jinan, China
Eutrema salsugineum can grow in natural harsh environments; however, the underlying mechanisms for salt tolerance of Eutrema need to be further understood. Herein, the transcriptome profiling of Eutrema leaves and roots exposed to 300 mM NaCl is investigated, and the result emphasized the role of genes involved in lignin biosynthesis, autophagy, peroxisome, and sugar metabolism upon salt stress. Furthermore, the expression of the lignin biosynthesis and autophagy-related genes, as well as 16 random selected genes, was validated by qRT-PCR. Notably, the transcript abundance of a large number of lignin biosynthesis genes such as CCoAOMT, C4H, CCR, CAD, POD, and C3′H in leaves was markedly elevated by salt shock. And the examined lignin content in leaves and roots demonstrated salt stress led to lignin accumulation, which indicated the enhanced lignin level could be an important mechanism for Eutrema responding to salt stress. Additionally, the differentially expressed genes (DEGs) assigned in the autophagy pathway including Vac8, Atg8, and Atg4, as well as DEGs enriched in the peroxisome pathway such as EsPEX7, EsCAT, and EsSOD2, were markedly induced in leaves and/or roots. In sugar metabolism pathways, the transcript levels of most DEGs associated with the synthesis of sucrose, trehalose, raffinose, and xylose were significantly enhanced. Furthermore, the expression of various stress-related transcription factor genes including WRKY, AP2/ERF-ERF, NAC, bZIP, MYB, C2H2, and HSF was strikingly improved. Collectively, the increased expression of biosynthesis genes of lignin and soluble sugars, as well as the genes in the autophagy and peroxisome pathways, suggested that Eutrema encountering salt shock possibly possess a higher capacity to adjust osmotically and facilitate water transport and scavenge reactive oxidative species and oxidative proteins to cope with the salt environment. Thus, this study provides a new insight for exploring the salt tolerance mechanism of halophytic Eutrema and discovering new gene targets for the genetic improvement of crops.
Introduction
Salt stress is a major abiotic stress that can affect the growth and development of plants and leads to reductions in crop productivity. When responding to salt stress conditions, plants require numerous biochemical and physiological alterations that accompany the expression changes of a number of stress-related genes (Bressan et al., 2009; Zhao et al., 2020). Two main groups of genes participate in the salt stress response including the stress-regulated genes encoding regulatory proteins such as transcription factors, and proteins functioning in stress tolerance such as detoxification enzymes, osmoprotectant biosynthesis, and late embryogenesis abundant proteins (LEA proteins) (Gupta and Huang, 2014; Zhao et al., 2020).
Transcription factors (TFs) are considered the most important regulators and involved in the regulation of a broad range of target genes associated with plant tolerance and adaptation by binding to the specific cis-acting elements in the promoters of the target genes (Zhu et al., 2010; Zhao et al., 2020). Some numbers of TF families including AP2/ERF, NAC, WRKY, MYB, bZIP, HSF, and C2H2 have been implicated in stress responses, and they are possibly associated with enhanced stress tolerance in plants (Kiełbowicz-Matuk, 2012; Scharf et al., 2012; Wang et al., 2016). For example, Arabidopsis bZIP24, ANAC042, MYB41, WRKY33, HSFA2, and C2H2-type zinc finger (ZAT7, ZAT10/STZ, ZAT12, AZF1, AZF2, AZF3) have been documented to play important roles in the response to salt and osmotic stress (Kiełbowicz–Matuk, 2012; Golldack et al., 2014). Abscisic acid (ABA) is a vital cellular signal that modulates the expression of a number of salt and water-deficit responsive genes (Gupta and Huang, 2014). The positive relationship between ABA accumulation and salinity tolerance has been at least partially attributed to the accumulation of K+, Ca2+, and compatible solutes such as proline and sugars (Keskin et al., 2010).
In general, the enhanced lignification of cell walls, thereby facilitating water transport and providing stress resistance (Hu et al., 2019; Dong and Lin, 2021), has been observed in plants exposed to salt stress (Neves et al., 2010; Chun et al., 2019). A branch of the phenylpropanoid pathway is responsible for the synthesis of lignin, and many enzymes in the lignin biosynthetic pathway exhibit extensive substrate specificity (Xie et al., 2018). Phenylalanine ammonia–lyase (PAL) is the first committed enzyme in the phenylpropanoid pathway leading to the production of lignin, lignans, and flavonoids (Saito et al., 2013). Cinnamic acid 4-hydroxylase (C4H) is a cytochrome P450 monooxygenase which catalyzes the hydroxylation of trans-cinnamic acid at C-4 position to yield p-coumaric acid (4-coumaric acid) (Saito et al., 2013). The activated reaction of p-coumaric acid is catalyzed by 4-coumaric acid: CoA ligase (4CL) (Saito et al., 2013). The p-coumaroyl shikimate 3′-hydroxylase (C3′H) and hydroxycinnamoyl CoA: shikimate/quinate hydroxycinnamoyl transferase (HCT) catalyze the synthesis of the shikimate and quinate esters of p-coumaric acid, which leads to the biosynthesis of guaiacyl (G) and syringyl (S) lignin units. Lignin is composed of three monomers known as hydroxyphenyl (H), guaiacyl, and syringyl that are derived from p-coumaryl alcohols, coniferyl alcohols, and sinapyl alcohols, respectively (Dong and Lin, 2021). The enzymes of caffeoyl CoA O-methyltransferase (CCoAOMT), caffeate 3-O-methyltransferase (COMT), ferulate 5-hydroxylase (F5H), cinnamoyl CoA reductase (CCR), and cinnamyl alcohol dehydrogenase (CAD) are involved in the biosynthesis of p-coumaryl alcohols, coniferyl alcohols, and sinapyl alcohols (Yang et al., 2019). Additionally, peroxidase (POD/POX) and laccase (LAC) participated in the polymerization of monolignols to yield the lignin polymer as a final product (Xie et al., 2018).
Reactive oxidative species (ROS) accumulation can be enhanced by salinity stress, which leads to oxidative damages in various cellular components, and interrupt vital cellular functions of plants (Apel and Hirt, 2004; Asada, 2006; Van Breusegem and Dat, 2006). Autophagy is involved in degrading oxidized proteins, in which cytoplasmic components are taken up into a vacuole or lysosome for degradation under oxidative stress conditions (Xiong et al., 2007a; Xiong et al., 2007b). Autophagy is critical for the survival of eukaryotes and plays a central role in stress responses because it enables cells to maintain homeostasis under stressful conditions (Xiong et al., 2007b). The complexes formed by Atg8, Atg4, Atg7, and Atg3 are mainly involved in the vehicle expansion and completion process of autophagy (Ichimura et al., 2000). The ubiquitin-like protein Atg8 is activated by Atg7, transferred to E2 enzyme Atg3, and finally conjugated to phosphatidylethanolamine (PE). Atg4 mediates both the C-terminal processing and deconjugation of Atg8 (Ichimura et al., 2000). Vac8 genes are related to autophagy initiation; they coordinate the site of autophagosome formation with vacuole fusion and improve the efficiency of autophagy by localizing autophagosome formation within the cell (Hollenstein et al., 2019). In the peroxisome pathway, the function of Mpv17, CAT, and SOD is related to ROS metabolism and could contribute to the stress tolerance of plants (Wang et al., 2004; Wi et al., 2020). Peroxisomes, as a metabolic organelle, typically contain enzymes involved in the lipid metabolism, and the catalase convert H2O2 to water and O2 (Van den Bosch et al., 1992; Wanders et al., 2001). HPCL2 was involved in the α-oxidation of fatty acid (Foulon et al., 1999), while ACOX1 and ACAA1 were related to the β-oxidation of fatty acid (Arai et al., 2008).
Starch is a key molecule for modulating plant responses to abiotic stresses, such as water deficit and high salinity (Thalmann and Santelia, 2017). When photosynthesis is limited, starch is generally remobilized, and released sugars and other derived metabolites provide energy for plant growth under challenging environmental conditions (Thalmann and Santelia, 2017). Accumulation of sugars (glucose, sucrose, trehalose, xylose, and raffinose) can function as osmoprotectants under salt stress, and it was observed that salt stress increases the level of reducing sugars in the cells of different plants (Krasensky and Jonak, 2012; Thalmann and Santelia, 2017). Sucrose, a main sugar accumulated through photosynthesis, may serve as an important source of carbon and energy and also as osmotic protectants to enhance tolerance to abiotic stress (Ruan, 2014). Enzymes like sucrose synthetase (SS), sucrose phosphate synthetase (SPS), and invertase (INV) are tightly involved in the sucrose metabolism (Krasensky and Jonak, 2012). Trehalose is present in trace amounts in most angiosperms, and abiotic stress can increase the accumulation of trehalose to improve the salinity tolerance of plants (Garg et al., 2002). An increase in trehalose levels was observed when trehalose-6-phosphate synthase (TPS) and trehalose-6-phosphate phosphatase (TPP) were expressed in rice, and the transgenic plants showed an increased tolerance to various abiotic stresses (Garg et al., 2002). Additionally, raffinose, suggested to act as compatible solute and antioxidant and serve as signal in response to stress, is associated with the defense mechanism of stress tolerance (ElSayed et al., 2014). In the halophyte of Eutrema, it is reported that more raffinose and other raffinose family oligosaccharides accumulated than in Arabidopsis during salt stress (Taji et al., 2004).
Late embryogenesis abundant (LEA) proteins are descripted as a multifunctional stress protein that maintains normal metabolism under severe conditions (Close, 1996). No tissue-specific LEA gene expression has been considered as one main regulatory mechanism developed against dehydration caused by drought and salt (Tunnacliffe and Wise, 2007). In a previous study, 148 putative LEA protein sequences of Eutrema were obtained by aligning them with Arabidopsis LEA proteins, and 52 LEA protein sequences exhibited high sequence similarity with the orthologs in Arabidopsis (Lee et al., 2013).
Eutrema salsugineum (salt cress) represents an extremophyte model system closely related to Arabidopsis, and it is tolerant to high salt, drought stress, heat stress, and cold stress (Inan et al., 2004; Taji et al., 2004; Gong et al., 2005). Stomata of salt cress are less open and more tightly closing, the leaves are more succulent-like, and its roots develop an extra endodermis and cortex cell layer relative to Arabidopsis during extreme salt stress (Inan et al., 2004). Compared with Arabidopsis, the detrimental effects of the salt on photosynthetic activity and stomatal conductance of Eutrema leaves were to a much less extent, and its rosette leaves exhibited more efficient protective mechanisms against Na+ metabolic toxicity (M'Rah et al., 2007). In addition, NaCl treatment enhanced the tonoplast (TP) and plasma membrane (PM) H+-transport and the hydrolytic activity of H+-ATPases and also greatly stimulated activity of tonoplast Na+/H+ exchange both in Eutrema leaves and roots (Vera–Estrella et al., 2005). Previously, the global gene expression profiling of Eutrema was performed by using a microarray platform and Arabidopsis homologous gene probes and was mainly involved in the comparative salt tolerance and stress-related genes between Eutrema and Arabidopsis (Taji et al., 2004; Gong et al., 2005; Wong et al., 2006). And these research studies showed that Eutrema plants are “primed” for stress, implying plants thriving in harsh stress conditions may achieve protection by constitutive activation of stress-related genes (Gong et al., 2005; Amtmann, 2009). In view of salt cress as a halophyte, it usually grows well in 200 mM NaCl, but it has a certain degree of growth inhibition in 300 mM NaCl (Inan et al., 2004). In the study, Eutrema were used to gain global transcriptional changes in response to 300 mM NaCl for 24 h. The result showed that the genes of several stress-relative pathways were significantly enriched in the halophyte when exposed to salt shock. The salt environment–induced genes were mainly involved in lignin biosynthesis and accumulation of soluble sugars, as well as genes in autophagy and peroxisome pathways, suggesting that the enhanced lignin accumulation and osmotic protection, and degrading oxidized proteins and scavenging ROS may be the important aspects of salt cress to respond to a salt environment.
Materials and Methods
Plant Materials and Salt Treatment
Seeds of Eutrema (Shandong ecotype) were surface-sterilized and planted on a 1/2 MS medium. Plates were kept at 4°C for 7 days to synchronize the germination of seeds and then transferred to a growth chamber with 16-h light at 26°C with a light intensity of 3,000 lux and 8 h dark at 22°C (Wang et al., 2017). Seven-day-old seedlings were transferred to soil in a growth chamber with a 16-/8-h (22/18°C) day/night cycle for 5 weeks. The seedlings were irrigated with 300 mM NaCl solution for the salt-treated plants. The control seedlings were irrigated with water. After 24 h of salt treatment, leaves and roots of the control and salt-treated seedlings were separately collected, frozen immediately in liquid nitrogen, and stored at −80°C. Leaves and roots from nine individual seedlings were collected, respectively, as one independent biological replicate to minimize the variation of samples. And two biological replicates were used for RNA-seq, which was based on the data of RNA-seq from two biological replicates that were relatively accurate and credible if there is a sufficient sequencing depth (Tarazona et al., 2015; Schurch et al., 2016).
To verify the Eutrema transcriptome expression profiles in response to salt shock, the same aforementioned Eutrema plants under 300 mM NaCl treatment for 24 h were used to collect samples from the separated leaves and roots, respectively, and the samples collected from plants under the normal growth condition were used as controls. All samples were frozen immediately in liquid nitrogen and kept at −80°C for total RNA extraction. The qRT-PCR assay was conducted using three biological replicates, each consisting of three technical replicates in leaf and root tissues, respectively.
Library Construction and Illumina Sequencing
Total RNA was isolated from the leaves and roots using RNAiso Reagent (Takara, China) according to the manufacturer’s instructions, and treated with DNase I to eliminate DNA contamination. Magnetic beads with Oligo (dT) were used to isolate and enrich the mRNA from total RNA, and the mRNA mixed with fragmentation buffer was cleaved into about 200-bp fragments. Then the first-strand cDNA was generated from the mRNA templates using reverse transcriptase and random hexamer primers. Subsequently, the second-strand cDNA was synthesized using first-strand buffer, dNTP, DNA polymerase I, and RNase H. The double-stranded cDNA was purified with magnetic beads, and the short fragments were subsequently connected with poly(A) adapters. Finally, the suitable fragments were PCR-amplified for the cDNA library construction. In the study, eight cDNA libraries of Eutrema including the leaves and roots without (CKL-1, CKL-2, CKR-1, and CKR-2) or with 300 mM NaCl treatment (NaClL-1,NaClL-2, NaClR-1, and NaClR-2) for 24 h were sequenced using the Illumina HiSeq™ 2000 platform at Beijing Genomics Institute (BGI).
Mapping of RNA Sequencing Reads and Gene Expression Analysis
Clean reads were obtained by removing the low-quality reads, adapter contamination, reads containing a large number of unknown bases (N) from the raw data using Cutadapt software (Martin, 2011). Then the clean reads were mapped to the reference genome of Eutrema using SOAP2 program based on no more than two mismatched bases in the alignment (Li et al., 2009). The transcripts were calculated and normalized to reads per kilobase per million reads (RPKM), representing the gene expression levels. The differentially expressed genes (DEGs) were identified by NOIseq software that offered a differentially expressed analysis method based on the nonparametric statistics for two replicated RNA-seq (Tarazona et al., 2011; Tarazona et al., 2015). The absolute values of log2FoldChange ≥1 and q-value ≥0.8 were used as the thresholds to judge the significance of gene expression differences (Tarazona et al., 2011).
Gene Ontology and Kyoto Encyclopedia of Genes and Genomes Enrichment Analysis of Differentially Expressed Genes
Gene annotations and functional enrichment analysis, including the Gene Ontology (GO) and Kyoto Encyclopedia of Genes and Genomes (KEGG) biological pathways, were used to identify which DEGs from root and leaf tissues were significantly enriched in the GO terms and KEGG pathways. Blast2GO program was used to annotate the GO terms of DEGs against GO database (http://geneontology.org/), and WEGO web-based tool was employed to visualize the functional categories of BP (biological processes), MF (molecular functions), and CC (cellular components) (https://www.blast2go.com/, https://wego.genomics.cn/) (Conesa et al., 2005; Ye et al., 2006). In the KEGG enrichment analysis, DEGs were mapped to specific biochemical pathways against the KEGG database (http://www.genome.jp/kegg) (Kanehisa and Goto, 2000).
Transcription Factor Analysis
iTAK software was used to identify and classify plant transcription factors based on the consensus rules that mainly summarized from plnTFDB (http://plntfdb.bio.uni-potsdam.de/v3.0/) and plantTFDB (http://planttfdb.gao-lab.org/) (Zheng et al., 2016; Pérez–Rodríguez et al., 2010; Jin et al., 2017). TBtools was employed to visualize the expression and classification of transcription factors (https://github.com/CJ-Chen/TBtools) (Chen et al., 2020).
Quantitative Real-Time PCR Validation of RNA-Seq Result
To confirm the reliability of the RNA-seq result, quantitative real-time PCR (qRT-PCR) was performed using the SYBR Green I (Roche) in the ABI7500 Real Time System (Applied Biosystems). Sixteen differentially expressed genes were randomly selected from roots and leaves for experimental validation. Ubiquitin (Thhalv10000782m) was used as an internal reference gene. Specific primers of genes were designed by Primer Premier 5.0 software, as shown in Supplementary Table S1. The amplification program was as follows: 94°C for 10 min, followed by 40 cycles at 95°C for 15 s, 60°C for 10 s, and 72°C 25 s. The qRT-PCR expression analysis of each gene was performed using three technical replicates (with three biological replicates).The relative expression levels of genes were calculated according to the 2−ΔΔCT method (Livak and Schmittgen, 2001). The cor.test function of the R base package was used to calculate Pearson’s correlation coefficient (PCC) between qRT–PCR (–ΔΔCT) and RNA-seq results (log2FC).
Extraction and Determination of Lignin
To investigate the Eutrema lignin content affected by salt stress, the plants were treated with 300 mM NaCl once every 2 days, and the leaves and roots from 10-day salt-treated plants were, respectively, collected. The samples watered for 10 days were used as controls. The leaves or roots from six plants were crushed and pooled to obtain three technical replicates, and three biological replicates were employed in the study.
The extraction of lignin in the separated leaves and roots of Eutrema was assayed using the method referring to the protocol of Qiyi Biotechnology (Shanghai) Co., Ltd. The absorbance of the samples was determined at 280 nm with a spectrophotometer (UV-1800, Shimadzu), and glacial acetic acid was used as a blank control. The lignin content (mg/g DW) was calculated based on the formula 0.9996 × (A280 of sample − A280 of blank sample)/(A280 of standard sample − A280 of blank sample)/dry weight (g), where the sample indicates the extraction of lignin from the leaves or roots, the blank sample indicates the reaction solution without sample, and the standard sample represents the lignin standard sample presented by Qiyi.
Statistical Analysis
Statistical significance was performed using Student’s t-test by R base package. The mean values and standard deviations (SDs) were calculated from three biological and three technical replicates, and significant differences relative to the controls are indicated at *p ≤ 0.05, **p ≤ 0.01, and ***p ≤ 0.001.
Results
RNA Sequencing Analysis in Leaf and Root Tissues Upon Salt Shock
Eutrema salsugineum is an extremophile native to harsh environments and can reproduce after exposure to 500 mM NaCl (Inan et al., 2004). Salt cress could retain normal growth in 200 mM NaCl for a long time (Inan et al., 2004). The plant leaves and roots follow distinct developmental trajectories to adapt to fluctuating environments that accompany the expression change of a number of stress-related genes (Min et al., 2020). To obtain an overview of the salt response genes in Eutrema, the transcriptome of leaves and roots with or without 300 mM NaCl treatment for 24 h was investigated by the Illumina Hiseq2000 platform. After removing the adapter, poly-N, and low-quality reads, clean data represented more than 99% of the raw data (Table 1). Regarding the clean data, the total number of reads was 96, 558, 016, with an average of ∼12 million reads per libraries (Table 1). Approximately 85.3% reads from leaves and 82.7% reads from roots could be mapped to the reference genome of Eutrema, of which about 79.9 and 78.4% reads from the leaves and roots were uniquely mapped to the reference genome, respectively (Table 1). A total of 2,019 and 964 differentially expressed genes (DEGs) were respectively identified from the leaves and roots (Figure 1A, Supplementary Table S2). More salt-responsive genes were found in leaves than that in roots, and the majority of DEGs showed different response patterns between the leaves and roots. Under salt stress condition, there were 1,279 upregulated genes in leaves, of which only 209 genes were also upregulated in roots, while 964 downregulated genes in roots, of which only 57 genes were also downregulated in leaves (Figure 1B). Our results demonstrated that 266 DEGs showed the same response trend upon salt stress, including 209 upregulated and 57 downregulated DEGs in both leaves and roots. Additionally, 23 DEGs showed the opposite expression trends between leaves and roots. For example, selenium-binding protein SBP2 (Thhalv10025040m) and plant defensin protein PDF1.2 (Thhalv10000535m) were upregulated in the roots but downregulated in the leaves, while 21 DEGs such as AP2/DREB26 (Thhalv10008639m) and cytochrome P450 (Thhalv10013359m) were downregulated in the roots but upregulated in the leaves (Figure 1B).
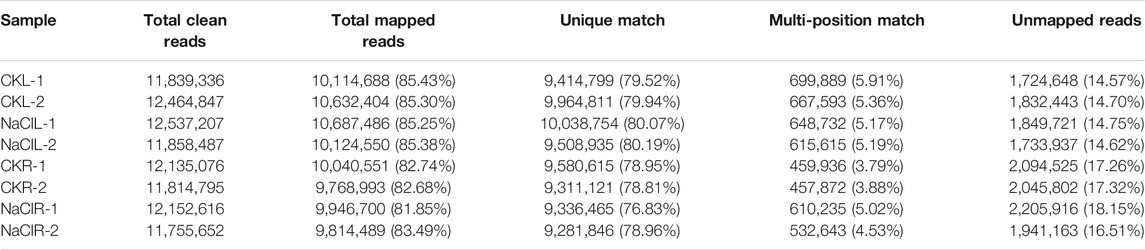
TABLE 1. Summary of reads mapping to reference genome.
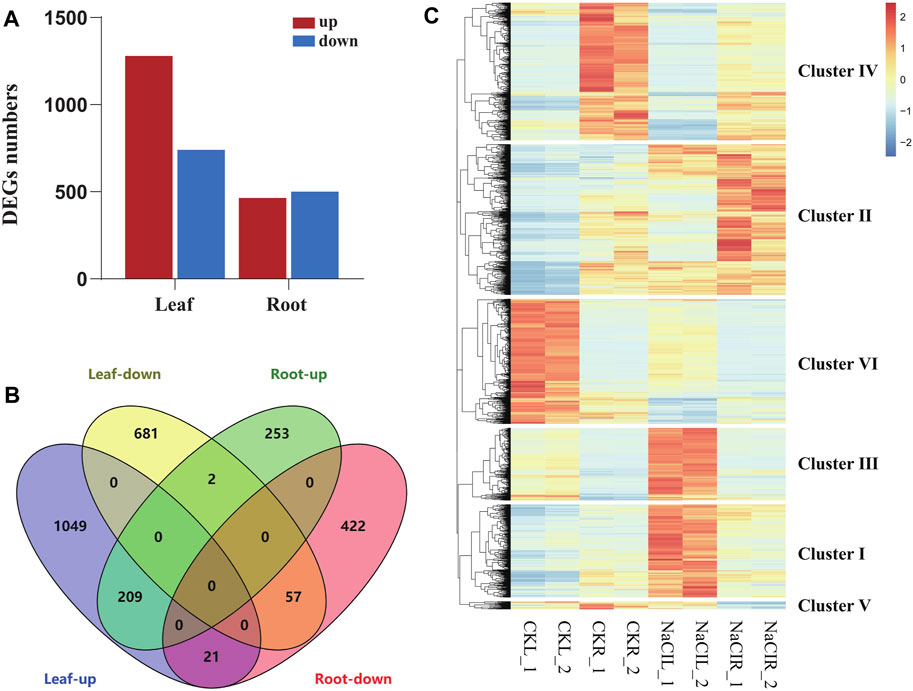
FIGURE 1. Analysis of differentially expressed genes in Eutrema upon 300 mM NaCl. (A) Numbers of differentially expressed genes (DEGs). (B) Venn diagram demonstrated the common and specific DEGs in roots and leaves. (C) Heatmap demonstrated the distinguished expression patterns of DEGs. The transcript levels calculated as RPKM are shown in the color legend.
To analyze the differential expression patterns of all 2,696 DEGs in detail, we conducted the hierarchical clustering analysis of these genes by a heatmap, and six major clusters were distinguished (Figure 1C, Supplementary Table S2). Cluster I and cluster III contained 427 and 333 genes, respectively, which were highly induced by NaCl in leaves, such as lignin biosynthesis-related genes [CCR (Thhalv10014117m, Thhalv10025830m) and COMT (Thhalv10007957m) in cluster I; HCL (Thhalv10000635m), C3′H (Thhalv10017418m), and CCR (Thhalv10017002m) in cluster III] (Figure 1C, Supplementary Table S2). Cluster II consisted of 692 genes, and most of them showed an increased expression in roots and leaves when exposed to salt stress condition, including some genes encoding LEA proteins (Thhalv10019035m and Thhalv10009011m). Cluster IV contained 632 genes, and most transcripts in the cluster were significantly reduced in roots upon salt stress. In cluster V, all 36 genes were strikingly downregulated in roots, of which three genes (Thhalv10000931m, Thhalv10004985m, and Thhalv10005285m) belong to the members of AP2/ERF-ERF TF families. Furthermore, 575 genes in cluster VI, showed a similar expression pattern with reduced expression in leaves when responding to salt, of which the genes (Thhalv10010685m, Thhalv10025982m, and Thhalv10025711m) were involved in photosynthesis (Figure 1C, Supplementary Table S2).
Gene Ontology and Kyoto Encyclopedia of Genes and Genomes Enrichment Analysis of DEGs
To understand the functions of DEGs in the leaves and roots of Eutrema seedlings under salt stress, GO terms of DEGs were annotated and analyzed. The result showed that DEGs were enriched in “biological processes (BP),” “cellular components (CC),” and “molecular functions (MF),” including 51 GO terms in leaves and 49 GO terms in roots. Furthermore, the number of GO terms in BP, CC, and MF were 22, 17, and 12 in leaves, 22, 14, and 13 in roots, respectively (Figure 2A, Supplementary Table S3). Moreover, the GO terms, including “cellular process,” “metabolic process,” “single-organism process” and “response to stimulus” in BP, “cell,” “cell part,” “organelle,” and “membrane” in the CC and “binding,” “catalytic activity,” and “nucleic acid binding transcription factor activity” in the MF category, were the top terms that significantly enriched in both leaves and roots, which suggest a high degree of changes occurring in metabolic activity, in response to stimulus, membrane and the binding activity upon salt stress in Eutrema (Figure 2A).
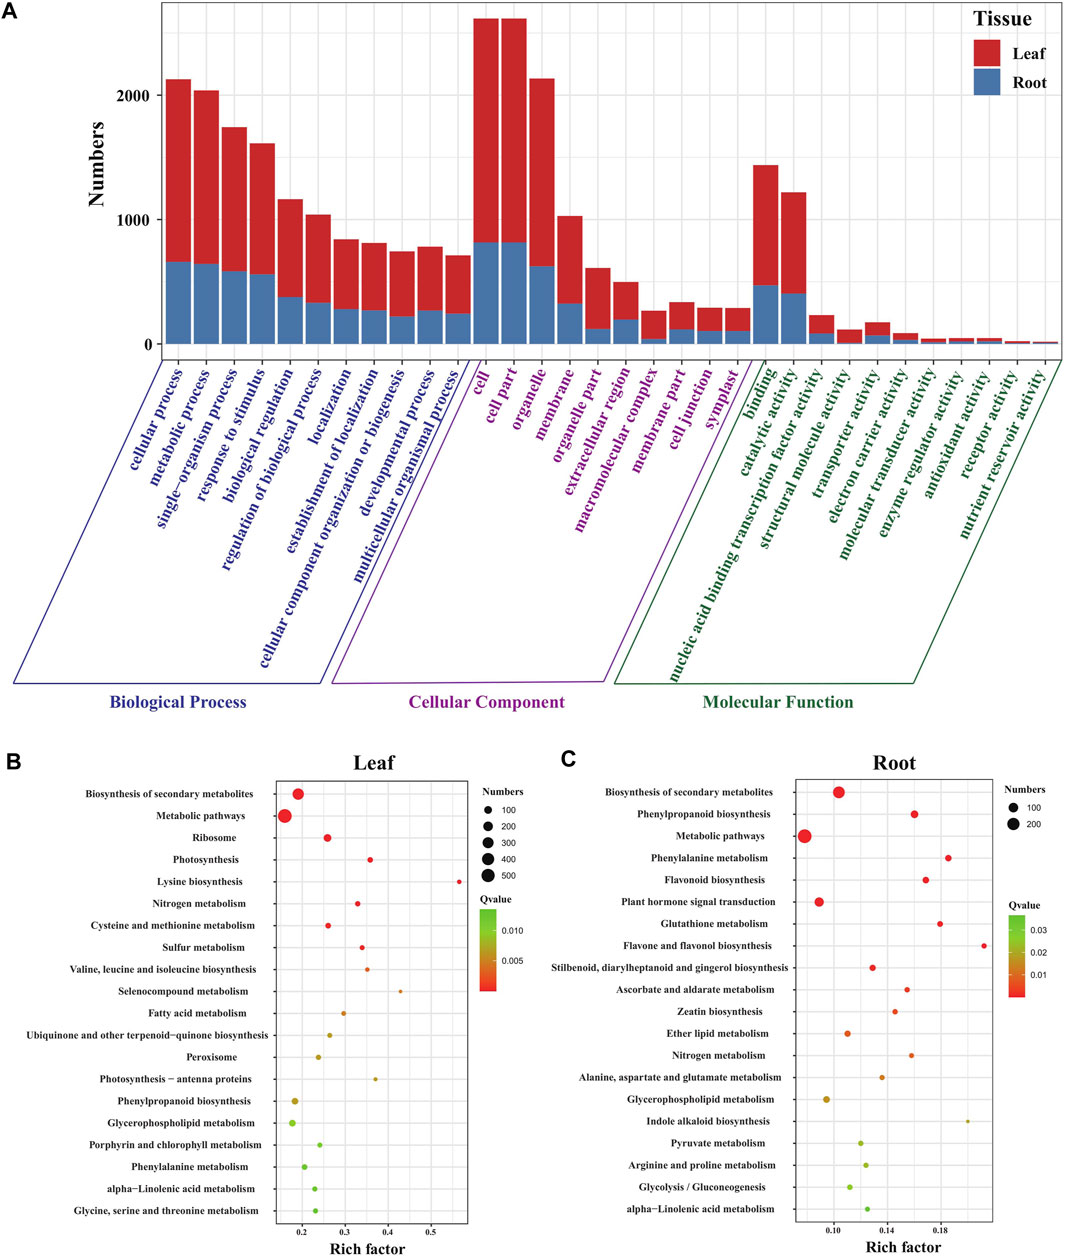
FIGURE 2. Function analysis of DEGs in Eutrema under salt stress. (A) Histogram of GO terms in leaves and roots of Eutrema. (B) Top 20 KEGG pathways in leaves. (C) Top 20 KEGG pathways in roots. The rich factor is the ratio of numbers of DEGs to a total of annotated genes in a certain pathway. The color of dots represents the significance of DEGs in specific pathways, and the smaller q-value indicates higher significance. The size of dots indicates the numbers of DEGs enriched.
To investigate the functional classification of DEGs in Eutrema upon salt stress, the enrichment analysis of KEGG pathways was performed. The result demonstrated that a total of 1710 DEGs were assigned to 126 KEGG pathways including 122 KEGG pathways in leaves, and 114 pathways in roots (Supplementary Table S4). Of which, 32 and 21 pathways were significantly enriched, respectively, in leaves and roots (p-value< 0.05), and the most represented top 20 pathways are shown in Figures 2B,C. In the top 20 pathways, five pathways of “biosynthesis of secondary metabolites,” “metabolic pathways,” “phenylpropanoid biosynthesis,” “glycerophospholipid metabolism,” and “phenylalanine metabolism” were shared in leaves and roots; the specific pathways of “ribosome,” “photosynthesis,” “photosynthesis-antenna proteins,” and “porphyrin and chlorophyll metabolism” were the most represented pathways in leaves (Figure 2B), whereas “flavonoid biosynthesis,” “flavone and flavonol biosynthesis,” “glutathione metabolism,” and “ascorbate and aldarate metabolism” pathways were the most represented pathways in roots (Figure 2C). The result indicated that salt stress markedly affected a variety of metabolic processes both in leaves and roots, and photosynthesis in leaves and non-enzymatic antioxidant pathways in roots.
Validation of RNA-Seq Result Using qRT-PCR
To confirm the reliability of the RNA-seq data, sixteen DEGs were randomly selected from the leaves and roots of Eutrema for qRT-PCR validation. As shown in Figure 3A, these genes represent diverse functional categories and various transcript levels, including the coding genes of transcription factors (NAC47, ERF094, zinc finger protein, and F-box protein FBX), stress-related proteins (potassium transporter POT, APX, LEA, HSP23.6, and Ferritin2), lipid metabolism–related proteins (phosphatidylethanolamine-binding protein PEBP and inositol-3-phosphate synthase IPS3, LTP), phosphorylation-related proteins (PP2C3, MAPKKK17 and 3′-phosphoadenosine 5′-phosphosulfate synthase PAPSS), and metallothionein type MT4 (Supplementary Table S5). Of which, there were 11 upregulated and 4 downregulated genes both in leaves and roots, and only the EsPOT gene existed oppositely expressed trend between the leaves and roots upon salt stress (Supplementary Table S5).
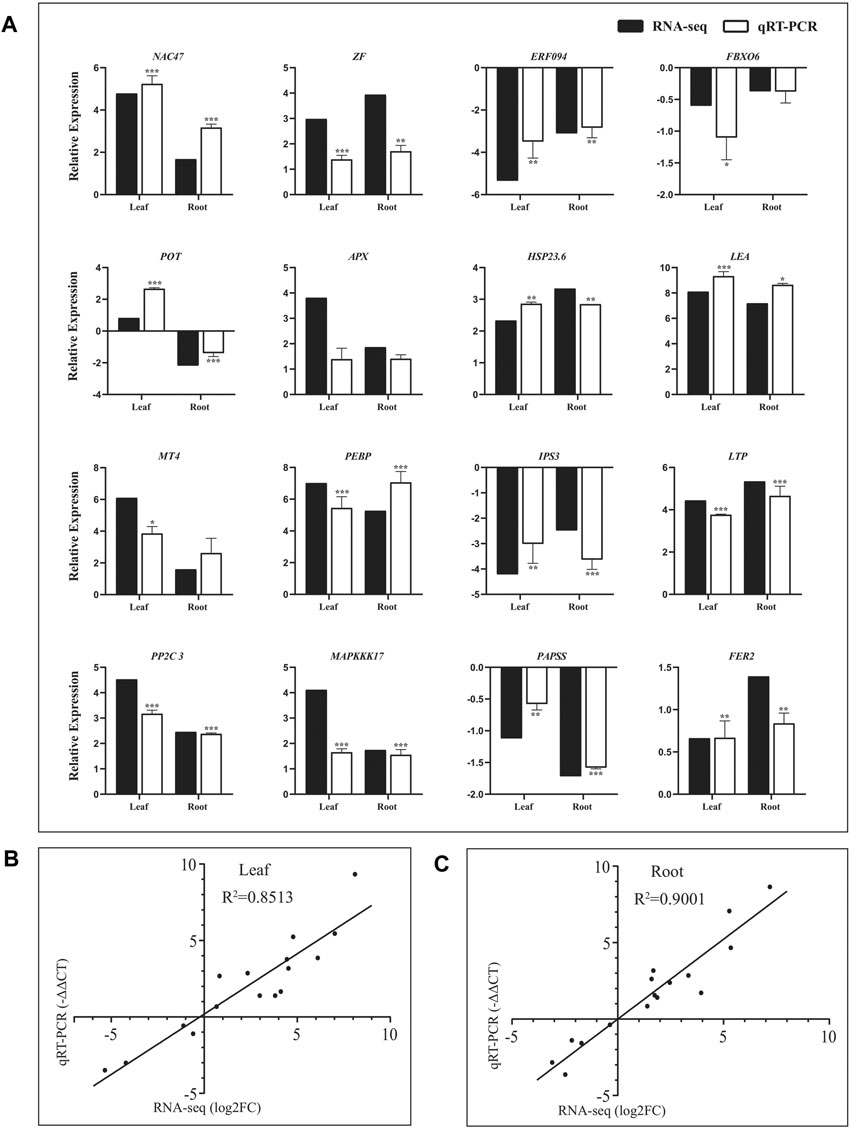
FIGURE 3. Validation of RNA-seq result using quantitative real-time PCR. (A) Expression verification of 16 genes in RNA-seq by qRT-PCR. Black bars indicate log2FC of DEGs in RNA-seq, and white bars show −ΔΔCT of DEGs in qRT–PCR. Correlation analysis of results between RNA-seq and qRT–PCR in leaves (B) and roots (C). The data of log2FC (Y-axis) were obtained by RNA-seq, and -ΔΔCT (X-axis) was analyzed by qRT-PCR. The Ubiquitin gene (Thhalv10000782m) was used as an internal control. Each set of data were obtained from three repeats.
The relative expression levels (log2NaCl/CK) of 16 genes in RNA-seq were validated using RT–PCR (-ΔΔCT), and the results showed that there was good consistency on the expression levels of these genes analyzed both in leaves (R2 = 0.8513) and roots (R2 = 0.9001) between using qRT-PCR and RNA-seq, indicating the results of RNA-seq were trustworthy (Figure 3, Supplementary Table S5).
Identification of Transcription factors Genes Responding to Salt Shock
Transcription factors (TFs) are central regulators of gene expression, and some members in WRKY, AP2/ERF-ERF, NAC, bZIP, MYB, HSF, and C2H2 families reported to be associated with enhanced stress tolerance in plants (Kiełbowicz–Matuk, 2012; Scharf et al., 2012; Wang et al., 2016). To provide an insight into the TF responding salt stress in Eutrema, the expression of TF genes annotated was analyzed and visualized with barplotting and heatmap. We found that 210 genes were annotated to 36 TF families with a significantly changed expression, including AP2/ERF–ERF, MYB, WRKY, bZIP, NAC, bHLH, HSF, and C2H2 during salt stress (Figure 4A, Supplementary Table S6). Among which, the expression of 134 and 36 TF genes were increased more than two-fold during salt stress, respectively, in leaves and roots. These upregulated TF genes mainly include WRKY (17), AP2/ERF–ERF (15), NAC (13), bZIP (12), MYB (11), C2H2 6) and HSF 5) genes in leaves, and HSF (6), NAC 5), and MYB 5) genes in roots (Figure 4A, Supplementary Table S6).
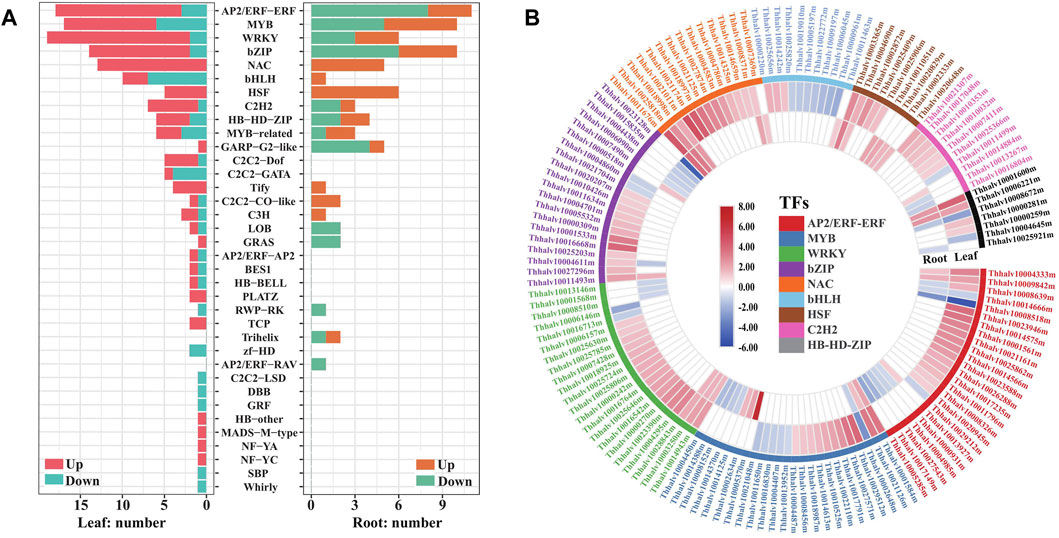
FIGURE 4. Analysis of transcription factors responding to salt stress in leaves and roots in Eutrema. (A) Number distribution of up/downregulated TF families in responsive to salt stress in leaves (left bars) and roots (right bars). The red or orange color indicates the upregulated genes, and the blue or green color indicates the downregulated genes. (B) Heatmap analysis of DEGs in top 9 TF families with higher numbers. The differential transcript levels calculated as log2 (NaCl/CK) are shown in the color legend, and the red color indicates upregulated genes, and the blue indicates downregulated genes. The various color bars represent different TF families.
It is worth emphasizing that all NAC and HSF transcript levels in DEGs were found to increase, both in leaves and roots after salt treatment. For example, EsRD26 (Thhalv10025818m) and EsAF1 (Thhalv10008371m) were upregulated both in roots and leaves, while the transcript level of EsNAC47 (Thhalv10021011m), EsNAC3 (Thhalv10021174m), EsNAP (Thhalv10018997m), and EsNAC46 (Thhalv10021125m) increased more than seven-fold in leaves (Figure 4B, Supplementary Table S6). In HSF genes, the salt-induced expression of EsHSF6A (Thhalv10003365m) were up to 7.1 and 9.2 times in leaves and roots, respectively, and the expression of EsHSF4A (Thhalv10025409m) in leaves and EsHSF6B (Thhalv10020829m) in roots were also markedly induced (Figure 4B, Supplementary Table S6).
In addition, most types of TF families existed in differentially expressed patterns between the leaves and roots. Of which, numbers of upregulated AP2/ERF–ERF and bZIP were more than the downregulated genes in leaves, but there existed an opposite trend in roots (Figure 4A, Supplementary Table S6). Meantime, the expression of cytokinin response factors CRF1 and CRF5 genes, being AP2/ERF–ERF family members, were increased up to 13 and 6.6 times in leaves, respectively; but no differential expressions were detected in roots (Figure 4B, Supplementary Table S6). The DEGs of C2H2-Dof (5) and C2H2–GATA (5) were only found in leaves, while Trihelix (2) and AP2/ERF–RAV (1) were found only in roots (Figure 4A, Supplementary Table S6). In brief, salt stress resulted in extensive response of TF genes in AP2/ERF–ERF, MYB, bZIP, WRKY, NAC, and HSF families, and the expression patterns of most of them were different between the leaves and roots of Eutrema.
Enhancement in Expression of Lignin Biosynthesis Genes and Lignin Content During Salt Stress
Enhanced cell wall lignification has been observed in plants exposed to various environmental stresses (Dong and Lin, 2021). In general, NaCl may enhance lignin production that solidifies the cell wall, and the enhanced lignin biosynthesis is a critical factor in plant adaptation and tolerance to salt stress (Neves et al., 2010; Chun et al., 2019). Phenylpropanoids, derived from phenylalanine, are the pivotal metabolic precursors to synthesize the lignin monolignol (Dong and Lin, 2021). Our transcriptome demonstrated 40 DEGs including PAL (2), C4H (2), C3′H (1), COMT (5), CCoAOMT (1), HCT (8), 4CL (8), CCR (5), CAD (1), and POX/POD (7) were enriched in the phenylalanine metabolism (ko00360) and phenylpropanoid (ko01904) pathways involved in lignin biosynthesis. Moreover, these gene expressions significantly changed in the leaves and/or roots of Eutrema upon salt stress (Figure 5A and Figure 5B, Supplementary Table S7).
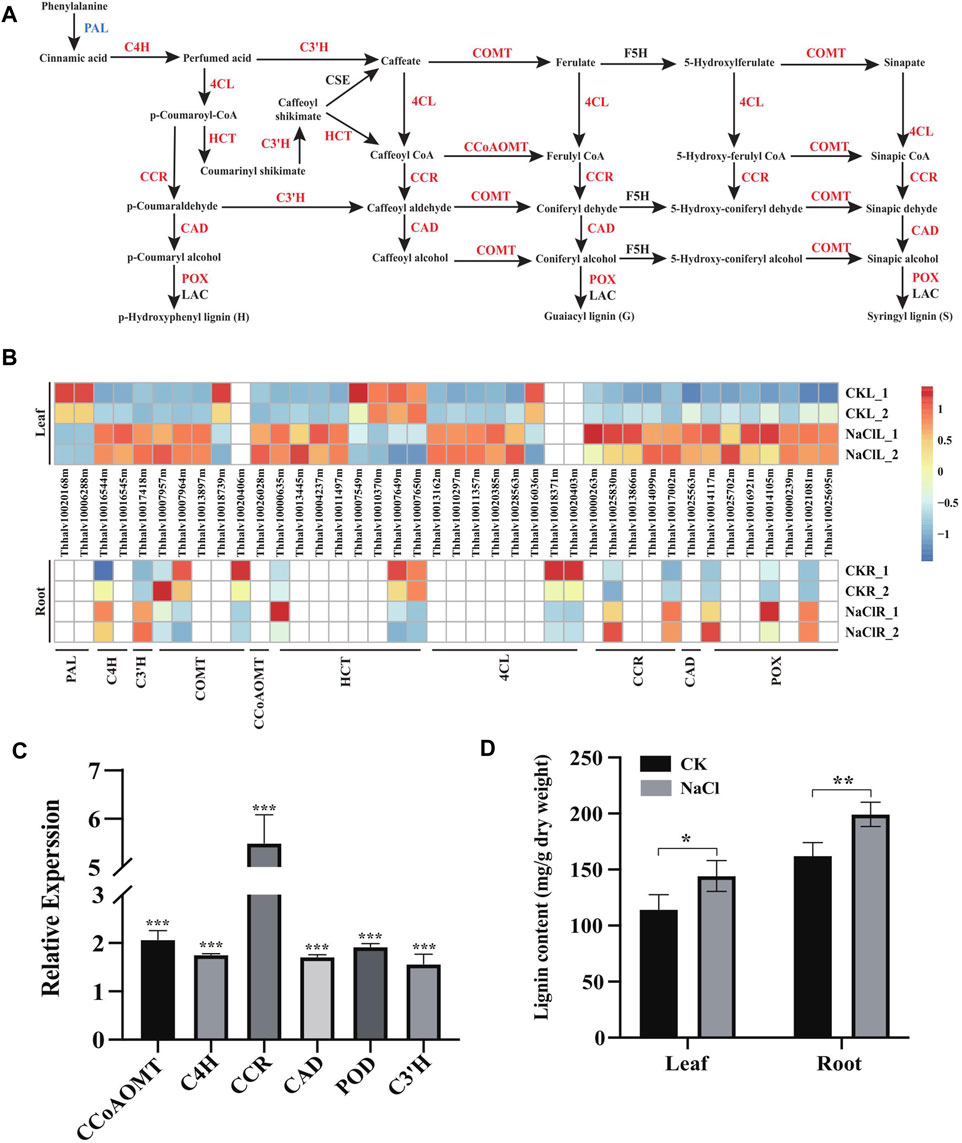
FIGURE 5. Expression analysis of DEGs enriched in the lignin biosynthesis pathway, and lignin content change under salt stress. (A) DEGs enriched in the lignin biosynthesis pathway in leaves. PAL, phenylalanine ammonia-lyase; C4H, cinnamic acid 4-hydroxylase; C3′H, p-coumaroyl shikimate 3′-hydroxylase; COMT, caffeate 3-O-methyltransferase; F5H, ferulate 5-hydroxylase; 4CL, 4-coumaric acid: CoA ligase; HCT, hydroxycinnamoyl CoA: shikimate/quinate hydroxycinnamoyl transferase; CCR, cinnamoyl CoA reductase; CAD, cinnamyl alcohol dehydrogenase; POX, peroxidase; and LAC, laccase. (B) Heatmap analysis of DEGs enriched in the lignin biosynthesis pathway in leaves and roots. The transcript levels calculated as RPKM are shown in the color legend. (C) Relative expression (2−ΔΔCT) of lignin biosynthesis genes in NaCl-treated Eutrema leaves was determined using quantitative real-time PCR. The Ubiquitin gene (Thhalv10000782m) was used as an internal control. Each set of data were obtained from three repeats. (D) Lignin content of leaves and roots in salt-treated and normal growth Eutrema plants.
In the phenylpropanoid pathway, expression of EsC4H (Thhalv10016545m), EsHCT (Thhalv10000635m), EsC3′H (Thhalv10017418m), and EsCCR (Thhalv10017002m) genes was induced both in leaves and roots, while the transcript level of EsC4H (1), Es4CL (5), EsHCT (3), EsCCR (4), and EsCAD (1) was markedly enhanced only in leaves that are responsive to salt (Figures 5A,B, Supplementary Table S7). Furthermore, the upregulation of EsCCoAOMT1 (Thhalv10026028) and EsCOMT1 (Thhalv10007957m, Thhalv10007964m, and Thhalv10013897m) genes was observed in the salt-treated leaves of plants. The transcripts of EsCOMT genes (Thhalv10007957m and Thhalv10007964m) were strongly enhanced in the leaf tissue by 8 and 7.5 times but reduced expression in roots, indicating that there existed the different salt stress response patterns of EsCOMT genes between the leaves and roots (Figures 5A,B, Supplementary Table S7). Peroxidase (POD/POX) and laccase (LAC) are involved in the polymerization of monolignols (Xie et al., 2018). In this study, salt stress resulted in induced expression of three POX genes (Thhalv10021081m, Thhalv10014117m, and Thhalv10014105m) both in leaves and roots. However, the expression of EsPAL (Thhalv10020168m and Thhalv10006288m) was declined in leaves and not markedly altered in root tissues upon salt stress (Figures 5A,B, Supplementary Table S7). Additionally, the lignin biosynthesis genes are largely regulated at the transcription level by lignin-specific transcription factor (Zhou et al., 2009). For instance, Arabidopsis AtMYB15 could regulate defense-induced lignification via modulating the expression of lignin synthesis genes (Chezem et al., 2017). In Eutrema, there was an increase in the expression level of the EsMYB15 (Thhalv10022110m) gene up to 4.3 times in leaves upon salt stress (Supplementary Table S6), thus suggesting that EsMYB15 was possibly an important regulatory gene concerning lignification by modulating expression of lignin biosynthesis–related genes.
To validate the expression of lignin biosynthesis genes in RNA-seq, the leaves of 300 mM NaCl-treated and normal growth plants were used to analyze the expression of CCoAOMT, C4H, CCR, CAD, POD, and C3′H genes in the lignin biosynthetic pathway by quantitative real-time PCR (Figure 5C, Supplementary Table S5). The result showed that significantly upregulated CCoAOMT, C4H, CCR, CAD, POD, and C3′H genes were observed in Eutrema salt-treated leaves relative to the control in the normal growth condition (Figure 5C, Supplementary Table S5). To further understand NaCl-stimulated lignin production in Eutrema leaves and roots, 10-day salt-treated (300 mM NaCl) plants were employed to examine the lignin content. We found that salinity stress markedly increased the lignin accumulation of Eutrema leaf and root tissues (Figure 5D, Supplementary Table S8). Therefore, the enhanced lignification caused by the NaCl environment, which was suggested to be an adaptation mechanism for Eutrema in resisting salinity-imposed stress.
Taken together, salt shock induced the expression of 40 lignin biosynthesis genes and a lignin biosynthesis–regulating gene MYB15 in Eutrema RNA-seq. Combined with the verification result of qRT-PCR and the enhanced lignin content under salt stress, as well as the function of lignification in enhancing the cell wall integrity and facilitating water transport, we inferred that the lignin biosynthesis could be an important response for Eutrema encountering salt environment.
Increased Expression of Genes in Autophagy and Peroxisome Pathways Upon Salt Stress
Salt stress can cause oxidative damage to cells, resulting in the accumulation of ROS and oxidized proteins. Autophagy plays a vital role on scavenging oxidized proteins (Xiong et al., 2007b). Atg8, Atg4, Atg7, and Atg3 proteins are involved in Atg8-mediated ubiquitination reactions, and Vac8 are associated with autophagy initiation and localize autophagosome formation within the cell (Hollenstein et al., 2019). The transcriptome profiling of Eutrema upon salt stress showed that the expression of ten DEGs including EsVac8 (4), EsAtg8 (3), EsAtg4 (1), EsAtg7 1), and EsAtg3 (1) was significantly increased in leaves (Figures 6A,B, Supplementary Table S9). To further verify the expression of autophagy-related genes in RNA-seq, we used the real-time quantitative PCR to analyze the transcript abundance of EsVac8-1 (Thhalv10023320m), EsVac8-2 (Thhalv10020852m), EsAtg8 (Thhalv10021784m), and EsAtg4 (Thhalv10001432m) genes in leaves that involved in the autophagy pathway and found that the expression of these genes checked was induced when Eutrema was exposed to saline conditions compared with the control (Figure 6C, Supplementary Table S5). The aforementioned genes were all enriched in the autophagy pathway (ko04140), which are mainly involved in processes of autophagy initiation, vesicle expansion, and completion. Hence, we infer that the enhanced expression of DEGs enriched in the autophagy pathway (ko04140) could contribute to the defense response of plants when Eutrema was exposed to saline shock.
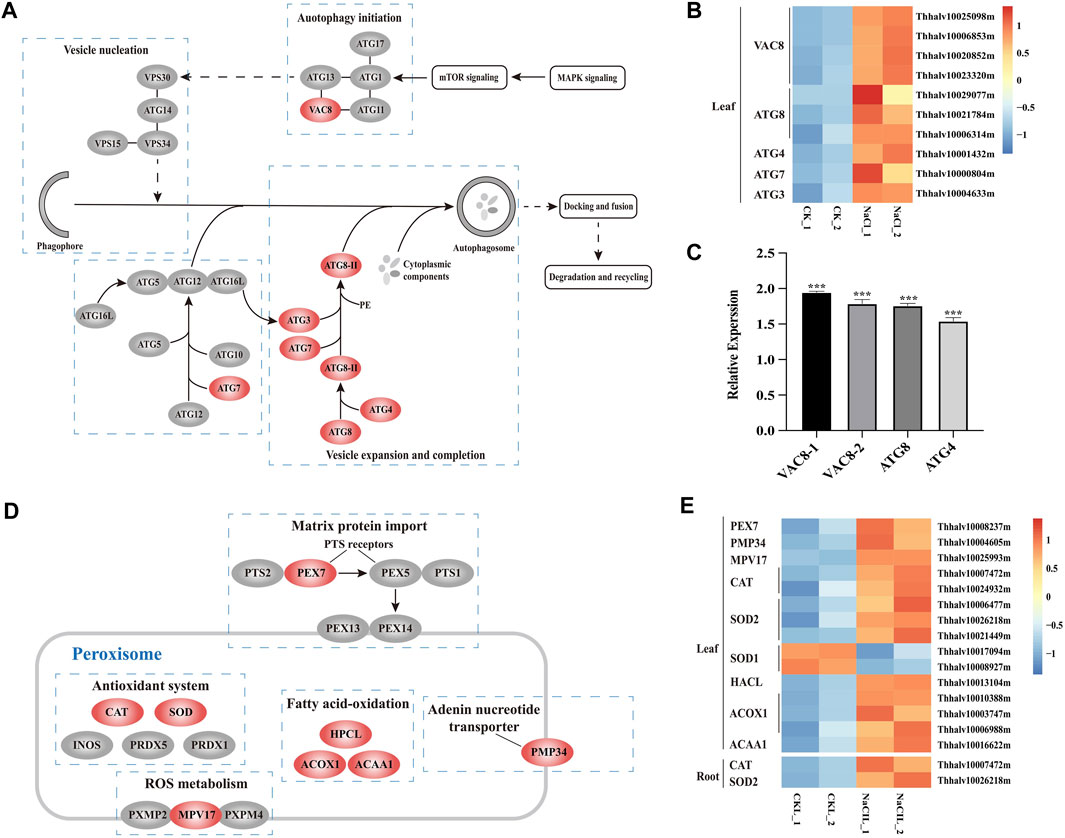
FIGURE 6. DEGs enriched in pathways of autophagy and peroxisome, and heatmap analysis of DEGs. (A) DEGs enriched in the autophagy pathway. MAPK, mitogen-activated protein kinase; mTOR, mammalian target of rapamycin; ATG, autophagy-related protein; VAC, vacuolar membrane protein; and VPS, vacuolar protein sorting. (B) Heatmap analysis of DEGs of leaves enriched in the autophagy pathway. The transcript levels calculated as RPKM are shown in the color legend. (C) Relative expression (2−ΔΔCT) of autophagy-related biosynthesis genes in NaCl-treated Eutrema leaves determined by qRT-PCR. The Ubiquitin gene (Thhalv10000782m) was used as an internal control. Each set of data were obtained from three repeats. (D) DEGs enriched in the peroxisome pathway. PEX, peroxin; PTS, peroxisome targeting signal; CAT, catalase; SOD, superoxidase dismutase; INOS, nitric oxide synthases; PRDX, peroxiredoxin; HPCL, 2-hydroxyacyl-CoA lyase; ACOX, acyl-coA oxidase; ACAA, acetyl-CoA acyltransferase; PMP, peroxisomal membrane protein. (E) Heatmap analysis of DEGs enriched in the peroxisome pathway. The transcript levels calculated as RPKM are shown in the color legend.
The peroxisome pathway was involved in eliminating exceeded ROS generated by various stresses and balancing the ROS level. The proteins of PEX7 and MPV17 exist on the peroxisome membrane, of which AtMPV17 contributes to osmotic stress tolerance in plants (Wi et al., 2020), while PEX7 acts as an import receptor of peroxisomal-targeting signal PTS2 (Woodward and Bartel, 2005). In the present study, 15 DEGs existed significant changes and were enriched in the peroxisome pathway (ko04146) in leaves and/or roots in Eutrema, among which the transcript level of five genes were obviously upregulated in salt-treated leaves, including EsPEX7 (Thhalv10008237m) and EsMPV17 (Thhalv10025993m) (Figures 6D,E, Supplementary Table S10). In addition, the genes encoding antioxidant enzymes, such as EsCAT (Thhalv10007472m) and EsSOD2 (Thhalv10026218m), were markedly induced both in leaves and roots. Particularly, the expression of EsCAT (Thhalv10007472m) was strongly enhanced by 7.5 and 4 times, respectively, in leaves and roots. However, the transcripts of EsCAT (Thhalv10024932m) and EsSOD2 genes (Thhalv10006477m and Thhalv10021449m) were significantly induced only in leaves (Figures 6D,E, Supplementary Table S10). In addition, the expression level of five genes including EsHPCL2 (Thhalv10013104m), EsACOX1 (Thhalv10010388m, Thhalv10003747m, and Thhalv10006988m), and EsACAA1 (Thhalv10016622m) associated with α- and β-oxidation of fatty acid, was markedly elevated in leaves (Figures 6D,E, Supplementary Table S10). Therefore, it was suggested that proteins targeted to peroxisome involved in the ROS metabolism, α- and β-oxidation of fatty acid, could be an important aspect for Eutrema in response to salt shock.
NaCl Effects on the Expression of Genes Involved in Carbohydrate Metabolism
Analysis of the genes affecting starch and carbohydrate metabolism revealed that salt stress results in transcript abundance differences of ∼45 genes in salinized Eutrema plants relative to controls. These DEGs were enriched in starch and sucrose metabolism (ko00500), fructose, and mannose metabolism (ko00051) and galactose metabolism (ko00052), involved in the biosynthesis of sucrose, trehalose, raffinose, xylose, pectin, degradation of starch, and the conversion among glucose, fructose, and galactitol, among which 35 DEGs markedly upregulated in leaves (Figure 7, Supplementary Table S11).
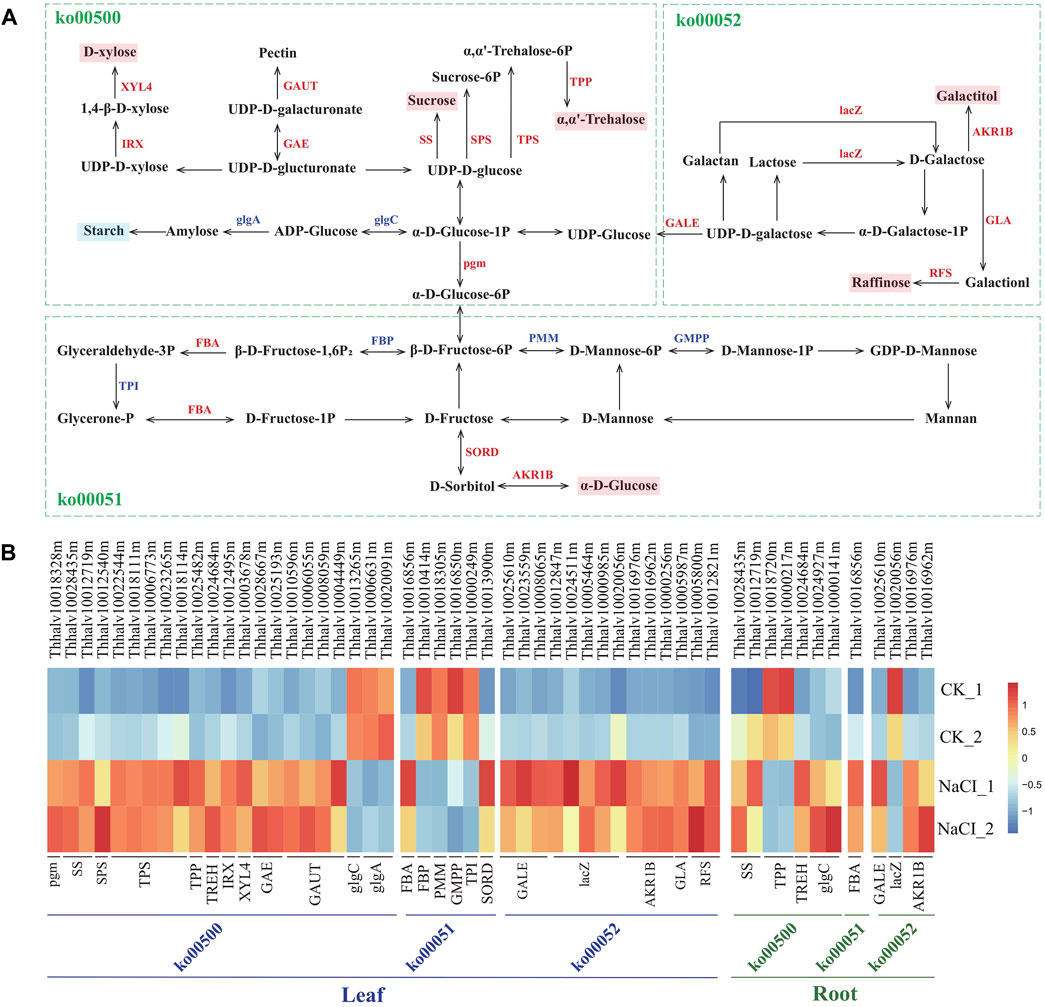
FIGURE 7. Schematic view of genes participating in starch and carbohydrate metabolism and heatmap analysis of DEGs. (A) The schematic view of genes participating in carbohydrate metabolism. XYL4, xylan 1,4-beta-xylosidase; IRX, 1,4-beta-D-xylan synthase; GAUT, galacturonosyltransferase; GAE, UDP-glucuronate 4-epimerase; SS, sucrose synthetase; SPS, sucrose phosphate synthetase; TPS, trehalose-6-phosphate synthase; TPP, trehalose-6-phosphate phosphatase; lacZ, beta-galactosidase; AKR1B, aldehyde reductase; GLA, alpha-galactosidase; RFS, raffinose synthase; glgA, glycogen synthase; glgC, glucose-1-phosphate adenylyltransferase; GALE, UDP-glucose 4-epimerase; pgm, phosphoglucomutase; FBA, fructose-bisphosphate aldolase; FBP, fructose-1,6-bisphosphate phosphatase; PMM, phosphomannomutase; TPI, triosephosphate isomerase; GMPP, mannose-1-phosphate guanylyltransferase; SORD, L-iditol 2-dehydrogenase. (B) Heatmap analysis of DEGs enriched in pathways of carbohydrate metabolism. The transcript levels calculated as RPKM are shown in the color legend.
Sucrose and trehalose, serving as an osmotic protectant to stabilize proteins and membranes, protect organisms against several physical and chemical stresses, including salinity stress (Gupta and Huang, 2014; Ruan, 2014). The synthesis-related genes of sucrose and trehalose, remarkably affected by salinity, were analyzed in the research. The result showed that the expression of SS genes encoding sucrose synthetase (Thhalv10028435m and Thhalv10012719m) both in leaves and roots was enhanced more than three-fold by salt stress. The expression of five TPS genes (Thhalv10022544m, Thhalv10018111m, Thhalv10006773m, Thhalv10023265m, and Thhalv10018114m) encoding trehalose-6-phosphate synthase and one TPP gene (Thhalv10025482m) encoding trehalose-6-phosphate phosphatase increased more than two-fold in leaves (Figure 7, Supplementary Table S11). Additionally, raffinose regarded as a compatible solute, antioxidant is involved in stress defense mechanism (ElSayed et al., 2014). Here, two RFS genes (Thhalv10005800m and Thhalv10012821m) encoding raffinose synthase and one GLA gene (Thhalv10005987m) encoding galactosidase possess significantly elevated expression in leaves, wherein one RFS gene (Thhalv10005800m) with ∼12 times enhanced expression (Figure 7, Supplementary Table S11). In short, the transcript abundance of most of SS, TPS, TPP, RFS, and GLA genes involved in the synthesis of sucrose, trehalose, and raffinose was substantially higher in salt-treated plants than in control, indicating that osmotic adjustment is an important mechanism for Eutrema responding to salt shock.
In addition, the expression level of xylose biosynthesis genes IRX (Thhalv10012495m) and XYL4 (Thhalv10003678m), as well as pectin synthesis genes GAE (Thhalv10028667m and Thhalv10025193m) and GAUT (Thhalv10010596m, Thhalv10006055m, Thhalv10008059m, and Thhalv10004449), increased more than three-fold in leaves after salt stress (Figure 7, Supplementary Table S11). Moreover, the expression of SORD (Thhalv10013900m) and AKR1B (Thhalv10016976m, Thhalv10016962m, and Thhalv10000256m) genes related to the synthesis of glucose and sorbitol, lacZ genes (5) coding galactosidase, and Pgm (Thhalv10018328m) and GALE (Thhalv10025610m, Thhalv10023559m, and Thhalv10008065m) genes involved in glucose metabolism was also upregulated in leaves. In general, the hydrolysis of starch may be involved in stress-induced response (Krasensky and Jonak, 2012). Our research showed that the level of expression of GlgA (Thhalv10006631m and Thhalv10020091m) and GlgC (Thhalv10013265m) genes related to the synthesis of amylose and starch was reduced; this was consistent with the general conclusion of a decrease in the starch content under stress (Figure 7, Supplementary Table S11). Collectively, the result revealed that the expression of most genes involved in the synthesis of soluble carbohydrates was upregulated, and the genes related to starch synthesis was downregulated in leaves, which supported that the soluble carbohydrates serving as an osmotic adjustment substance play a critical role in Eutrema responding to salt stimulus.
Contribution of LEA Proteins in Responsive to Salt Stress
The function of LEA proteins has been associated with environmental stress such as drought, salt, and cold, in plants (Tunnacliffe and Wise, 2007). On the basis of domain structures, numbers, and composition of conserved repeat motif, LEA proteins are classified into eight families such as LEA1, LEA2, LEA3, LEA4, LEA5, LEA6, dehydrin, and SMP (seed maturation protein) in the Pfam database (Liang et al., 2016).
In order to analyze the contribution of LEA proteins in Eutrema upon salt stress, the genome-wide identification of LEA gene families was performed using hmmsearch software combined with the blasting to the homologous genes in Arabidopsis. The result showed that a total of 64 LEA proteins identified were classified into eight families, based on the analysis of the conserved domain structures, of which, there were 36 members in LEA2 of the largest families, whereas only two members in LEA5 of the smallest families (Figure 8A). Furthermore, salt stress strongly enhanced the expression of EsLEA1 (Thhalv10017485m and Thhalv10014897m), EsLEA4 (Thhalv10017525m), EsLEA6 (Thhalv10000405m), and EsDehydrin (Thhalv10004906m and Thhalv10008706m) genes both in the leaves and roots of Eutrema. LEA2 protein members typically accumulated in dehydrating plant seeds and/or in tissues subjected to drought, salinity, and low temperature (Veeranagamallaiah et al., 2011). Dehydrins (DHNs), previously called LEA2, is responsive to ABA; thus, DHNs are also referred to as RAB proteins (Hundertmark and Hincha, 2008). The expression of DHNs could be induced in vegetative tissues by dehydration caused by drought, salinity, and cold (Zhang H.-f. et al., 2020). This study showed that the expression level of genes EsLEA2 (Thhalv10009011m, Thhalv10014557m, Thhalv10010532m, Thhalv10019035m, and Thhalv10026222m), EsLEA3 (Thhalv10029091m), and EsDehydrin (Thhalv10008313m and Thhalv10019152m) was elevated more than 2 times in leaves (Figure 8B, Supplementary Table S12). Thus, the enhanced expression of LEA2 and Dehydrin protein families, acting as protecting plants from dehydrating damage, was possibly an outstanding response for Eutrema encountering salt environment.
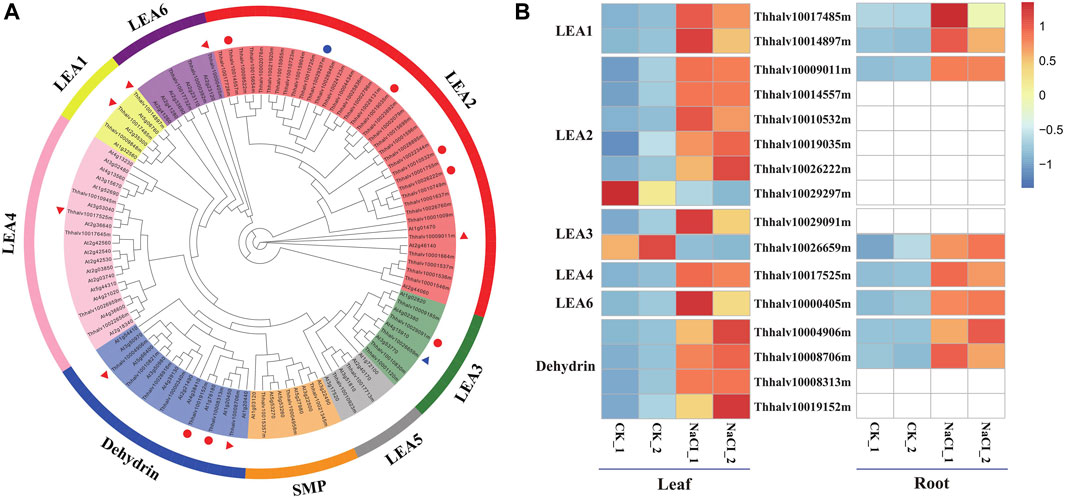
FIGURE 8. Phylogenetic analysis of LEA proteins and heatmap exhibited the expression of DEGs. (A) Phylogenetic analysis of LEA proteins. Red triangles represent the significantly upregulated LEA genes both in leaves and roots; blue triangles represent the LEA gene markedly downregulated in leaves and upregulated in roots. Red circles indicate significantly upregulated LEA genes only in leaves; blue circles indicate markedly downregulated LEA genes only in leaves. LEA, late embryogenesis abundant; SMP, seed maturation protein; Dehydrin, dehydrin protein. (B) Heatmap analysis of markedly differential LEA genes expression. The transcript levels calculated as RPKM are shown in the color legend.
Discussion
Plants are often subjected to high soil salinity during their life cycle (Bressan et al., 2009; Zhao et al., 2020). Understanding the expression changes of co-occurring genes when plants respond to salt is an important aspect for us to explore the mechanisms of retaining plant growth under saline conditions. In this study, RNA-seq analyses were carried out to identify differentially expressed genes in response to salt shock, and we found that most of the genes involved in lignin and soluble sugar biosynthesis as well as scavenging of ROS and oxidized proteins were significantly upregulated; thus, it is proposed that upregulated expression of these genes possibly contributes to the salt tolerance of the halophytic Eutrema.
Transcription Factors Involved in Salt Stress Response
TFs and the corresponding cis-acting elements function as molecular switches in the conversion of stress signal perception to stress-responsive gene expression (Zhao et al., 2020). The regulation of gene expression at the transcriptional level is mostly mediated by the sequence-specific binding of transcription factors to the cis-acting promoter elements (Kiełbowicz-Matuk, 2012).
In Arabidopsis, it has been reported that AtWRKY11, AtWRKY15, AtWRKY17, and AtWRKY46 are related to the response to salt stress (Vanderauwera et al., 2012; Ding et al., 2015; Ali et al., 2018), and AtWRKY15 participated in the ROS-induced salt and osmotic stress responses (Vanderauwera et al., 2012). Our RNA-seq result demonstrated that there existed a higher expression of 17 WRKY genes in leaves and 3 WRKY genes in roots in Eutrema, of which the expression of EsWRKY11 (Thhalv10025646m), EsWRKY15 (Thhalv10000270m), EsWRKY17 (Thhalv10000242m), EsWRKY6 (Thhalv10023390m), and EsWRKY33 (Thhalv10016542m) was markedly increased more than three-fold in leaves (Figure 4, Supplementary Table S6). Many members of AP2/ERF–ERF superfamily from various plant species reported to be involved in salt and other abiotic stress responses (Baillo et al., 2019). For example, AtDREB2B and AtDREB26 were highly responsive to salt and drought stress (Nakashima et al., 2000; Krishnaswamy et al., 2011), and AtDEAR4 could play an integrative role in the stress response and senescence via regulating ROS homeostasis (Zhang Z. et al., 2020). In accordance with the previous study, the expression of 15 AP2/ERF–ERF genes including EsDREB2B, EsDEAR4, and EsDREB26 was significantly induced in the leaves of Eutrema responding to salt in the study (Figure 4, Supplementary Table S6). Additionally, Arabidopsis AtAF1 gene enhanced the salt tolerance of plants in a previous report (Liu et al., 2016), and our study showed that one NAC family member EsAF1 (Thhalv10008371m) was upregulated both in roots and leaves upon salt stress, inferring its possible function in salt tolerance.
MYB and bZIP families are associated with different biological activities, including the response to abiotic and biotic stresses (Baillo et al., 2019). In Arabidopsis, it was reported that the expression of AtMYB74 and AtMYB102 was induced upon salt stress (Xu et al., 2015). A similar result that the transcripts of EsMYB74 (Thhalv10029512m) and EsMYB102 (Thhalv10027571m) were increased more than 11-fold by salt stress in leaves, whereas no significant expression differences in roots. Meanwhile, the expression of 12 bZIP genes was induced and that of 2 was reduced in leaves, while in roots, the expression level of six bZIP genes was upregulated and 2 was downregulated (Figure 4, Supplementary Table S6). Furthermore, EsbZIP1 (Thhalv10005532m) and EsbZIP9 (Thhalv10004701m) genes were only markedly induced in leaves, which was consistent with the expression of AtbZIP1 and AtbZIP9 genes previously reported to be enhanced by high-salt stress (Sun et al., 2012; Ortiz-Espín et al., 2017). The members of bHLH and C2H2-type zinc finger families are important TF groups, with the diverse functions in mediating plant stress response (Kiełbowicz-Matuk, 2012). When Eutrema was exposed to salt stress, the transcript levels of EsLRL1-1 (Thhalv10000220m) and EsLRL1-2 (Thhalv10025656m) being bHLH family were enhanced in leaves, while the expression of six C2H2 genes including EsZF2 (Thhalv10021307m) and EsSTZ/Zat10 (Thhalv10010032m) was also elevated in leaves upon salt stress (Figure 4, Supplementary Table S6).
Abscisic acid (ABA) could mediate numerous physiological processes and regulate the adaptive stress responses including the exclusion of excessive salts (Keskin et al., 2010). Some members of AP2/ERF–ERF, MYB, WRKY, bZIP, and NAC families have been reported to be regulated by ABA signaling in Arabidopsis and are associated with abiotic stress defense responses in plants (Zheng et al., 2019). In this study, the expression levels of 20 TF genes were markedly increased upon salt stress, such as EsDREB2B, EsDEAR4, EsDREB26, and EsERF8 of DREB superfamily; EsMYB74, EsMYB102, EsMYB94, EsDIV2, and EsMYB49 of MYB family; EsABI5, EsGBF3, EsABF3, and EsABF2 of bZIP family; EsWRKY6, EsWRKY33, EsWRKY11, and EsWRKY17 of WRKY family; and EsRD26, EsAF1, EsNAC47, of NAC family, in leaves and/or roots (Figure 4B, Supplementary Table S13). The promoter element analysis indicated that the promoters of these TF genes all contain ABA-responsive cis-elements using the PlantCare website (http://bioinformatics.psb.ugent.be/webtools/plantcare/html/) (Supplementary Table S13). Furthermore, according to the homologous genes previously reported in Arabidopsis (Zheng et al., 2019), it is inferred that the above 20 TF genes possibly participate in response to ABA.
In summary, salt stress led to a significant expression change of many TF members in WRKY, AP2/ERF–ERF, NAC, MYB, bZIP, and HSF families in leaves and/or roots, and the expression patterns of most numbers of TF families were different between the leaves and roots. Moreover, some transcription factor genes are likely involved in the ABA signaling pathway.
Enhancing Antioxidant Activity and Osmotic Protection Capacity Suggested Playing Key Roles in Response to Salt Stress in Eutrema
In general, plant cell walls suffer lignification during stress (Dong and Lin, 2021). Lignin, as a polyphenolic biopolymer, facilitates hydrophilic transport and contributes to cell rigidity (Boerjan et al., 2003). Our transcriptome analysis illustrated that the expression of 41 DEGs possibly involved in lignin biosynthesis was significantly influenced by salt shock, including genes of EsMYB15, PAL, C4H, C3′H, COMT, CCoAOMT, HCT, 4CL, CCR, CAD, and POX/POD (Figure 5A and Figure 5B, Supplementary Table S7). The lignification of the cell wall facilitates water transport of plants; thus, we further detected the lignin content, and the result demonstrated that 300 mM NaCl stress significantly enhanced lignin accumulation in Eutrema leaves and roots from 10-day salt-treated plants. Therefore, it is suggested that lignin biosynthesis could provide contribution for the halophytic Eutrema to respond to salt stress.
ROS production can be enhanced by many abiotic stresses, such as salt, drought, and high light (Van Breusegem and Dat, 2006). In leaves of Arabidopsis and Eutrema, irrigated with 0.15 and 0.3 M NaCl, respectively, the result documented an enhanced content of H2O2 in Eutrema compared to that in Arabidopsis after 7 days of treatment (Pilarska et al., 2016). However, a very low level of malondialdehyde (MDA) was detected in Eutrema leaves, indicating a low extent of oxidative damage to membrane lipids (Pilarska et al., 2016). Autophagy is associated with a wide range of stress responses through degrading oxidized proteins under stress conditions (Xiong et al., 2007a; Xiong et al., 2007b). In the study, there were six ATG and four Vac8 genes identified, and the markedly induced gene expression of ATG3 (1), ATG4 (1), ATG7 (1), ATG8 (3), and Vac8 (4) revealed that autophagy could play an important role in eliminating oxidized proteins caused by salt stress in Eutrema (Figures 6A–C, Supplementary Table S5 and Supplementary Table S9). In the peroxisome pathway, 15 DEGs, involved in matrix protein import, ROS metabolism, antioxidant system, and fatty acid oxidation, exerted significant changes upon salt stress (Figure 6D and Figure 6E, Supplementary Table S10). The result implied an increased expression of genes encoding transport proteins in the peroxisome membrane, antioxidant enzymes in the matrix, and genes involved in the α/β-oxidation of fatty acid oxidation, which is possibly a way for Eutrema to cope with salt stress via scavenging ROS generated by salt stress.
In addition, approximately 45 DEGs mainly participated in sugar metabolism, including galactose metabolism, starch and sucrose metabolism, and fructose and mannose metabolism, of which the expression of 35 DEGs were markedly upregulated in leaves (Figure 7, Supplementary Table S11). Salt-treated plants usually need a higher capacity to adjust osmotically to cope with salt stress (Krasensky and Jonak, 2012). Thereby, sugar metabolism pathways associated with osmotic adjustment are of great significance for the osmotic protection of Eutrema. In contrast to other proteins involved in desiccation tolerance caused by drought and salt, LEA proteins have no apparent enzymatic activity and might act as the “molecular shield function” to protect enzymes from induced aggregation under stress conditions (Goyal et al., 2005). LEA proteins also aid in the formation of the glassy state, in which nonreducing sugars accumulate in the cytoplasm of plants during periods of desiccation (Shimizu et al., 2010). For example, the expression of HVA1, an LEA3 protein from barley (Hordeum vulgare L.), conferred tolerance to salt stress in transgenic rice plants (Xu et al., 1996). Although LEA proteins are mainly observed in seeds, they have also been detected in seedlings, buds, and roots of plants (Hundertmark and Hincha, 2008). In our research, there was markedly induced expression of EsLEA1, EsLEA4, EsLEA6, and EsDehydrin genes in leaves and/or roots (Figure 8, Supplementary Table S12), implying the accumulation of LEA proteins is an important strategy for Eutrema to deal with salt stress.
Eutrema tolerates extreme salinity, cold, drought, ozone (Inan et al., 2004; Li et al., 2006; Amtmann, 2009; Hou and Bartels, 2015). So far, the studies on the transcript profile in Eutrema found that several stress-associated genes have a constitutively higher expression in the absence of stress (Inan et al., 2004; Taji et al., 2004; Gong et al., 2005). For instance, Fe-SOD, P5CS, PDF1.2, AtNCED, P-protein, b-glucosidase, and SOS1 were constitutively expressed in salt cress at high levels even in the absence of stress (Taji et al., 2004). In our research, the similar “stress preparedness” was found, such as proline biosynthesis key enzyme encoding genes P5CS (Thhalv10016322m, Thhalv10010150m), ABA biosynthesis key enzyme encoding gene NCED3 (Thhalv10020337m), glycine decarboxylase P-protein encoding genes (Thhalv10024257m, Thhalv10001891m), a plasma membrane Na+/H+ antiporter SOS1 (Thhalv10003547m), a vacuolar Na+/H+ antiporter NHX1 (Thhalv10003949m), a controlled lateral root formation TCTP1 (Thhalv10021661m), aquaporin PIP1A (Thhalv10001573m), and PIP2A (Thhalv10010598m), all possessing constitutively higher expression under normal growth conditions without salt stress (Supplementary Table S14). Anyway, the significantly differentially expressed genes affected by salinity were enriched in the pathways of lignin biosynthesis, autophagy, peroxisome, and sugar metabolism, indicating the related metabolism processes could play critical roles in response of Eutrema to salt stress (Figure 9).

FIGURE 9. Proposed model for the mechanism of Eutrema responding to salt stress. AP2/ERF, APETALA 2/ethylene-responsive element binding factor; MYB, v-myb avian myeloblastosis viral oncogene homolog; WRKY, WRKY transcription factors; NAC, NAM, ATAF and CUC family; bZIP, basic leucine zipper; and bHLH, basic helix-loop-helix. ATG, autophagy-related protein; VAC, vacuolar membrane protein; SOD, superoxidase dismutase; CAT, catalase; MPV17, Mpv17 protein; ACOX, acyl-coA oxidase; ACAA, acetyl-CoA acyltransferase; HACL/HPCL, 2-hydroxyacyl-CoA lyase; PEX, peroxin; PAL, phenylalanine ammonia-lyase; C4H, cinnamic acid 4-hydroxylase; 4CL, 4-coumaric acid: CoA ligase; CCR, cinnamoyl CoA reductase; CAD, cinnamyl alcohol dehydrogenase; POD/POX, peroxidase; C3′H, p-coumaroyl shikimate 3′-hydroxylase; COMT, caffeate 3-O-methyltransferase; CCoAOMT, caffeoyl-CoA O-methyltransferase; TPS, trehalose-6-phosphate synthase; TPP, trehalose-6-phosphate phosphatase; IRX, 1,4-beta-D-xylan synthase; XYL4, xylan 1,4-beta-xylosidase; lacZ, beta-galactosidase; AKR1B, aldehyde reductase; GLA, alpha-galactosidase; RFS, raffinose synthase; glgA, glycogen synthase; glgC, glucose-1-phosphate adenylyltransferase; LEA, Late embryogenesis abundant; Dehydrin, dehydrin protein.
Effect of Salt Shock on Genes Associated With Photosynthesis and Ribosome
Photosynthesis is the primary processes affected by water or salt stress (Chaves et al., 2009); thus, considerable attention has been previously paid to the effects of environmental stress on these photosystems (Allakhverdiev and Murata, 2008). The efficiency of photosynthesis is closely related to the activities of photosystem II (PSII) and photosystem I (PSI), converting light energy to chemical energy via electron transport (Nishiyama et al., 2005). PSII and, sometimes, PSI is particularly sensitive to environmental stress (Allakhverdiev and Murata, 2008); thus, the effects of salt are critical in salt-sensitive species, whereas salt-tolerant species can protect the formation of photosynthetic assemblies by increasing the expression of particular genes (Yang et al., 2020). Analyzing Eutrema transcriptome data revealed that a total of 29 DEGs in leaves are enriched in the photosynthesis pathway (ko00195). The proteins encoded by these DEGs are mainly involved in photosystem I, photosystem II, and photosynthetic electron transport (PET). Genes involved in photosystem II in leaves including PsbO (2), PsbP (6), PsbQ (4), PsbW (1), Psb27 (2), and Psb28 (1) were all downregulated 0.33–0.62 times, and the expression of PsaE (Thhalv10026332m), PsaH (Thhalv10011814m), PsaK (Thhalv10009090m), and PsaN (Thhalv10005005m) in photosystem I was declined 0.5–0.57 times in leaves (Figure 10A, Supplementary Table S15A). There were smaller changes in gene expression related to photosynthesis in the leaves, whereas no significant difference in the genes related to photosynthesis in roots of the salt treatment group compared with the control (Supplementary Table S15A); thus, it is suggested that the salt stress of 300 mM NaCl for 24 h could be a milder stress for the halophytic Eutrema. Additionally, we found that the expression of genes related to photosynthesis was obviously lower in roots than in leaves (Supplementary Table S15A), which is in accordance with the conclusion that photosynthesis usually takes place only in the aboveground tissues of the plants.
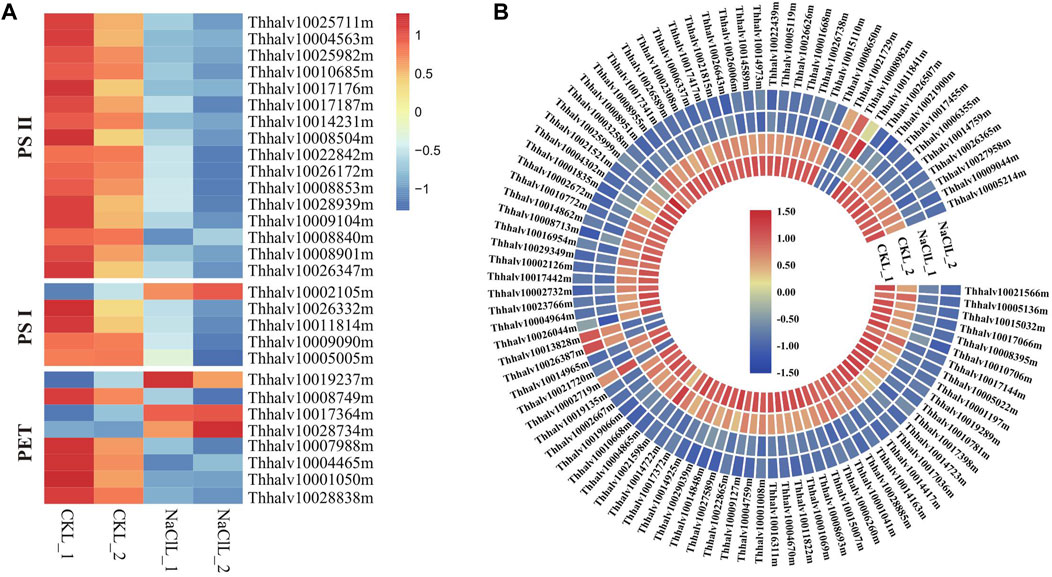
FIGURE 10. DEGs enriched in pathways of photosynthesis and ribosome in leaves. (A) Heatmap analysis of DEGs enriched in the photosynthesis pathway. PET indicates the photosynthetic electron transport. The transcript levels calculated as RPKM are shown in the color legend. (B) Heatmap analysis of DEGs enriched in the ribosome pathway. The transcript levels calculated as RPKM are shown as in the color legend.
Ribosomal proteins are essential for proper growth and development of any organism (Mukhopadhyay et al., 2011). As a general trend, salt stresses lead to the downregulation of ribosomal protein–encoding genes, which was consistent with our analysis in leaves of Eutrema. Here, 97 differentially expressed genes were significantly enriched in the ribosome pathway (ko03010), of which the expression of 90 DEGs such as EsL10e (Thhalv10025999m and Thhalv10003258m), EsL15e (Thhalv10027381m), EsL24e (Thhalv10017341m), and EsL30 (Thhalv10026738m) was downregulated upon salt stress (Figure 10B, Supplementary Table S15B), indicating that the imposed influence of salt stress on genes associated with the ribosome protein. Overall, although Eutrema is a halophyte possessing a higher salt tolerance, salt stress still imposed some effects on photosynthesis and ribosome.
Conclusion
In summary, salt shock led to a large number of significantly differentially expressed genes enriched in autophagy (Vac8, Atg8, and Atg4), peroxisome (PEX7, CAT, and SOD2), lignin biosynthesis (CCoAOMT, C4H, CCR, CAD, POD, and C3′H), and sugar metabolism (SS, TPS, TPP, and RFS) pathways, and these DEGs were mainly involved in the scavenging of ROS and oxidized protein, as well as the biosynthesis of lignin and soluble sugar, indicating that avoiding oxidative damage and osmotic adjustment are the key mechanisms for Eutrema in response to salt stress. This study helps improve our understanding about salt cress responding to salt shock and its mechanism of salt tolerance. Therefore, this research lays an important foundation to provide the excellent gene resource for genetic breeding to boost the salt tolerance of crops.
Data Availability Statement
The datasets presented in this study can be found in https://www.ncbi.nlm.nih.gov/bioproject/, and the accession number of the NaCl treatment and control groups were PRJNA737318 738 (SRR14804235‐SRR14804238) and PRJNA438390 (SRX3793601–SRX3793604), respectively.
Author Contributions
QZ and XW conceived and designed the experiments. QZ wrote the manuscript with contributions from CL, YQ, CZ, and XW. CL and YQ performed the experiments and data analysis. All authors have read and approved the final manuscript.
Funding
This work was supported by the Key Technology Research and Development Program of Shandong (2019GSF107089), Taishan Scholar Project of Shandong Province (ts20190964), and the National Major Science and Technology Project of China (2018ZX08009-10B-004).
Conflict of Interest
The authors declare that the research was conducted in the absence of any commercial or financial relationships that could be construed as a potential conflict of interest.
Publisher’s Note
All claims expressed in this article are solely those of the authors and do not necessarily represent those of their affiliated organizations, or those of the publisher, the editors, and the reviewers. Any product that may be evaluated in this article, or claim that may be made by its manufacturer, is not guaranteed or endorsed by the publisher.
Supplementary Material
The Supplementary Material for this article can be found online at: https://www.frontiersin.org/articles/10.3389/fgene.2021.770742/full#supplementary-material
References
Ali, M. A., Azeem, F., Nawaz, M. A., Acet, T., Abbas, A., Imran, Q. M., et al. (2018). Transcription Factors WRKY11 and WRKY17 Are Involved in Abiotic Stress Responses in Arabidopsis. J. Plant Physiol. 226, 12–21. doi:10.1016/j.jplph.2018.04.007
Allakhverdiev, S. I., and Murata, N. (2008). Salt Stress Inhibits Photosystems II and I in Cyanobacteria. Photosynth Res. 98 (1), 529–539. doi:10.1007/s11120-008-9334-x
Amtmann, A. (2009). Learning from Evolution: Thellungiella Generates New Knowledge on Essential and Critical Components of Abiotic Stress Tolerance in Plants. Mol. Plant. 2 (1), 3–12. doi:10.1093/mp/ssn094
Apel, K., and Hirt, H. (2004). Reactive Oxygen Species: Metabolism, Oxidative Stress, and Signal Transduction. Annu. Rev. Plant Biol. 55, 373–399. doi:10.1146/annurev.arplant.55.031903.141701
Arai, Y., Hayashi, M., and Nishimura, M. (2008). Proteomic Identification and Characterization of a Novel Peroxisomal Adenine Nucleotide Transporter Supplying ATP for Fatty Acid β-Oxidation in Soybean and Arabidopsis. Plant Cell 20 (12), 3227–3240. doi:10.1105/tpc.108.062877
Asada, K. (2006). Production and Scavenging of Reactive Oxygen Species in Chloroplasts and Their Functions. Plant Physiol. 141 (2), 391–396. doi:10.1104/pp.106.082040
Baillo, E. H., Kimotho, R. N., Zhang, Z., and Xu, P. (2019). Transcription Factors Associated with Abiotic and Biotic Stress Tolerance and Their Potential for Crops Improvement. Genes 10 (10), 771. doi:10.3390/genes10100771
Boerjan, W., Ralph, J., and Baucher, M. (2003). Lignin Biosynthesis. Annu. Rev. Plant Biol. 54 (1), 519–546. doi:10.1146/annurev.arplant.54.031902.134938
Bressan, R., Bohnert, H., and Zhu, J.-K. (2009). Abiotic Stress Tolerance: from Gene Discovery in Model Organisms to Crop Improvement. Mol. Plant. 2 (1), 1–2. doi:10.1093/mp/ssn097
Chaves, M. M., Flexas, J., and Pinheiro, C. (2009). Photosynthesis under Drought and Salt Stress: Regulation Mechanisms from Whole Plant to Cell. Ann. Bot. 103 (4), 551–560. doi:10.1093/aob/mcn125
Chen, C., Chen, H., Zhang, Y., Thomas, H. R., Frank, M. H., He, Y., et al. (2020). TBtools: an Integrative Toolkit Developed for Interactive Analyses of Big Biological Data. Mol. Plant. 13 (8), 1194–1202. doi:10.1016/j.molp.2020.06.009
Chezem, W. R., Memon, A., Li, F.-S., Weng, J.-K., and Clay, N. K. (2017). SG2-type R2R3-MYB Transcription Factor MYB15 Controls Defense-Induced Lignification and Basal Immunity in Arabidopsis. Plant Cell 29 (8), 1907–1926. doi:10.1105/tpc.16.00954
Chun, H. J., Baek, D., Cho, H. M., Lee, S. H., Jin, B. J., Yun, D.-J., et al. (2019). Lignin Biosynthesis Genes Play Critical Roles in the Adaptation of Arabidopsis Plants to High-Salt Stress. Plant Signaling Behav. 14 (8), 1625697. doi:10.1080/15592324.2019.1625697
Close, T. J. (1996). Dehydrins: Emergence of a Biochemical Role of a Family of Plant Dehydration Proteins. Physiol. Plant. 97 (4), 795–803. doi:10.1111/j.1399-3054.1996.tb00546.x
Conesa, A., Götz, S., García-Gómez, J. M., Terol, J., Talón, M., and Robles, M. (2005). Blast2GO: a Universal Tool for Annotation, Visualization and Analysis in Functional Genomics Research. Bioinformatics 21 (18), 3674–3676. doi:10.1093/bioinformatics/bti610
Ding, Z. J., Yan, J. Y., Li, C. X., Li, G. X., Wu, Y. R., and Zheng, S. J. (2015). Transcription Factor WRKY46 Modulates the Development of Arabidopsis Lateral Roots in Osmotic/salt Stress Conditions via Regulation of ABA Signaling and Auxin Homeostasis. Plant J. 84 (1), 56–69. doi:10.1111/tpj.12958
Dong, N. Q., and Lin, H. X. (2021). Contribution of Phenylpropanoid Metabolism to Plant Development and Plant-Environment Interactions. J. Integr. Plant Biol. 63 (1), 180–209. doi:10.1111/jipb.13054
ElSayed, A. I., Rafudeen, M. S., and Golldack, D. (2014). Physiological Aspects of Raffinose Family Oligosaccharides in Plants: protection against Abiotic Stress. Plant Biol. J. 16 (1), 1–8. doi:10.1111/plb.12053
Foulon, V., Antonenkov, V. D., Croes, K., Waelkens, E., Mannaerts, G. P., Van Veldhoven, P. P., et al. (1999). Purification, Molecular Cloning, and Expression of 2-Hydroxyphytanoyl-CoA Lyase, a Peroxisomal Thiamine Pyrophosphate-dependent Enzyme that Catalyzes the Carbon-Carbon Bond Cleavage during Alpha -oxidation of 3-Methyl-Branched Fatty Acids. Proc. Natl. Acad. Sci. 96 (18), 10039–10044. doi:10.1073/pnas.96.18.10039
Garg, A. K., Kim, J.-K., Owens, T. G., Ranwala, A. P., Choi, Y. D., Kochian, L. V., et al. (2002). Trehalose Accumulation in rice Plants Confers High Tolerance Levels to Different Abiotic Stresses. Proc. Natl. Acad. Sci. 99 (25), 15898–15903. doi:10.1073/pnas.252637799
Golldack, D., Li, C., Mohan, H., and Probst, N. (2014). Tolerance to Drought and Salt Stress in Plants: Unraveling the Signaling Networks. Front. Plant Sci. 5, 151. doi:10.3389/fpls.2014.00151
Gong, Q., Li, P., Ma, S., Indu Rupassara, S., and Bohnert, H. J. (2005). Salinity Stress Adaptation Competence in the Extremophile Thellungiella Halophila in Comparison with its Relative Arabidopsis thaliana. Plant J. 44 (5), 826–839. doi:10.1111/j.1365-313x.2005.02587.x
Goyal, K., Walton, L. J., and Tunnacliffe, A. (2005). LEA Proteins Prevent Protein Aggregation Due to Water Stress. Biochem. J. 388 (1), 151–157. doi:10.1042/bj20041931
Gupta, B., and Huang, B. (2014). Mechanism of Salinity Tolerance in Plants: Physiological, Biochemical, and Molecular Characterization. Int. J. Genomics 2014, 1–18. doi:10.1155/2014/701596
Hollenstein, D. M., Gómez-Sánchez, R., Ciftci, A., Kriegenburg, F., Mari, M., Torggler, R., et al. (2019). Vac8 Spatially Confines Autophagosome Formation at the Vacuole. J. Cel Sci. 132 (22). doi:10.1242/jcs.235002
Hou, Q., and Bartels, D. (2015). Comparative Study of the Aldehyde Dehydrogenase (ALDH) Gene Superfamily in the Glycophyte Arabidopsis thaliana and Eutrema Halophytes. Ann. Bot. 115 (3), 465–479. doi:10.1093/aob/mcu152
Hu, P., Zhang, K., and Yang, C. (2019). BpNAC012 Positively Regulates Abiotic Stress Responses and Secondary wall Biosynthesis. Plant Physiol. 179 (2), 700–717. doi:10.1104/pp.18.01167
Hundertmark, M., and Hincha, D. K. (2008). LEA (Late Embryogenesis Abundant) Proteins and Their Encoding Genes in Arabidopsis thaliana. BMC genomics 9 (1), 118–122. doi:10.1186/1471-2164-9-118
Ichimura, Y., Kirisako, T., Takao, T., Satomi, Y., Shimonishi, Y., Ishihara, N., et al. (2000). A Ubiquitin-like System Mediates Protein Lipidation. Nature 408 (6811), 488–492. doi:10.1038/35044114
Inan, G., Zhang, Q., Li, P., Wang, Z., Cao, Z., Zhang, H., et al. (2004). Salt Cress. A Halophyte and Cryophyte Arabidopsis Relative Model System and its Applicability to Molecular Genetic Analyses of Growth and Development of Extremophiles. Plant Physiol. 135 (3), 1718–1737. doi:10.1104/pp.104.041723
Jin, J., Tian, F., Yang, D. C., Meng, Y. Q., Kong, L., Luo, J., et al. (2017). PlantTFDB 4.0: toward a central Hub for Transcription Factors and Regulatory Interactions in Plants. Nucleic Acids Res. 45 (45), D1040–D1045. doi:10.1093/nar/gkw982
Kanehisa, M., and Goto, S. (2000). KEGG: Kyoto Encyclopedia of Genes and Genomes. Nucleic Acids Res. 28 (1), 27–30. doi:10.1093/nar/28.1.27
Keskin, B. C., Yuksel, B., Memon, A. R., and Topal-Sarıkaya, A. (2010). Abscisic Acid Regulated Gene Expression in Bread Wheat (Triticum aestivum L.). Aust. J. Crop Sci. 4 (8), 617. doi:10.1007/s12230-010-9149-0
Kiełbowicz-Matuk, A. (2012). Involvement of Plant C(2)H(2)-type Zinc finger Transcription Factors in Stress Responses. Plant Sci. 185-186, 78–85. doi:10.1016/j.plantsci.2011.11.015
Krasensky, J., and Jonak, C. (2012). Drought, Salt, and Temperature Stress-Induced Metabolic Rearrangements and Regulatory Networks. J. Exp. Bot. 63 (4), 1593–1608. doi:10.1093/jxb/err460
Krishnaswamy, S., Verma, S., Rahman, M. H., and Kav, N. N. (2011). Functional Characterization of Four APETALA2-Family Genes (RAP2.6, RAP2.6L, DREB19 and DREB26) in Arabidopsis. Plant Mol. Biol. 75 (1), 107–127. doi:10.1007/s11103-010-9711-7
Lee, Y. P., Giorgi, F. M., Lohse, M., Kvederaviciute, K., Klages, S., Usadel, B., et al. (2013). Transcriptome Sequencing and Microarray Design for Functional Genomics in the Extremophile Arabidopsis Relative Thellungiella Salsuginea (Eutrema Salsugineum). BMC genomics 14, 793. doi:10.1186/1471-2164-14-793
Li, P., Mane, S. P., Sioson, A. A., Robinet, C. V., Heath, L. S., Bohnert, H. J., et al. (2006). Effects of Chronic Ozone Exposure on Gene Expression in Arabidopsis thaliana Ecotypes and in Thellungiella Halophila. Plant Cel Environ. 29 (5), 854–868. doi:10.1111/j.1365-3040.2005.01465.x
Li, R., Yu, C., Li, Y., Lam, T.-W., Yiu, S.-M., Kristiansen, K., et al. (2009). SOAP2: an Improved Ultrafast Tool for Short Read Alignment. Bioinformatics 25 (15), 1966–1967. doi:10.1093/bioinformatics/btp336
Liang, Y., Xiong, Z., Zheng, J., Xu, D., Zhu, Z., Xiang, J., et al. (2016). Genome-wide Identification, Structural Analysis and New Insights into Late Embryogenesis Abundant (LEA) Gene Family Formation Pattern in Brassica Napus. Sci. Rep. 6, 24265. doi:10.1038/srep24265
Liu, Y., Sun, J., and Wu, Y. (2016). Arabidopsis ATAF1 Enhances the Tolerance to Salt Stress and ABA in Transgenic rice. J. Plant Res. 129 (5), 955–962. doi:10.1007/s10265-016-0833-0
Livak, K. J., and Schmittgen, T. D. (2001). Analysis of Relative Gene Expression Data Using Real-Time Quantitative PCR and the 2−ΔΔCT Method. Methods 25 (4), 402–408. doi:10.1006/meth.2001.1262
M'rah, S., Ouerghi, Z., Eymery, F., Rey, P., Hajji, M., Grignon, C., et al. (2007). Efficiency of Biochemical protection against Toxic Effects of Accumulated Salt Differentiates Thellungiella Halophila from Arabidopsis thaliana. J. Plant Physiol. 164 (4), 375–384. doi:10.1016/j.jplph.2006.07.013
Martin, M. (2011). Cutadapt Removes Adapter Sequences from High-Throughput Sequencing Reads. EMBnet j. 17 (1), 10–12. doi:10.14806/ej.17.1.200
Min, X., Lin, X., Ndayambaza, B., Wang, Y., and Liu, W. (2020). Coordinated Mechanisms of Leaves and Roots in Response to Drought Stress Underlying Full-Length Transcriptome Profiling in Vicia Sativa L. BMC Plant Biol. 20, 165. doi:10.1186/s12870-020-02358-8
Mukhopadhyay, P., Reddy, M. K., Singla-Pareek, S. L., and Sopory, S. K. (2011). Transcriptional Downregulation of rice rpL32 Gene under Abiotic Stress Is Associated with Removal of Transcription Factors within the Promoter Region. PLoS One 6 (11), e28058. doi:10.1371/journal.pone.0028058
Nakashima, K., Shinwari, Z. K., Sakuma, Y., Seki, M., Miura, S., Shinozaki, K., et al. (2000). Organization and Expression of Two Arabidopsis DREB2 Genes Encoding DRE-Binding Proteins Involved in Dehydration-And High-Salinity-Responsive Gene Expression. Plant Mol. Biol. 42 (4), 657–665. doi:10.1023/a:1006321900483
Neves, G. Y. S., Marchiosi, R., Ferrarese, M. L. L., Siqueira-Soares, R. C., and Ferrarese-Filho, O. (2010). Root Growth Inhibition and Lignification Induced by Salt Stress in Soybean. J. Agron. Crop Sci. 196 (6), 467–473. doi:10.1111/j.1439-037x.2010.00432.x
Nishiyama, Y., Allakhverdiev, S. I., and Murata, N. (2005). Inhibition of the Repair of Photosystem II by Oxidative Stress in Cyanobacteria. Photosynth Res. 84 (1), 1–7. doi:10.1007/s11120-004-6434-0
Ortiz-Espín, A., Iglesias-Fernández, R., Calderón, A., Carbonero, P., Sevilla, F., and Jiménez, A. (2017). Mitochondrial AtTrxo1 Is Transcriptionally Regulated by AtbZIP9 and AtAZF2 and Affects Seed Germination under saline Conditions. J. Exp. Bot. 68 (5), 1025–1038. doi:10.1093/jxb/erx012
Pérez-Rodríguez, P., Riaño-Pachón, D. M., Corrêa, L. G. G., Rensing, S. A., Kersten, B., and Mueller-Roeber, B. (2010). PlnTFDB: Updated Content and New Features of the Plant Transcription Factor Database. Nucleic Acids Res. 38 (Suppl. l_1), D822–D827. doi:10.1093/nar/gkp805
Pilarska, M., Wiciarz, M., Jajić, I., Kozieradzka-Kiszkurno, M., Dobrev, P., Vanková, R., et al. (2016). A Different Pattern of Production and Scavenging of Reactive Oxygen Species in Halophytic Eutrema Salsugineum (Thellungiella Salsuginea) Plants in Comparison to Arabidopsis thaliana and its Relation to Salt Stress Signaling. Front. Plant Sci. 7, 1179. doi:10.3389/fpls.2016.01179
Ruan, Y.-L. (2014). Sucrose Metabolism: Gateway to Diverse Carbon Use and Sugar Signaling. Annu. Rev. Plant Biol. 65, 33–67. doi:10.1146/annurev-arplant-050213-040251
Saito, K., Yonekura-Sakakibara, K., Nakabayashi, R., Higashi, Y., Yamazaki, M., Tohge, T., et al. (2013). The Flavonoid Biosynthetic Pathway in Arabidopsis: Structural and Genetic Diversity. Plant Physiol. Biochem. 72, 21–34. doi:10.1016/j.plaphy.2013.02.001
Scharf, K.-D., Berberich, T., Ebersberger, I., and Nover, L. (2012). The Plant Heat Stress Transcription Factor (Hsf) Family: Structure, Function and Evolution. Biochim. Biophys. Acta (Bba) - Gene Regul. Mech. 1819 (2), 104–119. doi:10.1016/j.bbagrm.2011.10.002
Schurch, N. J., Schofield, P., Gierliński, M., Cole, C., Sherstnev, A., Singh, V., et al. (2016). How many Biological Replicates Are Needed in an RNA-Seq experiment and Which Differential Expression Tool Should You Use. RNA 22 (6), 839–851. doi:10.1261/rna.053959.115
Shimizu, T., Kanamori, Y., Furuki, T., Kikawada, T., Okuda, T., Takahashi, T., et al. (2010). Desiccation-induced Structuralization and Glass Formation of Group 3 Late Embryogenesis Abundant Protein Model Peptides. Biochemistry 49 (6), 1093–1104. doi:10.1021/bi901745f
Sun, X., Li, Y., Cai, H., Bai, X., Ji, W., Ding, X., et al. (2012). The Arabidopsis AtbZIP1 Transcription Factor Is a Positive Regulator of Plant Tolerance to Salt, Osmotic and Drought Stresses. J. Plant Res. 125 (3), 429–438. doi:10.1007/s10265-011-0448-4
Taji, T., Seki, M., Satou, M., Sakurai, T., Kobayashi, M., Ishiyama, K., et al. (2004). Comparative Genomics in Salt Tolerance between Arabidopsis and Arabidopsis-Related Halophyte Salt Cress Using Arabidopsis Microarray. Plant Physiol. 135 (3), 1697–1709. doi:10.1104/pp.104.039909
Tarazona, S., Furió-Tarí, P., Turrà, D., Pietro, A. D., Nueda, M. J., Ferrer, A., et al. (2015). Data Quality Aware Analysis of Differential Expression in RNA-Seq with NOISeq R/Bioc Package. Nucleic Acids Res. 43 (21), e140. doi:10.1093/nar/gkv711
Tarazona, S., García, F., Ferrer, A., Dopazo, J., and Conesa, A. (2011). NOIseq: a RNA-Seq Differential Expression Method Robust for Sequencing Depth Biases. Embnet J. 17 (B), 18–19. doi:10.14806/ej.17.B.265
Thalmann, M., and Santelia, D. (2017). Starch as a Determinant of Plant Fitness under Abiotic Stress. New Phytol. 214 (3), 943–951. doi:10.1111/nph.14491
Tunnacliffe, A., and Wise, M. J. (2007). The Continuing Conundrum of the LEA Proteins. Naturwissenschaften 94 (10), 791–812. doi:10.1007/s00114-007-0254-y
Van Breusegem, F., and Dat, J. F. (2006). Reactive Oxygen Species in Plant Cell Death. Plant Physiol. 141 (2), 384–390. doi:10.1104/pp.106.078295
Van den Bosch, H., Schutgens, R. B. H., Wanders, R. J. A., and Tager, J. M. (1992). Biochemistry of Peroxisomes. Annu. Rev. Biochem. 61 (1), 157–197. doi:10.1146/annurev.bi.61.070192.001105
Vanderauwera, S., Vandenbroucke, K., Inzé, A., Van De Cotte, B., Mühlenbock, P., De Rycke, R., et al. (2012). AtWRKY15 Perturbation Abolishes the Mitochondrial Stress Response that Steers Osmotic Stress Tolerance in Arabidopsis. Proc. Natl. Acad. Sci. 109 (49), 20113–20118. doi:10.1073/pnas.1217516109
Veeranagamallaiah, G., Prasanthi, J., Reddy, K. E., Pandurangaiah, M., Babu, O. S., and Sudhakar, C. (2011). Group 1 and 2 LEA Protein Expression Correlates with a Decrease in Water Stress Induced Protein Aggregation in Horsegram during Germination and Seedling Growth. J. Plant Physiol. 168 (7), 671–677. doi:10.1016/j.jplph.2010.09.007
Vera-Estrella, R., Barkla, B. J., García-Ramírez, L., and Pantoja, O. (2005). Salt Stress in Thellungiella Halophila Activates Na+ Transport Mechanisms Required for Salinity Tolerance. Plant Physiol. 139 (3), 1507–1517. doi:10.1104/pp.105.067850
Wanders, R. J. A., Vreken, P., Ferdinandusse, S., Jansen, G. A., Waterham, H. R., Van Roermund, C. W. T., et al. (2001). Peroxisomal Fatty Acid α- and β-oxidation in Humans: Enzymology, Peroxisomal Metabolite Transporters and Peroxisomal Diseases. Biochem. Soc. Trans. 29 (2), 250–267. doi:10.1042/bst0290250
Wang, H., Wang, H., Shao, H., and Tang, X. (2016). Recent Advances in Utilizing Transcription Factors to Improve Plant Abiotic Stress Tolerance by Transgenic Technology. Front. Plant Sci. 7, 67. doi:10.3389/fpls.2016.00067
Wang, J., Zhang, Q., Cui, F., Hou, L., Zhao, S., Xia, H., et al. (2017). Genome-wide Analysis of Gene Expression Provides New Insights into Cold Responses in Thellungiella Salsuginea. Front. Plant Sci. 8, 713. doi:10.3389/fpls.2017.00713
Wang, Y., Ying, Y., Chen, J., and Wang, X. (2004). Transgenic Arabidopsis Overexpressing Mn-SOD Enhanced Salt-Tolerance. Plant Sci. 167 (4), 671–677. doi:10.1016/j.plantsci.2004.03.032
Wi, J., Na, Y., Yang, E., Lee, J.-H., Jeong, W.-J., and Choi, D.-W. (2020). Arabidopsis AtMPV17, a Homolog of Mice MPV17, Enhances Osmotic Stress Tolerance. Physiol. Mol. Biol. Plants 26 (7), 1341–1348. doi:10.1007/s12298-020-00834-x
Wong, C. E., Li, Y., Labbe, A., Guevara, D., Nuin, P., Whitty, B., et al. (2006). Transcriptional Profiling Implicates Novel Interactions between Abiotic Stress and Hormonal Responses in Thellungiella, a Close Relative of Arabidopsis. Plant Physiol. 140 (4), 1437–1450. doi:10.1104/pp.105.070508
Woodward, A. W., and Bartel, B. (2005). TheArabidopsisPeroxisomal Targeting Signal Type 2 Receptor PEX7 Is Necessary for Peroxisome Function and Dependent on PEX5. MBoC 16 (2), 573–583. doi:10.1091/mbc.e04-05-0422
Xie, M., Zhang, J., Tschaplinski, T. J., Tuskan, G. A., Chen, J.-G., and Muchero, W. (2018). Regulation of Lignin Biosynthesis and its Role in Growth-Defense Tradeoffs. Front. Plant Sci. 9, 1427. doi:10.3389/fpls.2018.01427
Xiong, Y., Contento, A. L., and Bassham, D. C. (2007a). Disruption of Autophagy Results in Constitutive Oxidative Stress inArabidopsis. Autophagy 3 (3), 257–258. doi:10.4161/auto.3847
Xiong, Y., Contento, A. L., Nguyen, P. Q., and Bassham, D. C. (2007b). Degradation of Oxidized Proteins by Autophagy during Oxidative Stress in Arabidopsis. Plant Physiol. 143 (1), 291–299. doi:10.1104/pp.106.092106
Xu, D., Duan, X., Wang, B., Hong, B., Ho, T., and Wu, R. (1996). Expression of a Late Embryogenesis Abundant Protein Gene, HVA1, from Barley Confers Tolerance to Water Deficit and Salt Stress in Transgenic rice. Plant Physiol. 110 (1), 249–257. doi:10.1104/pp.110.1.249
Xu, R., Wang, Y., Zheng, H., Lu, W., Wu, C., Huang, J., et al. (2015). Salt-induced Transcription factorMYB74is Regulated by the RNA-Directed DNA Methylation Pathway inArabidopsis. Exbotj 66 (19), 5997–6008. doi:10.1093/jxb/erv312
Yang, Y., Yoo, C. G., Rottmann, W., Winkeler, K. A., Collins, C. M., Gunter, L. E., et al. (2019). PdWND3A, a wood-associated NAC Domain-Containing Protein, Affects Lignin Biosynthesis and Composition in Populus. BMC Plant Biol. 19, 486. doi:10.1186/s12870-019-2111-5
Yang, Z., Li, J.-L., Liu, L.-N., Xie, Q., and Sui, N. (2020). Photosynthetic Regulation under Salt Stress and Salt-Tolerance Mechanism of Sweet Sorghum. Front. Plant Sci. 10, 1722. doi:10.3389/fpls.2019.01722
Ye, J., Fang, L., Zheng, H., Zhang, Y., Chen, J., Zhang, Z., et al. (2006). WEGO: a Web Tool for Plotting GO Annotations. Nucleic Acids Res. 34 (Suppl. l_2), W293–W297. doi:10.1093/nar/gkl031
Zhang, H.-f., Liu, S.-y., Ma, J.-h., Wang, X.-k., Haq, S. u., Meng, Y.-c., et al. (2020a). CaDHN4, a Salt and Cold Stress-Responsive Dehydrin Gene from Pepper Decreases Abscisic Acid Sensitivity in Arabidopsis. Ijms 21 (1), 26. doi:10.3390/ijms21010026
Zhang, Z., Li, W., Gao, X., Xu, M., and Guo, Y. (2020b). DEAR4, a Member of DREB/CBF Family, Positively Regulates Leaf Senescence and Response to Multiple Stressors in Arabidopsis thaliana. Front. Plant Sci. 11, 367. doi:10.3389/fpls.2020.00367
Zhao, C., Zhang, H., Song, C., Zhu, J.-K., and Shabala, S. (2020). Mechanisms of Plant Responses and Adaptation to Soil Salinity. The innovation 1 (1), 100017. doi:10.1016/j.xinn.2020.100017
Zheng, K., Wang, Y., and Wang, S. (2019). The Non-DNA Binding bHLH Transcription Factor Paclobutrazol Resistances Are Involved in the Regulation of ABA and Salt Responses in Arabidopsis. Plant Physiol. Biochem. 139, 239–245. doi:10.1016/j.plaphy.2019.03.026
Zheng, Y., Jiao, C., Sun, H., Rosli, H. G., Pombo, M. A., Zhang, P., et al. (2016). iTAK: a Program for Genome-wide Prediction and Classification of Plant Transcription Factors, Transcriptional Regulators, and Protein Kinases. Mol. Plant 9 (12), 1667–1670. doi:10.1016/j.molp.2016.09.014
Zhou, J., Lee, C., Zhong, R., and Ye, Z.-H. (2009). MYB58 and MYB63 Are Transcriptional Activators of the Lignin Biosynthetic Pathway during Secondary Cell Wall Formation in Arabidopsis. Plant Cell 21 (1), 248–266. doi:10.1105/tpc.108.063321
Keywords: Eutrema salsugineum, RNA-seq, salt shock, autophagy, lignin biosynthesis, peroxisome, sugar metabolism, transcription factor
Citation: Li C, Qi Y, Zhao C, Wang X and Zhang Q (2021) Transcriptome Profiling of the Salt Stress Response in the Leaves and Roots of Halophytic Eutrema salsugineum. Front. Genet. 12:770742. doi: 10.3389/fgene.2021.770742
Received: 04 September 2021; Accepted: 11 October 2021;
Published: 18 November 2021.
Edited by:
Nidhi Rawat, University of Maryland, College Park, United StatesReviewed by:
Cheng Qin, Zunyi Vocational and Technical College, ChinaAli Raza, Fujian Agriculture and Forestry University, China
Copyright © 2021 Li, Qi, Zhao, Wang and Zhang. This is an open-access article distributed under the terms of the Creative Commons Attribution License (CC BY). The use, distribution or reproduction in other forums is permitted, provided the original author(s) and the copyright owner(s) are credited and that the original publication in this journal is cited, in accordance with accepted academic practice. No use, distribution or reproduction is permitted which does not comply with these terms.
*Correspondence: Quan Zhang, emhhbmdxdWFuQHNkbnUuZWR1LmNu
†These authors have contributed equally to this work.