 Xiuqi Chen
 Danhong Wu
- Department of Neurology, Shanghai Fifth People’s Hospital, Fudan University, Shanghai, China
Background: Acute ischemic stroke (AIS) is the second leading cause of death and the third leading cause of disability worldwide. Long noncoding RNAs (lncRNAs) are promising biomarkers for the early diagnosis of AIS and closely participate in the mechanism of stroke onset. However, studies focusing on lncRNAs functioning as microRNA (miRNA) sponges to regulate the mRNA expression are rare and superficial.
Methods: In this study, we systematically analyzed the expression profiles of lncRNA, mRNA (GSE58294), and miRNA (GSE110993) from the GEO database. Gene ontology (GO) analysis was performed to reveal the functions of differentially expressed genes (DEGs), and we used weighted gene co-expression network analysis (WGCNA) to investigate the relationships between clinical features and expression profiles and the co-expression of miRNA and lncRNA. Finally, we constructed a lncRNA–miRNA–mRNA competing endogenous RNA (ceRNA) network with selected DEGs using bioinformatics methods and obtained ROC curves to assess the diagnostic efficacy of differentially expressed lncRNAs (DElncRNAs) and differentially expressed mRNAs (DEmRNAs) in our network. The GSE22255 dataset was used to confirm the diagnostic value of candidate genes.
Results: In total, 199 DElncRNAs, 2068 DEmRNAs, and 96 differentially expressed miRNAs were detected. The GO analysis revealed that DEmRNAs primarily participate in neutrophil activation, neutrophil degranulation, vacuolar transport, and lysosomal transport. WGCNA screened out 16 lncRNAs and 195 mRNAs from DEGs, and only eight DElncRNAs maintained an area under the curve higher than 0.9. By investigating the relationships between lncRNAs and mRNAs, a ceRNA network containing three lncRNAs, three miRNAs, and seven mRNAs was constructed. GSE22255 confirmed that RP1-193H18.2 is more advantageous for diagnosing stroke, whereas no mRNA showed realistic diagnostic efficacy.
Conclusion: The ceRNA network may broaden our understanding of AIS pathology, and the candidate lncRNA from the ceRNA network is assumed to be a promising therapeutic target and diagnostic biomarker for AIS.
Introduction
Stroke is the second leading cause of death and the third leading cause of disability in adults (Campbell and Khatri, 2020). Approximately 80% of all strokes are ischemic (Donnan et al., 2008); thus, rehabilitation after ischemic stroke garners much attention in stroke research. However, safe and successful rehabilitation for stroke is strictly limited by the therapeutic time window (Emberson et al., 2014), which renders early diagnosis extremely critical. At present, the diagnosis of ischemic stroke primarily depends on typical clinical symptoms and auxiliary brain imaging examinations (Campbell and Khatri, 2020). However, clinical manifestations of stroke are often confusing, and brain imaging examinations (such as CT and MRI) are time-consuming and relatively expensive, and their use may be restricted by the condition of the patient. In addition, the mechanisms underlying stroke have not been thoroughly clarified (Campbell and Khatri, 2020). Thus, it is necessary to identify novel potential biomarkers and mechanisms for the early detection of stroke onset.
Long noncoding RNAs (lncRNAs) are defined as transcripts that are longer than 200 nucleotides and are unable to encode proteins (Kopp and Mendell, 2018). They were previously considered as “junk” in the mammal genome but now are found to function as a transcriptional regulator or post-transcriptional regulator: in the former, lncRNA combines with chromosomes and modifies the gene expression (Ulitsky and Bartel, 2013), whereas in the latter, lncRNA can either directly impact the gene expression by regulating the degradation of genes or works as competing endogenous RNA (ceRNA) and sponge-specific miRNAs, thus indirectly regulating the gene expression (Bao et al., 2018; Gong et al., 2020). Recently, aberrant expression of lncRNA has been reported to correlate with the onset, progression, and prognosis of acute ischemic stroke (AIS) (Bai et al., 2014; Feng et al., 2019; Li et al., 2020a; Wang et al., 2020a; Fu et al., 2021); thus they are potential candidates for stroke diagnosis. Meanwhile, the mechanism of stroke involves a series of complicated processes, including energy depletion, ion imbalance, glutamate and free radical release, calcium channel dysfunction, inflammatory changes, and apoptosis (Dirnagl et al., 1999). lncRNAs are reported to be involved in the progression of inflammation (Feng et al., 2019; Zhang and Niu, 2020) and apoptosis (Liu et al., 2016; Chen et al., 2017; Liu et al., 2019; Zhao et al., 2019; Zhong et al., 2020) in stroke onset, indicating that lncRNAs may also be key factors in understanding the mechanism of stroke.
Generally, lncRNA research in neuroscience is still in its preliminary stages, and much has focused on lncRNAs as direct gene expression regulators; only a few have investigated the possibility that lncRNAs act as ceRNAs to indirectly regulate the gene expression, and comprehensive studies that have explored lncRNAs and possible interactive genes in stroke are also scarce. The development of microarray and high-throughput sequencing has helped in gene function interpretation (Gershon, 2002), combined with bioinformatics analysis; our knowledge in the field of lncRNA and stroke will be greatly broadened.
In this study, we constructed a lncRNA–miRNA–mRNA network by collecting differentially expressed genes (DEGs) from the GSE110993 and GSE58294 series, and then, we verified the diagnostic efficacy of this network in the GSE22255 series. We also provide a useful framework for elucidating the molecular mechanisms of ischemic stroke at the biological level.
Materials and Methods
Data Downloading and Data Processing
In this study, we used “stroke” and “Homo sapiens” as mesh terms in the GEO database. Only patients without any clinical treatment were included in this study, and the time from stroke onset to admission was less than 3 h. We found two eligible series, GSE58294 (Stamova et al., 2014) and GSE110993 (Tiedt et al., 2017). The GSE58294 series included 23 stroke patients and 23 matched healthy controls. The matching criteria involved vascular diseases related to risk factors and sex. This transcriptome series was based on the GPL570 [HG-U133_Plus_2] Affymetrix Human Genome U133 Plus 2.0 Array. The GSE110993 series included 29 stroke patients and 20 matched healthy controls, and the matching criteria involved vascular diseases related to risk factors, sex, age, and past medical history. This miRNA high-throughput sequencing series was based on GPL15456 (Illumina HiScanSQ), and all patients were included in this study. In addition, the GSE22255 series was used as a verification series, including 20 stroke patients and 20 healthy controls matched for age and sex. This transcriptome series was based on the GPL570 Affymetrix Human Genome U133 Plus 2.0 Array.
The raw data from GSE58294 were first read and normalized by affy (Gautier et al., 2004) and gcRMA R packages and then visualized by the boxplot and principal component analysis plot. Combat function in the sva R package (Leek et al., 2012) was used to adjust the batch effect in this series. The probe annotation of this series was based on Entrez Gene ID. The lncRNA and mRNA annotation files of GRCh38 (Schneider et al., 2017) were downloaded from Affymetrix using the Rsubread package. In the comment process, only the matched probe remained in the expression profile. If one Entrez Gene ID matched many probes, the average of these values was used. Differential expression analysis of GSE110993 was provided in the GEO datasets.
Differential Expression Analysis
Differentially expressed mRNAs (DEmRNAs) and differentially expressed lncRNAs (DElncRNAs) from GSE58294 were filtered using the limma package (Ritchie et al., 2015). Differentially expressed miRNAs (DEmiRNAs) from GSE110993 were selected using the edgeR (Robinson et al., 2010) package. We defined the predictive threshold set as adj. p value/false discovery rate (FDR) < 0.05 and |log2 (foldchange)|>0.5 (Dalman et al., 2012; Zhang et al., 2016). ggplot2 and pheatmap packages were used to draw the volcanic maps and heat maps, respectively. In addition, the distribution of DEmRNAs and DElncRNAs on the chromosome was visualized using the OmicCircos package in this study.
Construction of a Protein–Protein Interaction (PPI) Network
To further investigate the PPIs, we used the online Search Tool for the Retrieval of Interacting Genes (STRING, version 11.0; https://string-db.org/) database (Szklarczyk et al., 2018) to estimate the interaction between DEmRNAs. Only datasets with a combined score higher than 0.9 were involved in the PPI network, and Cytoscape was used to construct and visualize this PPI network (Shannon et al., 2003). We used cytoHubba (Chin et al., 2014) to identify 10 key genes from the PPI network using the topology MCC approach.
Weighted Gene Co-expression Network Analysis (WGCNA)
Sample clustering was performed to verify the correlation between the expression profiles and clinical features. Vital gene modules were distinguished using the WGCNA R package (Langfelder and Horvath, 2008) after processing the raw data. First, Pearson’s correlation coefficients were computed for filtered genes in a pair-wise approach producing a gene similarity matrix. Thereafter, closely correlated gene modules were recognized by average linkage hierarchical clustering. Network internal connectivity was gauged by calculating the topological overlap, and the latter was realized using the TOM dist function with a signed TOM-Type. Average hierarchical clustering was used to classify the genes based on the topological overlap dissimilarity measure (1-TOM) of their connection strengths. The author used a dynamic tree cut algorithm with a minimum cluster size of 30 and a merging threshold of 0.05 to identify network modules. Genes that were not grouped into specific modules were classified as “colored gray”.
Construction of the ceRNA Network
According to the admitted hypothesis, lncRNA indirectly regulates the mRNA expression by competitively interacting with miRNA (Bao et al., 2018; Gong et al., 2020). In this article, we constructed our ceRNA network as follows (Campbell and Khatri, 2020): predicting possible lncRNAs that interact with miRNA by using prediction modules of DIANA-LncBase Predicted V.2 database (Paraskevopoulou et al., 2016) and forming pairwise relations between lncRNA and miRNA; the interacting score of prediction modules higher than 0.7 considered as eligible (Donnan et al., 2008); miRWalk (Dweep et al., 2011) 3.0, miRDB (Chen and Wang, 2019), and TargetScan (Agarwal et al., 2015) (Version 7.2), were used to predict the interaction between miRNAs and mRNAs, and the interacting score higher than 0.95 was regarded as eligible (Emberson et al., 2014); lncRNAs and mRNAs predicted by previous two steps were matched with DElncRNAs and DEmRNAs, and only overlapped lncRNA–miRNA and mRNA–miRNA relationships were selected (Kopp and Mendell, 2018); arranging these paired matched relationships, the ultimate lncRNA–miRNA–mRNA network was formed and visualized through Cytoscape (Version 3.8.0).
Functional Enrichment Analysis
Gene ontology (GO) functional enrichment analysis was performed by the clusterProfiler R package (Yu et al., 2012) and visualized using the ggplot2 R package to articulate ceRNA network-associated biological processes. The criterion was set as the adj. p value < 0.05.
Diagnostic ROC Curve
To assess the diagnostic efficacy of selected DElncRNAs and DEmRNAs, we used the Proc R package to generate the ROC curve. Next, the area under the curve (Stamova et al., 2014) and 95% confidence interval were calculated to verify the reliability of the diagnostic curve. GSE22255 was used as a validation series in this study.
Results
Differentially Expressed lncRNA, miRNA, and mRNA
A flow chart of this study is shown in Figure 1. In our study, 2068 DEmRNAs and 199 DElncRNAs were identified between stroke patients and healthy controls from GSE58294, including 1564 upregulated and 504 downregulated mRNAs, as well as 104 upregulated and 95 downregulated lncRNAs. We displayed DEmRNAs in the manner of the heatmap in Figure 2A and DElncRNAs in the manner of the volcanic map in Figure 2B. Red denotes that this gene is upregulated in the peripheral blood of stroke patients, whereas blue denotes that this gene is downregulated in the peripheral blood of stroke patients. According to the differentially expressed analysis of GSE110993, 96 DEmiRNAs were detected, and 16 upregulated miRNAs and 80 downregulated miRNAs were included. We exhibited the outcomes in the volcanic map, as shown in Figure 2C. The top 50 most significant DEmRNAs and DElncRNAs are listed in Tables 1, 2, respectively; the top 32 most significant DEmiRNAs are listed in Table 3. We also generated Figure 3 to display the distribution of DEmRNAs and DElncRNAs on the chromosome. It showed that DEmRNAs and DElncRNAs spread to all autosomes and the X chromosome, and none of them were found in the Y chromosome.
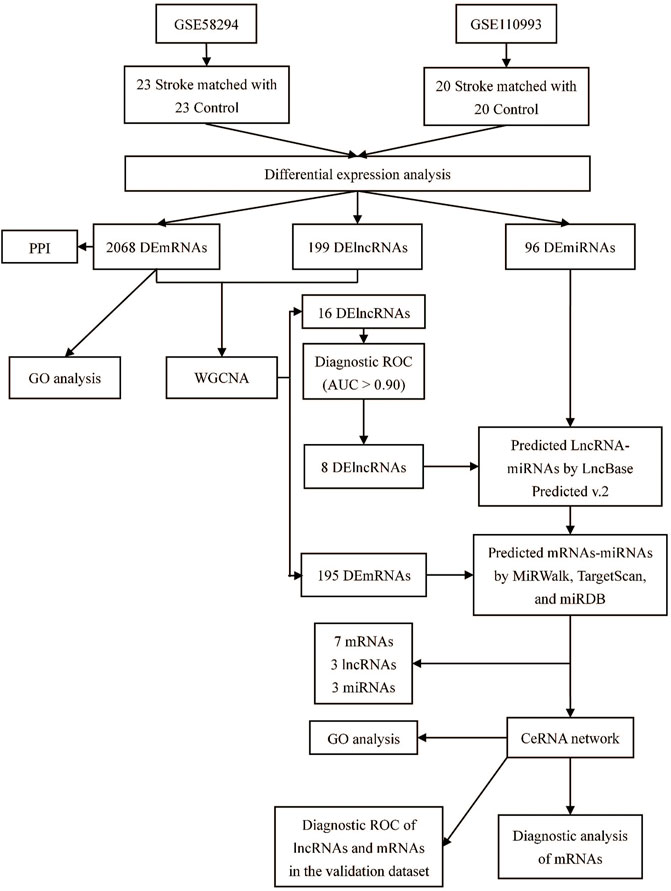
FIGURE 1. Study flow chart.
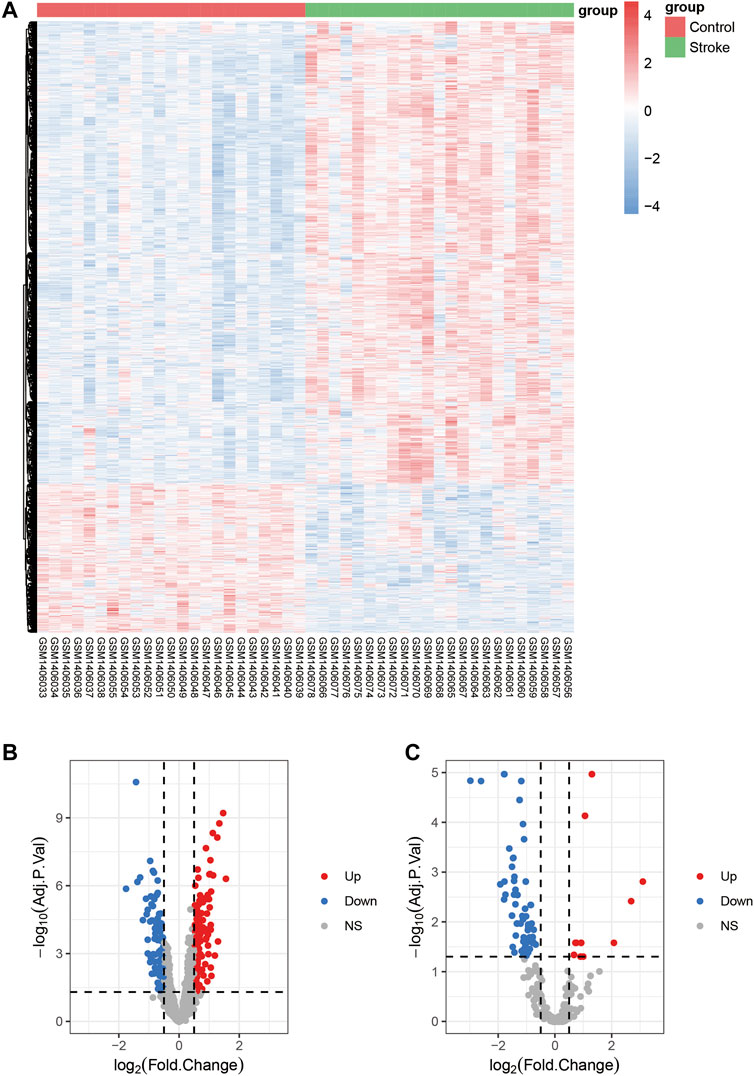
FIGURE 2. Differentially expressed mRNAs, miRNAs, and lncRNAs in stroke. (A): Heatmap shows DEmRNAs from GSE58294. (B): Volcanic map displaying DElncRNAs from GSE58294. (C): Volcanic map exhibiting DEmiRNAs from GSE110993; stroke denotes the group of stroke patients, and control denotes the group with healthy controls; Up; upregulation, down; downregulation, NS; not significant.
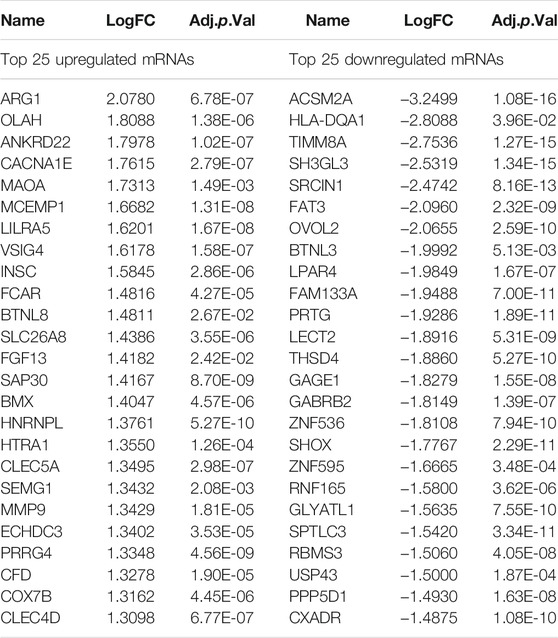
TABLE 1. Top 50 differentially expressed mRNAs in stroke samples: half upregulated and half downregulated.
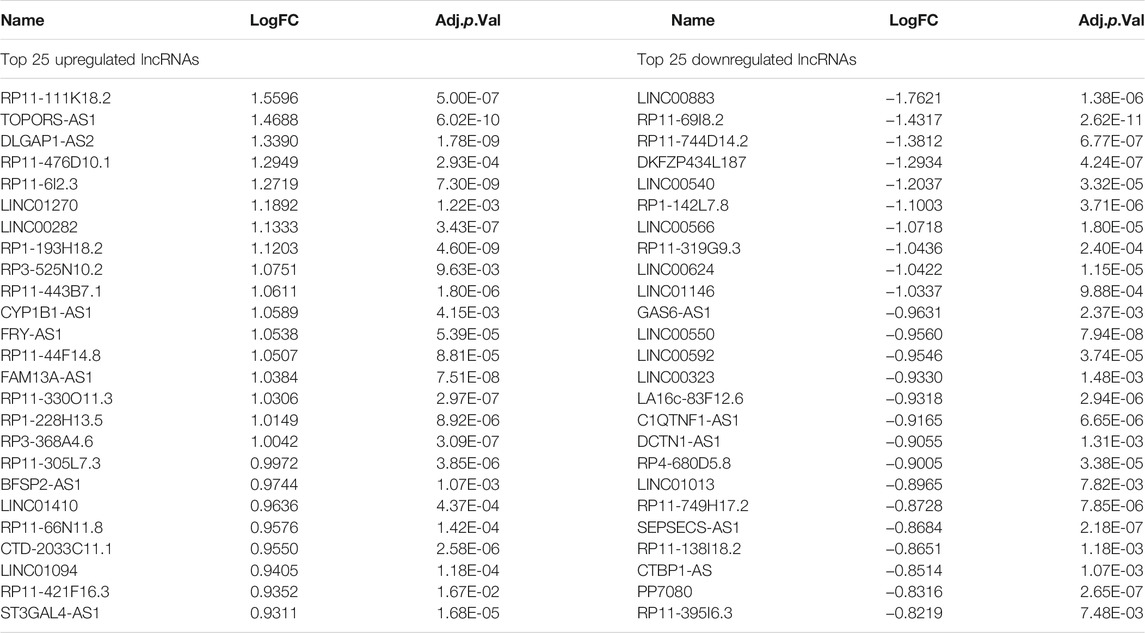
TABLE 2. Top 50 differentially expressed lncRNAs in stroke samples: half upregulated and half downregulated.

TABLE 3. Top 32 differentially expressed miRNAs in stroke samples: half upregulated and half downregulated.
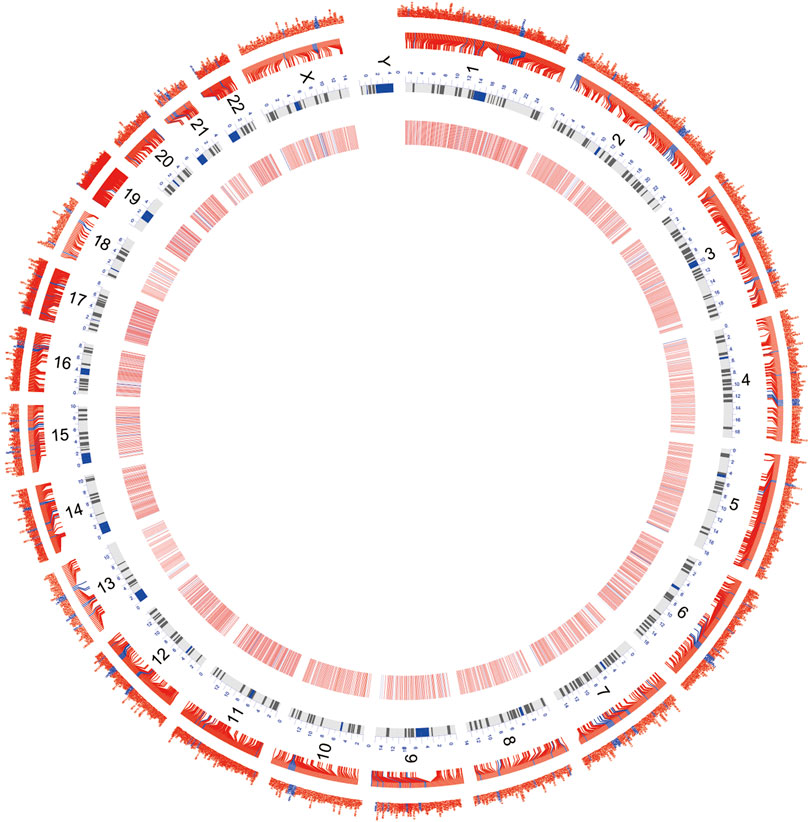
FIGURE 3. Circos map demonstrates the distribution of DEmRNAs and DElncRNAs on the chromosome. Red characters and the transverse line in the outer layer denote DEmRNAs; blue characters and the transverse line in the inner layer denote DElncRNAs; the inner circle comprising red, white, and blue stripes is the heatmap for the differential expression. Red denotes the high expression, and blue denotes the low expression.
PPI Network
The PPI network was constructed using the STRING online database and visualized by Cytoscape to detect potential interactions among DEmRNAs. This network included 853 nodes and 4243 pairs of interactive relationships (Figure 4A), and ten hub genes were selected according to the MCC function of topological analysis: KLHL13, RNF7, KBTBD7, KLHL9, WSB1, HECW2, ATG7, RBX1, FBXO30, and UBE2S (Figure 4B).
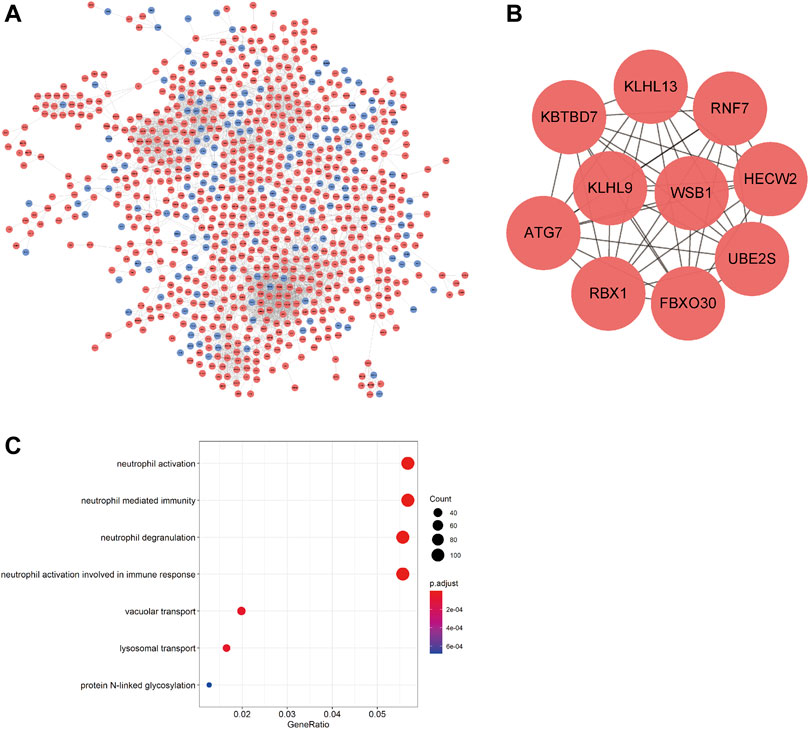
FIGURE 4. PPI network of DEmRNAs and GO analysis. (A) PPI network; blue denotes downregulated genes; red denotes upregulated genes. (B) 10 hub genes. (C) GO functional enrichment analysis of DEmRNAs.
GO Analysis
GO analysis was performed to investigate the functions of the DEmRNAs; the outcomes of GO functional enrichment analysis are displayed in Figure 4C. There were 46 terms significantly enriched in this article (Table 4). The biological process (BP) outcomes revealed that the top 10 processes that DEmRNAs were most enriched in neutrophil activation, neutrophil degranulation, neutrophil-mediated immunity, and neutrophil activation involved in immune response, lysosomal transport, vacuolar transport, protein N-linked glycosylation, response to antineoplastic agent, glycoprotein biosynthetic process, and vesicle organization, and the cellular component (Robinson et al., 2010) outcomes demonstrated that the top 10 DEmRNAs mostly related terms were specific granules, tertiary granules, specific granule lumens, secretory granule membranes, vacuolar membranes, ficolin-1-rich granules, lysosomal membranes, lytic vacuole membranes, specific granule membranes, and endosome membranes. No molecular function (MF) terms were identified.
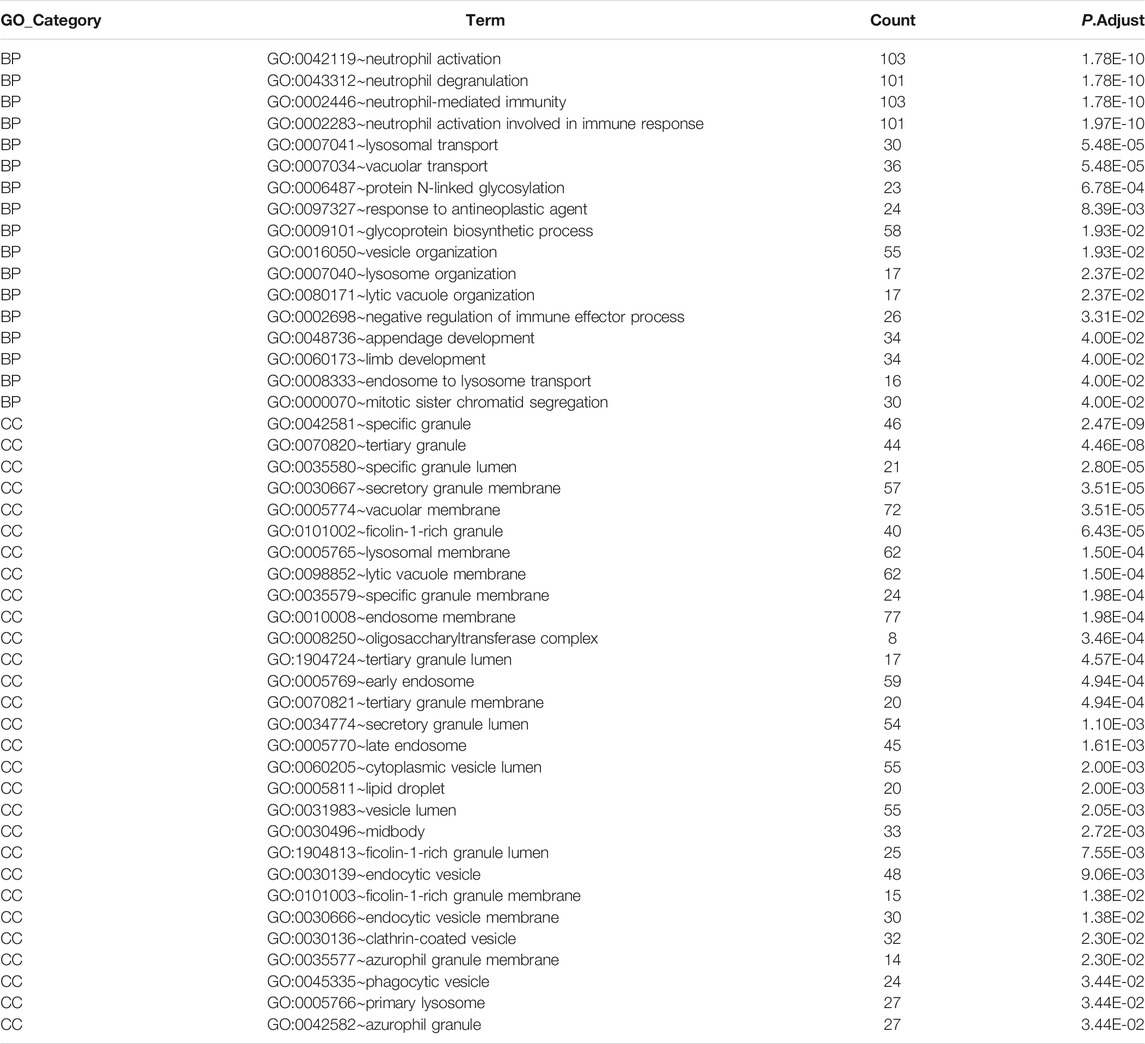
TABLE 4. GO enrichment analysis of all differentially expressed mRNAs.
Analysis of lncRNA and mRNA Co-expression
To investigate the DElncRNAs and DEmRNAs related to biological processes, the regulation patterns of lncRNAs and mRNAs should be clearly defined. Based on the hypothesis that lncRNAs competitively combine miRNAs, a positive correlation between lncRNAs and mRNAs should be selected. We performed a co-expression analysis of lncRNA and mRNA from GSE58794 using the WGCNA R package (Figure 5). Figure 5A reveals that no outliers were detected in sample clustering; thus, there was no need to eliminate samples in subsequent WGCNA. Fifteen were chosen as the cut-off for the soft threshold. Clustering analysis on the similarity of mRNA and lncRNA expression profiles was performed, and modules were combined if the differences between them were less than 5% (Figure 5C). Eventually, we selected the blue modules that are most closely related to stroke (R = 0.89, p < 0.0001) based on the correlation coefficient between modules and clinical traits, and this is displayed in Figure 6A. After selecting the modules, we constructed a co-expression network. A weighted score higher than 0.02 was considered as the threshold, and lncRNA and mRNA should have similar expression tendencies as well. In Figure 6B, our network summarizes 7092 pairs of interactive relationships, and more detailed information is available in Supplementary Table S1. A total of 211 genes, including 16 lncRNAs and 195 mRNAs, were incorporated into this module. There were 10 upregulated and six downregulated lncRNAs, whereas among 195 mRNAs, 145 were upregulated and the rest were downregulated.
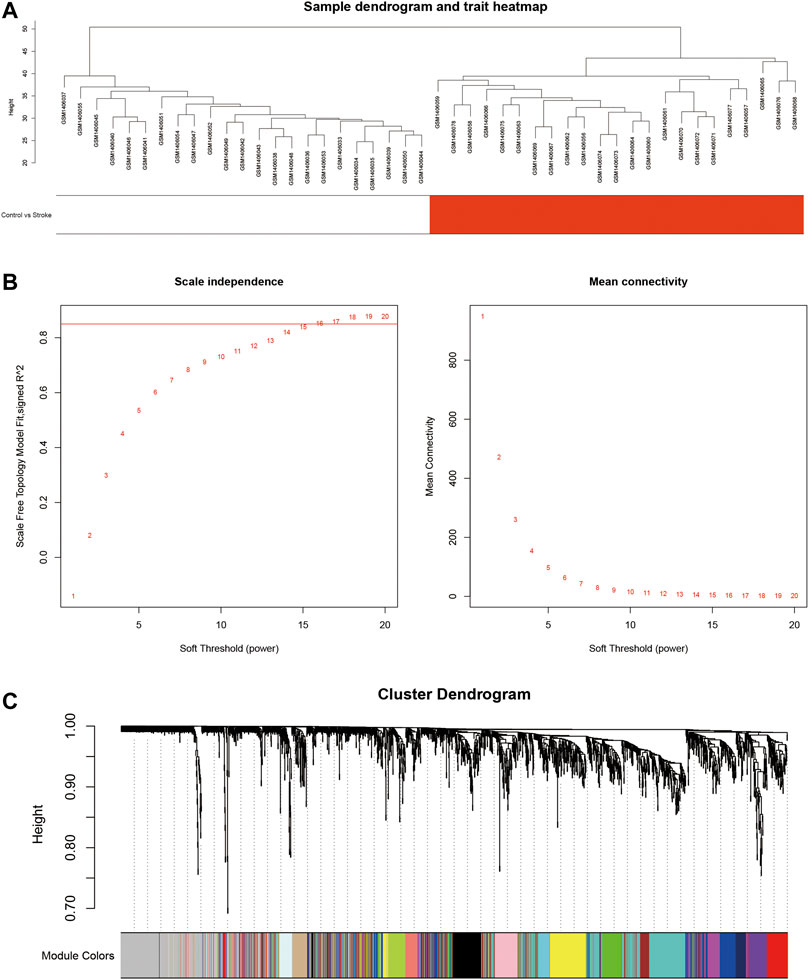
FIGURE 5. Constructing the lncRNA and mRNA co-expression module using WGCNA. (A): Clustering analysis of 40 samples from GSE58794 based on the expression profiles of lncRNAs and mRNAs. White denotes the healthy control group, and red denotes the stroke group. (B): Network topological analysis targeting multiple soft thresholds. The soft threshold was set at 15. The red straight line denotes the boundary of the similarity as 0.85. (C): Clustering dendrogram of mRNAs and lncRNAs.
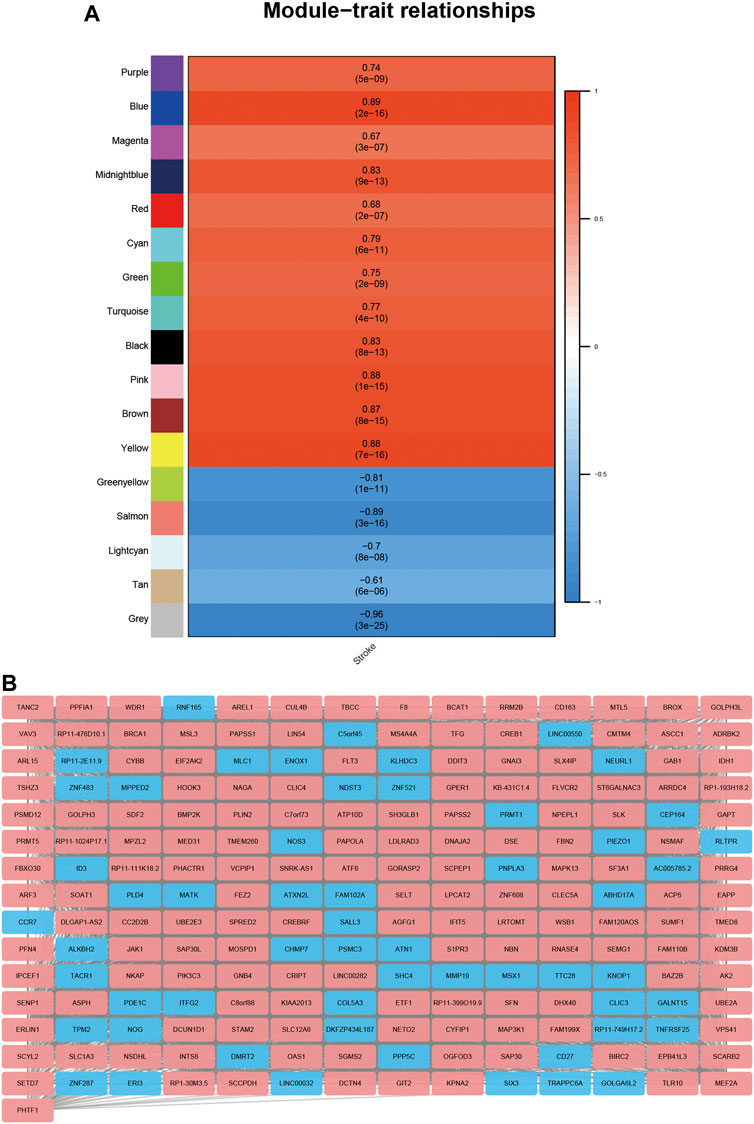
FIGURE 6. Detection of gene modules closely related to stroke using WGCNA. (A): Correlation analysis on gene modules and clinical traits. Each row matches relative gene collection, and each column matched the relative clinical traits. The upper figure in the blank is the correlation coefficient, and the lower figure in the blank is the p value. (B): Co-expression network of lncRNAs and mRNAs in blue modules; red represents the upregulation of the gene, and blue represents the downregulation of the gene.
Diagnostic ROC Curve of lncRNA
This study performed an ROC curve for the 16 lncRNAs for selecting the proper lncRNA to conceive the ceRNA network, and the results are displayed in Figure 7. A total of eight lncRNAs presented high accuracy in diagnosing stroke, with an AUC higher than 0.9. These were DKFZP434L187, DLGAP1-AS2, LINC00282, LINC00550, RP1-30M3.5, RP1-193H18.2, RP11-2E11.9, and RP11-111K18.2, which are candidates for formulating the ceRNA network.
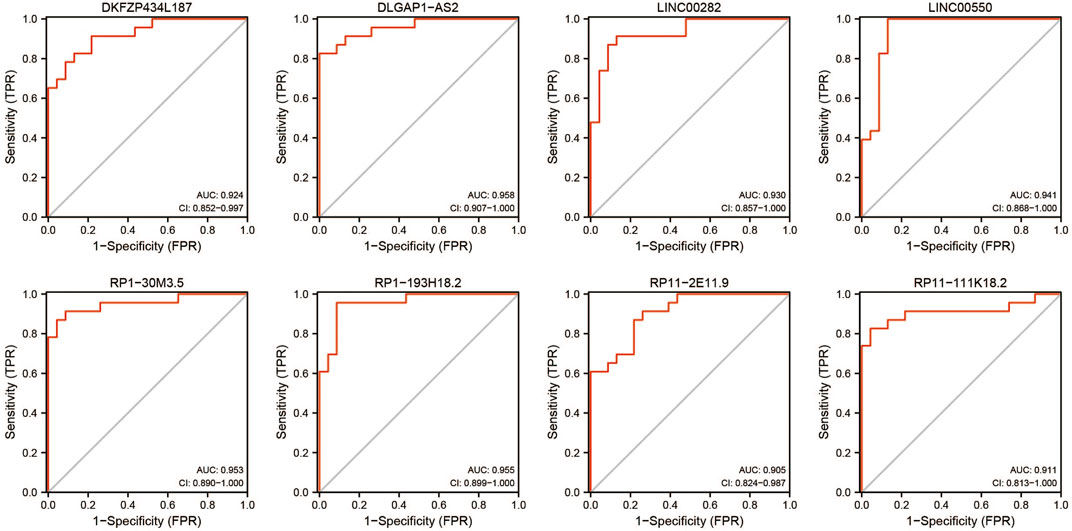
FIGURE 7. ROC diagnostic curve for lncRNAs in blue modules selected by WGCNA (AUC > 0.90).
lncRNA–miRNA–mRNA Network in Stroke
The lncRNA–miRNA–mRNA ceRNA network was constructed to further investigate the impact of the eight lncRNAs on the mRNA expression. According to Figure 7, all eight lncRNAs had high accuracy to diagnose stroke (AUCs of eight lncRNAs are higher than 0.9); then, we speculated that lncRNAs interact with miRNAs via the DIANA-LncBase v2.0 database and obtained four lncRNAs, including two upregulated and two downregulated lncRNAs. MiRNAs targeting mRNAs were speculated by miRWalk 3.0, TargetScan, and miRDB. Combined with mRNAs in Figure 6, a total of 13 mRNAs, including 12 upregulated and one downregulated mRNA, remained. mRNAs and lncRNAs presenting the same tendency to change were selected to form a ceRNA network. Finally, three miRNAs, seven mRNAs, and three lncRNAs constituted the final ceRNA network (Figure 8A). Except for DKFZP434, 187-SIX3 showed a low expression, whereas the remaining lncRNA–mRNA pairs showed a high expression. In the first module, RP11-111K18.2 and four mRNAs competitively combined with two miRNAs (hsa-miR-128-3p and hsa-miR-185-5p). RP1-193H18.2 and two mRNAs scrambled for hsa-miR-103a-3p in the second module, whereas in the third module, DKFZP434L187 and SIX3 struggled for hsa-miR-185-5p. More details on the miRNA–mRNA/lncRNA interactions in the ceRNA network are listed in Table 5.
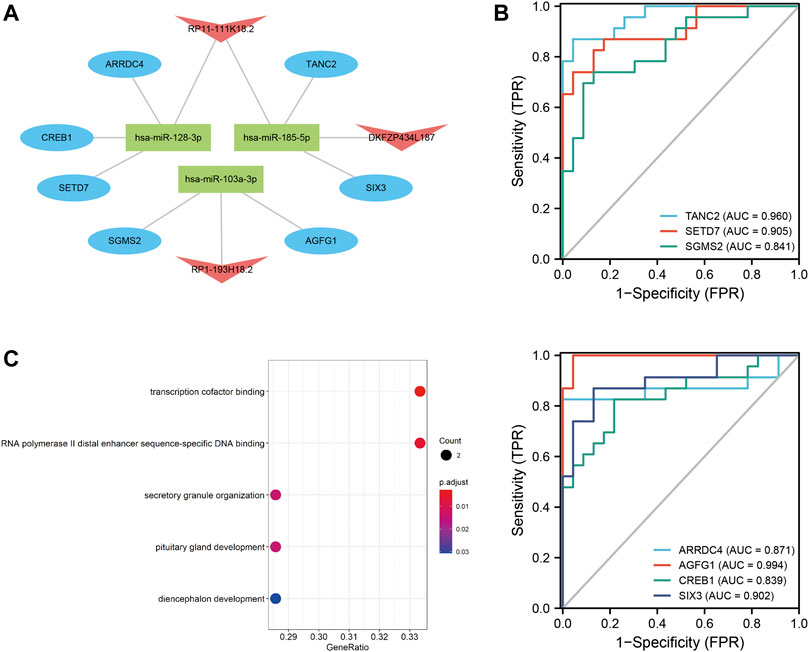
FIGURE 8. ceRNA network and diagnostic ROC curve for mRNAs and GO enrichment analysis. (A): ceRNA network. Blue ovals denote mRNAs; red arrows denote lncRNAs; and green rectangles denote miRNAs. (B): Diagnostic ROC curve of seven mRNAs in the ceRNA network. (C): Summary of GO functional enrichment analysis on mRNAs.
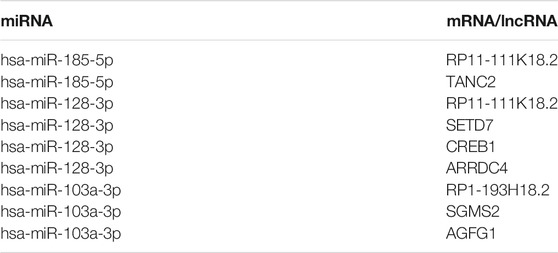
TABLE 5. The pairwise relationships in the lncRNA–miRNA–mRNA ceRNA network.
Meanwhile, the diagnostic efficacy of mRNAs in stroke has been discussed. As shown in Figure 8B, TANC2, SETD7, AGFG1, and SIX3 presented high diagnostic accuracy (AUC > 0.9). GO functional enrichment was also administered to mRNAs to understand ceRNA network-related biological processes. As shown in Figure 8C, the ceRNA network primarily participated in transcription cofactor binding, RNA polymerase II distal enhancer sequence-specific DNA binding, and secretory granule organization. More details on the GO analysis can be found in Table 6.
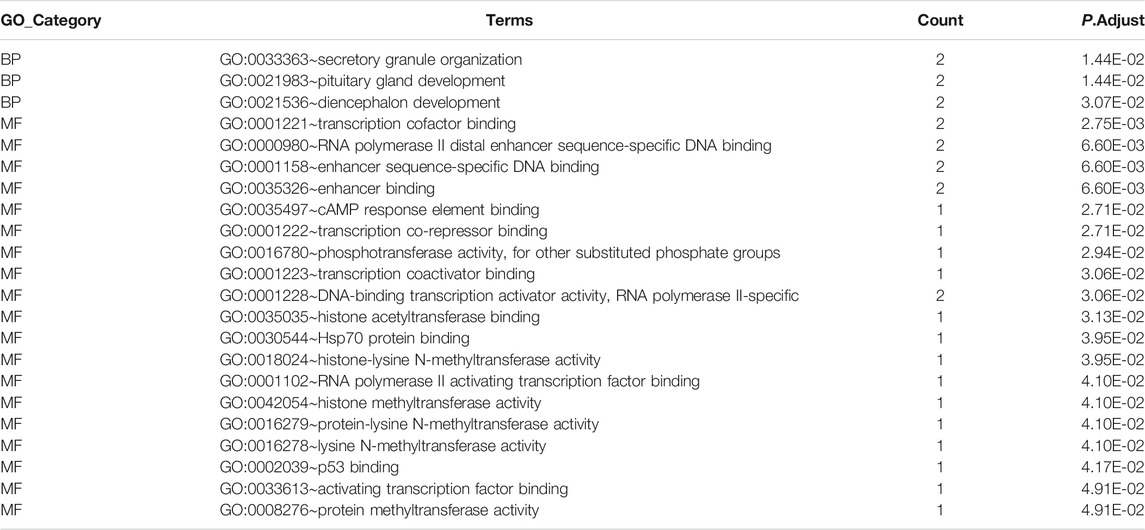
TABLE 6. GO enrichment for the mRNAs involved in the ceRNA network.
Verification of the Diagnostic Efficacy of mRNAs and lncRNAs in the ceRNA Network
GSE22255 was included in this study as the verification series to validate the diagnostic efficacy of mRNAs and lncRNAs in the ceRNA network. RP1-193H18.2 was more advantageous for diagnosing stroke than the other two lncRNAs, as shown in Figure 9A. No mRNA showed realistic diagnostic efficacy (Figure 9B).
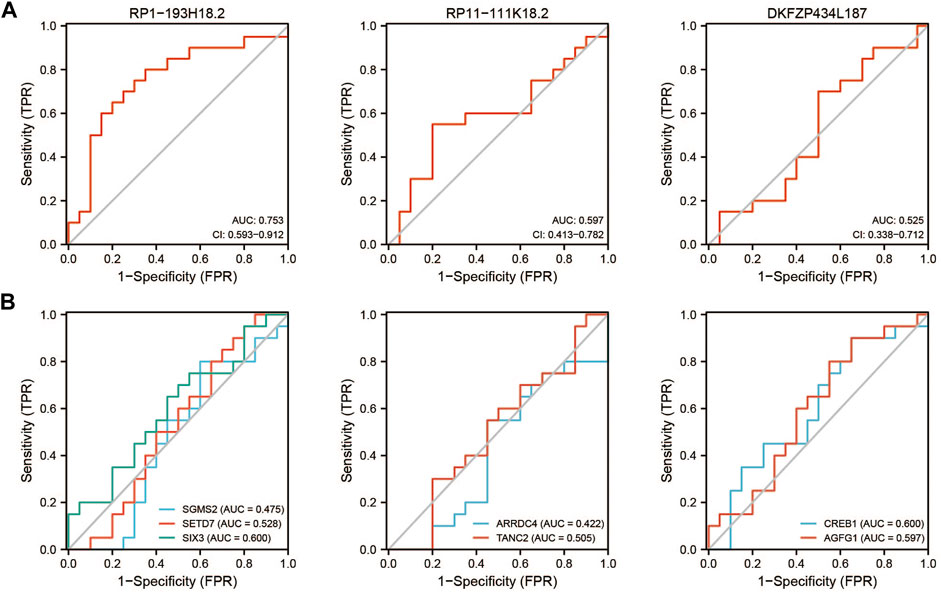
FIGURE 9. Diagnostic efficacy of GSE22255 for lncRNAs and mRNAs. (A): ROC curve for lncRNAs. (B): ROC curve for mRNAs.
Discussion
Stroke causes great burden on human health and the economy. Early diagnosis of stroke will greatly increase the opportunity for patients to receive effective post-stroke rehabilitation; therefore, identifying biomarkers that can detect stroke onset early is vital. However, current diagnostic approaches, such as detection of clinical features and neuroimaging, are not timely. Some researchers have demonstrated that the abnormal expression of lncRNAs can be used as a diagnostic or prognostic biomarker for ischemic stroke. MALAT1 and ANRIL (Yang et al., 2018; Tan et al., 2019; Fathy et al., 2021) were previously demonstrated to serve as protective or detrimental predicting factors for stroke under certain circumstances. However, even though these studies have investigated the relationships between stroke and lncRNAs, only one or two lncRNAs were focused on. There is a lack of systematic analysis, and few researchers have paid attention to the interaction between these DElncRNAs. For the first time, we constructed a ceRNA network to comprehensively explore how lncRNAs work in a stroke onset and to ascertain the interactions between DEGs, and we obtained ROC curves to predict the diagnostic functions of DEGs in our network.
Although lncRNAs seem to be promising biomarkers for stroke, the underlying mechanism of how they impact stroke is still unclear. Currently, an increasing number of studies have been conducted on lncRNAs that interact directly with genes as transcriptional regulators. The ANRIL overexpression has been reported to elevate VEGF levels and promote angiogenesis by activating the NF-κB signaling pathway in diabetes mellitus (DM) + cerebral infarction (CI) rats (Zhang et al., 2017), whereas ANRIL knockdown alleviates neuronal apoptosis in CI rats by inhibiting the NF-κB signaling pathway (Zhao et al., 2019). lncRNAs also participate in stroke mechanisms as ceRNAs. One study has demonstrated that inhibition of MEG3 after stroke attenuates hypoxia-induced apoptosis by decreasing its combination with miR-181b and consequently reducing the expression of 12/15-LOX expression (Liu et al., 2016); another study verifies that knockdown of TUG1 promotes cell survival after oxygen-glucose deprivation insults by serving as an miR-9 sponge (Chen et al., 2017). The overexpression of ANRIL can also improve cell survival by downregulating miR-127 and rescuing the expression of Mcl-1 (Liu et al., 2019) or repressing miR-199a-5p and elevating CAV-1 (Zhong et al., 2020). There is great scope for further investigations into the role of lncRNA as ceRNA in stroke.
In this study, we performed bioinformatics analysis to identify DElncRNAs, DEmiRNAs, and DEmRNAs in stroke from the GEO database and successfully constructed a lncRNA–miRNA–mRNA ceRNA network. A total of three lncRNAs (DKFZP434L187, RP1-193H18.2, and RP11-111K18.2), three miRNAs (miR-128-3p, miR-185-5p, and miR-103a-3p), and seven mRNAs (ARRDC4, CREB1, SETD7, SGMS2, TANC2, SIX3, and AGFG1) were involved in this network. RP1-193H18.2 had greater diagnostic efficacy for stroke than the other two lncRNAs, whereas no selected mRNA presented realistic diagnostic efficacy. Among the three selected lncRNAs, DKFZP434L187 has been detected as a promising biomarker for hepatocellular carcinoma (Sun et al., 2019), and one patent has reported that it may associate with stroke (Sharp et al., 2017). As for miRNAs, miR-185-5p is primarily involved in the process of proliferation and metastasis of tumors (Zhang et al., 2020; Bagheri et al., 2021; Sun et al., 2021; Sur et al., 2021; Zhang et al., 2021); one research has reported that it may participate in ischemic-reperfusion (I/R) injury by regulating nitric oxide synthase 2 (NOS2) (Wang et al., 2016). One study suggested that miR-103a-3p levels decreased after I/R injury, and the overexpression of miR-103a-3p alleviated apoptosis and inflammation after I/R by targeting HMGB1, indicating a possible protective function of miR-103a-3p in IS (Li et al., 2020b). MiR-128-3p is significantly related to I/R injury and IS, and one study found that miR-128-3p is elevated in the cerebrospinal fluid 3 days after AIS. Furthermore, its expression may reflect brain damage (Sørensen et al., 2017). However, whether this elevation is causative or correlative is unknown. Another study demonstrated that inhibition of miR-128-3p alleviates apoptosis after I/R both in vitro and in vivo (Yan et al., 2020). However, Mao et al. (Mao et al., 2017) found that miR-128-3p contributes to neuronal survival after ischemia-induced brain injury by downregulating the expression of the pro-apoptotic protein, p38α; thus, the relationship between miR-128-3p and apoptosis in stroke remains unclear. In addition to I/R injury in stroke, miR-128-3p is also involved in I/R injury in the heart (Ma et al., 2018), liver (Mou et al., 2020), and spinal cord (Wang et al., 2020b). Considering that I/R injury in different organs may share some similar characteristics, miR-128-3p may have a more profound relationship with stroke injury.
Among the seven selected mRNAs, CREB1 and SIX3 were of the greatest importance. CREB1 has been reported to interact with the brain-derived neurotrophic factor (BDNF) and is involved in IS (Shi et al., 2020). One study has demonstrated that CREB1 is the target of miR-128 after stroke, and inhibition of miR-128 by ARPP21 leads to decreased neuronal apoptosis and promoted neurological function repair with the upregulation of CREB1 and BDNF (Chai et al., 2021). Combined with our findings, RP11-111K18.2 may serve as a promising sponge for miR-128-3p and protect against stroke by elevating the CREB1 expression. SIX3 is primarily involved in neurogenesis during embryonic development. SIX3 can participate in the process of normal vertebrate forebrain formation by repressing Wnt1 within the anterior neuroectoderm (Lagutin et al., 2003) or by facilitating cellular proliferation by sequestration of geminin from Cdt1 (Ando et al., 2005). SIX3 is a key component that balances the equilibrium between proliferation and differentiation during neurogenesis as well (Appolloni et al., 2008). In the postnatal stages of brain development, SIX3 is necessary for ependymal cell maturation and consequently ensures the normal process of neurogenesis and neuroblast migration (Lavado and Oliver, 2011). SIX3 is also vital for neuroretinal development (Samuel et al., 2016; Liu and Cvekl, 2017; Takata et al., 2017; Diacou et al., 2018) and striatum neuron formation (Song et al., 2021; Yang et al., 2021). However, it is unclear whether SIX3 functions in neuronal repair after stroke; further research should, therefore, be conducted to confirm this.
In this study, we identified AIS-related lncRNAs, miRNAs, and mRNAs in the ceRNA network. However, this was a pure bioinformatics study without any experimental demonstrations, and the relationship between the ceRNA network and AIS remains unclear. Thus, further experiments and clinical practice are needed to explore how the ceRNA network functions in AIS. First, the basic expression of these predicted DEGs after the onset of stroke, both at the transcriptional and translational levels, should be further examined quantitatively, and their interaction should be verified via immunohistochemistry or immunofluorescence assays directly. Second, the relationship between the DEGs and phenotypes should be demonstrated by loss- and gain-of-function studies; possible pathways need to be identified to elucidate the mechanism more deeply. Meanwhile, the co-expression and interaction of DEGs are of great interest and await investigation.
In conclusion, our research provided a reliable comprehensive analysis by analyzing datasets GSE58294 and GSE110993 (further confirmed with GSE22255) to investigate the DEGs related to stroke onset. In total, 2068 DEmRNAs, 199 DElncRNAs, and 96 DEmiRNAs were identified, and we constructed a ceRNA network with 3 DElncRNAs, 3 DEmiRNAs, and 7 DEmRNAs. GSE22255 verified that RP1-193H18.2 may serve as a novel potential target for stroke diagnosis. In the future, the AIS-related ceRNA network should be completed with improved databases, optimization of algorithms, and increased experimental verification. These results may facilitate the development of novel diagnostic and treatment strategies for AIS.
Conclusion
In this study, we identified DEGs and constructed a lncRNA–miRNA–mRNA ceRNA network by analyzing the interactions and biological functions of these DEGs. Our network identified three lncRNAs, seven mRNAs, and three miRNAs that are closely related to stroke and might serve as promising diagnostic biomarkers. However, the specific pathogenesis and molecular targets still need to be further confirmed through molecular experiments.
Data Availability Statement
The datasets presented in this study can be found in online repositories. The names of the repository/repositories and accession number(s) can be found in the article/Supplementary Material.
Author Contributions
XC collected and analyzed the data, wrote the manuscript, and DW critically read and edited the manuscript.
Funding
This study was supported by the Shanghai Minhang District Health and Family Planning Commission (great discipline of Shanghai Minhang District No. 2020 MWDXK01), the Shanghai Fifth People’s Hospital Construction Project for Key Specialty (Grant No. 2020WYZDZK04), the Shanghai Committee of Science and Technology (Grant Nos 201409004900 and 20S31904400) and the Beijing Health Alliance Charitable Foundation (Grant No. B21088CS).
Conflict of Interest
The authors declare that the research was conducted in the absence of any commercial or financial relationships that could be construed as a potential conflict of interest.
Publisher’s Note
All claims expressed in this article are solely those of the authors and do not necessarily represent those of their affiliated organizations, or those of the publisher, the editors, and the reviewers. Any product that may be evaluated in this article, or claim that may be made by its manufacturer, is not guaranteed or endorsed by the publisher.
Supplementary Material
The Supplementary Material for this article can be found online at: https://www.frontiersin.org/articles/10.3389/fgene.2021.779923/full#supplementary-material
References
Agarwal, V., Bell, G. W., Nam, J. W., and Bartel, D. P. (2015). Predicting Effective microRNA Target Sites in Mammalian mRNAs. eLife 4, e05005. doi:10.7554/eLife.05005
Ando, H., Kobayashi, M., Tsubokawa, T., Uyemura, K., Furuta, T., and Okamoto, H. (2005). Lhx2 Mediates the Activity of Six3 in Zebrafish Forebrain Growth. Dev. Biol. 287 (2), 456–468. doi:10.1016/j.ydbio.2005.09.023
Appolloni, I., Calzolari, F., Corte, G., Perris, R., and Malatesta, P. (2008). Six3 Controls the Neural Progenitor Status in the Murine CNS. Cereb. Cortex 18 (3), 553–562. doi:10.1093/cercor/bhm092
Bagheri, M., Khansarinejad, B., Mosayebi, G., Moradabadi, A., and Mondanizadeh, M. (2021). Diagnostic Value of Plasma miR-145 and miR-185 as Targeting of the APRIL Oncogene in the B-Cell Chronic Lymphocytic Leukemia. Asian Pac. J. Cancer Prev. 22 (1), 111–117. doi:10.31557/apjcp.2021.22.1.111
Bai, Y., Nie, S., Jiang, G., Zhou, Y., Zhou, M., Zhao, Y., et al. (2014). Regulation of CARD8 Expression by ANRIL and Association of CARD8 Single Nucleotide Polymorphism Rs2043211 (p.C10X) with Ischemic Stroke. Stroke 45 (2), 383–388. doi:10.1161/strokeaha.113.003393
Bao, M.-H., Szeto, V., Yang, B. B., Zhu, S.-z., Sun, H.-S., and Feng, Z.-P. (2018). Long Non-coding RNAs in Ischemic Stroke. Cel. Death Dis. 9 (3), 281. doi:10.1038/s41419-018-0282-x
Campbell, B. C. V., and Khatri, P. (2020). Stroke. Lancet 396 (10244), 129–142. doi:10.1016/s0140-6736(20)31179-x
Chai, Z., Zheng, P., and Zheng, J. (2021). Mechanism of ARPP21 Antagonistic Intron miR-128 on Neurological Function Repair after Stroke. Ann. Clin. translational Neurol. 8, 1408–1421. doi:10.1002/acn3.51379
Chen, Y., and Wang, X. (2019). miRDB: an Online Database for Prediction of Functional microRNA Targets. Nucleic Acids Res. 48 (D1), D127–D131. doi:10.1093/nar/gkz757
Chen, S., Wang, M., Yang, H., Mao, L., He, Q., Jin, H., et al. (2017). LncRNA TUG1 Sponges microRNA-9 to Promote Neurons Apoptosis by Up-Regulated Bcl2l11 under Ischemia. Biochem. Biophys. Res. Commun. 485 (1), 167–173. doi:10.1016/j.bbrc.2017.02.043
Chin, C. H., Chen, S. H., Wu, H. H., Ho, C. W., Ko, M. T., and Lin, C. Y. (2014). cytoHubba: Identifying Hub Objects and Sub-networks from Complex Interactome. BMC Syst. Biol. 8 Suppl 4 (Suppl. 4), S11. doi:10.1186/1752-0509-8-S4-S11
Dalman, M. R., Deeter, A., Nimishakavi, G., and Duan, Z. H. (2012). Fold Change and P-Value Cutoffs Significantly Alter Microarray Interpretations. BMC Bioinf. 13 Suppl 2 (Suppl. 2), S11. doi:10.1186/1471-2105-13-S2-S11
Diacou, R., Zhao, Y., Zheng, D., Cvekl, A., and Liu, W. (2018). Six3 and Six6 Are Jointly Required for the Maintenance of Multipotent Retinal Progenitors through Both Positive and Negative Regulation. Cel. Rep. 25 (9), 2510–2523.e4. doi:10.1016/j.celrep.2018.10.106
Dirnagl, U., Iadecola, C., and Moskowitz, M. A. (1999). Pathobiology of Ischaemic Stroke: an Integrated View. Trends Neurosci. 22 (9), 391–397. doi:10.1016/s0166-2236(99)01401-0
Donnan, G. A., Fisher, M., Macleod, M., and Davis, S. M. (2008). Stroke. Lancet 371 (9624), 1612–1623. doi:10.1016/s0140-6736(08)60694-7
Dweep, H., Sticht, C., Pandey, P., and Gretz, N. (2011). miRWalk - Database: Prediction of Possible miRNA Binding Sites by "Walking" the Genes of Three Genomes. J. Biomed. Inform. 44 (5), 839–847. doi:10.1016/j.jbi.2011.05.002
Emberson, J., Lees, K. R., Lyden, P., Blackwell, L., Albers, G., Bluhmki, E., et al. (2014). Effect of Treatment Delay, Age, and Stroke Severity on the Effects of Intravenous Thrombolysis with Alteplase for Acute Ischaemic Stroke: a Meta-Analysis of Individual Patient Data from Randomised Trials. Lancet 384 (9958), 1929–1935. doi:10.1016/s0140-6736(14)60584-5
Fathy, N., Kortam, M. A., Shaker, O. G., and Sayed, N. H. (2021). Long Noncoding RNAs MALAT1 and ANRIL Gene Variants and the Risk of Cerebral Ischemic Stroke: An Association Study. ACS Chem. Neurosci. 12 (8), 1351–1362. doi:10.1021/acschemneuro.0c00822
Feng, L., Guo, J., and Ai, F. (2019). Circulating Long Noncoding RNA ANRIL Downregulation Correlates with Increased Risk, Higher Disease Severity and Elevated Pro-inflammatory Cytokines in Patients with Acute Ischemic Stroke. J. Clin. Lab. Anal. 33 (1), e22629. doi:10.1002/jcla.22629
Fu, J., Yu, Q., Xiao, J., and Li, S. (2021). Long Noncoding RNA as a Biomarker for the Prognosis of Ischemic Stroke. Medicine 100 (17), e25596. doi:10.1097/md.0000000000025596
Gautier, L., Cope, L., Bolstad, B. M., and Irizarry, R. A. (2004). affy--analysis of Affymetrix GeneChip Data at the Probe Level. Bioinformatics 20 (3), 307–315. doi:10.1093/bioinformatics/btg405
Gershon, D. (2002). Microarray Technology: an Array of Opportunities. Nature 416 (6883), 885–891. doi:10.1038/416885a
Gong, C., Zhou, X., Lai, S., Wang, L., and Liu, J. (2020). Long Noncoding RNA/Circular RNA-miRNA-mRNA Axes in Ischemia-Reperfusion Injury. Biomed. Res. Int. 2020, 8838524. doi:10.1155/2020/8838524
Kopp, F., and Mendell, J. T. (2018). Functional Classification and Experimental Dissection of Long Noncoding RNAs. Cell 172 (3), 393–407. doi:10.1016/j.cell.2018.01.011
Lagutin, O. V., Zhu, C. C., Kobayashi, D., Topczewski, J., Shimamura, K., Puelles, L., et al. (2003). Six3 Repression of Wnt Signaling in the Anterior Neuroectoderm Is Essential for Vertebrate Forebrain Development. Genes Dev. 17 (3), 368–379. doi:10.1101/gad.1059403
Langfelder, P., and Horvath, S. (2008). WGCNA: an R Package for Weighted Correlation Network Analysis. BMC Bioinformatics 9 (1), 559. doi:10.1186/1471-2105-9-559
Lavado, A., and Oliver, G. (2011). Six3 Is Required for Ependymal Cell Maturation. Dev. (Cambridge, Eng.) 138 (24), 5291–5300. doi:10.1242/dev.067470
Leek, J. T., Johnson, W. E., Parker, H. S., Jaffe, A. E., and Storey, J. D. (2012). The Sva Package for Removing Batch Effects and Other Unwanted Variation in High-Throughput Experiments. Bioinformatics (Oxford, Eng.) 28 (6), 882–883. doi:10.1093/bioinformatics/bts034
Li, P., Duan, S., and Fu, A. (2020). Long Noncoding RNA NEAT1 Correlates with Higher Disease Risk, Worse Disease Condition, Decreased miR-124 and miR-125a and Predicts Poor Recurrence-free Survival of Acute Ischemic Stroke. J. Clin. Lab. Anal. 34 (2), e23056. doi:10.1002/jcla.23056
Li, J., He, W., Wang, Y., Zhao, J., and Zhao, X. (2020). miR-103a-3p Alleviates Oxidative Stress, Apoptosis, and Immune Disorder in Oxygen-Glucose Deprivation-Treated BV2 Microglial Cells and Rats with Cerebral Ischemia-Reperfusion Injury by Targeting High Mobility Group Box 1. Ann. Transl Med. 8 (20), 1296. doi:10.21037/atm-20-5856
Li, S., Cao, Y., Zhang, H., Lu, X., Wang, T., Xu, S., et al. (2021). Construction of lncRNA-Mediated ceRNA Network for Investigating Immune Pathogenesis of Ischemic Stroke. Mol. Neurobiol. 58 (9), 4758–4769. doi:10.1007/s12035-021-02426-6
Liu, W., and Cvekl, A. (2017). Six3 in a Small Population of Progenitors at E8.5 Is Required for Neuroretinal Specification via Regulating Cell Signaling and Survival in Mice. Dev. Biol. 428 (1), 164–175. doi:10.1016/j.ydbio.2017.05.026
Liu, X., Hou, L., Huang, W., Gao, Y., Lv, X., and Tang, J. (2016). The Mechanism of Long Non-coding RNA MEG3 for Neurons Apoptosis Caused by Hypoxia: Mediated by miR-181b-12/15-LOX Signaling Pathway. Front. Cel. Neurosci. 10, 201. doi:10.3389/fncel.2016.00201
Liu, B., Cao, W., and Xue, J. (2019). LncRNA ANRIL Protects against Oxygen and Glucose Deprivation (OGD)-induced Injury in PC-12 Cells: Potential Role in Ischaemic Stroke. Artif. Cel. Nanomed. Biotechnol. 47 (1), 1384–1395. doi:10.1080/21691401.2019.1596944
Ma, H., Chen, P., Sang, C., Huang, D., Geng, Q., and Wang, L. (2018). Modulation of Apoptosis-Related microRNAs Following Myocardial Infarction in Fat-1 Transgenic Mice vs Wild-type Mice. J. Cel. Mol .Med 22 (11), 5698–5707. doi:10.1111/jcmm.13846
Mao, G., Ren, P., Wang, G., Yan, F., and Zhang, Y. (2017). MicroRNA-128-3p Protects Mouse against Cerebral Ischemia through Reducing P38α Mitogen-Activated Protein Kinase Activity. J. Mol. Neurosci. 61 (2), 152–158. doi:10.1007/s12031-016-0871-z
Mou, T., Luo, Y., Huang, Z., Zheng, D., Pu, X., Shen, A., et al. (2020). Inhibition of microRNA-128-3p Alleviates Liver Ischaemia-Reperfusion Injury in Mice through Repressing the Rnd3/NF‐κB axis. Innate Immun. 26 (6), 528–536. doi:10.1177/1753425920928449
Paraskevopoulou, M. D., Vlachos, I. S., Karagkouni, D., Georgakilas, G., Kanellos, I., Vergoulis, T., et al. (2016). DIANA-LncBase V2: Indexing microRNA Targets on Non-coding Transcripts. Nucleic Acids Res. 44 (D1), D231–D238. doi:10.1093/nar/gkv1270
Ritchie, M. E., Phipson, B., Wu, D., Hu, Y., Law, C. W., Shi, W., et al. (2015). Limma powers Differential Expression Analyses for RNA-Sequencing and Microarray Studies. Nucleic Acids Res. 43 (7), e47. doi:10.1093/nar/gkv007
Robinson, M. D., McCarthy, D. J., and Smyth, G. K. (2010). edgeR: a Bioconductor Package for Differential Expression Analysis of Digital Gene Expression Data. Bioinformatics 26 (1), 139–140. doi:10.1093/bioinformatics/btp616
Samuel, A., Rubinstein, A. M., Azar, T. T., Ben-Moshe Livne, Z., Kim, S.-H., and Inbal, A. (2016). Six3 Regulates Optic Nerve Development via Multiple Mechanisms. Sci. Rep. 6, 20267. doi:10.1038/srep20267
Schneider, V. A., Graves-Lindsay, T., Howe, K., Bouk, N., Chen, H.-C., Kitts, P. A., et al. (2017). Evaluation of GRCh38 and de novo Haploid Genome Assemblies Demonstrates the Enduring Quality of the Reference Assembly. Genome Res. 27 (5), 849–864. doi:10.1101/gr.213611.116
Shannon, P., Markiel, A., Ozier, O., Baliga, N. S., Wang, J. T., Ramage, D., et al. (2003). Cytoscape: a Software Environment for Integrated Models of Biomolecular Interaction Networks. Genome Res. 13 (11), 2498–2504. doi:10.1101/gr.1239303
Sharp, F., Stamova, B., and Jickling, G. C. (2017).Biomarkers for Diagnosis of Stroke and its Causes. US patent US 9803243B2. Oakland , CA: The Regents of the University of California. assignee.
Shi, J., Sun, Y., and Hua, J. (2020). Functional Genetic Variation in the 3′-UTRNTRK2 Is Associated with Risk of Ischemic Stroke. Pgpm Vol. 13, 577–584. doi:10.2147/pgpm.s270319
Song, X., Chen, H., Shang, Z., Du, H., Li, Z., Wen, Y., et al. (2021). Homeobox Gene Six3 Is Required for the Differentiation of D2-type Medium Spiny Neurons. Neurosci. Bull. 37 (7), 985–998. doi:10.1007/s12264-021-00698-5
Sørensen, S. S., Nygaard, A. B., Carlsen, A. L., Heegaard, N. H. H., Bak, M., and Christensen, T. (2017). Elevation of Brain-Enriched miRNAs in Cerebrospinal Fluid of Patients with Acute Ischemic Stroke. Biomark Res. 5, 24. doi:10.1186/s40364-017-0104-9
Stamova, B., Jickling, G. C., Ander, B. P., Zhan, X., Liu, D., Turner, R., et al. (2014). Gene Expression in Peripheral Immune Cells Following Cardioembolic Stroke Is Sexually Dimorphic. PLoS One 9 (7), e102550. doi:10.1371/journal.pone.0102550
Sun, Y., Zhang, F., Wang, L., Song, X., Jing, J., Zhang, F., et al. (2019). A Five lncRNA Signature for Prognosis Prediction in Hepatocellular Carcinoma. Mol. Med. Rep. 19 (6), 5237–5250. doi:10.3892/mmr.2019.10203
Sun, Y. D., Liu, Q., Yang, H. X., Tian, L., Wang, J., Zeng, L., et al. (2021). Long Non-coding RNA UCA1 Mediates Proliferation and Metastasis of Laryngeal Squamous Cell Carcinoma Cells via Regulating miR-185-5p/HOXA13 axis. Eur. Rev. Med. Pharmacol. Sci. 25 (3), 1366–1378. doi:10.26355/eurrev_202102_24845
Sur, D., Balacescu, L., Cainap, S. S., Visan, S., Pop, L., Burz, C., et al. (2021). Predictive Efficacy of MiR-125b-5p, MiR-17-5p, and MiR-185-5p in Liver Metastasis and Chemotherapy Response Among Advanced Stage Colorectal Cancer Patients. Front. Oncol. 11, 651380. doi:10.3389/fonc.2021.651380
Szklarczyk, D., Gable, A. L., Lyon, D., Junge, A., Wyder, S., Huerta-Cepas, J., et al. (2018). STRING V11: Protein-Protein Association Networks with Increased Coverage, Supporting Functional Discovery in Genome-wide Experimental Datasets. Nucleic Acids Res. 47 (D1), D607–D613. doi:10.1093/nar/gky1131
Takata, N., Abbey, D., Fiore, L., Acosta, S., Feng, R., Gil, H. J., et al. (2017). An Eye Organoid Approach Identifies Six3 Suppression of R-Spondin 2 as a Critical Step in Mouse Neuroretina Differentiation. Cel. Rep. 21 (6), 1534–1549. doi:10.1016/j.celrep.2017.10.041
Tan, C., Liu, J., Wei, J., and Yang, S. (2019). Effects of ANRIL Variants on the Risk of Ischemic Stroke: a Meta-Analysis. Biosci. Rep. 39 (5), BSR20182127. doi:10.1042/BSR20182127
Tiedt, S., Prestel, M., Malik, R., Schieferdecker, N., Duering, M., Kautzky, V., et al. (2017). RNA-Seq Identifies Circulating miR-125a-5p, miR-125b-5p, and miR-143-3p as Potential Biomarkers for Acute Ischemic Stroke. Circ. Res. 121 (8), 970–980. doi:10.1161/circresaha.117.311572
Ulitsky, I., and Bartel, D. P. (2013). lincRNAs: Genomics, Evolution, and Mechanisms. Cell 154 (1), 26–46. doi:10.1016/j.cell.2013.06.020
Wang, Y. C., Yin, X. H., Li, S., Zhao, L., Duan, J., Kuang, R. Z., et al. (2016). Role of miRNA-185 in Cerebral Ischemia-Reperfusion Injury. Int. J. Clin. Exp. Med. 9 (7), 12603–12611.
Wang, M., Chen, W., Geng, Y., Xu, C., Tao, X., and Zhang, Y. (2020). Long Non-Coding RNA MEG3 Promotes Apoptosis of Vascular Cells and Is Associated with Poor Prognosis in Ischemic Stroke. Jat 27 (7), 718–726. doi:10.5551/jat.50674
Wang, D., Chen, F., Fang, B., Zhang, Z., Dong, Y., Tong, X., et al. (2020). MiR-128-3p Alleviates Spinal Cord Ischemia/Reperfusion Injury Associated Neuroinflammation and Cellular Apoptosis via SP1 Suppression in Rat. Front. Neurosci. 14, 609613. doi:10.3389/fnins.2020.609613
Yan, Q., Sun, S. y., Yuan, S., Wang, X. q., and Zhang, Z. c. (2020). Inhibition of microRNA ‐9‐5p and microRNA ‐128‐3p Can Inhibit Ischemic Stroke‐related Cell Death In Vitro and In Vivo. IUBMB life 72 (11), 2382–2390. doi:10.1002/iub.2357
Yang, J., Gu, L., Guo, X., Huang, J., Chen, Z., Huang, G., et al. (2018). LncRNA ANRIL Expression and ANRIL Gene Polymorphisms Contribute to the Risk of Ischemic Stroke in the Chinese Han Population. Cel. Mol. Neurobiol. 38 (6), 1253–1269. doi:10.1007/s10571-018-0593-6
Yang, L., Su, Z., Wang, Z., Li, Z., Shang, Z., Du, H., et al. (2021). Transcriptional Profiling Reveals the Transcription Factor Networks Regulating the Survival of Striatal Neurons. Cel. Death Dis. 12 (3), 262. doi:10.1038/s41419-021-03552-8
Yu, G., Wang, L.-G., Han, Y., and He, Q.-Y. (2012). clusterProfiler: an R Package for Comparing Biological Themes Among Gene Clusters. OMICS: A J. Integr. Biol. 16 (5), 284–287. doi:10.1089/omi.2011.0118
Zhang, Y., and Niu, C. (2020). The Correlation of Long Non-coding RNA Intersectin 1-2 with Disease Risk, Disease Severity, Inflammation, and Prognosis of Acute Ischemic Stroke. J. Clin. Lab. Anal. 34 (2), e23053. doi:10.1002/jcla.23053
Zhang, S.-t., Zuo, C., Li, W.-n., Fu, X.-q., Xing, S., and Zhang, X.-p. (2016). Identification of Key Genes Associated with the Effect of Estrogen on Ovarian Cancer Using Microarray Analysis. Arch. Gynecol. Obstet. 293 (2), 421–427. doi:10.1007/s00404-015-3833-8
Zhang, B., Wang, D., Ji, T.-F., Shi, L., and Yu, J.-L. (2017). Overexpression of lncRNA ANRIL Up-Regulates VEGF Expression and Promotes Angiogenesis of Diabetes Mellitus Combined with Cerebral Infarction by Activating NF-κB Signaling Pathway in a Rat Model. Oncotarget 8 (10), 17347–17359. doi:10.18632/oncotarget.14468
Zhang, C., Hua, Y., and Zhong, X. (2020). LncRNA UCA1 Promotes Tumorigenesis of Breast Cancer via Targeting MiR-185-5p. Minerva Med. doi:10.23736/S0026-4806.20.07097-4
Zhang, K., Wang, Y.-Y., Xu, Y., Zhang, L., Zhu, J., Si, P.-C., et al. (2021). A Two-miRNA Signature of Upregulated miR-185-5p and miR-362-5p as a Blood Biomarker for Breast Cancer. Pathol. - Res. Pract. 222, 153458. doi:10.1016/j.prp.2021.153458
Zhao, J. H., Wang, B., Wang, X. H., Wang, J. R., and Xu, C. W. (2019). Influence of lncRNA ANRIL on Neuronal Apoptosis in Rats with Cerebral Infarction by Regulating the NF-κB Signaling Pathway. Eur. Rev. Med. Pharmacol. Sci. 23 (22), 10092–10100. doi:10.26355/eurrev_201911_19577
Keywords: ischemic stroke, lncRNA, bioinformatics analysis, ceRNA, biomarkers
Citation: Chen X and Wu D (2022) Comprehensive Analysis of Hub Genes Associated With Competing Endogenous RNA Networks in Stroke Using Bioinformatics Analysis. Front. Genet. 12:779923. doi: 10.3389/fgene.2021.779923
Received: 21 October 2021; Accepted: 23 December 2021;
Published: 12 January 2022.
Edited by:
Wei Lan, Guangxi University, ChinaReviewed by:
Song Han, Capital Medical University, ChinaShangwei Ning, Harbin Medical University, China
Copyright © 2022 Chen and Wu. This is an open-access article distributed under the terms of the Creative Commons Attribution License (CC BY). The use, distribution or reproduction in other forums is permitted, provided the original author(s) and the copyright owner(s) are credited and that the original publication in this journal is cited, in accordance with accepted academic practice. No use, distribution or reproduction is permitted which does not comply with these terms.
*Correspondence: Danhong Wu, ZGFuaG9uZ3d1QGZ1ZGFuLmVkdS5jbg==