 Yongdun Xie†
 Weiwei Zeng†
 Chaojie Wang
 Daxing Xu
 Huijun Guo
 Hongchun XiongHanshun FangLinshu Zhao
 Jiayu GuShirong ZhaoYuping Ding
 Luxiang Liu*
- National Engineering Laboratory for Crop Molecular Breeding, Institute of Crop Sciences, Chinese Academy of Agricultural Sciences, National Center of Space Mutagenesis for Crop Improvement, Beijing, China
Stem elongation is a critical phase for yield determination and, as a major trait, is targeted for manipulation for improvement in bread wheat (Triticum aestivum L.). In a previous study, we characterized a mutant showing rapid stem elongation but with no effect on plant height at maturity. The present study aimed to finely map the underlying mutated gene, qd1, in this mutant. By analyzing an F2 segregating population consisting of 606 individuals, we found that the qd1 gene behaved in a dominant manner. Moreover, by using the bulked segregant RNA sequencing (BSR-seq)-based linkage analysis method, we initially mapped the qd1 gene to a 13.55 Mb region on chromosome 4B (from 15.41 to 28.96 Mb). This result was further confirmed in F2 and BC3F2 segregating populations. Furthermore, by using transcriptome sequencing data, we developed 14 Kompetitive Allele-Specific PCR (KASP) markers and then mapped the qd1 gene to a smaller and more precise 5.08 Mb interval from 26.80 to 31.88 Mb. To develop additional markers to finely map the qd1 gene, a total of 4,481 single-nucleotide polymorphisms (SNPs) within the 5.08 Mb interval were screened, and 25 KASP markers were developed based on 10x-depth genome resequencing data from both wild-type (WT) and mutant plants. The qd1 gene was finally mapped to a 1.33 Mb interval from 28.86 to 30.19 Mb on chromosome 4B. Four candidate genes were identified in this region. Among them, the expression pattern of only TraesCS4B02G042300 in the stems was concurrent with the stem development of the mutant and WT. The qd1 gene could be used in conjunction with molecular markers to manipulate stem development in the future.
Introduction
Facing a growing population and changing climate, we must increase crop yields to secure the food supply for the future. According to the FAO, the world will need to feed 9.1 billion people by 2050 (Food and Agriculture Organization of the United Nations, 2021), and crop production needs to double to meet the projected demands of the increasing population, dietary shifts, and increasing consumption of biofuels (Ray et al., 2013). Currently grown worldwide, wheat has become the most important food source since it is a major source of carbohydrates in the majority of countries and is ideal for processing into different food products (Igrejas et al., 2020). Although global wheat production has risen over two and a half times since 1960, increasing the wheat yield potential remains a major goal for breeders and geneticists (Reynolds et al., 2009).
Stem development is critical for final yield production. Wheat stems provide physical support for spikes and lodging resistance. Macronutrient and micronutrient transport from the soil to the aboveground portions of plants takes place in the stems (Singh et al., 2020), and stem reserves from plant assimilation preanthesis are increasingly recognized as important sources of carbon for grain filling, especially in stressful environments (Blum, 1998). Due to the importance of wheat stem development, this process has been recognized as an important target for improvement.
To further characterize the dynamic changes in wheat growth, the elongation phase, from the terminal spikelet stage to anthesis, is divided into seven stages (Guo et al., 2018). By using 210 wheat accessions, researchers qualified 75 plant growth-associated traits that can be manipulated to alter grain yields at these seven stages of the elongation phase (Guo et al., 2018). Moreover, wheat stem elongation is affected by a series of environmental factors (Jamieson et al., 1998; Whitechurch et al., 2007). Temperature is one of the most important factors affecting stem elongation (Shimizu and Hisamatsu, 2009). The temperature response of wheat is highly heritable and affects both the final height and the timing of stem elongation (Kronenberg et al., 2021). In addition, vernalization and photoperiod have combined effects on stem elongation. Compared with the photoperiod, the vernalization response has a stronger effect on the duration of the vegetative phase, while photoperiod sensitivity can prolong the stem elongation phase by up to 23% (Steinfort et al., 2017). Unlike many other species, low red/far-red ratios delay wheat stem growth, especially peduncle elongation (Ugarte et al., 2010). Photosynthetic traits have also been shown to have weaker associations with plant stem length in wheat (Yu et al., 2020).
A series of wheat genes has been shown to regulate stem growth, and many of these genes reduce plant height due to the importance of the shortened plant height contribution to lodging resistance. To date, more than 20 wheat reduced height (Rht) genes have been identified (Mo et al., 2018), and Rht-1, Rht-2, and Rht-8 are the three most important semidwarfing genes according to their distribution in widely adapted varieties (Tang et al., 2009). By using a whole-genome association mapping method, a variety of plant height-associated loci were identified (Zanke et al., 2014). In addition to plant height-associated genes, VRN1 (Harris et al., 2017), PPD1 (Harris et al., 2017), TB1 (Dixon et al., 2020), cinnamoyl-CoA reductase-encoding genes (Ma, 2007), and TaCOLD1 (Dong et al., 2019) have also been found to function in regulating wheat stem growth. Additionally, all of these genes that regulate stem growth affect the final plant height of mature plants.
We screened and characterized a rapidly developing wheat mutant, qd, which showed an accelerated growth rate but had a final plant height equivalent to that of the wild-type (WT) control (Zhang et al., 2016). Transcriptome analysis revealed that benzoxazinoids have a potential role in regulating stem development in qd (Xu et al., 2021). In this study, we finely mapped the qd1 mutation responsible for regulating this phenotype. Candidate genes can be used in breeding programs to manipulate stem growth in the future.
Materials and Methods
Plant Materials and Phenotypic Observations
The qd mutant was developed through ion beam mutagenesis as described in our previous report (Zhang et al., 2016). The qd mutant and WT Lunxuan 987 were used to construct a mapping population. All plants used in this study were grown at the experimental station of the Institute of Crop Sciences, Chinese Academy of Agricultural Sciences (CAAS), Beijing, and studied in 2017, 2018, and 2019. Twenty seeds of all genotypes in the mapping population were planted in 2 m rows, with 25 cm spacing between rows. Every 20 rows contained one row of the WT and one row of the qd mutant, which were used for phenotypic control. The phenotypes of the plants composing the mapping population were characterized by measuring the plant height at both the booting stage and the mature stage. The fresh weight and dry weight of the roots, stems, and leaves of five individual qd and WT plants were measured at the jointing stage, booting stage, heading stage, and filling stage.
Bulked Segregant RNA Sequencing (BSR-Seq) Analysis
At the booting stage, 20 plants representing typical WT phenotypes and 20 plants representing typical qd phenotypes were sampled in the field and immediately placed in liquid nitrogen. At the same time, 15 WT and 15 qd plants were pooled in the same way. Total RNA was isolated from the bulked samples using an RNeasy® Plant Mini Kit (Qiagen, Germany). The purification of RNA samples and construction of sequencing libraries were performed as described previously. RNA sequencing was carried out on an Illumina HiSeq X series platform. The clean reads were subsequently aligned to the wheat reference genome (IWGSC RefSeq v1.0, https://wheat-urgi.versailles.inra.fr/Seq-Repository/Assemblies) by using STAR v2.3.0e software (Dobin et al., 2013). Single-nucleotide polymorphisms (SNPs) were subsequently called by using GATK v3.1-1 software (Mckenna et al., 2010). The original transcriptome data have been uploaded to NCBI.
DNA Isolation and Genome Resequencing
The leaves of 30 WT and qd plants were collected and pooled together. DNA was isolated using the cetyl-trimethylammonium bromide (CTAB) method. Two replicate biological samples of the WT and mutant were sent for genome resequencing at Annoroad Gene Technology in Beijing. Sequencing was performed on an Illumina HiSeq 2000 platform at a 10x depth. The original genome resequencing data have been uploaded to NCBI.
Identification of SNPs Between the WT and qd
High-quality clean reads were used for SNP identification between the WT and qd. SNPs were manually screened from the reads sequenced more than 10 times via IGV visual software (Guan and Sung, 2016). The chromosomal positions and nucleotide variations of each SNP between the initial positioning intervals were recorded in Excel 2010 software.
Development of Kompetitive Allele-Specific PCR (KASP) Markers and Genotyping
There were two criterial rules for the SNPs selection from both transcriptome data and the genome resequencing data. The first one was that the genotypes of WT and qd can be finely differentiated by KASP makers. The second rule was that the mapping population can be clearly differentiated by KASP makers. Genomic sequences (200 bp) flanking the targeted SNPs were used as templates for designing PCR primers. The primers were designed with the online tool PolyMarker (http://www.polymarker.info/). For each SNP site, the reverse primer was set to “common”. Forward primer A ended with the variant nucleotides for the WT genotype, while forward primer B ended with the variant nucleotides for the qd genotype. The FAM sequence (5′-GAAGGTGACCAAGTTCATGCT-3′) was added to the 5′ end of forward primer A, and the HEX sequence (5′-GAAGGTCGGAGTCAACGGATT-3′) was added to the 5′ end of forward primer B. All primers were synthesized by Sangon Biotech.
PCR was performed in a 384-well system. Each reaction consisted of 2.5 µL of 2x KASP Master Mix (LGC Genomics, Middlesex, UK), 0.06 µL of KASP Primer Mix (forward primer A (100 μM):forward primer B (100 μM):reverse primer R (100 μM):ddH2O = 12:12:30:46), 0.04 µL of 25 mM MgSO4, and 2.4 µL of DNA template. The cycling program was set to 95°C for 15 min, 10 cycles of 95°C for 20 s followed by 61°C for 30 s, and 30 cycles of 95°C for 10 s followed by 57°C for 1 min. After the reactions, the fluorescence signals were scanned via FLUOstar Omega SNP (BMG Labtech), and genotype identification was performed by Omega software (v.5.11 R3).
Linkage Map Construction
The QTL IciMapping v4.2 program (http://www.isbreeding.net/) was used for genetic map construction. The BIP (QTL mapping in biparental populations) function was used in this study, with the default settings used for all other parameters. The logarithm of odds (LOD) score was set to a threshold of 2.5, and the Kosambi map function was chosen to calculate the mapping distance from recombination frequencies.
Candidate Gene Transcriptional Analysis With Quantitative Real-Time RT-PCR (qPCR)
RNA was isolated following the protocol described in the BSR-seq analysis section. cDNA was synthesized using TransScript® All-in-One First-Strand cDNA Synthesis SuperMix for qPCR (one-step gDNA removal) (TransGen Biotech, China) according to the manufacturer’s instructions. cDNA synthesis was conducted in a 20 µL volume composed of 4 µL of 5x TransScript® All-in-One Super Mix for qPCR, 1 µL of gDNA Remover, 2 µL of RNA template, and 13 µL of RNase-free water. The cDNA synthesis program was as follows: 42°C incubation for 15 min followed by 85°C incubation for 15 s. The cDNA products were standardized to 200 ng μl−1 until further use. The primers used for qPCR analysis of candidate genes are listed in Supplementary Table S1. A CFX 96 Real-Time System (Bio-Rad, USA) and TransScript® Top Green qPCR SuperMix (TransGen Biotech, China) were used to perform qPCR and analyze the generated data. The actin gene was used as an internal control. We included at least three technical replicates for each RNA sample per plate. The comparative threshold 2−ΔΔCT method was applied to quantify relative gene expression.
Results
Stem Elongation Was Quicker in the qd Mutant Than in the WT
As we reported previously (Zhang et al., 2016), the qd plants were taller than the WT plants from the booting to heading stages but were similar in height to the WT at maturity, as shown in Figure 1 and Figure 2D.
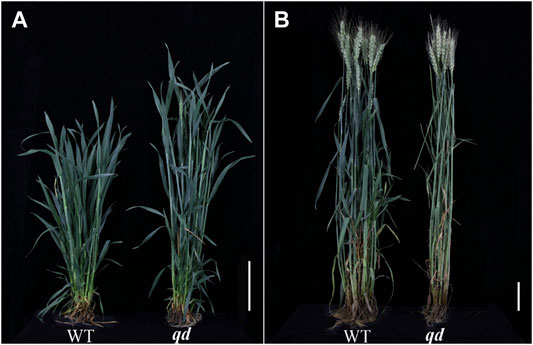
FIGURE 1. Heights of WT and qd plants at various stages. Bar = 8 cm. (A) Typical plants at the booting stage; (B) Typical plants at the mature stage.
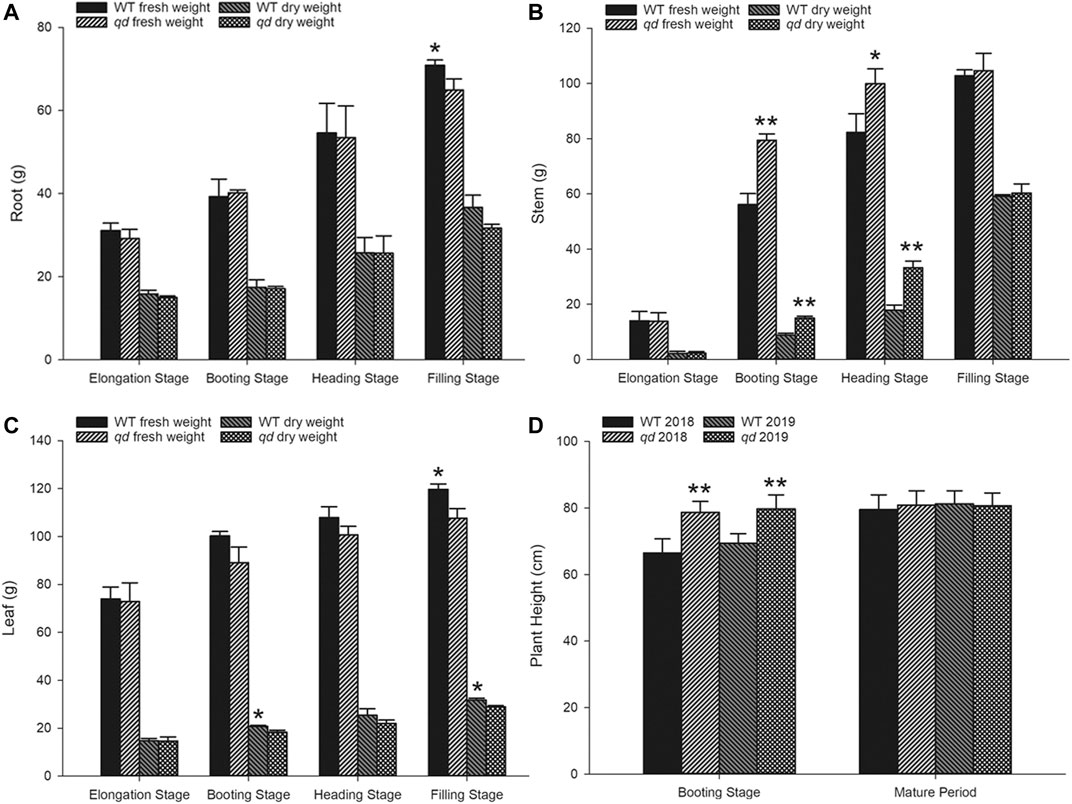
FIGURE 2. Phenotypic data of WT and qd plants at various stages. (A) Root weight comparison between qd and the WT; (B) Stem weight comparison between qd and the WT; (C) Leaf weight comparison between qd and the WT; (D) Plant height comparison between qd and the WT Note: “**” indicates that the difference between qd and the WT is significant at the 0.01 level; “*” indicates that the difference between qd and the WT is significant at the 0.05 level.
Neither the fresh weight nor the dry weight of the roots differed between qd and the WT before the heading stage, but compared with that of qd roots, the fresh mass of the WT roots was greater at the filling stage, as shown in Figure 2A. Similar to the plant height phenotype, both the fresh weight and dry weight of the stems of qd were significantly higher than those of the WT at the booting stage and heading stage, while there was no difference at the filling stage, as shown in Figure 2B. However, the dry leaf weight of the WT was higher than that of qd at the booting and filling stages, and the fresh leaf weight of the WT was also higher than that of qd at the filling stage, as shown in Figure 2C.
qd1 Is a Phenotypically Dominant Gene
As shown in Figure 3, the phenotype of the F1 plants derived from a cross of the WT and qd, regardless of whether qd served as the male or female parent, was the same as that that of qd. This result suggested that the phenotype of qd was inherited in a dominant manner. A total of 606 F2 individuals from a WT x qd cross were characterized according to their phenotypes. The results showed that the phenotype of 454 plants was the same as that of qd, and the phenotype of 152 plants was the same as that of the WT. These results fit a 3:1 segregation model with a χ2 value of 0.0022 and a p value of 0.9626, which means that the stem development-regulating gene qd1 is a phenotypically dominant gene.
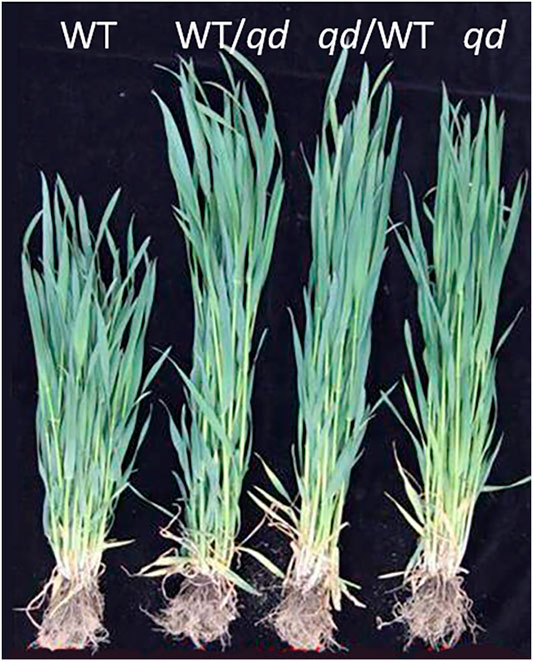
FIGURE 3. Plant heights of WT, qd, and F1 plants at the booting stage.
BSR-Seq-Based Linkage Analysis
From the F2 population, 20 plants with a qd-type phenotype and 20 plants with a WT phenotype were collected and formed into 2 pools. At the same time, 15 qd and WT plants were pooled together. The RNA of these four pools was sequenced, and 32899 HC SNPs were screened and used for linkage analysis. By using the QTL-seq analysis method, we mapped the qd1 locus to a 13.55 Mb region on chromosome 4B, from 15.41 to 28.96 Mb, with the confidence level set to 0.99, as shown in Figure 4.
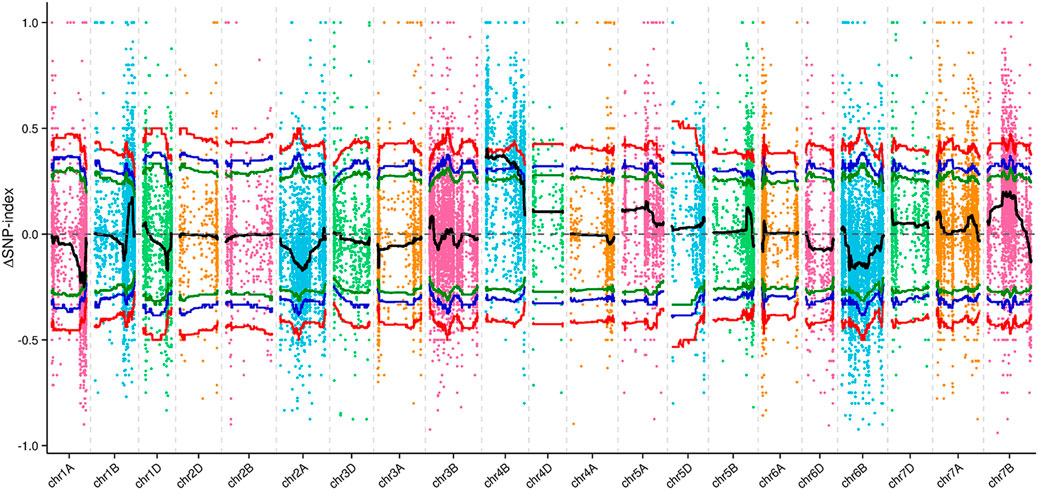
FIGURE 4. ΔSNP index values of all SNPs across the chromosomes. Note: The colored dots represent the SNP index values for this region. The black line represents the fitted SNP index value. The green, blue, and red lines represent the threshold lines with confidence levels of 0.90, 0.95, and 0.99, respectively.
To confirm the above results, we designed nine KASP markers distributed evenly across chromosome 4B based on transcriptome sequencing data, which are shown in Supplementary Table S2 (markers ch4b1∼9). As we reported previously (Zhang et al., 2016), the genotype of the Rht-B1 gene was different between qd and WT. We also used the Rht-B1 marker (the sequence of which is listed in Supplementary Table S2) for this analysis. With these 10 markers, we subjected 352 individuals from the F2 population (WT/qd) to QTL analysis. As shown in Figure 5A, a QTL with a LOD value of 16.87 between ch4b2 and ch4b3 was detected. The phenotypic variance explained (PVE) by this QTL in the F2 population was 18.60%. When 361 individuals from the BC3F2 (qd/WT//WT///WT////WT) population were used for QTL analysis, we detected two QTLs. The first QTL was between ch4b2 and Rht-B1, with a LOD value of 20.73, and the second QTL was between Rht-B1 and ch4b3, with a LOD value of 21.46, as shown in Figure 5B. The PVEs of these two QTLs were 15.16 and 10.91%, respectively. These results suggested that there was a QTL between ch4b2 and ch4b3, with a physical position within 18.01–39.02 Mb on chromosome 4B. This localization interval overlapped with the analogous results of our transcriptome association analysis. Therefore, we took the position from 15.41 to 39.02 Mb as the initial positioning interval for the qd1 locus.
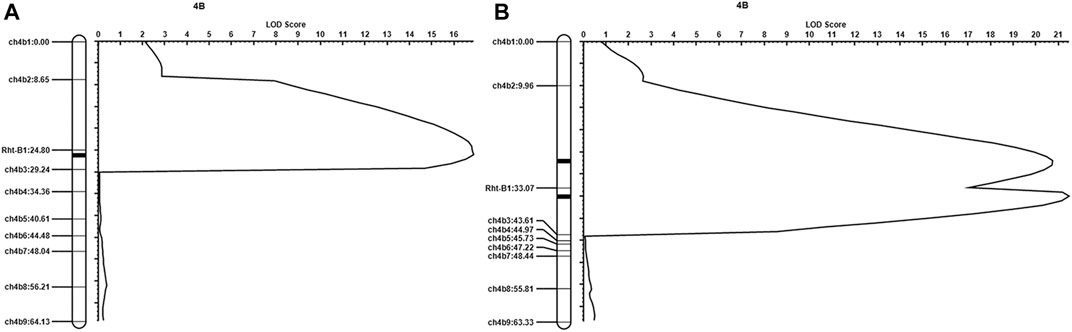
FIGURE 5. QTL mapping results (A) Results from the WT/qd F2 population; (B) results from the BC3F2 (qd/WT//WT///WT////WT) population.
Localization of the qd1 Locus Within the Initial Positioning Interval
From the transcriptome sequencing data, we screened 121 SNPs within the initial positioning interval. Fourteen KASP marks were successfully developed and named bsph1 ∼14, as listed in Supplementary Table S2. Fifty-nine recombinant individuals from the F2 population were detected. Three recombinant individuals at the markers bsph6, bsph7 and bsph8 were detected. This result indicated that the qd1 locus was located in a 5.08 Mb interval, from 26.80 to 31.88 Mb on chromosome 4B, as shown in Figure 6A.
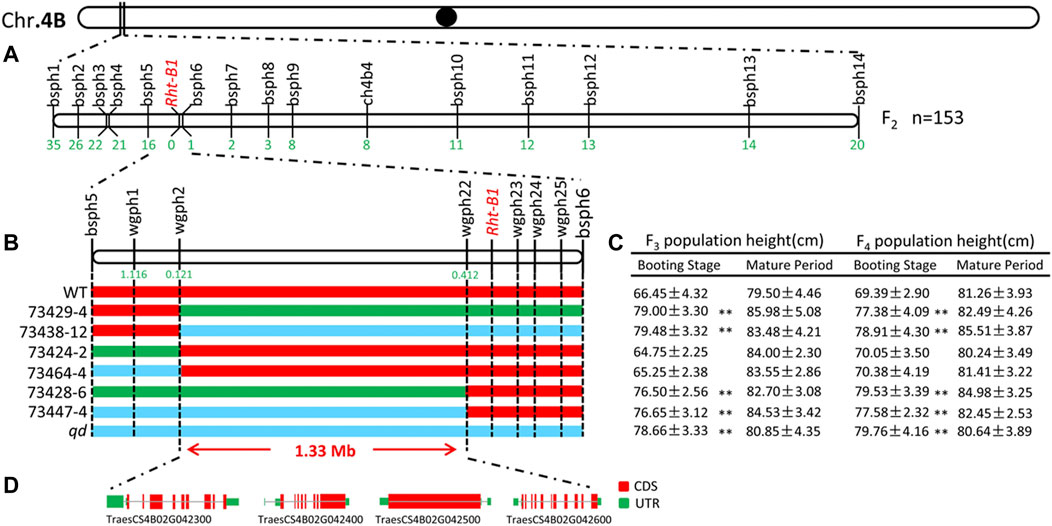
FIGURE 6. Fine mapping of the qd1 gene. Note: (A) Validation of the qd1 target interval via the F2 population. The numbers below the vertical lines represent the numbers of recessive single-strand recombinants in the F2 population. (B) Genotyping of the F3 and F4 populations. Red indicates the WT genotype, green indicates the heterozygous genotype, blue indicates the qd genotype, and the numbers below the vertical lines represents the recombination frequencies. (C) Phenotypic data of the plants composing the F3 and F4 populations. “**” indicates differences between the populations that are significant at the 0.01 level. (D) Gene annotation within the localization interval.
Development of KASP Markers Based on Genomic Resequencing Data
We pooled the DNA samples from 30 qd plants and 30 WT plants and subjected the pooled sample to genome resequencing. Two biological repeats were included for both qd and the WT. By using genomic resequencing data, we screened 4,481 SNPs within the 5.08 Mb interval (from 26.80 to 31.88 Mb). Among these SNPs, 25 KASP markers (as listed in Supplementary Table S2, namely, wgph1∼27) were developed and used for further fine mapping analysis.
Fine Mapping of the qd1 Locus
In the year of 2018 and 2019, the F3 (2,338 individuals) and F4 (4,123 individuals) populations were analyzed with the newly developed KASP markers. In total, 182 recombinant individuals from six recombinant lines were identified. The plant heights of recombinant lines displaying heterozygous or qd genotypes between markers wgph2 and wgph22 significantly differed from that of the WT plants at the booting stage, as shown in Figures 6B,C. The recombination rates of wgph2 and wgph22 were 0.121 and 0.412, respectively. Therefore, the qd1 locus was mapped to within a 1.33 Mb interval from 28.86 to 30.19 Mb on chromosome 4B.
Candidate Genes for the qd1 Locus
In the targeted 1.33 Mb region on chromosome 4B, we identified four genes, namely, TraesCS4B02G042300, TraesCS4B02G042400, TraesCS4B02G042500 and TraesCS4B02G042600, as listed in Table 1 and shown in Figure 6D. We further analyzed the expression levels of these four genes in both the leaves and stems. As shown in Figure 7, only the expression pattern of TraesCS4B02G042300 in the stems was concurrent with the stem development of qd and the WT.
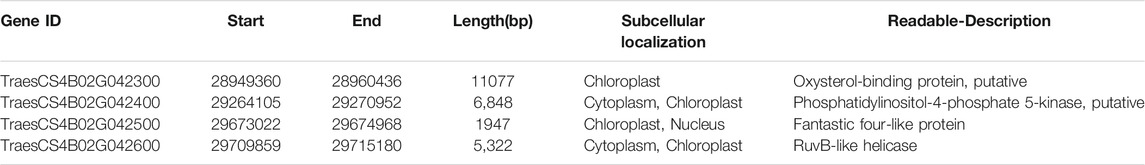
TABLE 1. Information about the basic candidate genes.
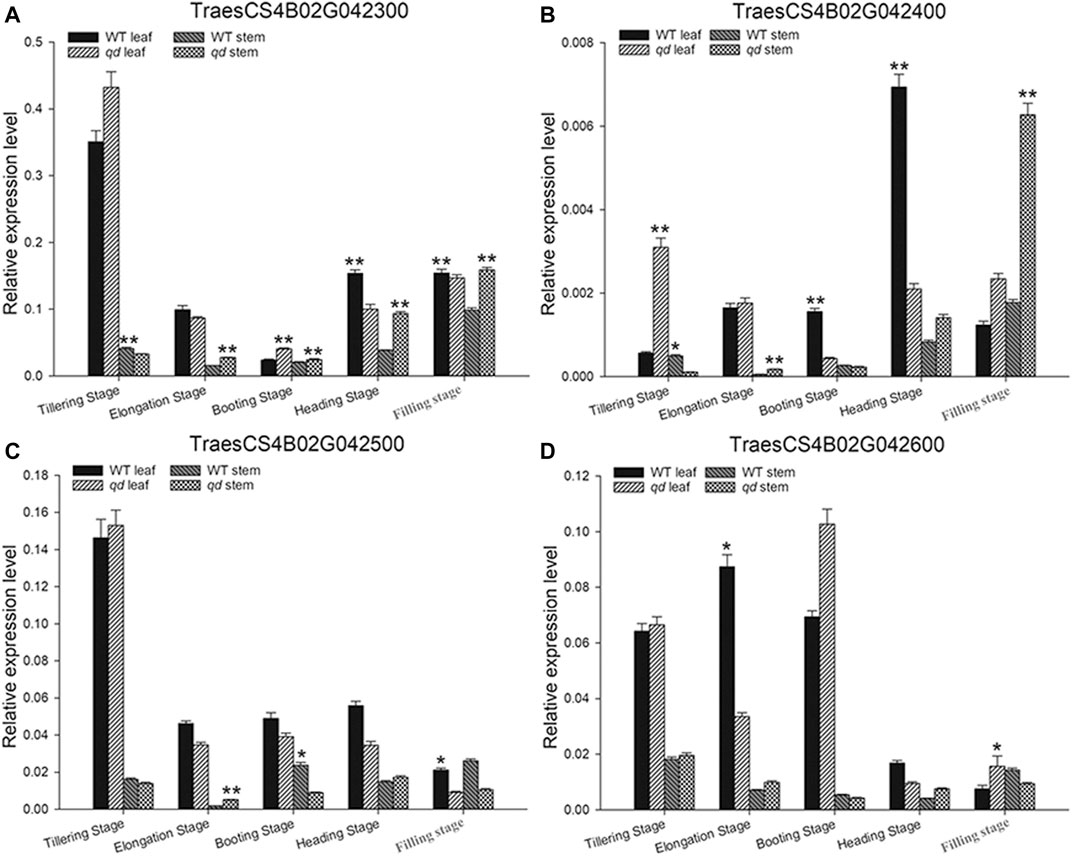
FIGURE 7. Expression analysis of candidate genes in different developmental stages and tissues. (A)–(D) indicate the genes TraesCS4B02G042300, TraesCS4B02G042400, TraesCS4B02G042500, and TraesCS4B02G042600, respectively. “*” indicates that the differences between qd and the WT are significant at the 0.05 level; “**” indicates that the differences between qd and the WT are significant at the 0.01 level.
According to the gene annotation results, there were 3 transcripts of this gene, as shown in Figure 8. We detected five SNPs in the exon regions of TraesCS4B02G042300. However, the functions of these SNPs need to be further explored.
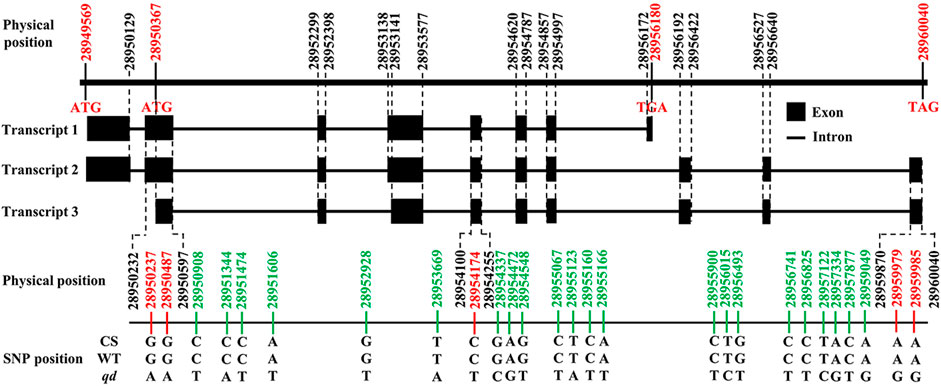
FIGURE 8. Gene structure of TraesCS4B02G042300.
Discussion
To feed the rapidly increasing global population, improving the wheat yield potential remains a major goal of breeding efforts (Reynolds et al., 2009). Manipulating the duration of both the preanthesis developmental phase and stem elongation is an important goal for developing improved wheat varieties with better adaptation and yield potential (Borràs-Gelonch et al., 2011; Guo et al., 2018). The duration of the stem elongation stage is considered a major factor that determines yield, as fertile florets are produced during this stage (Fischer, 2007). Several studies have suggested that extending the duration of the stem elongation phase would lead to an increase in the spike dry weight and the number of fertile florets at anthesis (Miralles et al., 2000; González et al., 2002; Borràs-Gelonch et al., 2011). Moreover, we did not identify negative effects on the seed number per spike in our qd mutant (data not shown), although this mutant presented a shortened stem elongation duration due to the accelerated stem development rate. A higher growth rate and higher yield could be synchronous in wheat (Xiao et al., 2018). In wheat breeding practices, an extended duration of the stem elongation phase easily results in late flowering and maturation. The qd mutant could be used to enrich the genetic capacity for the critical phase of stem elongation.
Wheat stem development is heavily determined by hormone signaling pathways, of which gibberellin (GA) signaling is the most important pathway for elite variety development and adaptation (Wu et al., 2021) (Richards et al., 2001). The Green Revolution genes Rht-B1b and Rht-D1b significantly contributed to improving the harvest index and seed production. The DELLA proteins encoded by the Rht-B1b and Rht-D1b genes reduced the wheat plant height by altering GA sensitivity (Peng et al., 1999). Translational reinitiation of the main open reading frame of these two genes was shown to block the GA signaling pathway, and this effect was determined to be dominant (Van De Velde et al., 2021). There is an Rht-B1b allele in WT plants and an Rht-B1a allele in qd mutants (Zhang et al., 2016). Moreover, in this study, the phenotype of the F1 plants (as shown in Figure 3) and some plants in the segregating population (as shown in Figure 6) with the Rht-B1b allele was the same as that of the qd mutant. These results indicated that the qd1 gene functions upstream of the Rht-B1 gene. On the other hand, the Rht-B1b and Rht-D1b genes have been shown to lead to an apparent trade-off between yield and nitrogen use efficiency in high-yielding varieties (Wu et al., 2021). In addition, these green revolution genes have some negative effects on coleoptile length (Li et al., 2011), anther size (Okada et al., 2019), and Fusarium head blight resistance (Srinivasachary et al., 2008). Whether the qd1 gene that was finely mapped in this study could overcome the negative effects of the Rht-B1b and Rht-D1b genes remains unknown. The expression pattern of TraesCS4B02G042300 was concurrent with the phenotypes of qd and the WT (as shown in Figure 7). This gene was predicted to encode a putative oxysterol-binding protein (OSBP), which belongs to a family of sterol and phosphoinositide binding/transfer proteins in eukaryotes. The expression of OSBP is necessarily under hormone, light intensity, and temperature conditions in Arabidopsis (Umate, 2011). The mechanism of how this OSBP encoding gene regulated stem elongation through hormone or temperature responding pathway needs further exploration.
Previous increases in the yield potential of wheat have largely resulted from improvements in agronomic practices and harvest indexes. However, further increasing the harvest index is unlikely. A new opportunity to increase the yield potential involves increasing the production of biomass (Parry et al., 2010). Li et al showed that biomass can be increased by improving photosynthesis in maize (Li et al., 2020). In the present study, compared with the WT plants, qd mutants had a much greater fresh stem weight and dry matter weight at the booting stage, although there were no differences at the filling stage (Figure 2). The mechanism by which the qd1 gene drives increased biomass production at certain times and the value of this role in breeding programs need to be further characterized. The qd1 gene and associated molecular markers developed in this study could be used as targets for further improvement of stem growth traits in wheat.
Data Availability Statement
The datasets presented in this study can be found in online repositories. The names of the repository/repositories and accession number(s) can be found below: https://www.ncbi.nlm.nih.gov/, PRJNA745496.
Author Contributions
YX and WZ developped the mutant and did most of the mapping work; CW, DX, HG, HX, and HF were invovled in molecular markers development; LZ, JG, SZ, and YD were involved in mapping population construction; LL designed the project.
Funding
This work was supported by the National Natural Science Foundation of China (Project No. 11775304) and by China Agriculture Research System of MOF and MARA (Grant No. CARS-03).
Conflict of Interest
The authors declare that the research was conducted in the absence of any commercial or financial relationships that could be construed as a potential conflict of interest.
Publisher’s Note
All claims expressed in this article are solely those of the authors and do not necessarily represent those of their affiliated organizations, or those of the publisher, the editors and the reviewers. Any product that may be evaluated in this article, or claim that may be made by its manufacturer, is not guaranteed or endorsed by the publisher.
Acknowledgments
We sincerely thank Junjie Fu (Institute of Crop Sciences, CAAS) and Hongjie Li (Institute of Crop Sciences, CAAS) for their help in the preparation of this manuscript.
Supplementary Material
The Supplementary Material for this article can be found online at: https://www.frontiersin.org/articles/10.3389/fgene.2021.793572/full#supplementary-material
References
Blum, A. (1998). Improving Wheat Grain Filling under Stress by Stem reserve Mobilisation. Euphytica 100, 77–83. doi:10.1023/a:1018303922482
Borràs-Gelonch, G., Rebetzke, G. J., Richards, R. A., and Romagosa, I. (2011). Genetic Control of Duration of Pre-anthesis Phases in Wheat (Triticum aestivum L.) and Relationships to Leaf Appearance, Tillering, and Dry Matter Accumulation. J. Exp. Bot. 63, 69–89. doi:10.1093/jxb/err230
Borràs-Gelonch, G., Rebetzke, G. J., Richards, R. A., and Romagosa, I. (2012). Genetic Control of Duration of Pre-anthesis Phases in Wheat (Triticum aestivum L.) and Relationships to Leaf Appearance, Tillering, and Dry Matter Accumulation. J. Exp. Bot. 63, 69–89. doi:10.1093/jxb/err230
Dixon, L. E., Pasquariello, M., and Boden, S. A. (2020). TEOSINTE BRANCHED1 Regulates Height and Stem Internode Length in Bread Wheat. J. Exp. Bot. 71, 4742–4750. doi:10.1093/jxb/eraa252
Dobin, A., Davis, C. A., Schlesinger, F., Drenkow, J., Zaleski, C., Jha, S., et al. (2013). STAR: Ultrafast Universal RNA-Seq Aligner. Bioinformatics 29, 15–21. doi:10.1093/bioinformatics/bts635
Dong, H., Yan, S., Liu, J., Liu, P., and Sun, J. (2019). TaCOLD1 Defines a New Regulator of Plant Height in Bread Wheat. Plant Biotechnol. J. 17, 687–699. doi:10.1111/pbi.13008
Fischer, R. A. (2007). Paper Presented At International Workshop On Increasing Wheat Yield Potential, Cimmyt, Obregon, Mexico, 20-24 March 2006 Understanding The Physiological Basis Of Yield Potential In Wheat. J. Agric. Sci. 145, 99–113. doi:10.1017/s0021859607006843
Food and Agriculture Organization of the United Nations (2021). Available at: http://www.fao.org/fileadmin/templates/wsfs/docs/expert_paper/How_to_Feed_the_World_in_2050.pdf.
González, F. G., Slafer, G. A., and Miralles, D. J. (2002). Vernalization and Photoperiod Responses in Wheat Pre-flowering Reproductive Phases. Field Crops Res. 74, 183–195. doi:10.1016/s0378-4290(01)00210-6
Guan, P., and Sung, W.-K. (2016). Structural Variation Detection Using Next-Generation Sequencing Data. Methods 102, 36–49. doi:10.1016/j.ymeth.2016.01.020
Guo, Z., Liu, G., Roder, M. S., Reif, J. C., Ganal, M. W., and Schnurbusch, T. (2018). Genome-wide Association Analyses of Plant Growth Traits during the Stem Elongation Phase in Wheat. Plant Biotechnol. J. 16 (12), 2042–2052. doi:10.1111/pbi.12937
Guo, Z., Chen, D., and Schnurbusch, T. (2018). Plant and Floret Growth at Distinct Developmental Stages during the Stem Elongation Phase in Wheat. Front. Plant Sci. 9, 330. doi:10.3389/fpls.2018.00330
Harris, F. A. J., Eagles, H. A., Virgona, J. M., Martin, P. J., Condon, J. R., and Angus, J. F. (2017). Effect of VRN1 and PPD1 Genes on Anthesis Date and Wheat Growth. Crop Pasture Sci. 68, 195–201. doi:10.1071/cp16420
Igrejas, G., and Branlard, G. (2020). “The Importance of Wheat,” in Wheat Quality for Improving Processing and Human Health. Editors G. Igrejas, T. M Ikeda, and Guzmán C. Cham (Springer International Publishing), 1–7. doi:10.1007/978-3-030-34163-3_1
Jamieson, P. D., Semenov, M. A., Brooking, I. R., and Francis, G. S. (1998). Sirius: a Mechanistic Model of Wheat Response to Environmental Variation. Eur. J. Agron. 8, 161–179. doi:10.1016/s1161-0301(98)00020-3
Kronenberg, L., Yates, S., Boer, M. P., Kirchgessner, N., Walter, A., and Hund, A. (2021). Temperature Response of Wheat Affects Final Height and the Timing of Stem Elongation under Field Conditions. J. Exp. Bot. 72, 700–717. doi:10.1093/jxb/eraa471
Li, P., Chen, J., Wu, P., Zhang, J., Chu, C., See, D., et al. (2011). Quantitative Trait Loci Analysis for the Effect of Rht-B1 Dwarfing Gene on Coleoptile Length and Seedling Root Length and Number of Bread Wheat. Crop Sci. 51, 2561–2568. doi:10.2135/cropsci2011.03.0116
Li, X., Wang, P., Li, J., Wei, S., Yan, Y., Yang, J., et al. (2020). Maize GOLDEN2-LIKE Genes Enhance Biomass and Grain Yields in rice by Improving Photosynthesis and Reducing Photoinhibition. Commun. Biol. 3, 151. doi:10.1038/s42003-020-0887-3
Ma, Q.-H. (2007). Characterization of a Cinnamoyl-CoA Reductase that Is Associated with Stem Development in Wheat. J. Exp. Bot. 58, 2011–2021. doi:10.1093/jxb/erm064
Mckenna, A., Hanna, M., Banks, E., Sivachenko, A., Cibulskis, K., Kernytsky, A., et al. (2010). The Genome Analysis Toolkit: A MapReduce Framework for Analyzing Next-Generation DNA Sequencing Data. Genome Res. 20, 1297–1303. doi:10.1101/gr.107524.110
Miralles, D. J., Richards, R. A., and Slafer, G. A. (2000). Duration of the Stem Elongation Period Influences the Number of fertile Florets in Wheat and Barley. Funct. Plant Biol. 27, 931–940. doi:10.1071/pp00021
Mo, Y., Vanzetti, L. S., Hale, I., Spagnolo, E. J., Guidobaldi, F., Al-Oboudi, J., et al. (2018). Identification and Characterization of Rht25, a Locus on Chromosome Arm 6AS Affecting Wheat Plant Height, Heading Time, and Spike Development. Theor. Appl. Genet. 131, 2021–2035. doi:10.1007/s00122-018-3130-6
Okada, T., Jayasinghe, J. E. A. R. M., Eckermann, P., Watson-Haigh, N. S., Warner, P., Hendrikse, Y., et al. (2019). Effects of Rht-B1 and Ppd-D1 Loci on Pollinator Traits in Wheat. Theor. Appl. Genet. 132, 1965–1979. doi:10.1007/s00122-019-03329-w
Parry, M. A. J., Reynolds, M., Salvucci, M. E., Raines, C., Andralojc, P. J., Zhu, X.-G., et al. (2010). Raising Yield Potential of Wheat. II. Increasing Photosynthetic Capacity and Efficiency. J. Exp. Bot. 62, 453–467. doi:10.1093/jxb/erq304
Peng, J., Richards, D. E., Hartley, N. M., Murphy, G. P., Devos, K. M., Flintham, J. E., et al. (1999). 'Green Revolution' Genes Encode Mutant Gibberellin Response Modulators. Nature 400, 256–261. doi:10.1038/22307
Ray, D. K., Mueller, N. D., West, P. C., and Foley, J. A. (2013). Yield Trends Are Insufficient to Double Global Crop Production by 2050. PLoS One 8, e66428. doi:10.1371/journal.pone.0066428
Reynolds, M., Foulkes, M. J., Slafer, G. A., Berry, P., Parry, M. A. J., Snape, J. W., et al. (2009). Raising Yield Potential in Wheat. J. Exp. Bot. 60, 1899–1918. doi:10.1093/jxb/erp016
Richards, D. E., King, K. E., Ait-Ali, T., and Harberd, N. P. (2001). How Gibberellin Regulates Plant Growth and Development: A Molecular Genetic Analysis of Gibberellin Signaling. Annu. Rev. Plant Physiol. Plant Mol. Biol. 52, 67–88. doi:10.1146/annurev.arplant.52.1.67
Shimizu, H., and Hisamatsu, T. (2009). Day Temperature Strongly Influences Stem Elongation Rate during Subsequent Nights in Chrysanthemum Morifolium Ramat. Eng. Agric. Environ. Food 2, 49–53. doi:10.1016/s1881-8366(09)80015-3
Singh, D., Prasanna, R., Sharma, V., Rajawat, M. V. S., Nishanth, S., and Saxena, A. K. (2020). “Prospecting Plant-Microbe Interactions for Enhancing Nutrient Availability and Grain Biofortification,” in Wheat and Barley Grain Biofortification. Editors O. P. Gupta, V. Pandey, S. Narwal, P. Sharma, S. Ram, and G P Singh (Sawston, Cambridge: Woodhead Publishing), 203–228. doi:10.1016/b978-0-12-818444-8.00008-0
Srinivasachary, Gosman. N., Gosman, N., Steed, A., Hollins, T. W., Bayles, R., Jennings, P., et al. (2008). Semi-dwarfing Rht-B1 and Rht-D1 Loci of Wheat Differ Significantly in Their Influence on Resistance to Fusarium Head Blight. Theor. Appl. Genet. 118, 695–702. doi:10.1007/s00122-008-0930-0
Steinfort, U., Trevaskis, B., Fukai, S., Bell, K. L., and Dreccer, M. F. (2017). Vernalisation and Photoperiod Sensitivity in Wheat: Impact on Canopy Development and Yield Components. Field Crops Res. 201, 108–121. doi:10.1016/j.fcr.2016.10.012
Tang, N., Jiang, Y., He, B.-r., and Hu, Y.-g. (2009). The Effects of Dwarfing Genes (Rht-B1b, Rht-D1b, and Rht8) with Different Sensitivity to GA3 on the Coleoptile Length and Plant Height of Wheat. Agric. Sci. China 8, 1028–1038. doi:10.1016/s1671-2927(08)60310-7
Ugarte, C. C., Trupkin, S. A., Ghiglione, H., Slafer, G., and Casal, J. J. (2010). Low Red/far-Red Ratios Delay Spike and Stem Growth in Wheat. J. Exp. Bot. 61, 3151–3162. doi:10.1093/jxb/erq140
Umate, P. (2011). Oxysterol Binding Proteins (OSBPs) and Their Encoding Genes in Arabidopsis and rice. Steroids 76, 524–529. doi:10.1016/j.steroids.2011.01.007
Van De Velde, K., Thomas, S. G., Heyse, F., Kaspar, R., Van Der Straeten, D., and Rohde, A. (2021). N-terminal Truncated RHT-1 Proteins Generated by Translational Reinitiation Cause Semi-dwarfing of Wheat Green Revolution Alleles. Mol. Plant 14, 679–687. doi:10.1016/j.molp.2021.01.002
Whitechurch, E. M., Slafer, G. A., and Miralles, D. J. (2007). Variability in the Duration of Stem Elongation in Wheat Genotypes and Sensitivity to Photoperiod and Vernalization. J. Agron. Crop Sci. 193, 131–137. doi:10.1111/j.1439-037x.2007.00259.x
Wu, K., Xu, H., Gao, X., and Fu, X. (2021). New Insights into Gibberellin Signaling in Regulating Plant Growth-Metabolic Coordination. Curr. Opin. Plant Biol. 63, 102074. doi:10.1016/j.pbi.2021.102074
Xiao, J., Yin, X., Ren, J., Zhang, M., Tang, L., and Zheng, Y. (2018). Complementation Drives Higher Growth Rate and Yield of Wheat and Saves Nitrogen Fertilizer in Wheat and Faba Bean Intercropping. Field Crops Res. 221, 119–129. doi:10.1016/j.fcr.2017.12.009
Xu, D., Xie, Y., Guo, H., Zeng, W., Xiong, H., Zhao, L., et al. (2021). Transcriptome Analysis Reveals a Potential Role of Benzoxazinoid in Regulating Stem Elongation in the Wheat Mutant Qd. Front. Genet. 12, 623861. doi:10.3389/fgene.2021.623861
Yu, M., Liu, Z.-H., Yang, B., Chen, H., Zhang, H., and Hou, D.-B. (2020). The Contribution of Photosynthesis Traits and Plant Height Components to Plant Height in Wheat at the Individual Quantitative Trait Locus Level. Sci. Rep. 10, 12261. doi:10.1038/s41598-020-69138-0
Zanke, C. D., Ling, J., Plieske, J., Kollers, S., Ebmeyer, E., Korzun, V., et al. (2014). Whole Genome Association Mapping of Plant Height in winter Wheat (Triticum aestivum L.). PLoS One 9, e113287. doi:10.1371/journal.pone.0113287
Zhang, N., Xie, Y.-D., Guo, H.-J., Zhao, L.-S., Xiong, H.-C., Gu, J.-Y., et al. (2016). Gibberellins Regulate the Stem Elongation Rate without Affecting the Mature Plant Height of a Quick Development Mutant of winter Wheat ( Triticum aestivum L.). Plant Physiol. Biochem. 107, 228–236. doi:10.1016/j.plaphy.2016.06.008
Keywords: stem elongation, qd1 gene, fine mapping, molecular markers, wheat
Citation: Xie Y, Zeng W, Wang C, Xu D, Guo H, Xiong H, Fang H, Zhao L, Gu J, Zhao S, Ding Y and Liu L (2021) Fine Mapping of qd1, a Dominant Gene that Regulates Stem Elongation in Bread Wheat. Front. Genet. 12:793572. doi: 10.3389/fgene.2021.793572
Received: 12 October 2021; Accepted: 12 November 2021;
Published: 29 November 2021.
Edited by:
Nidhi Rawat, University of Maryland, United StatesReviewed by:
Erena Aka Edae, University of Minnesota Twin Cities, United StatesSaket Chandra, North Carolina State University, United States
Copyright © 2021 Xie, Zeng, Wang, Xu, Guo, Xiong, Fang, Zhao, Gu, Zhao, Ding and Liu. This is an open-access article distributed under the terms of the Creative Commons Attribution License (CC BY). The use, distribution or reproduction in other forums is permitted, provided the original author(s) and the copyright owner(s) are credited and that the original publication in this journal is cited, in accordance with accepted academic practice. No use, distribution or reproduction is permitted which does not comply with these terms.
*Correspondence: Luxiang Liu, bGl1bHV4aWFuZ0BjYWFzLmNu
†These authors have contributed equally to this work.