 Mohd Awas1
 Imtiaz Ahmed1*
 Syed Mudasir Ahmad2*
 Khalid Mashay Al-Anazi3
 Mohammad Abul Farah3Basharat Bhat2
- 1Fish Nutrition Laboratory, Department of Zoology, University of Kashmir, Srinagar, India
- 2Division of Animal Biotechnology, Faculty of Veterinary Sciences and Animal Husbandry, Sher-e-Kashmir University of Agricultural Sciences and Technology, Srinagar, India
- 3Department of Zoology, College of Science, King Saud University, Riyadh, Saudi Arabia
Traditionally, species of fish are identified based on morphological characteristics. Although these taxonomic descriptions are essential, there are cases where the morphological characters distinguishing these species show marginal differences. For instance, in the Poonch River in the Himalayas, there are 21 species, out of which some are morphologically similar, and the taxonomic distinction between these species is unclear. Therefore, in this study, we used sequences from two mitochondrial genes, Cytochrome b (Cyt b) and a larger ribosomal subunit (16S rRNA), as well as the morphological analysis to address any taxonomic ambiguities among the six fish species. Maximum Likelihood results revealed that all the species were clustered according to their families and genera. The phenotypic analysis also supported this statement, as all the species of different genera like Schizothorax, Tor, Garra, Traqilabeo, and Glyptothorax are grouped in their particular cluster, it shows that species of a separate class share a mutual morphological characteristic. While genetic analyses of these species suggest nucleotide diversity (p) and haplotype diversity, with Hd values as 0.644 for Cyt b and 0.899 for 16S rRNA, confirming the rich genetic diversity in the river. Overall, we recommend that the integrative approach in delimiting the fish species is more effective than the individual one and can be used to rapidly diagnose a species and understand the evolutionary relationship between the species.
Introduction
Over the last few decades, fish consumption has gradually become an important source of protein (FAO, 2000). The importance of fish as a source of human nutrition cannot be overstated because it contains high-quality protein, minerals and lipids high in omega-3 unsaturated fatty acids (Bavinck and Johnson, 2008), thus considered one of the most valuable components of the human diet. Besides, fisheries are important sources of revenue for many communities (Rafique and Khan, 2012; Ghouri et al., 2020). Over 33,000 species of fish are known, which inhabit nearly all major aquatic habitat types and contribute a wide range of environmental functions (Martinez et al., 2018). Around 2,500 fish species harbour Indian water and 930 are freshwater fish species (Jayaram, 2010). In India, 788 fish species come under freshwater fishes (Gopi, 2014). At the same time, the Himalayan region contributes about 17% of fish documented from the mountain ecosystem (Ghosh, 1997). In the present study, we have focused on the Poonch River of the north-west Himalayas, which originates from the foothill of Pir-panjal (Ahmed et al., 2019; Awas et al., 2020). This region is known for harboring diverse aquatic fauna, including 21 fish species, out of which six are considered economically important species (Hussain and Dutta, 2016).
Dutta (2003) reported 40 fish species from the Poonch River, including several species having sub-species under the same genus as Schizothorax, Tor, Garra, Crossocheilus, and Glyptothorax, etc. Such a considerable variation between these statements might be due to species ambiguity. Moreover, several findings suggest a vide ambiguity in Schizothorax and Tor genus (He and Chen, 2006; Yang et al., 2012; Ahmad et al., 2014; Dwivedi et al., 2020; Jaafar et al., 2021). However, in the region, these species under two genera are mainly considered as Schizothorax richardsonii (Luss) and Tor putitora (Chidak) due to their similarities in morphological traits. While Hussain and Dutta (2016) reported only S. richardsonii and T. Putitora belongs to the two genera from the Poonch River. Similarly, Garra gotyla, Garra lamta, Tariqilabeo latius and Tariqilabeo diplocheius have been reported by Dutta (2003) under four different species of two genera. But, due to the similarities in external morphological characteristics, there is a huge ambiguity among these species also, as Hussain and Dutta (2016) reported three species of two genera from this region.
To avoid mislabeling in fish markets, fish must be identified authentically and reliably. Morphological and morphometric characterization of fish species is one of the most often used strategies for fish authenticity (Bottero and Dalmasso, 2011). But limitations of classical taxonomy led to ambiguous categorization of fishes in the event of very close similarities between species and ultimately give an inaccurate picture of the ichthyofaunal diversity of the area (Gonzalez et al., 2013; Xu et al., 2018). Nowadays specific molecular techniques have been employed to overcome the constraints of morphological-based identification systems in fish (Hebert et al., 2003; Griffiths et al., 2013; Keskin and Atar, 2013; Zhuang et al., 2013; Knebelsberger et al., 2014; Diaz et al., 2016; Shen et al., 2016; Ghouri et al., 2020).
For fish identification, many DNA biomarkers have also been used. DNA barcoding has widely been used in different sectors, including fish authentication, labeling, biodiversity, conservation and biological studies (Pollack et al., 2018). The Cytochrome b (Cyt b) gene, which has ubiquitous uses in taxonomic and ecological domains, is one of the most well-known and targeted DNA markers. It is often used to study the phylogenetic relationships among organisms due to its small size and high nucleotide substitution rate (Xiao et al., 2001; Kumar et al., 2011; Ahmad et al., 2014; Cornetti et al., 2019). In addition, 16S ribosomal RNA has gained popularity due to its extremely high degree of conservation and relatively slow evolution rate (Hebert et al., 2003; Chen et al., 2018). Several past studies have shown that the 16S rRNA gene sequence is also helpful for species identification (Kochzius et al., 2010; Jaafar et al., 2021).
Most fish species inhabiting the Poonch River belong to the family Cyprinidae, represented by a group of species with highly similar external morphological characters. The survival of Glyptothorax kashmirensis (Kashmiri catfish) and T. Putitora (Mahaseer) exclusively depends on this water source. However, in 2010 Poonch River gained much more attention and was designated as a national park (Brown et al., 2019), but the lack of study based on the fish fauna is still marginal. Therefore, the fish species that have been recorded in the Poonch River; six have not been clearly classified by previous studies based on the analysis of morphological characters. To identify and classify these species unambiguously, we conducted this study using an integrative approach based on analyzing several morphological parameters and molecular research with Cyt b and 16S rRNA as genetic markers. The morphometric parameters used during the study were according to Froese and Pauly (2007). The different methods like PCA, CVA, RDA, etc. were used to get a more robust result; moreover, Jayaram (2010) standard keys were used for species determination. Besides, we also determine the efficacy of the selected genes in identifying the freshwater fish fauna. This study could be useful in examining DNA sequences, which might serve as a primary reference for future region studies.
Materials and methods
Fish sample collection
In the present study, 478 specimens were sampled from 2018 to 2020 from six different sites in Poonch River with the help of native professional fishermen by using different fishing gears like cast net, gillnet and hooks, while the details about the number of samples collected, sampling sites and geo-graphical coordinates of locations for fish species investigated in the current study is provided in Table 1 and Figure 1, and the representative images of each species has shown in Supplementary Figure S1. All these specimens belonging to six species were carried out in an ice box at the Wet Laboratory, Department of Zoology, the University of Kashmir, for further study.
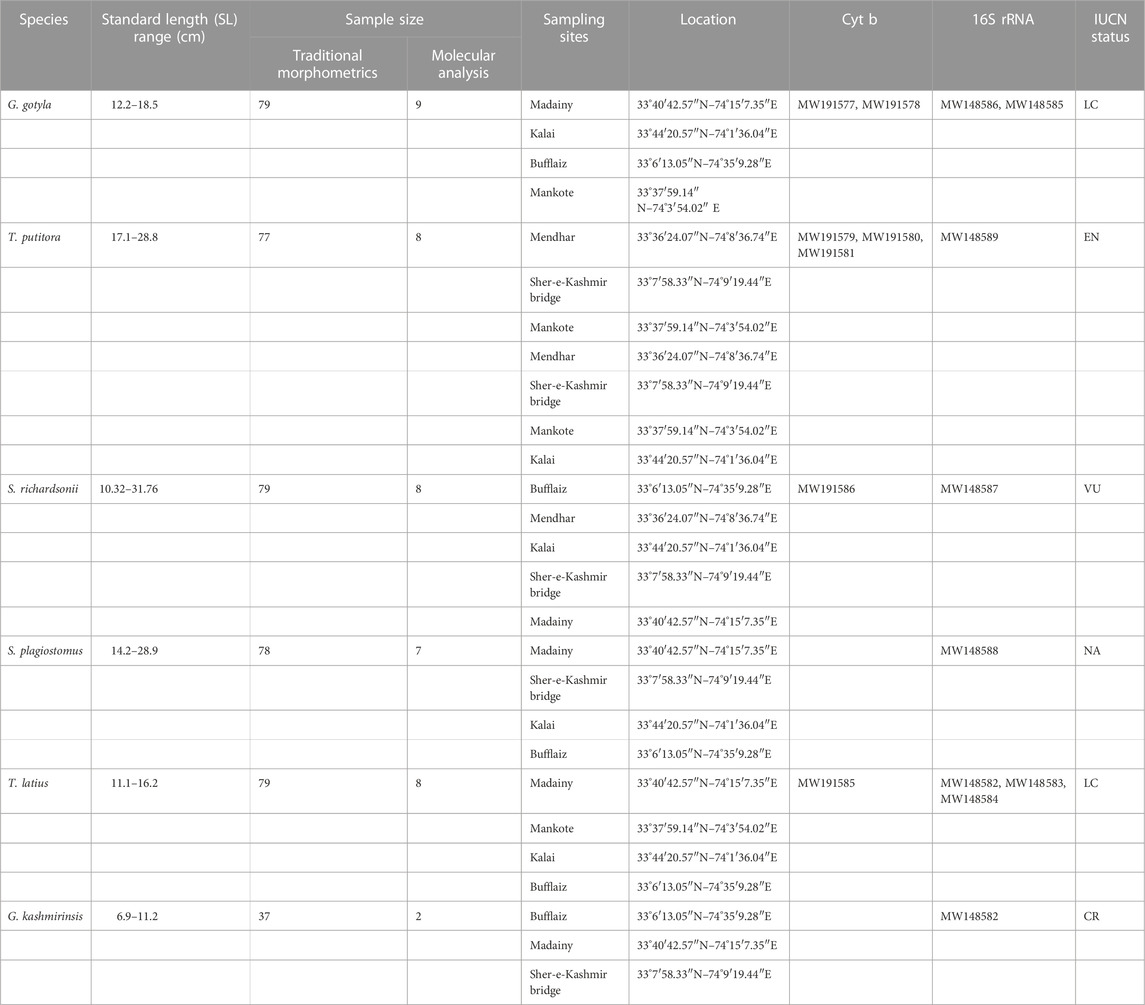
TABLE 1. Sampling sites, their locations with latitude and longitude, sample size and size range of six fish species used in the present study with GenBank accession number.
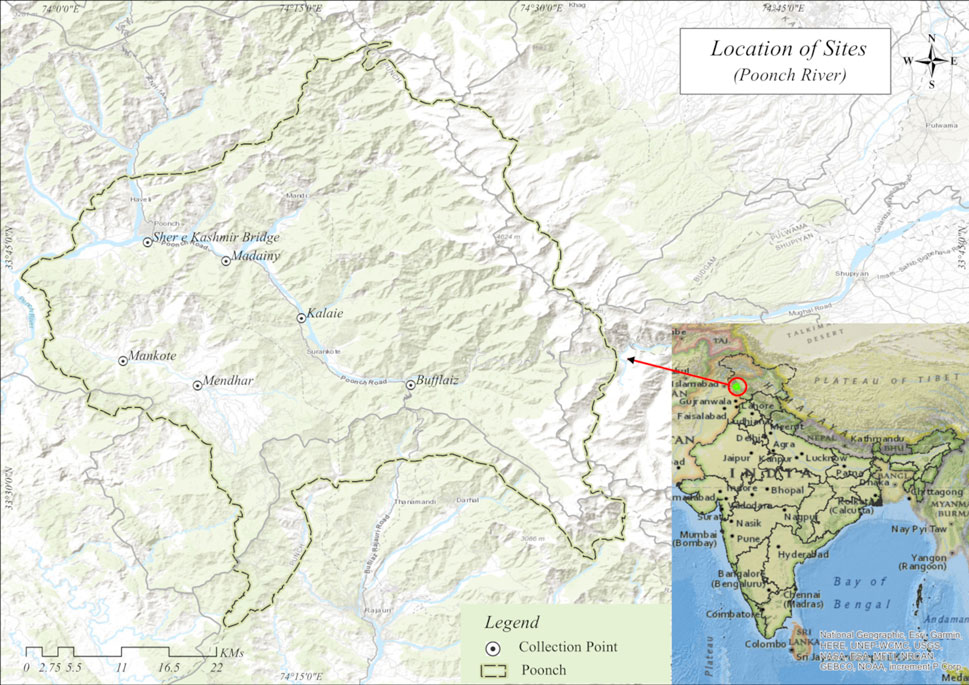
FIGURE 1. Map showing six sampling sites of River Pooch of north-west Himalaya India: Site A, Bufflaiz, B, Madainy, C, Kalai, D, Sher e Kashmir, E, Mendhar, F, Mankote.
Identification
The collected fish species were first identified using standard taxonomic keys and related books (Talwar and Jhingran, 1991; Vishwanath et al., 2007; Jayaram, 2010). After proper identification, representative specimens were preserved in 10% formalin in the Fish Nutrition Research Laboratory, Department of Zoology, University of Kashmir Srinagar, India, for museum records.
Morphometric and meristic controlling elements
Different morphometric and meristic controlling elements were also taken across the fish body by following different methods reported in the past (Menon, 1964; Gonzales and Sartori, 2002; Mina et al., 2005; Froese and Pauly, 2007). The measurements were recorded using a 0.01 cm digital vernier caliper from left to right. Overall, 25 phenotypic characters were analyzed. Counts and measurements were taken as far as possible on the left side of fish specimens following standard methods for cyprinid taxonomy (Pethiyagoda, and Kottelat, 1995) with some additional modifications. The morphometric characters measured during the present study (Supplementary Figure S2) included total length (TL), standard length (SL), forked length (FL), pre-pectoral length (PpL), pre-pelvic length (ppL), pre-dorsal length (PDL), pre-anal length (PAL), pectoral fin length (PFL), pectoral fin height (PFH), pelvic fin length (pFL), pelvic fin height (pFH), dorsal fin length (DFL), dorsal fin height (DFH), anal fin length (AFL), anal fin height (AFH), caudal fin length (CFL), caudal fin height (CFH), head length (HL), snout length (SL), eye diameter (E-dia), pre-orbital length (PorbL), minimum body depth (MinBD), maximum body depth (MaxBD). While meristic characters were studied, including dorsal fin rays (DFR), pectoral fin rays (PFR), pelvic fin rays (pFR), anal fin rays (AFR), and caudal fin rays (CFR). Meristic characters were counted twice by the same observer. In the current study, it was hypothesized that a working relationship exists between various growth-related morphometric parameters. The correlation coefficient “r” was determined among all the characteristics.
Traditional morphometric analysis
Each of the fourteen morphometric characters was divided by standard length and the remaining six characters were divided by head length in order to eliminate the size effect (correlation < .5 for all variables). All the morphometric values were log-transformed before analysis in R software (R Development Core Team, 2020). The regression analysis and the resulting figures were plotted by using “psych” (Wickham, 2016; Revelle, 2020).
Statistical analysis
All statistical analyses were carried out using R Statistical Software (R Development Core Team, 2020) to perform all morphometric variation analyses among different fish species. We calculated the descriptive statistics for each morphometric parameter, particularly mean standard deviation, using the “dplyr” package (Wickham, et al., 2022). Prior to conducting statistical analysis, we used the Sharpio–Wilk normality test to investigate the normality assumption of the dataset. In order to determine if there were significant differences in morphometric characters, a univariate analysis of variance (ANOVA) was performed. In order to decrease the amount of sample redundancy, a principal component analysis (PCA) was conducted (Johnson and Wichern 1998). Before conducting PCA, the morphometric measurements were subjected to scaling (i.e., standardization) to make the analysis comparable. Moreover, we also evaluated the correlation of studied phenotypic characters with principal components analysis. In general, the variables which are correlated with PC1 or dimension (Dim, 1) and PC2 or Dim, 2 are considered as crucial in order to explain the existing variability among the data set (Kassambara, 2017). The PCA analysis and the resulting figures were obtained using “FactoMinerR” (Le et al., 2008) and “factoextra” (Kassambra and Mundt, 2020) packages. In addition to PCA, multiple variables were constructed and further analytical procedures, such as canonical variate analysis (CVA) and redundancy analysis (RDA), were conducted (Mardia et al., 1979; Ter Braak and Verdonschot, 1995). Moreover, the sample size was taken based on previous work on PCA and CVA (Kocovsky et al., 2009). The contributions of the variable to PCA were investigated to decide which character contributes more to differentiate the species. For this purpose, the Kaiser–Meyer–Olkin value (0–1) was used to check the suitability for PCA (Kaiser, 1974). Various multivariate analyses, such as PCA, CVA, RDA, and correlations, were performed in R. 4.0.2. However, the dendrogram was constructed to address the dissimilarity between species and the number of clusters in the data set (Charrad et al., 2014).
In order to avoid the effect of sample size, the data were M-transformed by employing the formula given below (Poulet et al., 2005).
where M−trans is the transformed measurement, M is the original measurement, b is the within-group slope regression of the log standard length, SL is the standard length of the fish species. To assess the effectiveness of size adjustment transformations, the relevance of the relationship between transformed variables and standard length was taken into consideration. The correlation analysis between the modified variables and the fish’s standard length was determined to evaluate whether the transformed data successfully removed the size effect or not (Khan et al., 2012).
Molecular analysis
For molecular analysis, all six species having morphological ambiguities were used to study the diversity and phylogenetic relationship. For barcoding purposes, 2–3 specimens of representative species were preserved in 95% alcohol (Roul et al., 2021; Tsoupas et al., 2022), as the G. kashmirensis is one of the protected species; therefore, a small part of the fin was preserved for DNA analysis before releasing the surviving fish back into the water. For further analysis, the samples were transferred to the Genomics Laboratory at Sher-e-Kashmir University of Agricultural Science and Technology, Jammu and Kashmir, India.
DNA extraction and PCR amplification
Using a sterile razor blade, we extracted DNA from a portion of muscle tissue from the caudal peduncle. The muscle sample was placed in Eppendorf tubes, rinsed with 1 ml phosphate-buffered saline (PBS) in order to remove all contamination, and then the sample was frozen. After discarding (PBS), total genomic DNA was extracted using DNeasy Blood and Tissue Kit (QIAGEN 69504) by following the instruction given by the company. After that, the product was quantified with the help of NanoDrop (Thermo Scientific, Wilmington, NC, United States). Extracted genomic DNA was amplified for the above two genes using universal primers. The primers against 16S rRNA forward (5′ GCC TGT TTA ACA AAA ACA T 3′) and reverse (5′ CCG GTC TGA ACT CAG ATC ATG T3′) (Simon et al., 1991) and Cyt b forward (5′ GTT TGA TCC CGT TTC CTG TA 3′) and reverse (5′ AAT GAC TTG AAG AAC CACCGT 3′) were used for amplification (Briolay et al., 1998). Afterwards, a PCR reaction mixture was performed as per the protocol mentioned in the kit. The following steps were taken for PCR reaction. Initial denaturation for 3 min at 95°C, followed by 34 cycles of 95°C for 30 s (16S) after annealing at 48°C and 50°C for (Cyt b), while extension temperature of 72°C for 1 min and final extension of 72°C for 3 min. PCR products were visualized on 1% agarose gel. Finally, the product was purified using a PCR purification kit (Invitrogen, United States) using the company’s protocol. Biospectrometer measured the purified PCR products (Thermo Scientific, United States).
DNA sequencing and data analysis
PCR amplified products were sequenced at genomic Xcelris Labs Limited Ist Floor, Sydney House, Old Premchand Nagar Road, Opp. Satyagrah Chhavani, Bodakdev, Ahmedabad—380015 Gujarat, India. The specific primers successfully amplified the Cyt b and 16S rRNA genes of the approximate size of 543 and 519 bp, respectively. The data was aligned with the help of MUSCLE v3.5 (Edgar, 2004) and the ClustalW algorithm (50), whereas the bio-editing tool was done using MacClade v4.06 (Maddison and Maddison, 2003). All the ambivalent bases were removed with the help of ABI chromatograms and the rest of the sequences were submitted to GenBank to get accession numbers. The phylogenetic trees were constructed with the help of PhyML algorithm software using the Maximum likelihood method (Felsenstein, 1981), with jModelTest (Posada, 2008; Darriba et al., 2012) and applied the bootstrap technique set to 100 replicates for testing the trees (Guindon et al., 2009). Barbus barbus was used as the out-group. Automatic Barcode Gap Discovery (ABGD) clustering was carried out using Kimura evolutionary model available at (https://bioinfo.mnhn.fr/abi/public/abgd/abgdweb.html) by applying the following parameter: Pmin = .001, Pmax = .1; steps 20; Nb bins = 20; X (gap width) = .75 and Nb bins (for distance distribution) = 20 (Puillandre et al., 2012). By using pairwise distances from the sequence and the prior intra-specific divergence, ABGD analysis detects the gap between intra and interspecific divergence.
The DNA Sequence Polymorphism 6.12.03 software was used to measure nucleotide diversity (p) and haplotype diversity (Hd) in order to analyze genetic diversity in the population of six different locations from Poonch River in a single data set that may help to predict genetic diversity within the population of six endemic fish species found in the region. The first dataset included four species belonging to the family Cyprinidae for the analysis of Cyt b, and five species belonging to two families were examined through 16S rRNA in the second subset. While in the third subset, combined studies were performed for both the genes for all the individuals.
Results
Phenotypic analysis/identification
The current study successfully identified six endemic freshwater fish species from the Poonch River of the Northwest Himalayan range of J&K (India), i.e., S. richardsonii, Schizothorax plagiostomus, T. putitora, G. gotyla, T. latius and G. kashmirensis. The species belong to two families and two orders. As per the International Union for Conservation of Nature (IUCN), 2018 status, out of six identified species, G. kashmirensis is critically endangered (CR), T. putitora endangered (EN), S. richardsonii enlisted as vulnerable (VU), S. plagiostomus not evaluated (NA), while G. gotyla and T. latius are listed as least concerned (LC), the same is presented in Tables 1, 2. Multivariate and cluster analyses like ANOVA, PCA, CVA, RDA, dendrogram, and molecular approaches like ABGD, BI, and Phylogenetic Trees were employed to get a robust result. ANOVA demonstrates a significant (F = 20.90, p < .05) difference in phenotypic measurements and relations in the present study. It is found that by performing the principal component analysis (PCA), 28 principal components were extracted, of which the first two (PC1 and PC2) differentiated 62.4% of the entire variation in terms of variance (52.9 for PC1, and 9.5% for PC2). In terms of influence variables on PC1 the PCA components with the highest loadings are (Total length (TL), Standard length (SL), Forked length (FL), Pre-pectoral length (PPL), Pre-pelvic length (PpL), Pre-dorsal length (PDL), Pre-Anal length (PAL), Pectoral fin height (PFH), pelvic fin height (pFH), Dorsal fin length (DFL), Dorsal fin height (DFH), Anal fin length (AFL), Anal fin height (AFH), Caudal fin length (CFL), Caudal fin height (CFH), Eye diameter (EDia), Head length (HdL), Maximum body depth (MaxbD), Minimum body depth (MinbD). Correspondingly, in PC2, the most crucial loading was Pectoral Fin length (PFL), Pelvic Fin length (pFL), Snout Length (SntL), Pre-Orbital length (PorbL), Dorsal Fin rays (DFR), Anal Fin rays (AFR) and Caudal Fin rays (CFR). The Biplot revealed that all stocks were mixed and overlapped, as shown in Figures 2A, B. According to the PCA plot of PC1 and PC2 (Figure 2B), there is a high overlap between two species of Schizothorax genera. However, morphological variation occurred even in T. putitora collected during different season. Species such as G. kashmirensis maintained clear differentiation from others. On the whole, PCA separated fish species based on the variation in their outline, regardless of their size, with high overlaps among strictly associated species. As a result of high levels of overlap between groups, further verification was essential through CVA to obtain shape variations. There were 28 canonical variates that accounted for all variances. In the analysis of variance, the first two canonical variables (CV1 and CV2) differentiated 73.68% of the total difference. The importance of CV1 was 45.09% and the importance of CV2 was 28.59%. CVs from two closely related species with overlapping body shapes were observed in the first two CVs (Figures 3A, B). In CVA plots, T. putitora collected from different season and Schizothorax genera overlapped highly, indicating a high degree of similarity in their shapes and phenotypic characteristics. However, the G. kashmirinsis species was placed distinctly from other species groups as this fish belongs to different families. Similar results were obtained through RDA, in which five species were separated at RDA1 and one species (G. kashmirinsis) were differentiated at RDA2, as shown in Figure 4A. Moreover, the phenotypic results were conformed through a dendrogram in which all six species were separated successfully shown in Figure 4B.
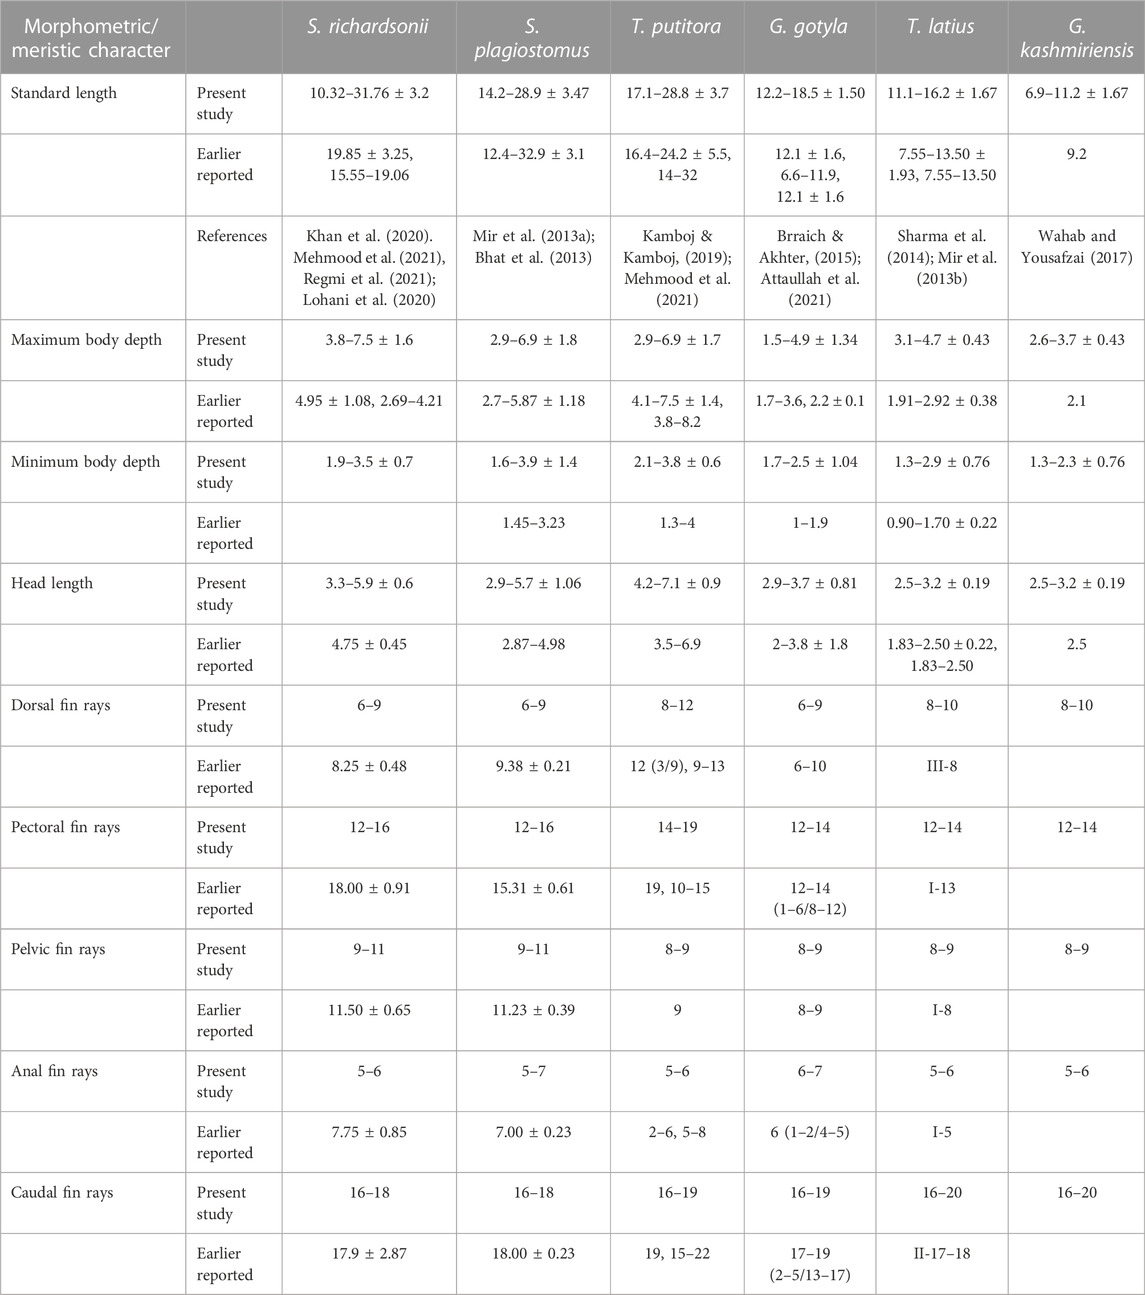
TABLE 2. Comparative analysis of some important phenotypic characters of six fish species habiting River Poonch with already published data.
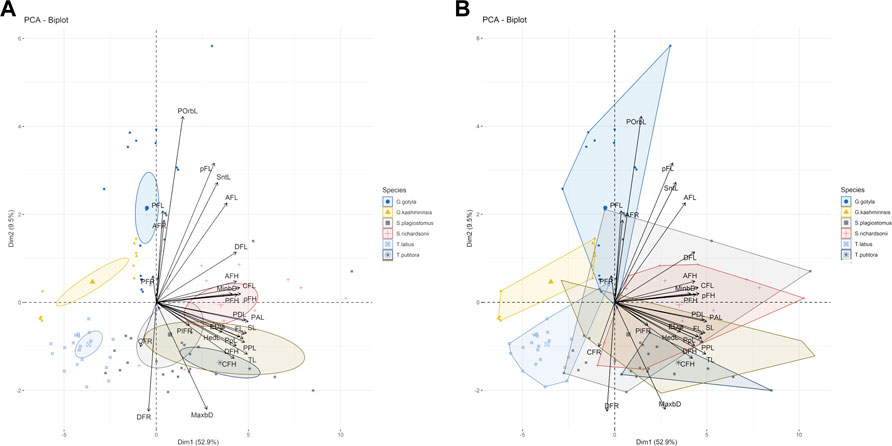
FIGURE 2. (A,B) Bi-Plot the variables and species oriented along the first two principal components with species. The Dim 1 and Dim 2 are the first and second principal extracted in PCA and notation in graph refers to the morphometric variables.
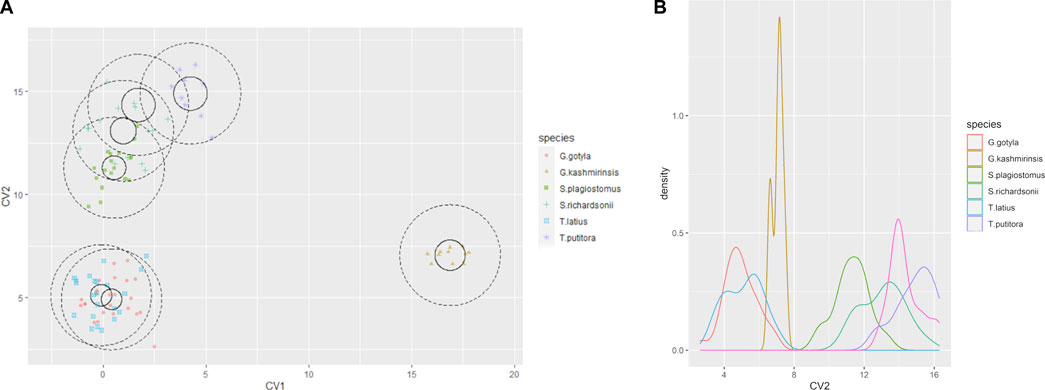
FIGURE 3. (A) The Canonical Variate (CVA) showing the morpho-genetic variation of six fish species collected from River Poonch (B) biplot of same centroids of the canonical variate score are shown on the 25 morphometric distances.
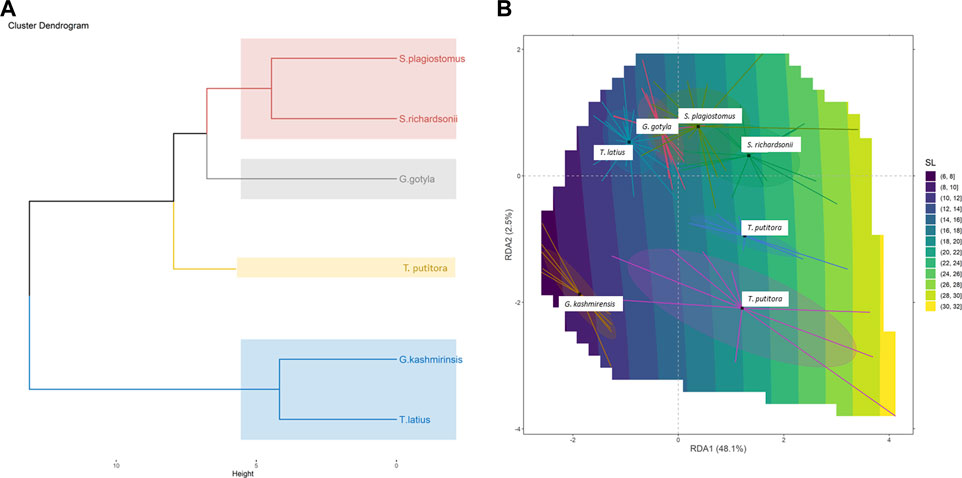
FIGURE 4. (A) Redundancy analysis (RDA) Biplot showing taxonomic division among six fish species collected from River Poonch. (B) Cluster dendrogram derived from morphometric analysis.
The correlation plot in Figures 5A, B and Supplementary Tables S2, S4–S6 depicted that all phenotypic characters varied uniformly in total length and provided significant and strong positive correlations. The result revealed Head length (HdL), Anal fin length (AFL), Total length (TL), Standard Length (SL), Forked length (FL), Pre-pectoral length (PPL), Pre-pelvic length (PpL), Pre-Dorsal length (PDL), Pre-Anal length (PAL) and Caudal Fin length (CFL) are the most important character that plays a key role in the identification of these fish species in which the value if p is < .001. The highest correlation for T. putitora with reverence to total length (Supplementary Tables S1, S3) was observed for forked length (r = .99), pre-anal length (r = .99), standard length (r = .98), pre-pelvic length (r = .98), whereas lowermost was recorded for pelvic fin length (r = 52) and caudal fin height (r = .55). In the case of head length for T. putitora, pre-orbital length (r = .77) showed the lowest correlation for head length and the eye diameter (r = .52).

FIGURE 5. (A) The correlation plot among the morphometric parameter among six fish species collected from River Poonch. The value given around all the axes are the range of each species parameter s measured unit values (cm). Correlation coefficients (r) are indicated with numeric values, with significant levels (p) are denoted by asterisks (* < .05, ** < .01, *** < .001) and (B) presenting same in diagrammatic value.
Moreover, the present study depicts the pelvic fin length as a diagnostic feature to differentiate S. richardsonii from S. plagiostomus. However, the highest correlation in overall size was observed for standard length (r = .98), forked length (r = .98), pre-pelvic fin length (r = .96), while the lowest correlation with maximum body depth (r = .58), pectoral fin length (r = 59). While about head length, the maximum was eye diameter (r = .67) and minimum pre-orbital length (r = .49) for S. richardsonii. The result obtained for S. plagiostomus as maximum correlation concerning total length with standard length (r = .99), forked size (r = .99) pre-pectoral size (r = .94), while the least was seen in the case of caudal fin length (r = .57), and maximum body depth (r = .66). The highest correlation was observed in head length for pre-orbital length (r = .52), and the lowest was eye diameter (r = .44), as shown in Supplementary Tables S2, S3, S9.
Molecular analysis
Integrative methods successfully identified all the unpublished Cyt b and 16S rRNA sequences from six fish species as it was determined that there was no mismatch between the traditional and advanced techniques used for identifications. The current procedure, morphological and molecular identification, showed a high level of resemblance (97–100%). We obtained mitochondrial barcodes (543 and 519 bp) of Cyt b and 16S rRNA, respectively, for six fish species belonging to two families, two orders and five genera collected from six locations in the River Poonch (Figure 1). The amplified sequences did not contain any stop codons, insertions or deletion indicating that all of the segments represent functional mitochondrial sequences. All the fish species except one multiple specimen (minimum of three specimens per species) from different sampling sites were analyzed to document intraspecific divergence. Only one species, i.e., G. kashmirensis, were represented by single specimens (Table 1). As specimens were attested to species level based on phylogenetic trees, all morphological identifications improved with molecular identification since the specimens were attributed to species. However, Primers against Cyt b used in the present study yield an average nucleotide length of 543 bp, out of which 409 sites were constant, 50 showed singleton variables, 84 were parsimony informative sites and 134 were polymorphic. While in the case of 16S, rRNA 519 bp was obtained. Out of these, 399 sites were constant, 42 were singleton variable sites, 84 were parsimony informative sites, and 95 were polymorphic respectively. All these sequences were submitted to GenBank and got accession numbers presented in Table 1. Average nucleotide frequencies were A = 28.56%, T/U = 29.75%, C = 26.35% and G = 15.34% for Cyt b, while in case of 16S rRNA these were A = 32.39%, T/U = 21.22%, C = 24.51% and G = 21.88%, respectively.
As we expect, in a hierarchy rise in average genetic variant from within species (mean = 014%, standard error [SE] = .000, to within families (mean = .20%, SE = .001) was observed in the K2P model. As a whole, the genomic discrepancy among the same genus was roughly two times more than between the individuals of the same species. It was also noticed that the genetic distances between the lowest to highest taxonomic levels increased as the taxonomic levels increased as DNA sequence analysis of five fish species revealed that the intra-species genetic distance varied from .00 to .14. In contrast, the interspecies genetic distance ranged from .16 to .20. The maximum distance between T. putitora and G. gotyla, while minimum distances were observed between T. putitora and T. latius. However, in the case of 16S, the pairwise genetic distance for 16S rRNA sequencing depicted that the intraspecies genetic distance varied from .0 to .6. Similarly, the inter-species genetic distance was also noted from .08 to .16. The analysis also depicted that the maximum distance was observed for G. kashmirensis and T. putitora, while the minimum was for S. plagiostomus and S. richardsonii (Supplementary Tables S7, S8).
The BIN analysis led to the recognition of 7 OTUs. All the BIN clusters were found to be taxonomically concordant with the other barcode that was BOLD assigned to the same species name. The count of OTUs produced by ABGD varied from 3 to 7 (Figure 6). The ABGD analysis conducted with K80 Kimura distance with Nb bins (for distance distribution) of 20 and gap widths (X) of .75 produced initial partitions with OUT count of 5 with Barcode gap distance = .069 for Cyt b (p = .021544–.012915), 3 in case of 16S rRNA (p = .021544–.012915) and 7 for combined CYT b +16S rRNA (p = .035938–.021544) respectively, whereas the use of P distance returned 5 (p = .021544–.012915), 3 (p = .021544–.012915) with Barcode gap distance = .493 and 7 (p = .035938–.021544) OTUs with a barcoding gap of .024. A comparison between the Bayesian inference and maximum-likelihood gene tree did not reveal the obvious difference in the positioning of OTUs. The two methods yielded congruent results with slight variation shown in Figure 6.
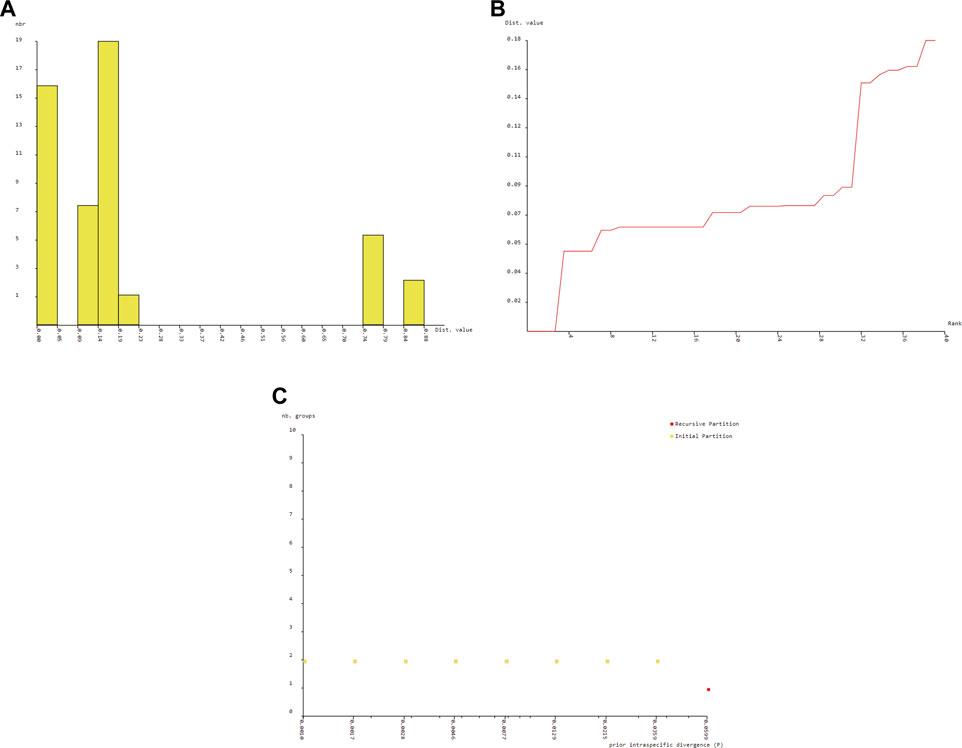
FIGURE 6. Barcode gap analysis of Pangasiid species generated by Automatic Barcode Discovery Gap Discovery (Puillandre et al., 2012). Distributions of K2P distances and between each pair of specimens (A) histogram of distance (B) ranked distance and (C) number of PSHs obtained for each prior intraspecific divergence.
Phylogenetic study
The ML and BI trees which were built based on the Cyt b and 16S rRNA dataset, placed the reference species grouped in close contact with the species identified by NCBI website, that proves the correctness of our morphological identification (Figures 7, 8). The ML and BI trees grouped sequences of the same taxonomically identified species indicated no overlapping clusters. The topology of ML and BI trees is almost identical. The topologies of Cyt b and 16S were slightly different; however, a better result was obtained through a combined approach and therefore, we describe it in detail (Figures 9–11). The result indicated that all six fish species were well differentiated according to their respective position. The tree topology for combined analysis (Figure 11) formed six monophyletic clad representing six species. According to their classification, G. kashmirensis form a separate clade, while other species form a clade and sub clade. The genus Schizothorax is placed within the same clade next to the T. putitora. While in the case of Tor, these are placed under the sister clade immediately next to the Schizothorax species.
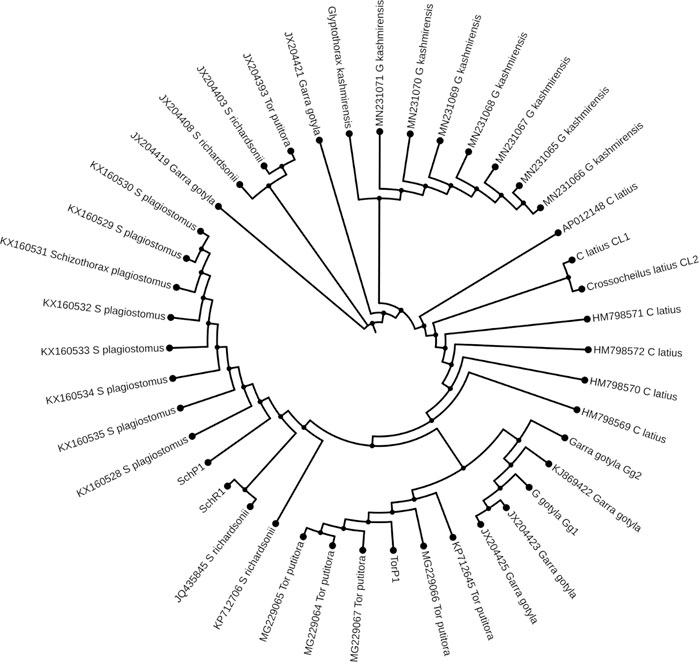
FIGURE 7. Maximum likelihood tree showing relationship of six fish species of River Poonch based on 16S rRNA data. The maximum likelihood tree was generated using GTR+G model.
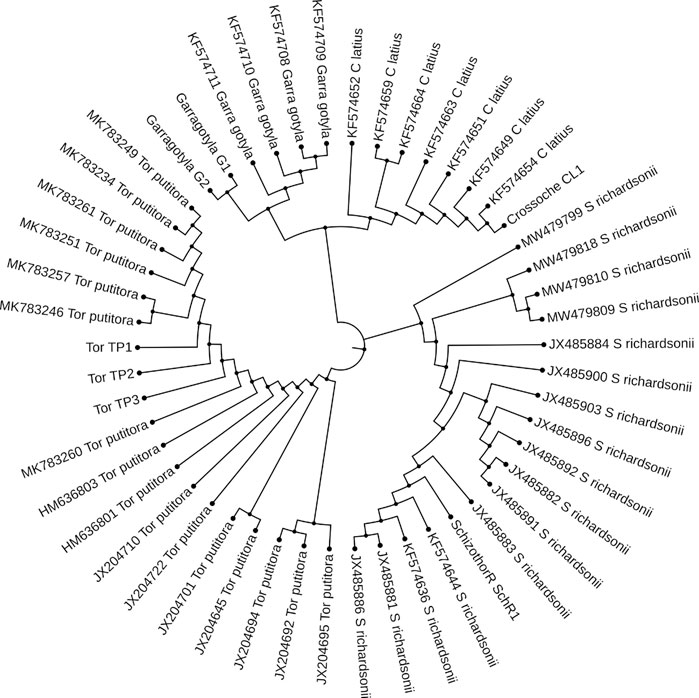
FIGURE 8. Maximum likelihood tree showing relationship of five fish species of River Poonch based on Cyt b data. The maximum likelihood tree was generated using GTR_G model.
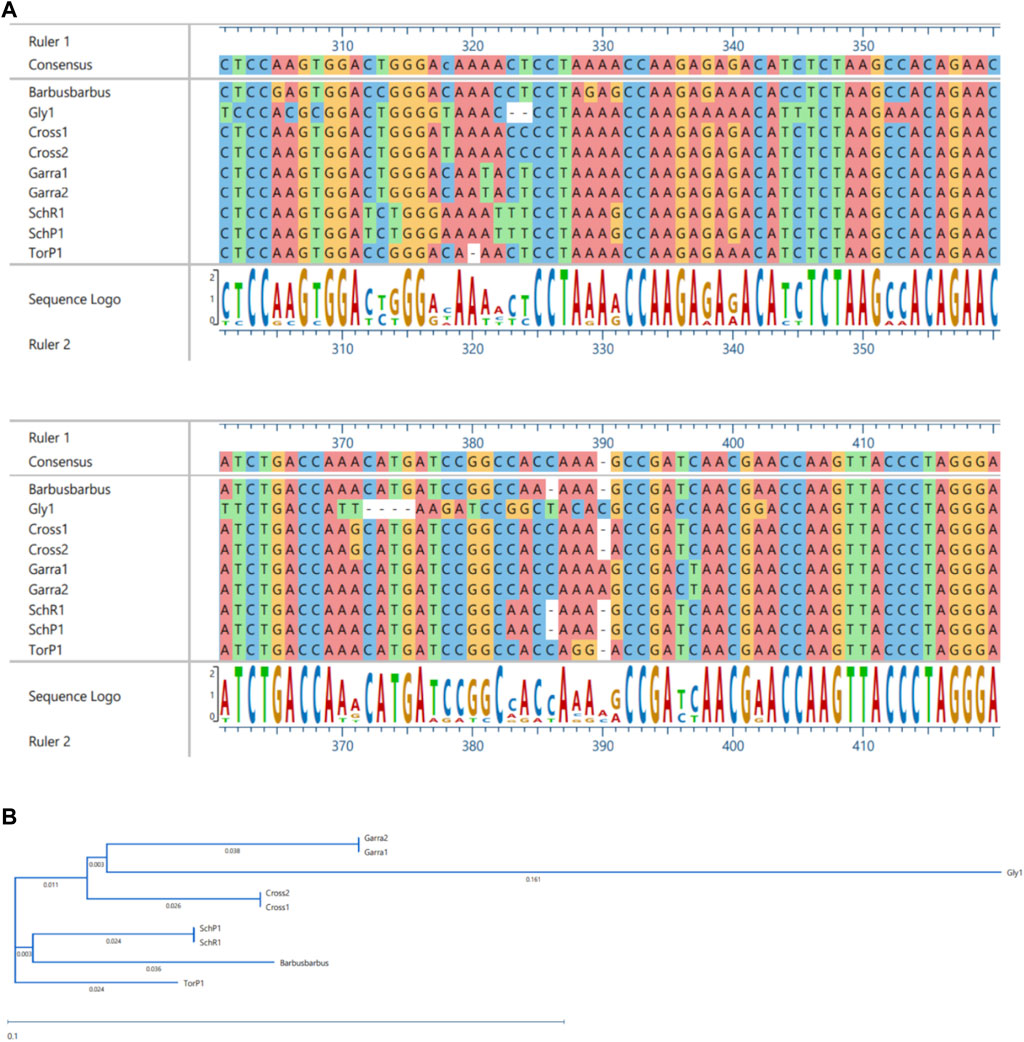
FIGURE 9. MSA (A) and Phylogenetic Tree (B) of 16S sequences. MSA was performed using MUSCLE Program and Phylogentic analysis were performed using PhyML algorithm (parameters—bootstrap value = 100, tree search = “Best from NNI and SPR,” Sarting tree = “BioNJ,” equllibrium and site rate variation = “Optimized”).
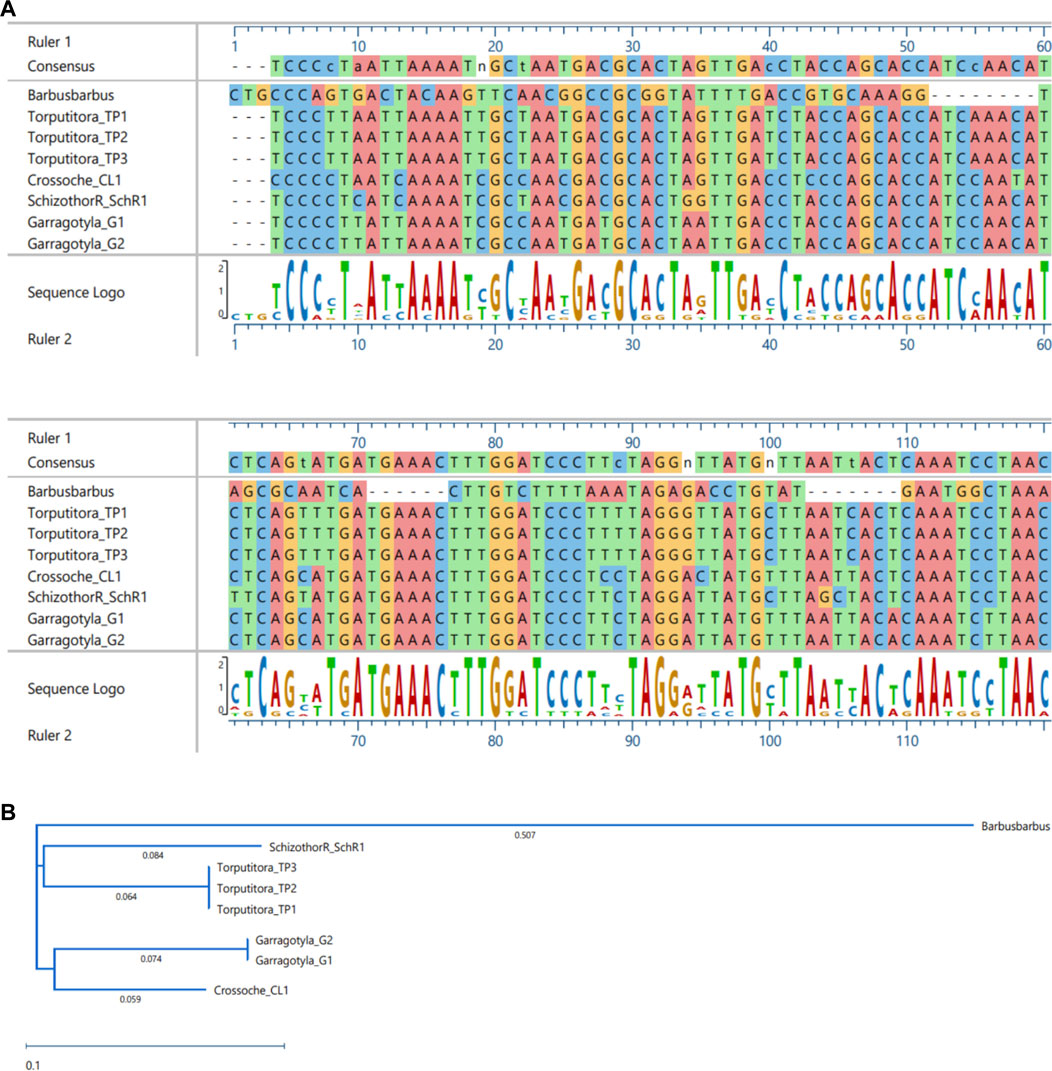
FIGURE 10. MSA (A) and Phylogenetic Tree (B) of CYT-B sequences. MSA was performed using MUSCLE Program and Phylogentic analysis were performed using PhyML algorithm (parameters—bootstrap value = 100, tree search = “Best from NNI and SPR”, Sarting tree = “BioNJ,” equllibrium and site rate variation = “Optimized”).
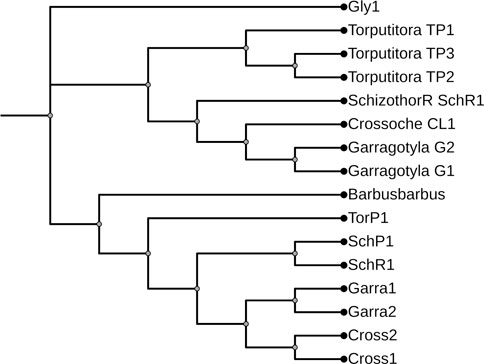
FIGURE 11. Maximum likelihood tree showing relationship of five fish species of River Poonch based on combine data. The maximum likelihood tree was generated using GTR+G model.
On the other hand, G. gotyla and T. latius are placed under a sub-clade closer to the Schizothorax genus than T. putitora with BS = 81–100; PP = .76). Phylogenetic analyses were also performed separately for Cyt b and 16S using PhyML algorithm (parameters—bootstrap value = 100, tree search = “Best from NNI & SPR”, Starting tree = “BioNJ,” equilibrium and site rate variation = “Optimized”). The better result was obtained through Cyt b, in which five monophyletic clades were formed, while on the other hand, only three monophyletic clades were obtained for 16S. Moreover, similar results were obtained through incorporated data as all the species were grouped according to their classification, as shown in Figures 7, 8.
The haplotype networks of the closely related species demonstrated that the sharing of Cyt b and 16S rRNA haplotype was common for two genera (Schizothorax and Tor). The result of the current study noted four haplotypes with .644 haplotype diversity, while nucleotide diversity and overall mean distance were noted as .0904 and .24, respectively, for Cyt b. On the other hand, five haplotypes were observed with .899 haplotype diversity, while overall nucleotide diversity and mean found distance were recorded as .0720 and .08. The 16S rRNA sequencing helped us to estimate the average evolutionary divergence and overall sequence pair, which involved ten nucleotide sequences. The DNA sequence information of Cyt b gene’s able transversion/transition ratio basis (R) was observed as 3.219 and k1 = 4.17 for purine, while k2 = 7.78 for pyrimidines.
Discussion
Morphological characteristics
Poonch River is well known for its diverse fish fauna and serves as a lifeline for the large population. Over 25% population of the area is solely dependent on the fishery sector for their livelihood. The current study represents the first-ever effort to combine phenotypic and genotypic analysis of six economically important fish species inhabiting this Himalayan region (Poonch River). The multivariate analysis appears to be a practical approach for identifying and understanding evolutionary relationships among fish species. Therefore, it has gained importance in fishery research (Caillon et al., 2018; Behera et al., 2020). Cyprinid morphological variation, such as body profile, has rarely been studied (Bravi et al., 2013; Yan et al., 2013; Dwivedi et al., 2020). There are still some questions about the fish species inhabiting the Poonch River, and the criteria used to differentiate them have been limited to morphological and meristic characteristics (Day, 1878; Talwar and Jhingran, 1991; Jayaram, 2010). At first glance, after examining specimens morphologically, we were expecting nine fish species during the current study. But after integrative analysis, it was confirmed that only six fish species were there instead of nine. Because G. gotyla and T. latius were misidentified as G. lamta and T. diplochelius, respectively, as reported in the previous study by Dutta (2003). Whereas the genus Schizothorax could not be differentiated only on molecular analysis through an individual approach but combined with phenotypic study, one can easily distinguish these species (Lal et al., 2015; Dwivedi, 2020). On the other hand, after collection of Tor samples we were expecting two species, viz., T. putitora and Tor tor as there was huge phenotypic ambiguity in the samples collected from the river, as by employing morphometric analysis it expressed some notable potential differences and on that basis one can easily consider them into two different species of Tor genus. Moreover, some distinguishing features between T. putitora and T. tor can be seen easily like head length, colour and size of barbells. But molecular results of the current study did not support the phenotypic results as after molecular analysis even not a single nucleotide difference can be sighted. So therefore, we can say that these morphological differences are not enough to surpass the molecular result. Hence through integrative approach we concluded that in Tor genus there is only one species i.e., T. putitora inhabiting River Poonch. However, such morphometric differences found in samples of Tor genus were to be only due to seasonal difference as the sample collected in different season (Pre-monsoon in which water is crystals clear (March) and during monsoon when the water is turbulent in the month of July as shown in Supplementary Figures S1A, B, respectively). The abovementioned results are in accordance with the findings of Naeem et al. (2011) and Langer et al. (2013), which suggested that T. putitora and T. tor are morphologically identical and are very difficult to differentiate without having proper taxonomic knowledge.
Moreover, in the current study, G. lamta and T. diplocheilus could not be differentiated by any approach; hence we conclude that these two species were misidentified from the region. However, Phenotypic analysis employing different approaches like PCA, CVA, RDA, correlation and dendrogram methods (Figures 2–4, 5A, B) among six fish species indicated an unambiguous correlation between the species based on their character. Additionally, three species of the genus Schizothorax and Tor (two and one species respectively) were a cluster in their relevant class, indicating that they share common phenotypic and body patterns and have similar body patterns. On the other hand, G. kashmirensis is placed distinctly from other fish species, which indicates that it differs in body profile and is characterized by a special set of features (Figure 3A). The present study’s results conform with the findings of other workers (Sarkar et al., 2012; Gupta et al., 2018; Dwivedi et al., 2020).
Based on the results, it was noted that out of six selected fish species, three species, viz., T. putitora, S. richardsonii and S. plagiostomus have similar external morphological characteristics, making them difficult to distinguish. However, a lot of work has been carried out at the taxonomic level of these fish species, but still, there is uncertainty in the identification among these fish species (Pandey and Nautiyal, 1997; Kullander et al., 1999; Dwivedi et al., 2020; Pandey et al., 2020; Jaafar et al., 2021). The result indicated that all the parameters were associated with the total body length and head length. At the same time, variations observed in head length and fin rays became distinctive characteristic features for T. putitora (Figures 2, 5A, B). Our findings also revealed that S. richardsonii and S. plagiostomus are similar in appearance. Similar values were observed for all the parameters except maximum body depth, caudal fin length, and head length. Also, no differences in their habitat and spawning season were observed. The number of inferior pharyngeal teeth in both species was the same (4, 3, 2/2, 3, 4). A lot of work has been reported favoring the current results (Misra et al., 1980; Negi and Negi, 2010; Mir et al., 2013a; Wagle et al., 2015; Wani et al., 2018; Kamboj and Kamboj, 2019). Misra et al. (1980) revealed that both S. richardsonii and S. plagiostomus had the same number of teeth. Only slight differences in the shape and size of the ceratohyal and epihyal were noted, with the epihyal of S. richardsonii being smaller than S. plagiostomus. Other similar observations regarding the morphological variations were noted by Wagle et al. (2015), who reported that for S. richardsonii, all the parameters were undoubtedly interrelated with total length and head length; the current study also obtained similar results (Figures 5A,B). Thus, it is concluded that the anal fin length and lips resolve the phenotypic problem of differentiating between these two species. Therefore, the anal fin length of S. plagiostomus distinguishes it from S. richardsonii, as the anal fin of S. plagiostomus lying flat and long enough to touch the base of the caudal fin in contrast to the anal fin of S. richardsonii which is small, and never touches the base of the caudal fin.
Molecular analysis (Cyt b + 16S rRNA)
Our study marks the first comprehensive molecular evaluation of the six fish species in the Poonch River. In the current study, DNA barcoding was effective in identifying species and provided a straightforward identification system when a perfect match existed between the morphology-based taxonomy and genetic divergence. Overall, this study demonstrated the ability of DNA barcoding to help calibrate the current taxonomic resolution and to shed new light on the fish diversity of River Poonch.
mtDNA is used for phylogenic surveys, genuine identification and differentiation of unidentified or closely linked species of aquatic organisms, including marine and freshwater fishes. A lot of work has been reported in the past on the taxonomy of these fish species from various parts of the world (Dimmick and Edds, 2002; He and Chen, 2006; Thai et al., 2007; Bajpai and Tewari, 2010; Kumar et al., 2011; Lakra et al., 2011; Yang et al., 2012; Ahmad et al., 2014; Chen et al., 2018; Krosch et al., 2019; Ma et al., 2020). However, it was challenging to compare our results with those who studied different species in a single attempt. No work has been reported on these fish species from this water body; however, little work has been reported from other water bodies in the region and other parts of the country (Ahmad et al., 2014; Jaafar et al., 2021), revealing the ambiguity among Schizothorax and Tor genus. But the current study is different from the previous ones (Ahmad et al., 2014) as they focused on the single genus of Schizothorax, but here we have adopted an integrative approach to five different genera, including Schizothorax and Tor as well, in a single attempt. Ghouri et al. (2020) reported the efficiency of Cyt b for the identification of edible fish species in Pakistan. Through the BLAST tool, they tracked similarities between species. In the current study, we used the ABGD, BINs, ML and BI approach and morphological study to authenticate fish species. However, compared to 16S rRNA, Cyt b is more successful in studying the intraspecies phylogenetic relationship. Besides molecular approaches, the morphological study made it more potent for validating the fish species of the area.
Genomics is valuable for preliminary species delimitations and for validating phenotypic-based species circumscription (Puillandre et al., 2012). At first glance, the analysis of Cyt b and 16S rRNA sequences with the genetic distance and topology created by the ML and BI tree discriminated all six fish species successfully as no overlapping clusters were formed. However, one species (G. kashmirensis) displayed deep divergence and two species of Schizothorax genera displayed the least divergence. A similar result was also found by using the ABGD method, in which the whole data set was delimited into six putative groups with a .24 barcoding gap. However, the individual phylogenetic trees showed overlapping in the case of the Schizothorax. T. putitora, G. gotyla, T. latius, and G. kashmirensis could be distinguished by all the methods like ABGD/ML analysis, even with an individual approach. However, the single-gene approach could not distinguish S. richardsonii, S. plagiostomus. The phylogenetic tree obtained by 16S rRNA showed a close relationship between the genus Schizothorax and formed only three monophyletic clades with three putative groups with three bins. On the other hand, in the case of Cyt b, there were five monophyletic clades formed with five putative groups in which five bins were present. However, in the case of Cyt b, better results were obtained as species of the Tor genus were partially differentiated. But in combined data that include both Cyt b and 16S in a single data set, all the species, including the genus of Schizothorax, could be distinguished. The current result was partially in accordance with the previous result of Ahmad et al. (2014), in which they emphasized more on combined analysis and got better results. However, in the case of our result, G. gotyla and T. latius shared a common sister clade and are also parallel with the result of Pandey et al. (2020), in which they found a similar type of result. Moreover, the current result indicated that the integrative approach could only be an effective tool to remove the ambiguity in these species.
During the current study, G. gotyla, T. latius and G. kashmirensis were clustered symmetrically in their respective genera. However, G. gotyla and T. latius were grouped and formed a separate sub-clade in all the cases, as both species belong to the sub-family Garrianae. Contrary to this, G. kashmirensis formed a separate clade both in individual (Cyt b) and (16S) as well as combined (Cyt b + 16S) phylogenetic analysis because of the difference in the family as it belongs to the family Sisordae. Conversely, all other species belong to the same family (Cyprinidae) and thus create a monophyletic clade according to their evolutionary history. But genus Schizothorax was not adequately differentiated with Cyt b as well as 16S individually. The current result was comparable with those of some earlier workers, as they have also noted the minimum genetic difference between these two species (Laskar et al., 2013; Khare et al., 2014; Yang et al., 2015; Laskar et al., 2018). In the present study, the phylogenetic results revealed a close relationship between S. richardsonii and S. plagiostomus, which supports the findings of other workers (Khan et al., 2016; Ma et al., 2020; Rehman et al., 2020). On the other hand, it has been noticed that there is a close association between the genus Schizothorax and Tor than Garra and Tariqilabeo. In general, similar species have been clustered together and different species have formed their cladogram (Lakra et al., 2011; Basheer et al., 2015; Bineesh et al., 2015; Davassy et al., 2015; Rathipriya et al., 2019). However, the considerable variability in their respective sites might be due to the G. kashmirensis, which belongs to Sisordae, whereas other species belong to the same family. Moreover, we found overall haplotype diversity higher in 16S rRNA compared to the Cyt b gene. In contrast, nucleotide diversity was noted more in the case of Cyt b than 16S rRNA. More haplotype diversity indicated that the diversity of this particular river is very high. Dekui et al. (2004) noted a similar result, who pointed out that the Cyt b gene revealed 659 constant sites, 481 variable sites, and 419 informative sites. The present results also showed similarity with the study of Lv et al. (2018), who obtained 42.7% of AT content during their analysis for fish species belonging to the family Sisordae.
For both genes, the analysis of the transition transversion ratio for all the species showed a higher transition ratio as compared to transversion, which is in agreement with the study of different authors (Page and Holmes, 1998; Ward et al., 2005; Li et al., 2013; Chakraborty et al., 2014; Bashir et al., 2016; Sharma et al., 2016). Our results also revealed that the average mean distance for Cyt b was noted in the range from .00 to .14 for intra-species, whereas .16 to .20 for interspecies with .01 standard error. The maximum distance was observed between T. putitora and G. gotyla, while the minimum was between S. richardsonii and S. plagiostomus. Comparable results were obtained from the 16S rRNA sequencing study, which revealed that within the species, variations varied from .00 to .6, but between species, variations ranged from .08 to .16. Moreover, the mean distance of individual species was noted as .00 to .041674 for G. gotyla, .00 to .026676 for T. latius, .00 to .018240 in the case of S. plagiostomus while for S. richardsonii it was varied from .00 to .027842, while, for T. putitora range from .00 to .022429 and for G. kashmirensis it was .075259. However, the extreme distance between G. kashmirensis and T. putitora was noted, while the least distance was observed for S. plagiostomus and S. richardsonii. The present study highlighted that intraspecies nucleotide diversity is far lower than inter-species genetic diversity, according to Ward et al. (2005) and Lakra et al. (2011). At the same time, Sherzada et al. (2020) also noted a gradual increase in genetic diversity with the rise in the genetic level. In the current study, the cases of weak genetic differentiation or haplotype sharing include four species from two genera. The accuracy of DNA barcoding to separate the species depends on the level of genetic diversity (Meyer and Paulay, 2005). Therefore, the incompetence to separate these species is credited to absence of sufficient genetic discrepancy between these species. In the genus Schizothorax, interspecific haplotype sharing is an omnipresent example in the same drainage (Dimmick and Edds, 2002; He and Chen, 2006). First, species inhabiting the same waterbody with a large allocation range can display structural variations like the shape of the mouth and lips in case of Schizothorax, head length, and body depth for T. putitora characteristics for identification (Wu and Wu, 1992; Chen et al., 2015).
Conclusion
The integrative approach, i.e., morphometric and molecular phylogeny, is the most authentic and informative approach used to discriminate fishes (Rajpoot et al., 2016). In the current study, two mitochondrial genes were used to validate the fish species using a binary approach, such as phenotypic and genotypic data in order to resolve the ambiguity among six important fish species of the Poonch River. A combined analysis of mitochondrial loci mostly agrees with morpho taxonomical studies (Silas, 1960; Ahmad et al., 2014), indicating that the integrative method could effectively resolve uncertainty in the identification and understanding of morphological relationships even with a low sample size. Therefore, molecular phylogenies and phenotypic studies can be compared using standard methods to come up with a robust conclusion. The study showed that Cyt b and 16S rRNA were effective indicators of interspecies relationships and genetic variation. Although, we found that all other species, including G. kashmirensis (critically endangered), T. putitora (endangered), and S. richardsonii (vulnerable), are relatively large populations. However, they are still under intense pressure from human activities such as illegal fishing and killing species regardless of their conservation value.
Data availability statement
The datasets presented in this study can be found in online repositories. The names of the repository/repositories and accession number(s) can be found below: https://www.ncbi.nlm.nih.gov/genbank/, MW191577; https://www.ncbi.nlm.nih.gov/genbank/, MW191578; https://www.ncbi.nlm.nih.gov/genbank/, MW191579; https://www.ncbi.nlm.nih.gov/genbank/, MW191580; https://www.ncbi.nlm.nih.gov/genbank/, MW191581; https://www.ncbi.nlm.nih.gov/genbank/, MW191586; https://www.ncbi.nlm.nih.gov/genbank/, MW191585; https://www.ncbi.nlm.nih.gov/genbank/, MW148582; https://www.ncbi.nlm.nih.gov/genbank/, MW148583; https://www.ncbi.nlm.nih.gov/genbank/, MW148584; https://www.ncbi.nlm.nih.gov/genbank/, MW148588; https://www.ncbi.nlm.nih.gov/genbank/, MW148587; https://www.ncbi.nlm.nih.gov/genbank/, MW148589; https://www.ncbi.nlm.nih.gov/genbank/, MW148585; https://www.ncbi.nlm.nih.gov/genbank/, MW148586.
Ethics statement
The animal study was reviewed and approved by a full compliance with the relevant international, national, and institutional guidelines for the use and care of animals was observed during the current research project. Animal Ethical Committee has approved all the protocols used registered under R. No. 801/Go/RE/S/2003/CPCSEA.
Author contributions
MA performed the experimental work and wrote the manuscript. IA conceived, supervised and revised the manuscript. SA designed the molecular work and helped in statistical analysis. KA-A help in drafting of the manuscript and corrections, MF also help in drafting of the manuscript and corrections. BB helped in statistical analysis. All authors read and approved the final manuscript.
Funding
This work was supported by the Researchers Supporting Project number (RSP2023R154), King Saud University, Riyadh, Saudi Arabia.
Acknowledgments
The authors would like to express their sincere gratitude to the Head, Department of Zoology, University of Kashmir, Hazratbal, Srinagar, India, who generously provided the laboratory facilities. Also thankful to the Head, Division of Animal Biotechnology, Faculty of Veterinary Sciences and Animal Husbandry, Shuhama, SKUAST-K for carrying out the manuscript’s molecular part. The authors would like to extend their sincere appreciation to the Researchers Supporting Project number (RSP2023R154), King Saud University, Riyadh, Saudi Arabia.
Conflict of interest
The authors declare that the research was conducted in the absence of any commercial or financial relationships that could be construed as a potential conflict of interest.
Publisher’s note
All claims expressed in this article are solely those of the authors and do not necessarily represent those of their affiliated organizations, or those of the publisher, the editors and the reviewers. Any product that may be evaluated in this article, or claim that may be made by its manufacturer, is not guaranteed or endorsed by the publisher.
Supplementary material
The Supplementary Material for this article can be found online at: https://www.frontiersin.org/articles/10.3389/fgene.2022.1047436/full#supplementary-material
SUPPLEMENTARY FIGURE S1 | Representative images of each species (A) T. putitora (B) T. tor (C) G. gotyla (D) S. richardsonii (E) S. plagiostomus (F) T. latius (G) G. kashmirensis.
SUPPLEMENTARY FIGURE S2 | Location of 14 landmarks refers to 1. Anterior tip of snout at upper jaw 2 most posterior espect of neurocranium 3. Origin of dorsal; fin 4. Anterior attachment of dorsal membrane from caudal fin 5. Posterior end of vertebral column 6. Anterior attachment of ventral membrane from caudal fin 7. Origin of anal fin 8. Insertion of pelvic fin 9. Ventral edge of the operculum 10. Origen of pectoral fin 11. Posterior end of opperculum 12. Anterior end of eye 13. Posterior end of eye 14. Fork point of caudal fin.
References
Ahmad, S. M., Bhat, F. A., Balkhi, M. U. H., and Bhat, B. A. (2014). Mitochondrial DNA variability to explore the relationship complexity of Schizothoracine (Teleostei: Cyprinidae). Genetica 14, 507–516. doi:10.1007/s10709-014-9797-y
Ahmed, I., Ahmad, I., Dar, S. A., Awas, M., Kaur, H., Ganai, B. A., et al. (2019). Myxobolus himalayaensis sp. nov.(Cnidaria: Myxozoa) parasiting Schizothorax richardsonii (cyprinidae: Schizothoracinae) from River Poonch in north west Himalaya, India. Aquac. Rep. 14, 100192. doi:10.1016/j.aqrep.2019.100192
Attaullah, U., Ullah, U., Ilahi, I., Ahmad, N., Rahman, F. U., Ullah, J., et al. (2021). Taxonomic, morphometric and limnological assessment of the commercially important ichthyofauna of Sakhakot Stream, Malakand, Pakistan. Braz J Biol. 82, e243774. doi:10.1590/1519-6984.243774
Awas, M., Ahmed, I., and Sheikh, Z. A. (2020). Length-weight relationship of six coldwater food fish species of River Poonch, Pir Panjal Himalaya, India. Egypt. J. Aquat. Biol. Fish. 24 (2), 353–359. doi:10.21608/ejabf.2020.82230
Badkur, R., and Parashar, A. (2015). Morphometric approach towards growth performance of Mahseer (Tor tor) in river Narmada near Hoshangabad (MP). Indian J. Pharm. Biol. Res. 3 (2), 66–72. doi:10.30750/ijpbr.3.2.7
Bajpai, N., and Tewari, R. R. (2010). Mitochondrial DNA sequence-based phylogenetic relationship among flesh flies of the genus sarocophaga (sarcophagidae: Diptera). J. Genet. 89 (1), 51–54. doi:10.1007/s12041-010-0010-5
Basheer, V. S., Mohitha, C., Vineesh, N., Divya, P. R., Gopalakrishnan, A., and Jena, J. K. (2015). Molecular phylogenetics of three species of the genus Rastrelliger using mitochondrial DNA markers. Mol. Biol. Rep. 42, 873–879. doi:10.1007/s11033-014-3710-8
Bashir, A., Bisht, B. S., Mir, J. I., Patiyal, R. S., and Kumar, R. (2016). Morphometric variation and molecular characterization of snow trout species from Kashmir valley, India. Mitochondrial DNA A DNA Mapp. Seq. Anal. 27, 4492–4497. doi:10.3109/19401736.2015.1101537
Bavinck, M., and Johnson, D. (2008). Handling the legacy of the blue revolution in India-social justice and small-scale fisheries in a negative growth scenario. Am. Fish. Soc. Symp. 49 (1), 585–599.
Behera, P. R., Jishnudev, M. A., Saravanan, R., Roul, S. K., Ghosh, S., Mahesh, V. U., et al. (2020). Redescription of the enigmatic jellyfish, Crambionella annandalei (Cnidaria: Scyphozoa) from Indian waters. J. Mar. Biol. Assoc. U. K. 100, 691–699. doi:10.1017/S0025315420000703
Bhat, F. A., Balkhi, M. H., Najar, A. M., and Yousuf, A. R. (2013). Distribution pattern, density and morphometric characteristics of Shizothoracines (Snow trout) in Lidder River, Kashmir. Biosean 8 (2), 363–379.
Bineesh, K. K., Mohitha, C., Vineesh, N., Basheer, V. S., Joselet, M., Pillai, N. K., et al. (2015). Molecular identification of three deepsea fish species of the genus Chelidoperca (Perciformes: Serranidae) from Indian waters. Indian J. Fish. 62, 104–108.
Bottero, M. T., and Dalmasso, A. (2011). Animal species identification in food products: Evolution of biomolecular methods. Vet. J. 190, 34–38. doi:10.1016/j.tvjl.2010.09.024
Bravi, R., Ruffini, M., and Scalici, M. (2013). Morphological variation in riverine cyprinids: A geometric morphometric contribution. Ital. J. Zool. (Modena). 80, 536–546. doi:10.1080/11250003.2013.829129
Briolay, J., Galtier, N, Brito, R. M., and Bouvet, Y. (1998). Molecular phylogeny of Cyprinidae inferred from cytochrome b DNA sequences. Mol. Phylogenet. Evol. 9, 100–108. doi:10.1006/mpev.1997.0441
Brown, C., Zakaria, V., Joubert, A., Rafique, M., Murad, J., King, J., et al. (2019). Achieving an environmentally sustainable outcome for the gulpur hydropower project in the Poonch River mahaseer national park, Pakistan. Sustain. Water Resour. Manag. 5 (2), 611–628. doi:10.1007/s40899-018-0227-7
Brraich, O. S., and Akhter, S. (2015). Morphometric characters and meristic counts of a fish, Garra gotyla gotyla (Gray) from Ranjit Sagar Wetland, situated in the Himalayan foothills, India. Int. Res. J. Biol. Sci. 4 (5), 66–72.
Caillon, F., Bonhomme, V., Mvollmann, C., and Frelat, R. (2018). A morphometric dive into fish diversity. Ecosphere 9, e02220. doi:10.1002/ecs2.2220
Chakraborty, M., and Ghosh, S. K. (2014). An assessment of the DNA barcodes of Indian freshwater fishes. Gene 537, 20–28. doi:10.1016/j.gene.2013.12.047
Charrad, M., Ghazzali, N., Boiteau, V., and Niknafs, A. (2014). NbClust: An R package for determining the relevant number of clusters in a data set. J. Stat. Softw. 61 (6), 1–36. doi:10.18637/jss.v061.i06
Chen, W., Ma, X., Shen, Y., Mao, Y., and He, S. (2015). The fish diversity in the upper reaches of the Salween River, Nujiang River, revealed by DNA barcoding. Sci. Rep. 5 (1), 17437. doi:10.1038/srep17437
Chen, Y. Y., Li, R., Li, C. Q., Li, W. X., Yang, H. F., Xiao, H., et al. (2018). Testing the validity of two putative sympatric species from Sinocyclocheilus (Cypriniformes: Cyprinidae) based on mitochondrial cytochrome b sequences. Zootaxa 4476, 130–140. doi:10.11646/zootaxa.4476.1.12
Cornetti, L., Fields, P. D., Van Damme, K., and Ebert, D. (2019). A fossil-calibrated phylogenomic analysis of Daphnia and the Daphniidae. Mol. Phylogenet. Evol. 137, 250–262. doi:10.1016/j.ympev.2019.05.018
Darriba, D., Taboada, G. L., Doallo, R., and Posada, D. (2012). jModelTest 2: More models, new heuristics and parallel computing. Nat. Methods 9 (8), 772. doi:10.1038/nmeth.2109
Davassy, A., Kumar, R., Shajitha, P. P., John, R., Padmakumar, K. G., Basheer, V. S., et al. (2015). Genetic identification and phylogenetic relationships of Indian clariids based on mitochondrial COI sequences. Mitochondrial DNA A DNA Mapp. Seq. Anal. 27 (5), 3777–3780. doi:10.3109/19401736.2015.1079901
Day, F. (1878). The fishes of India being a natural history of the fishes known to inhabit the seas and fresh waters of India, Burma and ceylon, vol. 2. New Delhi, India: Today & Tomorrow’s book agency.
Dekui, H. E., Chen, Y., Chen, Y., and Chen, Z. (2004). Molecular phylogeny of the specialized Schizothoracine fishes (Teleostei: Cyprinidae), with their implications for the uplift of the Qinghai- Tibetan Plateau. Chin. Sci. Bull. 49 (1), 39–48. doi:10.1360/03wc0212
Diaz, J., Villanova, G. V., Brancolini, F., Del Pazo, F., Posner, V. M., Grimberg, A., et al. (2016). First DNA barcode reference library for the identification of South American freshwater fish from the lower Parana River. PLoS One 11, e0157419. doi:10.1371/journal.pone.0157419
Dimmick, W. W., and Edds, D. R. (2002). Evolutionary genetics of the endemic Schizorathicine Cypriniformes: Cyprinidae) fishes of lake rara, Nepal. Biochem. Syst. Ecol. 30, 919–929. doi:10.1016/s0305-1978(02)00030-3
Dutta, S. P. S. (2003). Fish fauna of Poonch district, Jammu region (J&K state). J. Aquacult. Biol. 4 (2), 241–246.
Dwivedi, A. K. (2020). Differentiating three Indian shads by applying shape analysis from digital images. J. Fish. Biol. 96, 1298–1308. doi:10.1111/jfb.14074
Dwivedi, A. K., Verma, H., Dewan, S., and Verma, S. (2020). Trends in morphological relationships among Gangetic Cyprinids. Zool. Anz. 289, 123–132. doi:10.1016/j.jcz.2020.10.003
Edgar, R. C. (2004). MUSCLE: Multiple sequence alignment with high accuracy and high throughput. Nucleic Acids Res. 32 (5), 1792–1797. doi:10.1093/nar/gkh340
Felsenstein, J. (1981). Evolutionary trees from DNA sequences: A maximum likelihood approach. J. Mol. Evol. 17 (6), 368–376. doi:10.1007/BF01734359
Froese, R., and Pauly, D. (2007). Fishbase: World wide web electronic publication. Available at: http://www.fishbase.org.
Ghosh, A. K. (1997). “Himalayan fauna with special reference to endangered and endemic species,” in Himalayan biodiversity: Action plan. Editor U. Dhar (Kosi-Katarmal, Almora: GB Pant Institute of Himalayan Environment & Development), 53–59.
Ghouri, M. Z., Ismail, M., Javed, M. A., Khan, S. H., Munawar, N., Umar, A. B., et al. (2020). Identification of edible fish species of Pakistan through DNA barcoding. Front. Mar. Sci. 868. doi:10.3389/fmars.2020.554183
Gonzales, E., and Sartori, J. S. (2002). Crescimento e Metabolismo Muscular. Fisiologia Aviária Aplicada a Frangos de Corte. Jaboticabal, SP, Brazil: FUNEP/UNESP, 279-29.
Gonzalez, V. H., Griswold, T., and Engel, M. S. (2013). Obtaining a better taxonomic understanding of native bees: Where do we start? Syst. Entomol. 38, 645–653. doi:10.1111/syen.12029
Gopi, K., and Mishra, S. (2014). “Diversity of marine fish of India,” in Marine faunal diversity in India, 171–193.
Griffiths, A. M., Miller, D. D., Egan, A., Fox, J., Greenfield, A., and Mariani, S. (2013). DNA barcoding unveils skate (Chondrichthyes: Rajidae) species diversity in ‘ray’ products sold across Ireland and the UK. PeerJ 1, e129. doi:10.7717/peerj.129
Guindon, S., Delsuc, F., Dufayard, J. F., and Gascuel, O. (2009). “Estimating maximum likelihood phylogenies with PhyML,” in Bioinformatics for DNA sequence analysis (Totowa, NJ, USA: Humana Press), 113–137.
Gupta, D., Dwivedi, A. K., and Tripathi, M. (2018). Taxonomic validation of five fish species of subfamily Barbinae from the Ganga river system of northern India using traditional and truss analyses. PloS One 13, e0206031. doi:10.1371/journal.pone.0206031
He, D., and Chen, Y. (2006). Biogeography and molecular phylogeny of the genus Schizothorax (Teleostei: Cyprinidae) in China inferred from cytochrome b sequences. J. Biogeogr. 33, 1448–1460. doi:10.1111/j.1365-2699.2006.01510.x
Hebert, P. D., Cywinska, A., Ball, S. L., and deWaard, J. R. (2003). Biological identifications through DNA barcodes. Proc. Biol. Sci. 270, 313–321. doi:10.1098/rspb.2002.2218
Huelsenbeck, J. P., and Ronquist, F. (2001). MRBAYES: Bayesian inference of phylogenetic trees. Bioinformatics 17 (8), 754–755. doi:10.1093/bioinformatics/17.8.754
Hussain, S., and Dutta, S. P. S. (2016). Fish fauna of tehsil mendhar, district-poonch, Jammu region, J&K state, with a new record of botiabirdi, ompokpabda and Glyptothorax punjabiensis from Poonch district. Proc. Zool. Soc. Ind. 15, 1–11.
Jaafar, F., Na-Nakorn, U., Srisapoome, P., Amornsakun, T., Duong, T. Y., Gonzales-Plasus, M. M., et al. (2021). A current update on the distribution, morphological features, and genetic identity of the southeast asian mahseers, tor species. Biology 10 (4), 286. doi:10.3390/biology10040286
Jayaram, K. C. (2010). The freshwater fishes of the Indian region. New Delhi: Narendra Publication Company., 616.
Johnson, R. A., and Wichern, D. W. (1998). Applied multivariate statistical analysis. 4 ed. New York, USA: Prentice-Hall.
Kaiser, H. F. (1974). An index of factorial simplicity. Psychometrika 39, 31–36. doi:10.1007/bf02291575
Kamboj, N., and Kamboj, V. (2019). Morphometric and meristic study of four freshwater fish species of river Ganga. Indian J. Animal Sci. 89 (4), 120–123.
Kartavtsev, Y. P., Batischeva, N. M., Bogutskaya, N. G., Katugina, A. O., and Hanzawa, N. (2017). Molecular systematics and DNA barcoding of Altai Osmans, oreoleuciscus (pisces, cyprinidae, and leuciscinae), and their nearest relatives, inferred from sequences of cytochrome b (Cyt-b), cytochrome oxidase c (Co-1), and complete mitochondrial genome. Mitochondrial DNA A DNA Mapp. Seq. Anal. 28 (4), 502–517. doi:10.3109/24701394.2016.1149822
Kassambara, A., and Mundt, F. (2020). factoextra: Extract and visualize the results of multivariate data analyses. R package version 1.0.7. Available at: https://CRAN.R-project.org/package=factoextra.
Kassambara, A. (2017). Practical guide to principal component methods in R: PCA, M(CA), FAMD, MFA, HCPC, factoextra (STHDA).
Keskin, E., and Atar, H. H. (2013). DNA barcoding commercially important fish species of Turkey. Mol. Ecol. Resour. 13, 788–797. doi:10.1111/1755-0998.12120
Khan, M., Nasir Khan Khattak, M., He, D., Liang, Y., Li, C., UllahDawar, F., et al. (2016). The complete mitochondrial genome organization of Schizothorax plagiostomus (Teleostei: Cyprinidae) from Northern Pakistan. Mitochondrial DNA A DNA Mapp. Seq. Anal. 27 (5), 3630–3632. doi:10.3109/19401736.2015.1079829
Khan, M. A., Khan, S., and Miyan, K. (2012). Length–weight relationship of giant snakehead, Channa marulius and stinging catfish, Heteropneustes fossilis from the River Ganga, India. J. Appl. Ichthyol. 28 (1), 154–155. doi:10.1111/j.1439-0426.2011.01901.x
Khan, M. R., Rakha, B. A., and Ansari, M. S. (2020). Diversity and distribution of genera Schizothorax and schizothorichthyes in river swat, Pakistan. Pak. J. Zool. 52 (6), 2419. doi:10.17582/journal.pjz/20180904060941
Khare, P., Mohindra, V., Barman, A. S., Singh, R. K., and Lal, K. K. (2014). Molecular evidence to reconcile taxonomic instability in mahseer species (Pisces: Cyprinidae) of India. Org. Divers. Evol. 14 (3), 307–326. doi:10.1007/s13127-014-0172-8
Kimura, M. A. (1980). A simple method for estimating evolutionary rates of base substitutions through comparative studies of nucleotide sequences. J. Mol. Evol. 16 (2), 111–120. doi:10.1007/BF01731581
Knebelsberger, T., Landi, M., Neumann, H., Kloppmann, M., Sell, A. F., Campbell, P. D., et al. (2014). A reliable DNA barcode reference library for the identification of the north European shelf fish fauna. Mol. Ecol. Resour. 14, 1060–1071. doi:10.1111/1755-0998.12238
Kochzius, M., Seidel, C., Antoniou, A., Botla, S. K., Campo, D., Cariani, A., et al. (2010). Identifying fishes through DNA barcodes and microarrays. PLoS One 5, e12620. doi:10.1371/journal.pone.0012620
Kocovsky, P. M., Adams, J. V., and Bronte, C. R. (2009). The effect of sample size on the stability of principal components analysis of truss-based fish morphometrics. Trans. Am. Fish. Soc. 138, 487–496. doi:10.1577/t08-091.1
Krosch, M. N., Schutze, M. K., Strutt, F., Clarke, A. R., and Cameron, S. L. (2019). A transcriptome-based analytical workflow for identifying loci for species diagnosis: A case study with bactrocera fruit flies (Diptera: Tephritidae). Aust. Entomol. 58, 395–408. doi:10.1111/aen.12321
Kullander, S. O., Fang, F., Delling, B., and Ahlander, E. (1999). The fishes of the Kashmir valley, RiverJhelum, Kashmir valley: Impacts on the aquatic environment. Swedmar Göteborg 1999, 99–167.
Kumar, S. S., Gaur, A., and Shivaji, S. (2011). Phylogenetic studies in Indian scleractinian corals based on mitochondrial cytochrome b gene sequences. Curr. Sci. 101, 69–676.
Lakra, W. S., Verma, M. S., Goswami, M., Lal, K. K., Mohindra, V., Punia, P., et al. (2011). DNA barcoding Indian marine fishes. Mol. Ecol. Resour. 11, 60–71. doi:10.1111/j.1755-0998.2010.02894.x
Lal, K. K., Gupta, B. K., Punia, P., Mohindra, V., Saini, V. P., Dwivedi, A. K., et al. (2015). Revision of gonius subgroup of the genus Labeo Cuvier, 1816 and confirmation of species status of Labeo rajasthanicus (Cypriniformes: Cyprinidae) with designation of a neotype. Indian J. Fish. 62, 10e22.
Langer, S., Tripathi, N. K., and Khajuria, B. (2013). Morphometric and meristic study of golden mahseer (Tor putitora) from Jhajjar Stream (JandK), India. Res. J. Animal, Veterinary Fish. Sci. 1, 1–4.
Laskar, B. A., Bhattacharjee, M. J., Dhar, B., Mahadani, P., Kundu, S., and Ghosh, S. K. (2013). The species dilemma of northeast Indian mahseer (actinopterygii: Cyprinidae): DNA barcoding in clarifying the riddle. PLoS One 8, e53704–e53711. doi:10.1371/journal.pone.0053704
Laskar, B. A., Kumar, V., Kundu, S., Tyagi, K., and Chandra, K. (2018). Taxonomic quest: Validating two mahseer fishes (actinopterygii: Cyprinidae) through molecular and morphological data from biodiversity hotspots in India. Hydrobiologia 815 (1), 113–124. doi:10.1007/s10750-018-3555-6
Le, S., Josse, J., and $ Husson, F. (2008). FactoMineR: An R package for multivariate analysis. J. Stat. Softw. 25 (1), 1–18. doi:10.18637/jss.v025.i01
Li, Y., Ren, Z., Shedlock, A. M., Wu, J., Sang, L., Tersing, T., et al. (2013). High altitude adaptation of the schizothoracine fishes (Cyprinidae) revealed by the mitochondrial genome analyses. Gene 517, 169–178. doi:10.1016/j.gene.2012.12.096
Lohani, V., Pant, B., Pandey, N. N., and Ram, R. N. (2020). Morphological account of Schizothorax richardsonii population of river kosi and river Alaknanda. Pharma Innov. 9 (3), 30–33.
Lv, Y., Li, Y., Ruan, Z., Bian, C., You, X., Yang, J., et al. (2018). The complete mitochondrial genome of Glyptothorax macromaculatus provides a well-resolved molecular phylogeny of the Chinese sisorid catfishes. Genes. 9 (6), 282. doi:10.3390/genes9060282
Ma, Q., He, K., Wang, X., Jiang, J., Zhang, X., and Song, Z. (2020). Better resolution for Cytochrome b than Cytochrome c Oxidase subunit I to identify Schizothorax species (Teleostei: Cyprinidae) from the Tibetan Plateau and its adjacent area. DNA Cell. Biol. 39 (4), 579–598. doi:10.1089/dna.2019.5031
Maddison, D. R., and Maddison, W. P. (2003). MacClade 4.06: Analysis of phylogeny and character evolution. Sunderland, MA: Sinauer Associates.
Martinez, A. S., Willoughby, J. R., and Christie, M. R. (2018). Genetic diversity in fishes is influenced by habitat type and life-history variation. Ecol. Evol. 8, 12022–12031. doi:10.1002/ece3.4661
Mehmood, S., Ahmed, I., and Ali, N. (2021). Length-weight relationship, morphometric and meristic controlling elements of three freshwater fish species inhabiting North-Western Himalaya. Egypt. J. Aquat. Biol. Fish. 25 (6), 243–257. doi:10.21608/ejabf.2021.211325
Menon, A. G. K. (1964). Monograph of the cyprinid fishes of the genus Garra Hamilton, Vol. 14. Government of India.
Meyer, C. P., and Paulay, G. (2005). DNA barcoding: Error rates based on comprehensive sampling. PLoS Biol. 3, e422. doi:10.1371/journal.pbio.0030422
Mina, M. V., Levin, B. A., and Mironovsky, A. N. (2005). On the possibility of using character estimates obtained by different operators in morph metric studies of fish. J. Ichthyol. 45 (4), 284–294.
Mir, F. A., Mir, J. I., and Chandra, S. (2013a). Phenotypic variation in the snow trout schizothoraxrichardsonii (gray, 1832) (actinopterygii: Cypriniformes: Cyprinidae) from the IndianHimalayas. Contrib. Zool. 82, 115–122. doi:10.1163/18759866-08203001
Mir, F. A., Mir, J. I., Patiyal, R. S., and Chandra, S. (2013b). Pattern of morphometric differentiation among three populations of snowtrout, Schizothorax plagiostomus (Actinopterygii: Cypriniformes: Cyprinidae), from Kashmir Himalaya using a truss network system. Acta Ichthyol. Piscat. 43 (4), 277–284. doi:10.3750/aip2013.43.4.03
Misra, M., Nautiyal, P., and Lai, M. S. (1980). Morphological studies of hyobranchial skeleton of some Garhwal hill stream fishes. Hyobranchial skeleton of Schizothorx spp. Indian J. Zootomy 21 (1-3), 117–123.
Naeem, M., Salam, A., Ashraf, M., Khalid, M., and Ishtiaq, A. (2011). External morphometric study of hatchery reared mahseer (Tor putitora) in relation to body size and condition factor. Afr. J. Biotechnol. 10 (36), 7071–7077.
Negi, R. K., and Negi, T. (2010). Analysis of morphometric character of Schizothorax richardsonii (gray, 1832) from the uttarkashi district of uttrakhand state. India. J. Biol. Sci. 10 (6), 536–540.
Page, R. D. M., and Holmes, E. C. (1998). Molecular evolution: A phylogenetic approach. London: Blackwell Science.
Pandey, P. K., Singh, Y. S., Tripathy, P. S., Kumar, R., Abujam, S. K., and Parhi, J. (2020). DNA barcoding and phylogenetics of freshwater fish fauna of Ranganadi River, Arunachal Pradesh. Gene 754, 144860. doi:10.1016/j.gene.2020.144860
Pandey, S. K., and Nautiyal, P. (1997). Statistical evaluation of some meristic and morphometric characters of taxonomic significance in Schizothorax richardsonii (Gray) and Schizothorax plagiostomus (Heckel). Indian J. Fish. 44 (1), 75–79.
Pethiyagoda, R., and Kottelat, M. (1995). A review of the barbs of the Puntius filamentosus group (Teleostei: Cyprinidae) of southern India and Sri Lanka. Raffles Bull. Zool. Suppl. 12, 127–144.
Pollack, S. J., Kawalek, M. D., Williams-Hill, D. M., and Hellberg, R. S. (2018). Evaluation of DNA barcoding methodologies for the identification of fish species in cooked products. Food control. 84, 297–304. doi:10.1016/j.foodcont.2017.08.013
Posada, D. (2008). jModelTest: phylogenetic model averaging. Mol. Biol. Evol. 25 (7), 1253–1256. doi:10.1093/molbev/msn083
Poulet, N., Reyjol, Y., Collier, H., Sovan, L., and Lek, S. (2005). Does fish scale morphology allow the identification of populations at a local scale? A case study for rostrum dace Leuciscus leuciscus burdigalensis in river viaur (SW France). Aquat. Sci. 67, 122–127. doi:10.1007/s00027-004-0772-z
Puillandre, N., Lambert, A., Brouillet, S., and Achaz, G. (2012). ABGD, automatic barcode gap Discovery for primary species delimitation. Mol. Ecol. 21 (8), 1864–1877. doi:10.1111/j.1365-294X.2011.05239.x
R Development Core Team (2020). R: A language and environment for statistical computing. Vienna: R Foundation for Statistical Computing.
Rafique, M., and Khan, N. U. H. (2012). Distribution and status of significant freshwater fishes of Pakistan. Rec. Zool. Surv. Pak. 21, 90–95.
Rajpoot, A., Kumar, V. P., Bahuguna, A., and Kumar, D. (2016). DNA barcoding and traditional taxonomy: An integrative approach. Int. J. Curr. Res. 8, 42025–42031. doi:10.1139/gen-2015-0167
Rathipriya, A., Karal Marx, K., and Jeyashakila, R. (2019). Molecular identification and phylogenetic relationship of flying fishes of Tamil Nadu coast for fishery management purposes. Mitochondrial DNA A DNA Mapp. Seq. Anal. 30 (3), 500–510. doi:10.1080/24701394.2018.1558220
Regmi, B., Douglas, M. R., Edds, D. R., and Douglas, M. E. (2021). Geometric morphometric analyses define riverine and lacustrine species flocks of himalayan snowtrout (cyprinidae: Schizothorax) in Nepal. Aquat. Biol. 30, 19–31. doi:10.3354/ab00737
Rehman, A., Khan, M. F., Bibi, S., and Nouroz, F. (2020). Comparative phylogeny of (schizothoraxesocinus) with reference to 12s and 16S ribosomal RNA from River swat, Pakistan. Mitochondrial DNA A DNA Mapp. Seq. Anal. 31 (2), 81–85. doi:10.1080/24701394.2020.1741561
Revelle, W. (2020). psych: Procedures for personality and psychological research. R package version 2.1.3. Evanston, Illinois, USA: Northwestern University. Available at: https://CRAN.R-project.org/package=psych.
Roul, S. K., Jeena, N. S., Kumar, R., Vinothkumar, R., Rahangdale, S., Rahuman, S., et al. (2021). Postulating the modality of integrative taxonomy in describing the cryptic congener pampus griseus (cuvier) and systematics of the genus pampus (perciformes: Stromateidae). Front. Mar. Sci. 8, 1–22. doi:10.3389/fmars.2021.778422
Sarkar, U. K., Pathak, A. K., Sinha, R. K., Sivakumar, K., Pandian, A. K., Pandey, A., et al. (2012). Freshwater fish biodiversity in the river ganga (India): Changing pattern, threats and conservation perspectives. Rev. Fish. Biol. Fish. 22, 251–272. doi:10.1007/s11160-011-9218-6
Sharma, J., Alka, P., Pratibha, B., and Jitendra, K. (2016). Assessment of genetic diversity of mahseer (Tor tor) using RAPD markers from wild and cultured conditions in Madhya Pradesh. J. Exp. Zool. India 19 (1), 23–29.
Sharma, N. K., Mir, J. I., Pandey, N. N., Akhtar, M. S., Bashir, A., and Singh, R. (2014). Meristic and morphometric characteristics of Crossocheilus diplochilus (heckel, 1838) from the Poonch valley of Jammu and Kashmir, India. World J. Zoology 9 (3), 184–189.
Shen, Y., Guan, L., Wang, D., and Gan, X. (2016). DNA barcoding and evaluation of genetic diversity in Cyprinidae fish in the midstream of the Yangtze River. Ecol. Evol. 6 (9), 2702–2713. doi:10.1002/ece3.2060
Sherzada, S., Khan, M. N., Babar, M. E., Idrees, M., Wajid, A., Sharif, M. N., et al. (2020). Identification of three cyprinidae family members through cytochrome oxidase I. Pak. J. Zool. 52 (1), 417–420. doi:10.17582/journal.pjz/2020.52.1.sc13
Simon, C., Franke, A., and Martin, A. (1991). “The polymerase chain reaction: DNA extraction and amplification,” in Molecular techniques in taxonomy. Editors G. M. Hewitt, A. Johnson, and J. P. W. Young (Berlin: Springer), 329–355.
Talwar, P. K., and Jhingran, A. G. (1991). Inland fisheries of India and adjacent countries.Vol.I& II. New Delhi: Oxford & IBH Publishing Company, 1–1158.
Ter Braak, C. J. F., and Verdonschot, P. F. M. (1995). Canonical correspondence analysis and related multivariate methods in aquatic ecology. Aquat. Sci. 57, 255–289. doi:10.1007/bf00877430
Thai, B. T., Si, V. N., Phan, P. D., and Austin, C. M. (2007). Phylogenetic evaluation of subfamily classification of the Cyprinidae focusing on Vietnamese species. Aquat. Living Resour. 20, 143–153. doi:10.1051/alr:2007025
Tsoupas, A., Papavasileiou, S., Minoudi, S., Gkagkavouzis, K., Petriki, O., Bobori, D., et al. (2022). DNA barcoding identification of Greek freshwater fishes. PloS one 17 (1), e0263118. doi:10.1371/journal.pone.0263118
Vishwanath, W., Lakra, W. S., and Sarkar, U. K. (2007). Fish of northeast India. Lucknow, India: National Bureau of Fish Genetic Resources.
Wahab, A., and Yousafzai, A. M. (2017). Quantitative attributes of family Sisoridae (Siluriformes) with a new record of Glyptothorax kashmirensis from River Panjkora, District Lower Dir, Khyber Pakhtunkhwa, PakistanThe BPP program for species tree estimation and species delimitation. J. Entomol. Zool. Stud. 5 (2), 741–745.
Wagle, S. K., Pradhan, N., and Shrestha, M. K. (2015). Morphological divergence of snow trout (Schizothorax richardsonii, Gray 1932) from rivers of Nepal with insights from a morphometric analysis. Int. J. Appl. Sci. Biotechnol. 3 (3), 464–473. doi:10.3126/ijasbt.v3i3.13123
Wani, I. F., Bhat, F. A., Balkhi, M. H., Shah, T. H., Shah, F. A., and Bhat, B. A. (2018). Study on Gonadosomatic index (GSI) during the three seasons (pre-spawning, spawning and post-spawning periods) of Schizothorax Niger Heckel in dal lake, Kashmir. J. Pharmacogn. Phytochem. 7 (6), 2131–2136.
Ward, R. D., Zemlak, T. S., Innes, B. H., Last, P. R., and Hebert, P. D. (2005). DNA barcoding Australia’s fish species. Philos. Trans. R. Soc. Lond. B Biol. Sci. 360, 1847–1857. doi:10.1098/rstb.2005.1716
Wickham, H., François, R., Henry, L., and Müller, K. (2022). Dplyr: A grammar of data manipulation. R package version 1.0.8. Available at: https://CRAN.R-project.org/package=dplyr.
Wu, Y. F., and Wu, C. Z. (1992). The fishes of the qinghai-xizang plateau (in Chinese). Chengdu, China: Sichuan Publishing House of Science & Technology.
Xiao, W., Zhang, Y., and Liu, H. (2001). Molecular systematics of xenocyprinae (teleostei: Cyprinidae): Taxonomy, biogeography, and coevolution of a special group restricted in EastAsia. Mol. Phylogenet. Evol. 18, 163–173. doi:10.1006/mpev.2000.0879
Xu, L., Lin, Q., Xu, S., Gu, Y., Hou, J., Liu, Y., et al. (2018). Daphnia diversity on the Tibetan Plateau measured by DNA taxonomy. Ecol. Evol. 8 (10), 5069–5078. doi:10.1002/ece3.4071
Yan, G. J., He, X. K., Cao, Z. D., and Fu, S. J. (2013). An interspecific comparison between morphology and swimming performance in cyprinids. J. Evol. Biol. 26, 1802–1815. doi:10.1111/jeb.12182
Yang, J. Q., Tang, W. Q., Liao, T. Y., Sun, Y., Zhou, Z. C., Han, C. C., et al. (2012). Phylogeographical analysis on Squalidusargentatus recapitulates historical landscapes and drainage evolution on the island of Taiwan and mainland China. Int. J. Mol. Sci. 13, 1405–1425. doi:10.3390/ijms13021405
Yang, L., Sado, T., Hirt, M. V., Pasco-Viel, E., Arunachalam, M., Li, J., et al. (2015). Phylogeny and polyploidy: Resolving the classification of cyprinine fishes (Teleostei: Cypriniformes). Mol. Phylogenet. Evol. 85, 97–116. doi:10.1016/j.ympev.2015.01.014
Yang, Z. (2015). The BPP program for species tree estimation and species delimitation. Curr. Zool. 61 (5), 854–865. doi:10.1093/czoolo/61.5.854
Keywords: fish diversity, Poonch River, Cyt b, 16S rRNA, validation, identification
Citation: Awas M, Ahmed I, Ahmad SM, Al-Anazi KM, Farah MA and Bhat B (2023) Integrative approach for validation of six important fish species inhabiting River Poonch of north-west Himalayan region (India). Front. Genet. 13:1047436. doi: 10.3389/fgene.2022.1047436
Received: 18 September 2022; Accepted: 29 November 2022;
Published: 04 January 2023.
Edited by:
Md Samsul Alam, Bangladesh Agricultural University, BangladeshReviewed by:
Asaduzzaman Md, Chattogram Veterinary and Animal Sciences University, BangladeshVindhya Mohindra, National Bureau of Fish Genetic Resources (ICAR), India
Copyright © 2023 Awas, Ahmed, Ahmad, Al-Anazi, Farah and Bhat. This is an open-access article distributed under the terms of the Creative Commons Attribution License (CC BY). The use, distribution or reproduction in other forums is permitted, provided the original author(s) and the copyright owner(s) are credited and that the original publication in this journal is cited, in accordance with accepted academic practice. No use, distribution or reproduction is permitted which does not comply with these terms.
*Correspondence: Imtiaz Ahmed, aW10aWF6YW11MUB5YWhvby5jb20=; Syed Mudasir Ahmad, bXVkYXNpcmJpb0BnbWFpbC5jb20=