 Yu Gao1†Chenchen Feng1†
 Yuexin Zhang1,2†
 Chao Song1,2†Jiaxin Chen1Yanyu Li1
 Ling Wei1Fengcui Qian1,2Bo Ai1Yuejuan Liu1
 Jiang Zhu1
 Xiaojie Su3*
 Chunquan Li1,2,4,5,6,7,8,9*
 Qiuyu Wang1,2,4,5,6,7*
- 1School of Medical Informatics, Harbin Medical University, Daqing, China
- 2The First Affiliated Hospital, Department of Cardiology, Hengyang Medical School, University of South China, Daqing, China
- 3College of Medical Laboratory Science and Technology, Harbin Medical University, Daqing, China
- 4The First Affiliated Hospital, Institute of Cardiovascular Disease, Hengyang Medical School, University of South China, Hengyang, China
- 5School of Computer, University of South China, Hengyang, China
- 6The First Affiliated Hospital, Cardiovascular Lab of Big Data and Imaging Artificial Intelligence, Hengyang Medical School, University of South China, Hengyang, China
- 7Hunan Provincial Base for Scientific and Technological Innovation Cooperation, University of South China, Hengyang, China
- 8General Surgery Department, Beijing Friendship Hospital, Capital Medical University, Beijing, China
- 9Guangxi Key Laboratory of Diabetic Systems Medicine, Guilin Medical University, Guilin, China
MicroRNAs (miRNAs) are small non-coding RNAs, which play important roles in regulating various biological functions. Many available miRNA databases have provided a large number of valuable resources for miRNA investigation. However, not all existing databases provide comprehensive information regarding the transcriptional regulatory regions of miRNAs, especially typical enhancer, super-enhancer (SE), and chromatin accessibility regions. An increasing number of studies have shown that the transcriptional regulatory regions of miRNAs, as well as related single-nucleotide polymorphisms (SNPs) and transcription factors (TFs) have a strong influence on human diseases and biological processes. Here, we developed a comprehensive database for the human transcriptional regulation of miRNAs (TRmir), which is focused on providing a wealth of available resources regarding the transcriptional regulatory regions of miRNAs and annotating their potential roles in the regulation of miRNAs. TRmir contained a total of 5,754,414 typical enhancers/SEs and 1,733,966 chromatin accessibility regions associated with 1,684 human miRNAs. These regions were identified from over 900 human H3K27ac ChIP-seq, ATAC-seq, and DNase-seq samples. Furthermore, TRmir provided detailed (epi)genetic information about the transcriptional regulatory regions of miRNAs, including TFs, common SNPs, risk SNPs, linkage disequilibrium (LD) SNPs, expression quantitative trait loci (eQTLs), 3D chromatin interactions, and methylation sites, especially supporting the display of TF binding sites in the regulatory regions of over 7,000 TF ChIP-seq samples. In addition, TRmir integrated miRNA expression and related disease information, supporting extensive pathway analysis. TRmir is a powerful platform that offers comprehensive information about the transcriptional regulation of miRNAs for users and provides detailed annotations of regulatory regions. TRmir is free for academic users and can be accessed at http://bio.liclab.net/trmir/index.html.
Introduction
MicroRNAs (miRNAs) are single-stranded small molecular RNAs, 21–23 bases in size produced by Dicer processing of single-stranded RNA hairpin loop precursors. As non-coding RNAs with regulatory functions, miRNA participate in various biological processes, including the development, organ formation, cell proliferation, differentiation, and fat metabolism (Inui et al., 2010; Li et al., 2018; Wang et al., 2018). For example, nuclear miR-122 can directly regulate survival via the regulation of miR-21 at the posttranscriptional level (Wang et al., 2018). In recent years, more abundant miRNA-related evidence has provided further insights into miRNAs and shown that some miRNAs were associated with various diseases such as cancers (Esquela-Kerscher and Slack, 2006; Shi et al., 2007; Sylvestre et al., 2007; Siva et al., 2009; Sun et al., 2009; Yang et al., 2013; Rupaimoole and Slack, 2017). Significant progress has been made in identifying miRNA targets and their association with cancers and diseases (Li et al., 2014; Georgakilas et al., 2016; Li et al., 2018; Palmieri et al., 2018; Wu et al., 2019). It is worth noting that miRNAs are often regulated by related super- or typical enhancers in addition to promoters (Duan et al., 2016; Suzuki et al., 2017; Sin-Chan et al., 2019; Ri et al., 2020). Typical enhancers, such as distal cis-regulatory DNA elements positively participate in the regulation of genes in a tissue-specific manner (Shlyueva et al., 2014). Super-enhancers (SEs) are emerging as clusters of enhancers that are densely occupied by master regulators and mediators and are thought to act as switches to determine the cell identity and fate (Hnisz et al., 2013; Whyte et al., 2013). From previous literature-based reviews, we found that typical enhancers/SEs could regulate the adjacent miRNAs (Matsuyama and Suzuki, 2019). For example, via integrated analysis of the potential connection between SEs and miRNAs, Young et al. found that SEs were related to many miRNAs and master transcription factors (TFs), and they reported on the relationship between SE-miRNAs and cancers (Suzuki et al., 2017). The transcription of miR-146a and miR-155, driven by SEs, in turn downregulates both in vitro and in vivo canonical inflammatory genes expression by targeting inflammatory mediators (Duan et al., 2016). Ri et al. found that the overexpression of miR-1301 induced by the Klf6 SE could lead to significant inhibition of proliferation in human hepatoma HepG2 cells (Ri et al., 2020). In addition, recent studies have suggested that single-nucleotide polymorphisms (SNPs) within enhancers could affect TF binding sites in the regulation of diseases (Izzi et al., 2016; Liu et al., 2017). A possible role for the epigenetic regulation in regulating miRNA expression has also been reported by some researchers (Ramassone et al., 2018; Yao et al., 2019). Epigenetic regulation includes DNA methylation and chromatin/histone modifications, all of which can participate in regulating miRNA expression. Some studies have shown that over 100 miRNAs were epigenetically regulated in different cancers, and the methylation frequency of human miRNA genes appeared to be much higher than that of protein-coding genes (Weber et al., 2007; Kunej et al., 2011). Consistent with these findings, researchers have found that miRNA genes frequently overlapped not only the cancer-associated genomic regions but also the CpG islands (Calin et al., 2004; Morales et al., 2017). One study showed that epigenetic modifications within mir290 enhancers dynamically altered switching, resulting in cell-to-cell heterogeneity (Song et al., 2019). Zhao et al. highlighted how chromatin states directed miRNA-mediated network motifs by integrating the epigenome and regulatome (Zhao et al., 2016). All of this evidence emphasizes the importance of integrating and calculating miRNA-related transcription regions and the regulation of genes within these regions (epi).
Many miRNA databases have been built, such as HMDD (Li et al., 2014), IMOTA (Palmieri et al., 2018), DIANA-miRGen v3.0 (Georgakilas et al., 2016), piRTarBase (Wu et al., 2019), DIANA-TarBase (Vlachos et al., 2015), mirDIP (Tokar et al., 2018), TFmiR (Hamed et al., 2015), mirTrans (Hua et al., 2018), and TransmiR v2.0 (Tong et al., 2019). However, these existing databases only support a small amount of genetic data and annotation information within miRNA promoter regions. They ignore the importance of information within the transcriptional regulatory regions (especially the typical enhancer/SE/chromatin accessibility regions of miRNAs). With the development of next-generation sequencing technology, we can obtain more H3K27ac and ChIP-seq data, which can be used to identify typical enhancers, SEs, and more ATAC-seq data, and this can be used to identify chromatin accessibility regions. Consequently, there is an urgent need to integrate and process existing resources to establish a database that contains more comprehensive information about the transcriptional regulation of miRNAs.
Based on the earlier analysis, we established a database which could provide more comprehensive transcriptional regulatory information and annotation information for miRNAs. First, we collected as many samples as possible and used process frameworks to identify miRNA regulatory regions from more than 900 ATAC-seq, H3K27ac ChIP-seq, and DNase-seq samples. Furthermore, in order to enable researchers to further understand the transcriptional regulatory mechanisms of miRNAs, we provided more detailed annotation information about the transcriptional regulatory regions of miRNAs, such as TFs collected by ChIP-seq or predicted by FIMO (Grant et al., 2011) and methylation sites from multiple sources and other regions. In addition, TRmir provided additional information about miRNAs including miRNA-related diseases, extensive pathway analysis, and miRNA expression. It can be seen from Table 1 that our database was far superior to other databases in both the number of transcriptional regulatory entries and annotation information. In conclusion, TRmir was a human miRNA transcriptional regulation database, which integrated data storage, friendly interface query, detailed annotation, online analysis, and other functions.
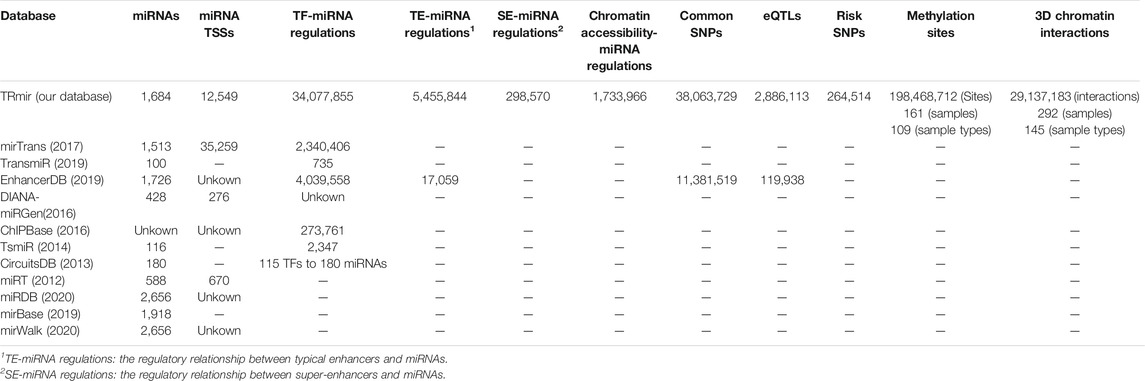
TABLE 1. Summary of the contents of TRmir and other comparable databases.
Database Content and Methods
Identification of Transcription Regulatory Regions
Because the primary miRNA transcription product (pre-miRNA) is cleaved into a precursor miRNA by RNase Drosha in the nucleus (Hamed et al., 2015), the mechanisms underlying miRNA transcription are unclear due to the lack of experimental methods for detecting miRNA transcription start sites (TSSs) with high resolution. Thanks to the recent development of high-throughput deep sequencing techniques, the identification of miRNA TSSs has become more accurate (Consortium et al., 2014). Aiming to more accurately identify miRNA promoter regions, we integrated TSSs from miRbase (Griffiths-Jones et al., 2008) and microTSS, which can provide highly accurate TSSs for miRNAs (Georgakilas et al., 2014). Importantly, we applied microTSS as the first algorithm on sequenced RNA-, ChIP-, and DNase-Seq data. Finally, we obtained 12,549 TSSs for 1,684 miRNAs. We obtained the promoter region by extending the upstream and downstream sequences from the transcription start site (e.g., 5 kb/1 kb). Moreover, we integrated the details of miRNAs by referring to miRBase (Griffiths-Jones et al., 2008) and DIANA-miRGen v3.0 databases (Georgakilas et al., 2016). For the sake of version uniformity, we used the liftOver tool of UCSC (Fujita et al., 2011) to convert the genomic locations of miRNAs.
We collected H3K27ac, ChIP-seq, and ATAC-seq data of various samples from public databases. Following a unified and standardized analysis process, we identified the DNA regulatory elements of all samples, including SEs, enhancers, and chromatin accessibility regions. Aiming to identify typical enhancer/SE regions, we collected H3K27ac ChIP-seq sequencing data from hundreds of different tissues/cells in multiple databases such as NCBI GEO/SRA (Barrett et al., 2011), Roadmap (Bernstein et al., 2010), ENCODE (Consortium, 2012), and GGR (Figure 1; Supplementary Table S1) (Lovén et al., 2013). We used Bowtie (Langmead et al., 2009; Fujita et al., 2011; Hnisz et al., 2013) to align the reads to the reference genome. Next, we used MACS (v1.4.2) (Zhang et al., 2008) with the command “macs14 -p 1e-9 -w -S --keep-dup = auto–wig--single-profile --space = 50” to further identify the enrichment information of H3K27ac, including peak position information and credibility. Finally, we used ROSE (Lovén et al., 2013) to identify SEs. In the recognition process, we stitched together the enhancers with a range of 12.5 kb and then sorted them according to the signal strength. We distinguished the threshold between SEs and enhancers based on the signal value obtained from the tangent point of the tangent with a slope of 1. DNase-seq and ATAC-seq (Meyer and Liu, 2014) as the more popular sequencing technologies were used for the identification of chromatin accessibility regions. For DNase-seq data, we obtained 290 DNase-seq samples of various cells/tissues from ENCODE (Consortium, 2012), Roadmap (Bernstein et al., 2010), and Cistrome (Mei et al., 2017). ATAC-seq data were a valuable resource for the systematic investigation of gene regulatory processes and supplied a wealth of information on the susceptibility, mechanisms, prognosis, and potential therapeutic strategies of diverse cancer types (Meyer and Liu, 2014). ATAC-seq is a sequencing method that uses Tn5 transposase to capture open regions in nuclear genomic DNA. We manually collected 128 ATAC-seq samples bed files from publicly available human ATAC-seq datasets in three resources including Cistrome (Mei et al., 2017), NCBI (Barrett et al., 2011), and TCGA (Corces et al., 2018) (Supplementary Table S2). The Python script GeneMapper.py from ROSE was used to predict the related regions using three different strategies. It is worth noting that these regions have been shown to loop with neighboring genes (Suzuki et al., 2017). All pipelines were written using the RefSeq (GRCh37/hg19) human gene annotations. Finally, we obtained 5,754,414 typical enhancers/SEs and 1,733,966 chromatin accessibility regions associated with miRNAs.
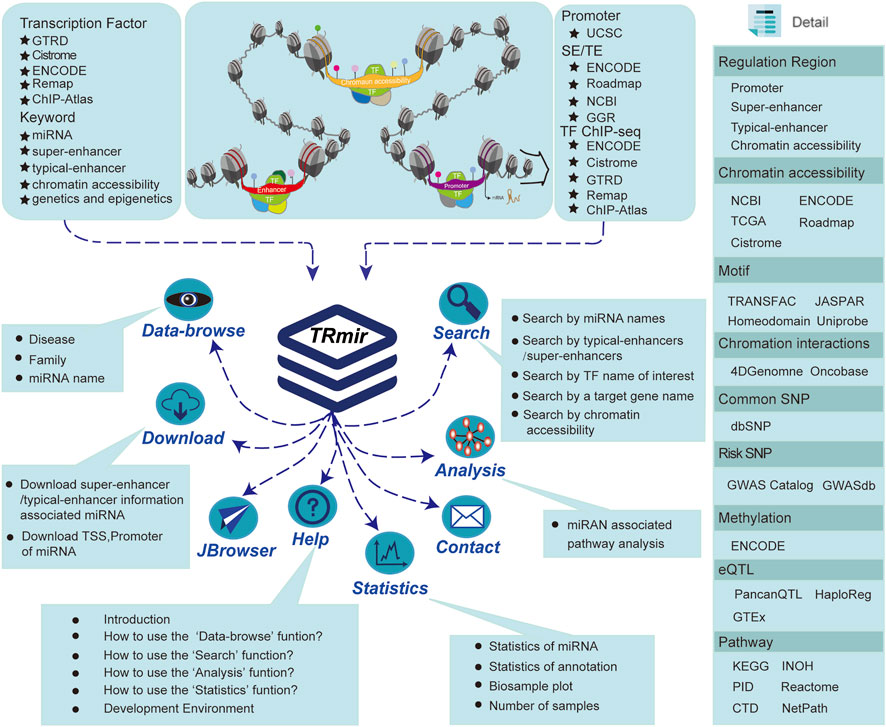
FIGURE 1. Database introduction. Our database provides the most abundant information about human miRNA regulation. In addition to providing four regulatory regions, we also collected a large quantity of raw data from a variety of resources in order to provide more comprehensive regulation and annotation information. TRmir is a database platform integrating storage, visualization, analysis, and friendly query.
Annotation of Related Regulatory Regions
In order to further explore the function of miRNAs, we provided detailed annotation information for each transcriptional regulatory region of miRNAs. First, we obtained more than 7,000 ChIP-seq datasets of 952 TFs from ENCODE (Consortium, 2012), Cistrome (Mei et al., 2017), Remap (Chèneby et al., 2018), ChIP-Atlas, and GTRD (Yevshin et al., 2017). Each database carried out strict quality control on ChIP-seq data. And then the liftOver tool of UCSC was used to convert these peak datasets to the latest genome assemblies, and regions that failed to transfer were discarded. We obtained over 3,000 DNA-binding motifs for ∼700 TFs, which were collected from JASPAR CORE 2014 vertebrates (Mathelier et al., 2014), Jolma 2013 (Jolma et al., 2013), homeodomains (Berger et al., 2008), UniPROBE (Robasky and Bulyk, 2011), and Wei 2010 (Wei et al., 2010). At the same time, the FIMO (Grant et al., 2011) with the command “fimo -verbosity 1 —thresh 1e-6” from the MEME suite (Bailey et al., 2009) was used to scan the sequences for inferred motifs. In addition, we downloaded 450 K methylation array data and whole-genome shotgun bisulfite sequencing data from ENCODE (Consortium, 2012). Finally, we obtained 198,468,712 methylation sites in total. We used beta values as the metric to measure the level of methylation. Furthermore, we used BEDTools (v2.25.0) with the command “bedtools intersect -a a. bed -b b.bed” and set all the allowed overlap fractions from BEDtools intersect defaults to 1 bp (Quinlan and Hall, 2010) in order to identify the methylation sites, which overlapped the transcriptional regulatory regions of miRNAs.
Second, we obtained common SNPs from dbSNP (Sherry et al., 2001) and calculated the SNPs with a minimum allele frequency over 0.05 by using VCFTools (v0.1.13) (Danecek et al., 2011). Finally, we obtained 38,063,729 common SNPs. At the same time, we calculated LD SNPs (r2 = 0.8) for the five superpopulations, which contained South Asian, European, East Asian, Ad Mixed American, and African populations by using plink (v1.9) (Purcell et al., 2007). In addition, we collected over 260,000 risk SNPs from the GWAS catalog (Welter et al., 2014) and GWASdb v2.0 (Eicher et al., 2015). We also obtained over 2,886,000 human eQTLs and 31,080,000 eQTL-gene pairs from GTEx v5.0 (Carithers and Moore, 2015), HaploReg (Ward and Kellis, 2012), and PancanQTL (Gong et al., 2018). Finally, in order to validate the regulatory relationships predicted by our database, we directly downloaded 179 samples of Hi-C and ChIA-PET in BED file format from 4DGenome (Teng et al., 2016) and OncoBase (Li et al., 2019) (Supplementary Table S3).
Functional Annotations of miRNAs
Aiming to facilitate researchers who wish to perform a systematic investigation of the transcriptional regulation of miRNAs, we provided additional miRNA information, including the expression of miRNAs from multiple cancers, miRNA-related diseases, and pathway analysis. In order to assist users in obtaining the expression value of miRNAs in different cancers, we downloaded the matrix expression data of 33 types of cancers and pan-cancers, respectively (Corces et al., 2018). The miRNA target gene data were extracted from miRTarBase (Hsu et al., 2011) and were subsequently manually curated based on a high-accuracy text-mining system and aims to accumulate experimentally validated miRNA–target interactions (MTIs). We collected a large quantity of miRNA–disease–related information from HMDD v3.0 (Li et a0l., 2014), including the associated disease name, the confirmed literature PubMed ID, and the description.
Identification of miRNA Upstream Pathways
In order to better understand the regulation mechanism of miRNA, we provided analysis functions for pathways that regulated miRNAs. Therefore, we collected 2,880 pathways and related information from our previous work ComPAT (Su et al., 2021). When users submit an miRNA, we first identify the relevant TFs that regulate the miRNA. Then, we use those TFs for pathway enrichment and obtain significantly enriched pathway information related to the miRNA by using the hypergeometric test (Quinlan and Hall, 2010; Li et al., 2013; Feng et al., 2016). We calculated the p-value for significant enrichment using the following formula:
We then used the phyper function to realize the calculation of Eq. 1 using x as the number of genes involved in the pathway, s as the number of genes of interest, n as the total number of genes in the pathway, and k as the number of intersections between the genes in the pathway and the genes input by the user.
Results
Introduction to Database Usage
Users can search for the transcriptional regulatory information of miRNAs by five approaches, including “search by miRNA name(s) of interest,” “search by typical enhancer/super-enhancer” [input genomic position, sample], “search by TF name of interest,” “search by a target gene name,” and “search by chromatin accessibility” [input genomic position, sample] (Figure 2A–C). Users can obtain brief summary information of search results in a table (Figure 2E). The statistics in the table describe the genetic annotation of the three regions (Figure 2D). If users want to obtain more information about miRNA, they can click the “miRNA name” (Figure 2F). Users will then quickly see the general information about miRNA including the miRNA name, accession, mature sequence, miRNA family, precursor ID, and genome context. In addition to the general details, the network diagram intuitively and vividly shows not only the regulatory relationships among miRNAs (dark blue nodes), TFs (green nodes), and SEs (red nodes) but also the pathway name (yellow nodes) and target gene (light blue nodes) associated with miRNA (Figure 2F). At the same time, TRmir can provide information about the different regulatory regions of miRNA including, I: promoter (genomic position, TSS, and cell); II: SE/typical enhancer (enhancer ID, genomic position, element, size, rank, ChIP density, and is super, sample ID); and III: chromatin accessibility (genomic position, sample name, and source). We also provided more detailed annotation information for the three regulatory regions mentioned before including common SNPs, risk SNPs, eQTLs, TFs, and methylation sites (450 K array, whole-genome shotgun bisulfite sequencing), histone modifications, and 3D chromatin interactions (Figure 2F). For example, when users click the “Risk SNP” button within the SE region, TRmir can provide SNP ID, SNP position, gene, disease, type, and p-value for risk SNPs (Figure 2F). In the “Histone” module of the enhancer region, users can obtain the CHR, start, end, biosample type, biosample name, and source for the histone associated with the enhancer region (Figure 2F). When users input hsa-mir-23a and click the “motif” button within the SE region, TRmir can show the motif sequence, the source of DNA-binding motifs, TF name, and TF region (Figure 2F). As an example, when users input hsa-mir-23a (sample type: tissue, tissue: lung, sample name: lung; Figure 2F), they can find that the relationship between miRNA and the promoter was validated by chromatin interaction data from the “Interaction” module. Importantly, genome-wide identification, detailed annotation, and regulatory relationships of different regulatory regions are cell type-specific. Therefore, if users want to see different sample settings on the details page, they can customize the filter by clicking the sample option located in the middle of the page (Figure 2F). TRmir also provides additional information including miRNA expression, associated diseases, and target genes.
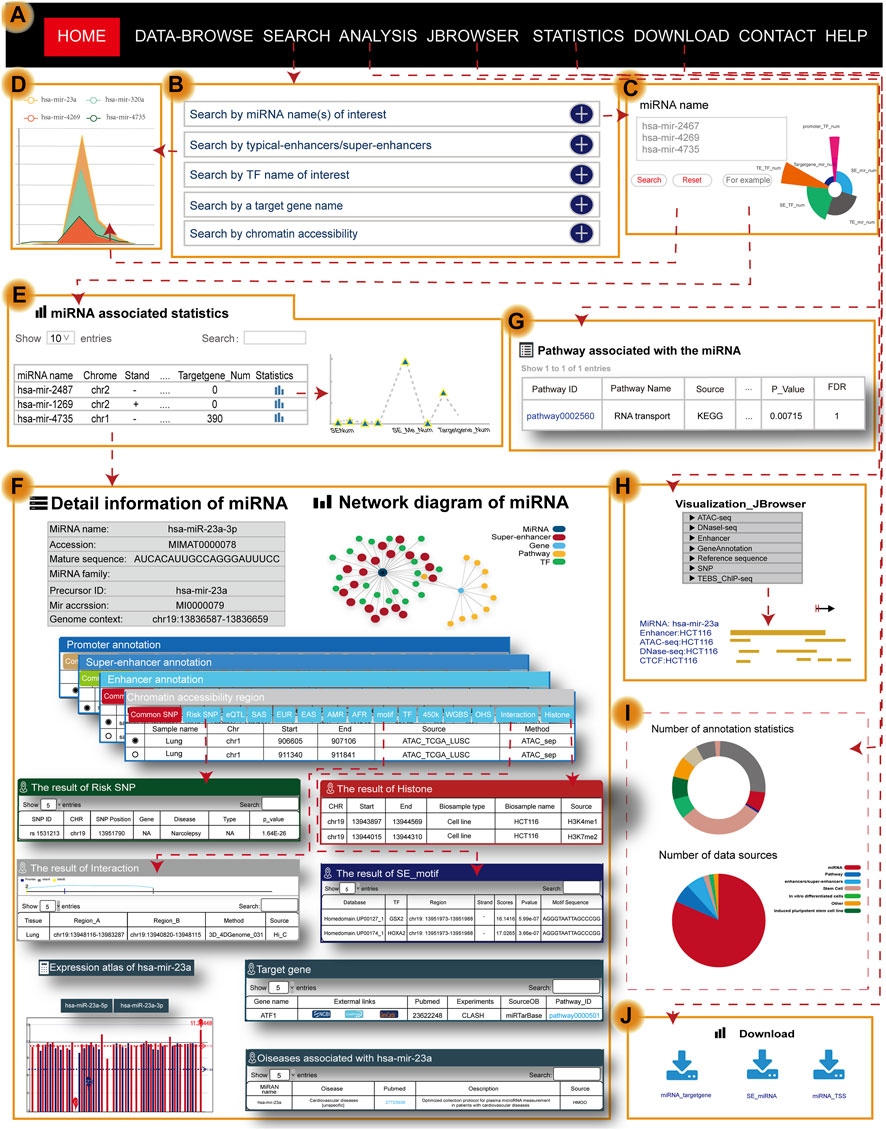
FIGURE 2. Main functions and usage of TRmir. (A) The navigation bar of TRmir. (B) Five query methods: “Search by miRNA name(s) of interest,” “Search by typical enhancer/super-enhancer,” “Search by TF name of interest,” “Search by a target gene name,” and “Search by chromatin accessibility.” (C) Advanced search is initiated by inputting the miRNA name(s) of interest. (D) Figure display of statistics associated with the miRNAs. (E) The table displays the statistics for the detailed (epi)genetic information of different regulatory regions. (F) Detailed information about the miRNA: general information about the miRNAs and target genes, the expression of each miRNA, and mean values for each sample, diseases associated with the miRNA and detailed genetic annotations. (G) Pathway analysis: detailed information from the pathway analysis. (H) Visualization of JBrowser. (I) Statistics of TRmir. (J) Download page of TRmir.
Online Analysis Tools
To help users interactively analyze and understand the roles of miRNAs and their regulatory mechanisms in humans, TRmir provides miRNA pathway analysis. TRmir can identify TFs, which are downstream from the pathways binding to the related regions of miRNA. When users search the database by an miRNA name, TRmir can return those significantly enriched pathways using the hypergeometric test. The pathway analysis of miRNAs should greatly facilitate the study of regulatory mechanisms. The results table returns the enriched pathways and the related detailed information list. From the list, the user can obtain the pathway ID, pathway name, source, annotated gene of enrichment, annotated gene number, FDR, and p-value of the enrichment score (Figure 2G). If users want to obtain more information about the pathway, they can click the “Pathway ID” to jump to the detailed information page.
User-Friendly Data Visualization and Personalized Genome Browser
To allow users to quickly browse data, we used bootstrap technology to develop a friendly interface for users to browse. Furthermore, users can automatically select items to browse by selecting “Family” and “Disease” from the navigation bar on the left. Users can easily click the “miRNA name” to further understand the transcriptional regulatory information for miRNA. For better visualization of information in the genome, we used a plugins named JBrowse (Figure 2H), which is compatible with browsers and built on JavaScript and HTML5 (Buels et al., 2016). Furthermore, TRmir also provides graphic visualization of chromatin interactions, quantitative statistics of annotation information within regulatory regions, and especially supports the relationship between TFs and miRNAs.
Data Download and Statistics
Users can quickly download the file of interest by clicking the corresponding icon links (Figure 2J). The “Statistics” page on the website of TRmir provides a detailed statistical table of the miRNA transcriptional regulatory regions and annotation information (Figure 2I).
Website Design and Development
We used MYSQL 5.7.17 for storage of the website, a lightweight database management system run on a Linux-based Web server. The website was built based on CSS3, PHP 8.0, and HTML5 frameworks, D3 (https://d3js.org), ECharts, and Highcharts. Aiming to facilitate browsing by users, we used Bootstrap v3.3.7 and JQuery v2.1.1 to design a friendly visual interface. At the same time, JBrowse was built for the visualization of data.
Case Study
To further validate the value of using TRmir, we took the small non-coding RNA hsa-mir-31 as an example, which is associated with colon cancer (Figure 3A). To validate the search results of our database, we collected experimental data from high quality journal literature (Suzuki et al., 2017). When users search the miRNA name by inputting hsa-mir-31, the results page first shows the statistics of hsa-mir-31 (Figure 3B). Notably, detailed information about hsa-mir-31 can be obtained by clicking the “miRNA name” to view the miRNA-enhancer-gene network and detailed annotation information within transcriptional regulatory regions in HCT116 cells (sample type: cell line, tissue: colon, sample name: HCT116; Figure 3C). From the “super-enhancer region” of TRmir, we found 22 SEs associated with hsa-mir-31 and 14 out of 22 SEs completely overlapped with the results of a study by Richard A Young (Suzuki et al., 2017). In the “super-enhancer region,” we found the sample_01_03400028 in the SE of hsa-mir-31, which was reported to show that the changes of SEs affect the progression of cancer (Suzuki et al., 2017). Moreover, hsa-mir-31 with gain of a SE in colon cancer cells displayed an increased prognostic value relative to miRNAs with SE loss (Suzuki et al., 2017). To summarize, our database on the transcriptional regulation of miRNAs provided a new insights for deeply understanding the transcriptional regulatory mechanism of miRNAs.
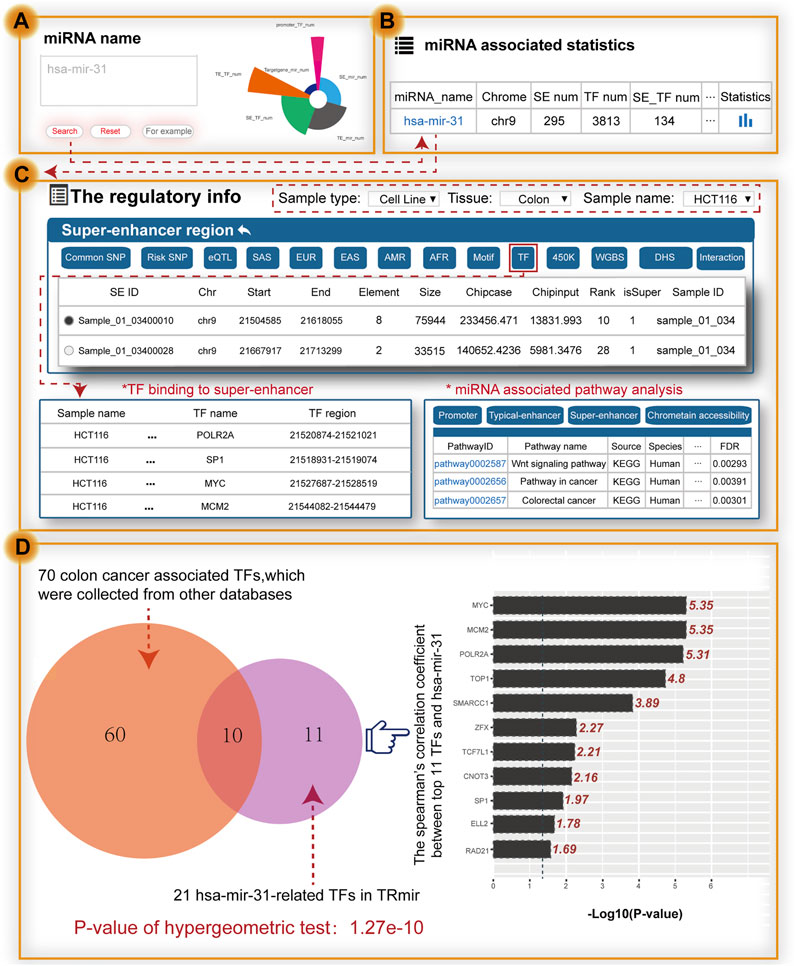
FIGURE 3. Main functions and usage of TRmir. Relevant validation results were obtained by inputting hsa-mir-31. (A) Search by miRNA. (B) Brief statistics on genetic annotation of hsa-mir-31. (C) From the perspective of the SE region shown on the details page for hsa-mir-31, we can obtain detailed information about pathway analysis, and TFs enriched in the regulatory regions. (D) Analysis of hsa-mir-31–related TFs. These related TFs are enriched in the related regulatory regions. The right panel shows the calculation results for Spearman’s coefficient (p-value = 0.05, the −logP-value cutoff value is 1.301).
The relationship between SEs and TFs is important for the study of regulatory mechanisms. When we click the button named “TF,” TRmir shows hsa-mir-31-associated TF binding sites within the regulatory regions. We found that these 21 hsa-mir-31–related TFs were highly consistent with colon cancer–related TFs, such as APC, ARID1A, MCM2, MYC, TCF3, TP53, SP1, and TOP1, which were collected from DisGeNET (Piñero et al., 2017) and PTMD (Xu et al., 2018). For example, oncogenic MYC expression has been reported to be promoted by WNT signaling and AHCTF1 through SE-mediated gene gating and to increase the rate of colon cancer cell proliferation (Perdikopanis et al., 2021). We also found that TF ELL2, not reported in existing studies, was associated with colon cancer. We used the expression data of colon adenocarcinoma (COAD) from TCGA to calculate Spearman’s correlation coefficient, with the aim of further exploring the relationship between the expression of 21 TFs and hsa-mir-31 (Figure 3D). According to the results of the calculations, most of the TFs aforementioned were closely related. Furthermore, we used the TFs to identify hsa-mir-31-associated pathways in TRmir for pathway downstream analysis. From the results of the analysis, we can see that three pathways including the “Wnt signaling pathway” and the “colorectal cancer pathway” were significantly enriched. We have provided this example to help users understand how to use TRmir. The interaction of TFs and hsa-mir-31 associated with colorectal cancer indicated the utility of our database.
Similarly, as another example, we used the miRNA named “hsa-let-7b” as the input for “Search by miRNA name(s) of intersect.” hsa-let-7b was significantly enriched in human pericardial fluid, and enhanced expression of hsa-let-7b has been experimentally linked to cardiovascular disease (Beltrami et al., 2017). On the results page, users first obtained the “Detail information of miRNA.” After clicking the “miRNA name,” TRmir provided the network diagram of hsa-let-7b and regulatory information about hsa-let-7b. When we set the sample name as the heart left ventricle (sample type: tissue, tissue: heart left ventricle, sample name: heart left ventricle), we could find an SE named the “sample_00_01400330” from the “Super-enhancer region.” When users clicked the “TF” button in the “Super-enhancer region,” we found that GATA4 occupied the hsa-let-7b related SE region. GATA4 played an important role in heart development, cardiomyocytes, and cardiovascular disease, and has been extensively studied (Heikinheimo et al., 1994; Molkentin et al., 1997). For example, Ang et al. provided the regulatory landscape regarding GATA4 in human cardiac development and function. GATA4 widely co-occupied the cardiac SEs which cause dysregulation of genes, leading to cellular dysfunction in human cardiomyocytes (Ang et al., 2016). More importantly, in the section “Diseases associated with hsa-let-7b,” hsa-let-7b was associated with cardiovascular disease. These results demonstrated the availability and biological value of using TRmir for miRNA research (Supplementary Figure S1).
Discussion
miRNAs are important small non-coding RNAs, which play important roles in the transcriptional regulation of biological processes. The regulation of miRNAs is associated with various regulatory regions and not just the promoters. With the development of second-generation sequencing, additional H3k27ac ChIP-seq and ATAC-seq data have become available. It is important to establish a database, which contains a comprehensive listing of transcriptional regulatory regions and extensive genetic annotations. In recent years, many popular databases including mirTrans (Hua et al., 2018), TransmiR (Tong et al., 2019), miRTarBase (Hsu et al., 2011), HMDD (Li et al., 2014), DIANA-TarBase (Vlachos et al., 2015), and DIANA-miRGen (Georgakilas et al., 2016) have been published to aid researchers in exploring the valuable resources pertaining to miRNAs. For example, miRTarBase (Chou et al., 2018) and DIANA-TarBase (Karagkouni et al., 2018) are miRNA target gene databases supported by experimental data. In addition, miRDB (Chen and Wang, 2020) and mirWalk (Sticht et al., 2018) are both online databases for miRNA target prediction with machine learning methods. The miRBase (Griffiths-Jones et al., 2006) database is a searchable database of published miRNA sequences and annotations. To improve the understanding of miRNAs some databases have been established, which describe the relationship between miRNAs and diseases. HMDD (Huang et al., 2019), as one of the more popular ones, is a manually collected miRNA and a disease-related database. However, compared to the abundance of miRNA target databases and miRNA–disease databases, resources describing TF-miRNA regulatory relationships are limited. Therefore, additional databases about miRNA transcription have been constructed to provide information about the TF-miRNA regulation, such as DIANA-miRGen v3.0 (Perdikopanis et al., 2021) and CircuitsDB (Friard et al., 2010). mirTrans (Hua et al., 2018) and TransmiR v2.0 (Tong et al., 2019) are both resources for the transcriptional regulation of miRNAs in human cell lines. In particular, TransmiR, which manually collected 2,852 TF-miRNA entries from 1,045 publications, has been upgraded to version 2.0. Until now, only one database named EnhancerDB (Kang et al., 2019) has provided a small amount of data on regulatory relationships between enhancers and miRNAs, but it is not very comprehensive (Table 1). All of the databases aforementioned have made great contributions to miRNA studies, but these studies and databases have only emphasized the importance of small genetic annotations of miRNAs (Li et al., 2014; Zhao et al., 2016; Song et al., 2019). None of these resources were developed to provide the transcriptional regulatory regions for miRNAs and genetic annotations were also ignored. However, studies have now increasingly indicated that important factors affecting the miRNA transcriptional regulation are not only associated with promoter regions but also with other regions such as chromatin accessibility regions and super- or typical enhancers, which play an important role in transcriptional processes of miRNAs (Duan et al., 2016; Suzuki et al., 2017; Sin-Chan et al., 2019; Ri et al., 2020). Therefore, we developed the TRmir database, which can provide more comprehensive resources for understanding the regulatory mechanisms of miRNAs. Compared with existing databases, TRmir allows researchers to easily obtain information about different regulatory regions. From Table 1, we can find the major differences between TRmir and other databases, especially in terms of the number of some terms, such as miRNAs, enhancers, TSS, and open chromatin regions. Furthermore, it provides the most abundant annotation information for the above regulatory regions. We compared the regulatory relationship between TF and miRNA in TRmir with the experimentally validated regulatory relationship in Transmir. We found that most of the TF-miRNA regulatory relationships in TRmir significantly overlapped with those in TransmiR. For example, GATA1-miRNA regulations in TRmir are significantly enriched in GATA1-miRNA regulations from TransmiR (hypergeometric test; p-value = 2.95e-14). The p-value of the hypergeometric test for NFYB-miRNA is 1.26e-78 (Supplementary Figure S2; Supplementary Table S4). The result indicated that the TF-miRNA regulations in our database are reliable and robust. Finally, in addition to miRNA-related expression and target genes, pathway analysis was also provided.
Our motivation to build this database comes from the huge demand of geneticists and biologists to understand the regulatory mechanism of miRNAs. The current version of TRmir stores the most abundant comprehensive transcriptional regulatory information and (epi)genetic annotations of human miRNAs. We believe our database will be useful, but it does have some limitations. For example, a ranking metric would be useful for the user because there is likely to be a daunting amount of information coming from most searches. The implementation of a score may help users focus on specific miRNAs. Therefore, in future versions, we plan to provide a ranking metric such as a score to combine expression, TF hits, accessibility, SE annotation, motif presence, interaction, and other data.
Conclusion
TRmir aims to provide a resource with the most informative transcriptional regulatory regions for miRNAs, and detailed annotation information within the regions. In order to facilitate deeper understanding of the transcriptional regulation of miRNAs, we have provided a large amount of annotation information located in the regulatory regions. In particular, we have provided the TFs that are obtained by two methods: TFs supported by ChIP-seq technology and TFs predicted by motif. In addition, we also provide information regarding methylation sites, one based on 450 K array data and the other based on whole-genome shotgun bisulfite sequencing. At the same time, TRmir integrates miRNA expression and related disease information and supports extensive pathway analysis. TRmir has a friendly interface to provide a good user experience and is convenient for users to query and browse, especially as it provides a comprehensive transcriptional regulation database of miRNAs for users with detailed regulatory annotation about these regions.
Data Availability Statement
The datasets presented in this study can be found in online repositories. The names of the repository/repositories and accession number(s) can be found in the article/Supplementary Material.
Author Contributions
YG, CF, and JC contributed to methodology, software, data curation, resources, data processing, visualization, writing—original draft, and development of database. YZ helped with data curation and revision of articles. YL and CS involved in software, resources, and data curation. LW helped with data curation and formal analysis. FQ contributed to data curation and formal analysis. BA and YL assissted with writing—review editing and project administration. JZ and QW contributed to drawing revision of articles. CL acquired funding and supervised the study. XS helped with supervision and conceptualization. All authors read and approved the final manuscript version.
Funding
This work was supported by the National Natural Science Foundation of China (62171166); Research Foundation of the First Affiliated Hospital of University of South China for Advanced Talents; Open project of the Key Laboratory of Myocardial Ischemia of the Ministry of Education (KF202005); Fundamental Research Funds for the Provincial Universities (JFQN202105); Guiding Science and Technology Plan Project of Daqing (zdy-2020-46); Joint Funds of the Natural Science Foundation of Heilongjiang Province of China (LH 2021F044); Wu liande Youth Training Fund of Harbin Medical University (JFWLD202001); Innovative Young Talents Training Scheme for tertiary institutions of Heilongjiang Province (UNPYSCT-2020164); Health Council Research Program of Heilongjiang Province (2019-075); National Natural Science Foundation of China (62001145); the Open Project of Centre of Diabetic Systems Medicine, Guangxi Key Laboratory of Excellence, Guilin Medical University; and Harbin Medical University Daqing Campus Scientific Research and Innovation Team Construction Project (HD-CXTD-202002).
Conflict of Interest
The authors declare that the research was conducted in the absence of any commercial or financial relationships that could be construed as a potential conflict of interest.
Publisher’s Note
All claims expressed in this article are solely those of the authors and do not necessarily represent those of their affiliated organizations, or those of the publisher, the editors, and the reviewers. Any product that may be evaluated in this article, or claim that may be made by its manufacturer, is not guaranteed or endorsed by the publisher.
Acknowledgments
We acknowledge International Science Editing (http://www.internationalscienceediting.com) for editing this manuscript and mirBase, TransmiR, and other databases or literature for freely providing data.
Supplementary Material
The Supplementary Material for this article can be found online at: https://www.frontiersin.org/articles/10.3389/fgene.2022.808950/full#supplementary-material
References
Ang, Y.-S., Rivas, R. N., Ribeiro, A. J. S., Srivas, R., Rivera, J., Stone, N. R., et al. (2016). Disease Model of GATA4 Mutation Reveals Transcription Factor Cooperativity in Human Cardiogenesis. Cell 167 (7), 1734–1749. doi:10.1016/j.cell.2016.11.033
Bailey, T. L., Boden, M., Buske, F. A., Frith, M., Grant, C. E., Clementi, L., et al. (2009). MEME SUITE: Tools for Motif Discovery and Searching. Nucleic Acids Res. 37, W202–W208. doi:10.1093/nar/gkp335
Barrett, T., Troup, D. B., Wilhite, S. E., Ledoux, P., Evangelista, C., Kim, I. F., et al. (2011). NCBI GEO: Archive for Functional Genomics Data Sets--10 Years on. Nucleic Acids Res. 39, D1005–D1010. doi:10.1093/nar/gkq1184
Beltrami, C., Besnier, M., Shantikumar, S., Shearn, A. I. U., Rajakaruna, C., Laftah, A., et al. (2017). Human Pericardial Fluid Contains Exosomes Enriched with Cardiovascular-Expressed MicroRNAs and Promotes Therapeutic Angiogenesis. Mol. Ther. 25 (3), 679–693. doi:10.1016/j.ymthe.2016.12.022
Berger, M. F., Badis, G., Gehrke, A. R., Talukder, S., Philippakis, A. A., Peña-Castillo, L., et al. (2008). Variation in Homeodomain DNA Binding Revealed by High-Resolution Analysis of Sequence Preferences. Cell 133 (7), 1266–1276. doi:10.1016/j.cell.2008.05.024
Bernstein, B. E., Stamatoyannopoulos, J. A., Costello, J. F., Ren, B., Milosavljevic, A., Meissner, A., et al. (2010). The NIH Roadmap Epigenomics Mapping Consortium. Nat. Biotechnol. 28 (10), 1045–1048. doi:10.1038/nbt1010-1045
Buels, R., Yao, E., Diesh, C. M., Hayes, R. D., Munoz-Torres, M., Helt, G., et al. (2016). JBrowse: a Dynamic Web Platform for Genome Visualization and Analysis. Genome Biol. 17, 66. doi:10.1186/s13059-016-0924-1
Calin, G. A., Sevignani, C., Dumitru, C. D., Hyslop, T., Noch, E., Yendamuri, S., et al. (2004). Human microRNA Genes Are Frequently Located at Fragile Sites and Genomic Regions Involved in Cancers. Proc. Natl. Acad. Sci. 101 (9), 2999–3004. doi:10.1073/pnas.0307323101
Carithers, L. J., and Moore, H. M. (2015). The Genotype-Tissue Expression (GTEx) Project. Biopreservation and Biobanking 13 (5), 307–308. doi:10.1089/bio.2015.29031.hmm
Chen, Y., and Wang, X. (2020). miRDB: an Online Database for Prediction of Functional microRNA Targets. Nucleic Acids Res. 48 (D1), D127–D131. doi:10.1093/nar/gkz757
Chèneby, J., Gheorghe, M., Artufel, M., Mathelier, A., and Ballester, B. (2018). ReMap 2018: an Updated Atlas of Regulatory Regions from an Integrative Analysis of DNA-Binding ChIP-Seq Experiments. Nucleic Acids Res. 46 (D1), D267–D275. doi:10.1093/nar/gkx1092
Chou, C.-H., Shrestha, S., Yang, C.-D., Chang, N.-W., Lin, Y.-L., Liao, K.-W., et al. (2018). miRTarBase Update 2018: a Resource for Experimentally Validated microRNA-Target Interactions. Nucleic Acids Res. 46 (D1), D296–D302. doi:10.1093/nar/gkx1067
Consortium, E. P. (2012). An Integrated Encyclopedia of DNA Elements in the Human Genome. Nature 489 (7414), 57–74. doi:10.1038/nature11247
Consortium, F., Forrest, A. R., Kawaji, H., Rehli, M., Baillie, J. K., de Hoon, M. J., et al. (2014). A Promoter-Level Mammalian Expression Atlas. Nature 507 (7493), 462–470. doi:10.1038/nature13182
Corces, M. R., Granja, J. M., Shams, S., Louie, B. H., Seoane, J. A., Zhou, W., et al. (2018). The Chromatin Accessibility Landscape of Primary Human Cancers. Science 362 (6413). doi:10.1126/science.aav1898
Danecek, P., Auton, A., Abecasis, G., Albers, C. A., Banks, E., DePristo, M. A., et al. (2011). The Variant Call Format and VCFtools. Bioinformatics 27 (15), 2156–2158. doi:10.1093/bioinformatics/btr330
Duan, Q., Mao, X., Xiao, Y., Liu, Z., Wang, Y., Zhou, H., et al. (2016). Super Enhancers at the miR-146a and miR-155 Genes Contribute to Self-Regulation of Inflammation. Biochim. Biophys. Acta (Bba) - Gene Regul. Mech. 1859 (4), 564–571. doi:10.1016/j.bbagrm.2016.02.004
Eicher, J. D., Landowski, C., Stackhouse, B., Sloan, A., Chen, W., Jensen, N., et al. (2015). GRASP v2.0: an Update on the Genome-wide Repository of Associations between SNPs and Phenotypes. Nucleic Acids Res. 43, D799–D804. doi:10.1093/nar/gku1202
Esquela-Kerscher, A., and Slack, F. J. (2006). Oncomirs - microRNAs with a Role in Cancer. Nat. Rev. Cancer 6 (4), 259–269. doi:10.1038/nrc1840
Feng, C., Zhang, J., Li, X., Ai, B., Han, J., Wang, Q., et al. (2016). Subpathway-CorSP: Identification of Metabolic Subpathways via Integrating Expression Correlations and Topological Features between Metabolites and Genes of Interest within Pathways. Sci. Rep. 6, 33262. doi:10.1038/srep33262
Friard, O., Re, A., Taverna, D., De Bortoli, M., and Corá, D. (2010). CircuitsDB: a Database of Mixed microRNA/transcription Factor Feed-Forward Regulatory Circuits in Human and Mouse. BMC Bioinformatics 11, 435. doi:10.1186/1471-2105-11-435
Fujita, P. A., Rhead, B., Zweig, A. S., Hinrichs, A. S., Karolchik, D., Cline, M. S., et al. (2011). The UCSC Genome Browser Database: Update 2011. Nucleic Acids Res. 39, D876–D882. doi:10.1093/nar/gkq963
Georgakilas, G., Vlachos, I. S., Paraskevopoulou, M. D., Yang, P., Zhang, Y., Economides, A. N., et al. (2014). microTSS: Accurate microRNA Transcription Start Site Identification Reveals a Significant Number of Divergent Pri-miRNAs. Nat. Commun. 5, 5700. doi:10.1038/ncomms6700
Georgakilas, G., Vlachos, I. S., Zagganas, K., Vergoulis, T., Paraskevopoulou, M. D., Kanellos, I., et al. (2016). DIANA-miRGen v3.0: Accurate Characterization of microRNA Promoters and Their Regulators. Nucleic Acids Res. 44 (D1), D190–D195. doi:10.1093/nar/gkv1254
Gong, J., Mei, S., Liu, C., Xiang, Y., Ye, Y., Zhang, Z., et al. (2018). PancanQTL: Systematic Identification of Cis-eQTLs and Trans-eQTLs in 33 Cancer Types. Nucleic Acids Res. 46 (D1), D971–D976. doi:10.1093/nar/gkx861
Grant, C. E., Bailey, T. L., and Noble, W. S. (2011). FIMO: Scanning for Occurrences of a Given Motif. Bioinformatics 27 (7), 1017–1018. doi:10.1093/bioinformatics/btr064
Griffiths-Jones, S., Saini, H. K., van Dongen, S., and Enright, A. J. (2008). miRBase: Tools for microRNA Genomics. Nucleic Acids Res. 36 D154–D158. doi:10.1093/nar/gkm952
Griffiths-Jones, S., Grocock, R. J., Dongen, S. V., Bateman, A., and Enright, A. J. (2006). miRBase: microRNA Sequences, Targets and Gene Nomenclature. Nucleic Acids Res. 34, D140–D144. doi:10.1093/nar/gkj112
Hamed, M., Spaniol, C., Nazarieh, M., and Helms, V. (2015). TFmiR: a Web Server for Constructing and Analyzing Disease-specific Transcription Factor and miRNA Co-regulatory Networks. Nucleic Acids Res. 43 (W1), W283–W288. doi:10.1093/nar/gkv418
Heikinheimo, M., Scandrett, J. M., and Wilson, D. B. (1994). Localization of Transcription Factor GATA-4 to Regions of the Mouse Embryo Involved in Cardiac Development. Dev. Biol. 164 (2), 361–373. doi:10.1006/dbio.1994.1206
Hnisz, D., Abraham, B. J., Lee, T. I., Lau, A., Saint-André, V., Sigova, A. A., et al. (2013). Super-enhancers in the Control of Cell Identity and Disease. Cell 155 (4), 934–947. doi:10.1016/j.cell.2013.09.053
Hsu, S. D., Lin, F. M., Wu, W. Y., Liang, C., Huang, W. C., Chan, W. L., et al. (2011). miRTarBase: a Database Curates Experimentally Validated microRNA-Target Interactions. Nucleic Acids Res. 39, D163–D169. doi:10.1093/nar/gkq1107
Hua, X., Tang, R., Xu, X., Wang, Z., Xu, Q., Chen, L., et al. (2018). mirTrans: a Resource of Transcriptional Regulation on microRNAs for Human Cell Lines. Nucleic Acids Res. 46 (D1), D168–D174. doi:10.1093/nar/gkx996
Huang, Z., Shi, J., Gao, Y., Cui, C., Zhang, S., Li, J., et al. (2019). HMDD v3.0: a Database for Experimentally Supported Human microRNA-Disease Associations. Nucleic Acids Res. 47 (D1), D1013–D1017. doi:10.1093/nar/gky1010
Inui, M., Martello, G., and Piccolo, S. (2010). MicroRNA Control of Signal Transduction. Nat. Rev. Mol. Cel Biol 11 (4), 252–263. doi:10.1038/nrm2868
Izzi, B., Pistoni, M., Cludts, K., Akkor, P., Lambrechts, D., Verfaillie, C., et al. (2016). Allele-specific DNA Methylation Reinforces PEAR1 Enhancer Activity. Blood 128 (7), 1003–1012. doi:10.1182/blood-2015-11-682153
Jolma, A., Yan, J., Whitington, T., Toivonen, J., Nitta, K. R., Rastas, P., et al. (2013). DNA-binding Specificities of Human Transcription Factors. Cell 152 (1-2), 327–339. doi:10.1016/j.cell.2012.12.009
Kang, R., Zhang, Y., Huang, Q., Meng, J., Ding, R., Chang, Y., et al. (2019). EnhancerDB: a Resource of Transcriptional Regulation in the Context of Enhancers (Oxford). Database. 2019 141, 10.1093/database/bay141.
Karagkouni, D., Paraskevopoulou, M. D., Chatzopoulos, S., Vlachos, I. S., Tastsoglou, S., Kanellos, I., et al. (2018). DIANA-TarBase V8: a Decade-Long Collection of Experimentally Supported miRNA-Gene Interactions. Nucleic Acids Res. 46 (D1), D239–D245. doi:10.1093/nar/gkx1141
Kunej, T., Godnic, I., Ferdin, J., Horvat, S., Dovc, P., and Calin, G. A. (2011). Epigenetic Regulation of microRNAs in Cancer: an Integrated Review of Literature. Mutat. Res. 717 (1-2), 77–84. doi:10.1016/j.mrfmmm.2011.03.008
Langmead, B., Trapnell, C., Pop, M., and Salzberg, S. L. (2009). Ultrafast and Memory-Efficient Alignment of Short DNA Sequences to the Human Genome. Genome Biol. 10 (3), R25. doi:10.1186/gb-2009-10-3-r25
Li, C., Han, J., Yao, Q., Zou, C., Xu, Y., Zhang, C., et al. (2013). Subpathway-GM: Identification of Metabolic Subpathways via Joint Power of Interesting Genes and Metabolites and Their Topologies within Pathways. Nucleic Acids Res. 41 (9), e101. doi:10.1093/nar/gkt161
Li, J., Han, X., Wan, Y., Zhang, S., Zhao, Y., Fan, R., et al. (2018). TAM 2.0: Tool for MicroRNA Set Analysis. Nucleic Acids Res. 46 (W1), W180–W185. doi:10.1093/nar/gky509
Li, X., Shi, L., Wang, Y., Zhong, J., Zhao, X., Teng, H., et al. (2019). OncoBase: a Platform for Decoding Regulatory Somatic Mutations in Human Cancers. Nucleic Acids Res. 47 (D1), D1044–D1055. doi:10.1093/nar/gky1139
Li, Y., Qiu, C., Tu, J., Geng, B., Yang, J., Jiang, T., et al. (2014). HMDD v2.0: a Database for Experimentally Supported Human microRNA and Disease Associations. Nucleic Acids Res. 42 D1070–D1074. doi:10.1093/nar/gkt1023
Liu, S., Liu, Y., Zhang, Q., Wu, J., Liang, J., Yu, S., et al. (2017). Systematic Identification of Regulatory Variants Associated with Cancer Risk. Genome Biol. 18 (1), 194. doi:10.1186/s13059-017-1322-z
Lovén, J., Hoke, H. A., Lin, C. Y., Lau, A., Orlando, D. A., Vakoc, C. R., et al. (2013). Selective Inhibition of Tumor Oncogenes by Disruption of Super-enhancers. Cell 153 (2), 320–334. doi:10.1016/j.cell.2013.03.036
Mathelier, A., Zhao, X., Zhang, A. W., Parcy, F., Worsley-Hunt, R., Arenillas, D. J., et al. (2014). JASPAR 2014: an Extensively Expanded and Updated Open-Access Database of Transcription Factor Binding Profiles. Nucl. Acids Res. 42, D142–D147. doi:10.1093/nar/gkt997
Matsuyama, H., and Suzuki, H. I. (2019). Systems and Synthetic microRNA Biology: From Biogenesis to Disease Pathogenesis. Int. J. Mol. Sci. 21 (1). doi:10.3390/ijms21010132
Mei, S., Qin, Q., Wu, Q., Sun, H., Zheng, R., Zang, C., et al. (2017). Cistrome Data Browser: a Data portal for ChIP-Seq and Chromatin Accessibility Data in Human and Mouse. Nucleic Acids Res. 45 (D1), D658–D662. doi:10.1093/nar/gkw983
Meyer, C. A., and Liu, X. S. (2014). Identifying and Mitigating Bias in Next-Generation Sequencing Methods for Chromatin Biology. Nat. Rev. Genet. 15 (11), 709–721. doi:10.1038/nrg3788
Molkentin, J. D., Lin, Q., Duncan, S. A., and Olson, E. N. (1997). Requirement of the Transcription Factor GATA4 for Heart Tube Formation and Ventral Morphogenesis. Genes Dev. 11 (8), 1061–1072. doi:10.1101/gad.11.8.1061
Morales, S., Monzo, M., and Navarro, A. (2017). Epigenetic Regulation Mechanisms of microRNA Expression. Biomol. Concepts 8 (5-6), 203–212. doi:10.1515/bmc-2017-0024
Palmieri, V., Backes, C., Ludwig, N., Fehlmann, T., Kern, F., Meese, E., et al. (2018). IMOTA: an Interactive Multi-Omics Tissue Atlas for the Analysis of Human miRNA-Target Interactions. Nucleic Acids Res. 46 (D1), D770–D775. doi:10.1093/nar/gkx701
Perdikopanis, N., Georgakilas, G. K., Grigoriadis, D., Pierros, V., Kavakiotis, I., Alexiou, P., et al. (2021). DIANA-miRGen V4: Indexing Promoters and Regulators for More Than 1500 microRNAs. Nucleic Acids Res. 49 (D1), D151–D159. doi:10.1093/nar/gkaa1060
Piñero, J., Bravo, À., Queralt-Rosinach, N., Gutiérrez-Sacristán, A., Deu-Pons, J., Centeno, E., et al. (2017). DisGeNET: a Comprehensive Platform Integrating Information on Human Disease-Associated Genes and Variants. Nucleic Acids Res. 45 (D1), D833–D839. doi:10.1093/nar/gkw943
Purcell, S., Neale, B., Todd-Brown, K., Thomas, L., Ferreira, M. A. R., Bender, D., et al. (2007). PLINK: a Tool Set for Whole-Genome Association and Population-Based Linkage Analyses. Am. J. Hum. Genet. 81 (3), 559–575. doi:10.1086/519795
Quinlan, A. R., and Hall, I. M. (2010). BEDTools: a Flexible Suite of Utilities for Comparing Genomic Features. Bioinformatics 26 (6), 841–842. doi:10.1093/bioinformatics/btq033
Ramassone, A., Pagotto, S., Veronese, A., and Visone, R. (2018). Epigenetics and MicroRNAs in Cancer. Int. J. Mol. Sci. 19 (2). doi:10.3390/ijms19020459
Ri, K., Kim, C., Pak, C., Ri, P., and Om, H. (2020). The KLF6 Super Enhancer Modulates Cell Proliferation via MiR-1301 in Human Hepatoma Cells. Microrna 9 (1), 64–69. doi:10.2174/2211536608666190314122725
Robasky, K., and Bulyk, M. L. (2011). UniPROBE, Update 2011: Expanded Content and Search Tools in the Online Database of Protein-Binding Microarray Data on Protein-DNA Interactions. Nucleic Acids Res. 39 D124–D128. doi:10.1093/nar/gkq992
Rupaimoole, R., and Slack, F. J. (2017). MicroRNA Therapeutics: towards a new era for the Management of Cancer and Other Diseases. Nat. Rev. Drug Discov. 16 (3), 203–222. doi:10.1038/nrd.2016.246
Sherry, S. T., Ward, M H., Kholodov, M., Baker, J., Phan, L., Smigielski, E M., et al. (2001). dbSNP: the NCBI Database of Genetic Variation. Nucleic Acids Res. 29 (1), 308–311. doi:10.1093/nar/29.1.308
Shi, X.-B., Xue, L., Yang, J., Ma, A.-H., Zhao, J., Xu, M., et al. (2007). An Androgen-Regulated miRNA Suppresses Bak1 Expression and Induces Androgen-independent Growth of Prostate Cancer Cells. Proc. Natl. Acad. Sci. 104 (50), 19983–19988. doi:10.1073/pnas.0706641104
Shlyueva, D., Stampfel, G., and Stark, A. (2014). Transcriptional Enhancers: from Properties to Genome-wide Predictions. Nat. Rev. Genet. 15 (4), 272–286. doi:10.1038/nrg3682
Sin-Chan, P., Mumal, I., Suwal, T., Ho, B., Fan, X., Singh, I., et al. (2019). A C19MC-Lin28a-MYCN Oncogenic Circuit Driven by Hijacked Super-enhancers Is a Distinct Therapeutic Vulnerability in ETMRs: A Lethal Brain Tumor. Cancer Cell 36 (1), 51–67. doi:10.1016/j.ccell.2019.06.002
Siva, A. C., Nelson, L. J., Fleischer, C. L., Majlessi, M., Becker, M. M., Vessella, R. L., et al. (2009). Molecular Assays for the Detection of microRNAs in Prostate Cancer. Mol. Cancer 8, 17. doi:10.1186/1476-4598-8-17
Song, Y., van den Berg, P. R., Markoulaki, S., Soldner, F., Dall’Agnese, A., Henninger, J. E., et al. (2019). Dynamic Enhancer DNA Methylation as Basis for Transcriptional and Cellular Heterogeneity of ESCs. Mol. Cel 75 (5), 905–920. doi:10.1016/j.molcel.2019.06.045
Sticht, C., De La Torre, C., Parveen, A., and Gretz, N. (2018). miRWalk: An Online Resource for Prediction of microRNA Binding Sites. PLoS One 13 (10), e0206239. doi:10.1371/journal.pone.0206239
Su, X., Song, C., Feng, C., Gao, Y., Ning, Z., Wang, Q., et al. (2021). ComPAT: A Comprehensive Pathway Analysis ToolsIntelligent Computing 615 Theories and Application. ICIC 2021. ICICLecture Notes in Comp. Sci. Vol. 12838, 109–120. doi:10.1007/978-3-030-84532-2_11
Sun, R., Fu, X., Li, Y., Xie, Y., and Mao, Y. (2009). Global Gene Expression Analysis Reveals Reduced Abundance of Putative microRNA Targets in Human Prostate Tumours. BMC Genomics 10, 93. doi:10.1186/1471-2164-10-93
Suzuki, H. I., Young, R. A., and Sharp, P. A. (2017). Super-Enhancer-Mediated RNA Processing Revealed by Integrative MicroRNA Network Analysis. Cell 168 (6), 1000–1014. doi:10.1016/j.cell.2017.02.015
Sylvestre, Y., De Guire, V., Querido, E., Mukhopadhyay, U. K., Bourdeau, V., Major, F., et al. (2007). An E2F/miR-20a Autoregulatory Feedback Loop. J. Biol. Chem. 282 (4), 2135–2143. doi:10.1074/jbc.m608939200
Teng, L., He, B., Wang, J., and Tan, K. (2016). 4DGenome: a Comprehensive Database of Chromatin Interactions. Bioinformatics 32 (17), 2727. doi:10.1093/bioinformatics/btw375
Tokar, T., Pastrello, C., Rossos, A. E. M., Abovsky, M., Hauschild, A.-C., Tsay, M., et al. (2018). mirDIP 4.1-integrative Database of Human microRNA Target Predictions. Nucleic Acids Res. 46 (D1), D360–D370. doi:10.1093/nar/gkx1144
Tong, Z., Cui, Q., Wang, J., and Zhou, Y. (2019). TransmiR v2.0: an Updated Transcription Factor-microRNA Regulation Database. Nucleic Acids Res. 47 (D1), D253–D258. doi:10.1093/nar/gky1023
Vlachos, I. S., Paraskevopoulou, M. D., Karagkouni, D., Georgakilas, G., Vergoulis, T., Kanellos, I., et al. (2015). DIANA-TarBase v7.0: Indexing More Than Half a Million Experimentally Supported miRNA:mRNA Interactions. Nucleic Acids Res. 43 D153–D159. doi:10.1093/nar/gku1215
Wang, D., Sun, X., Wei, Y., Liang, H., Yuan, M., Jin, F., et al. (2018). Nuclear miR-122 Directly Regulates the Biogenesis of Cell Survival oncomiR miR-21 at the Posttranscriptional Level. Nucleic Acids Res. 46 (4), 2012–2029. doi:10.1093/nar/gkx1254
Ward, L. D., and Kellis, M. (2012). HaploReg: a Resource for Exploring Chromatin States, Conservation, and Regulatory Motif Alterations within Sets of Genetically Linked Variants. Nucleic Acids Res. 40 D930–D934. doi:10.1093/nar/gkr917
Weber, B., Stresemann, C., Brueckner, B., and Lyko, F. (2007). Methylation of Human microRNA Genes in normal and Neoplastic Cells. Cell Cycle 6 (9), 1001–1005. doi:10.4161/cc.6.9.4209
Wei, G.-H., Badis, G., Berger, M. F., Kivioja, T., Palin, K., Enge, M., et al. (2010). Genome-wide Analysis of ETS-Family DNA-Binding In Vitro and In Vivo. EMBO J. 29 (13), 2147–2160. doi:10.1038/emboj.2010.106
Welter, D., MacArthur, J., Morales, J., Burdett, T., Hall, P., Junkins, H., et al. (2014). The NHGRI GWAS Catalog, a Curated Resource of SNP-Trait Associations. Nucleic Acids Res. 42 D1001–D1006. doi:10.1093/nar/gkt1229
Whyte, W. A., Orlando, D. A., Hnisz, D., Abraham, B. J., Lin, C. Y., Kagey, M. H., et al. (2013). Master Transcription Factors and Mediator Establish Super-enhancers at Key Cell Identity Genes. Cell 153 (2), 307–319. doi:10.1016/j.cell.2013.03.035
Wu, W.-S., Brown, J. S., Chen, T.-T., Chu, Y.-H., Huang, W.-C., Tu, S., et al. (2019). piRTarBase: a Database of piRNA Targeting Sites and Their Roles in Gene Regulation. Nucleic Acids Res. 47 (D1), D181–D187. doi:10.1093/nar/gky956
Xu, H., Wang, Y., Lin, S., Deng, W., Peng, D., Cui, Q., et al. (2018). PTMD: A Database of Human Disease-Associated Post-translational Modifications. Genomics, Proteomics & Bioinformatics 16 (4), 244–251. doi:10.1016/j.gpb.2018.06.004
Yang, X., Du, W. W., Li, H., Liu, F., Khorshidi, A., Rutnam, Z. J., et al. (2013). Both mature miR-17-5p and Passenger Strand miR-17-3p Target TIMP3 and Induce Prostate Tumor Growth and Invasion. Nucleic Acids Res. 41 (21), 9688–9704. doi:10.1093/nar/gkt680
Yao, Q., Chen, Y., and Zhou, X. (2019). The Roles of microRNAs in Epigenetic Regulation. Curr. Opin. Chem. Biol. 51, 11–17. doi:10.1016/j.cbpa.2019.01.024
Yevshin, I., Sharipov, R., Valeev, T., Kel, A., and Kolpakov, F. (2017). GTRD: a Database of Transcription Factor Binding Sites Identified by ChIP-Seq Experiments. Nucleic Acids Res. 45 (D1), D61–D67. doi:10.1093/nar/gkw951
Zhang, Y., Liu, T., Meyer, C. A., Eeckhoute, J., Johnson, D. S., Bernstein, B. E., et al. (2008). Model-based Analysis of ChIP-Seq (MACS). Genome Biol. 9 (9), R137. doi:10.1186/gb-2008-9-9-r137
Keywords: microRNA, super-enhancer/typical enhancer, chromatin accessibility, transcriptional regulation, genetics and epigenetics
Citation: Gao Y, Feng C, Zhang Y, Song C, Chen J, Li Y, Wei L, Qian F, Ai B, Liu Y, Zhu J, Su X, Li C and Wang Q (2022) TRmir: A Comprehensive Resource for Human Transcriptional Regulatory Information of MiRNAs. Front. Genet. 13:808950. doi: 10.3389/fgene.2022.808950
Received: 04 November 2021; Accepted: 13 January 2022;
Published: 04 February 2022.
Edited by:
Gary S. Stein, University of Vermont, United StatesReviewed by:
Milos Pjanic, Stanford Bio-X-Stanford University, United StatesPierre Cauchy, Max Planck Institute for Immunobiology and Epigenetics, Germany
Copyright © 2022 Gao, Feng, Zhang, Song, Chen, Li, Wei, Qian, Ai, Liu, Zhu, Su, Li and Wang. This is an open-access article distributed under the terms of the Creative Commons Attribution License (CC BY). The use, distribution or reproduction in other forums is permitted, provided the original author(s) and the copyright owner(s) are credited and that the original publication in this journal is cited, in accordance with accepted academic practice. No use, distribution or reproduction is permitted which does not comply with these terms.
*Correspondence: Xiaojie Su, aHlkanlzeGpAMTYzLmNvbQ==; Chunquan Li, bGNxYmlvQDE2My5jb20=; Qiuyu Wang, d2FuZ3FpdXl1OTAwNDkwQDE2My5jb20=
†These authors have contributed equally to this work and share first authorship