 Taeyeong Jung
 Youngae Jung
 Min Kyong Moon
 Oran Kwon
 Geum-Sook Hwang
 Taesung Park
- 1Interdisciplinary Program in Bioinformatics, Seoul National University, Seoul, South Korea
- 2Korea Integrated Metabolomics Research Group, Western Seoul Center, Korea Basic Science Institute, Seoul, South Korea
- 3Department of Internal Medicine, Seoul National University Boramae Medical Center, Seoul, South Korea
- 4Department of Nutritional Science and Food Management, Graduate Program in System Health Science and Engineering, Ewha Womans University, Seoul, South Korea
- 5Department of Statistics, Seoul National University, Seoul, South Korea
Integrative multi-omics analysis has become a useful tool to understand molecular mechanisms and drug discovery for treatment. Especially, the couplings of genetics to metabolomics have been performed to identify the associations between SNP and metabolite. However, while the importance of integrative pathway analysis is increasing, there are few approaches to utilize pathway information to analyze phenotypes using SNP and metabolite. We propose an integrative pathway analysis of SNP and metabolite data using a hierarchical structural component model considering the structural relationships of SNPs, metabolites, pathways, and phenotypes. The proposed method utilizes genome-wide association studies on metabolites and constructs the genetic risk scores for metabolites referred to as genetic metabolomic scores. It is based on the hierarchical model using the genetic metabolomic scores and pathways. Furthermore, this method adopts a ridge penalty to consider the correlations between genetic metabolomic scores and between pathways. We apply our method to the SNP and metabolite data from the Korean population to identify pathways associated with type 2 diabetes (T2D). Through this application, we identified well-known pathways associated with T2D, demonstrating that this method adds biological insights into disease-related pathways using genetic predispositions of metabolites.
1 Introduction
The advances in biological techniques have led to the generation of multiple omics (multi-omics) data, which contribute to a better understanding of biological mechanisms and diseases. For instance, the next-generation sequencing (NGS) technology for genome-wide data and mass spectrometry for quantitative metabolic data allow us to generate multi-omics data from the same samples at a low cost (Metzker, 2010; Suhre and Gieger, 2012). These technical improvements have enabled multi-omics data analysis to become a useful tool in biomedical research.
Genome-wide association studies (GWAS) have been conducted worldwide to identify single nucleotide polymorphisms (SNPs) associated with various diseases or phenotypes.
An intermediate variable, linking genetic variants and phenotype, is suggested to consider the effects of genes and environmental factors in overcoming the limitation of GWAS (Kronenberg, 2012). One of the potential intermediate variables is serum metabolite concentration, providing a direct readout of biological processes, to connect genetic factors and diseases (Illig et al., 2010; Kronenberg, 2012). Recently, metabolite genome-wide association studies (mGWAS) and metabolic quantitative trait loci (mQTL) analyses have been conducted by utilizing SNP and metabolite data together (Zhang et al., 2017; Park et al., 2019; Ouyang et al., 2021). In addition, to explore the association between SNPs and metabolites, disease-related metabolomic markers using SNPs were investigated through Mendelian randomization (Moayyeri et al., 2018). Even though many studies attempted to analyze SNP and metabolite data together, most studies have mainly focused on either analyzing statistical associations between SNPs and metabolites or discovering metabolomic markers of phenotypes using SNPs.
Since pathway analysis can give a more intuitive interpretation of the biological system, several methods have been proposed for pathway analysis that focuses on identifying significant pathways related to certain traits of interest (García-Campos et al., 2015; Kao et al., 2017). Specifically, pathway analysis using multi-omics data has now become popularly used in recent bioinformatics research. While the importance of integrative pathway analysis is increasing, there have been few studies about integrating SNPs and metabolite data (Kao et al., 2017). In this study, we focus on integrative pathway analysis of SNPs and metabolite data.
Here, we propose an integrative pathway analysis of SNP and metabolite data using a hierarchical structural component model. This method calculates genetic risk scores of metabolites and investigates pathways associated with phenotypes through the genetic risk scores. This approach is based on our earlier work Pathway-based approach using HierArchical components of collapsed RAre variants Of High-throughput sequencing data (PHARAOH) (Lee et al., 2016). PHARAOH uses rare variants to construct collapsed genes and performs pathway analysis using these gene-summaries. PHARAOH simultaneously analyzes the entire collapsed genes and the entire pathways in a hierarchical model (Lee et al., 2016). We utilize this main framework of PHARAOH and mGWAS for the integration of SNP and metabolite data and refer to this method as a Hierarchical Structural Component Model of SNP and Metabolite data for pathway analysis (HisCoM-SM).
The genetic metabolomic score (GMS) is calculated by summing the effects of the corresponding SNPs on each metabolite and then is used for pathway analysis in PHARAOH. HisCoM-SM adopts the ridge penalties to both GMSs and pathways to identify pathways while controlling for potential correlations between GMSs and between pathways.
Here, we apply HisCoM-SM to SNP and metabolite data from Korean Association REsource (KARE) cohort to identify pathways associated with T2D. Note that T2D is a metabolic disorder that is affected by genetic factors and environmental exposure simultaneously (Murea et al., 2012). Through this application to the KARE dataset, we demonstrate that HisCoM-SM can identify previously reported pathways, including insulin secretion and insulin resistance, associated with T2D, using genetic predispositions of metabolites (Weyer et al., 2001; Dayeh et al., 2014; Kahn et al., 2014).
The HisCoM-SM is available at https://statgen.snu.ac.kr/software/HisCoM_SM.
2 Materials and Methods
2.1 SNP Data
The SNP data was generated by the Affymetrix Genome-Wide Human SNP array 5.0. from the Korea Association REsource (KARE) project. KARE is based on Ansan and Ansung Korean population cohort among 10,038 participants which was initiated in 2001 (Cho et al., 2009). This chip originally consisted of 8,840 individuals and 352,228 SNPs. We applied quality control to our SNP data to reduce the biases and used common variants for our analysis (Turner et al., 2011). For quality control of SNP data, the genotypes with over 0.1 missing rates and Hardy-Weinberg equilibrium p-values <
2.2 Metabolite Data
The serum metabolites in the 691 participants were quantitatively analyzed by a targeted metabolomics approach using liquid chromatography-mass spectrometry (LC-MS). 64 metabolites were measured in this work. The metabolites of each subject were measured at the fifth follow-up in the KARE dataset. Among 64 metabolites, 53 were mapped to 101 pathways. The 53 metabolites were classified into eight categories. Table 1 shows the number of metabolites in each category. The list of metabolites and the eight categories of metabolites are shown in Supplementary Table S1. 627 samples were available with both SNPs and metabolite data. Among these samples, 309 samples are controls (normal) and 318 samples are cases (pre-T2D and T2D). For metabolite data, systematical error removal using random forest (SERRF) was used for batch effect correction to remove variation due to instrument and injection time (Fan et al., 2019).
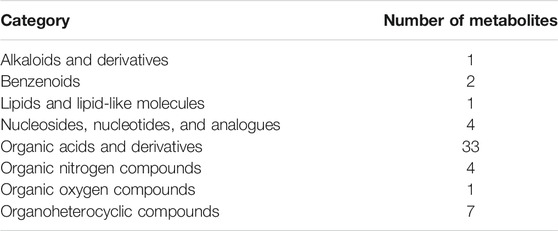
TABLE 1. Number of metabolites in each category.
2.3 Diagnosis of Type 2 Diabetes
The criteria for diagnosis of T2D are 1) fasting blood glucose (FBS)
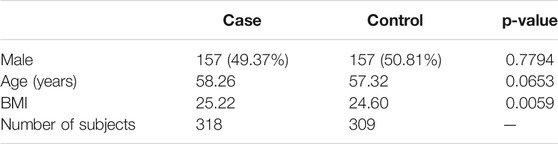
TABLE 2. The characteristics of the subjects in each case (pre T2D + T2D) and control (Normal) group.
2.4 HisCoM-SM
The framework of HisCoM-SM consists of two steps. The step 1 is to calculate genetic risk scores of metabolite data referred to genetic metabolomic scores (GMSs). Genetic effects of metabolites are estimated and then used to calculate the GMSs. The step 2 is to perform pathway analysis using the calculated GMSs by step 1. To perform pathway analysis, a hierarchical structural component model (HisCoM) is used. HisCoM consists of three layers which are input layer, latent layer, and outcome layer. In our work, GMSs are used as input variables, pathways are used as latent variables, and binary phenotype is used as outcome variable. The two steps of the process are described in more detail below.
2.4.1 Calculation of GMSs
To perform pathway analysis using SNP and metabolite data, we first construct the GMSs. Here, we used two methods for calculating GMSs. The first score was derived from the single-SNP association test for metabolites. To do that, we applied linear regression for each metabolite adjusted for age and sex and calculated the GMSs by clumping and thresholding to remove redundant correlated effects due to linkage disequilibrium (LD) using PLINK (Chang et al., 2015). Clumping is the process of selecting the most significant SNP iteratively, computing correlation between this SNP and nearby SNPs within a genetic distance of 250 k, and removing all the nearby SNPs with highly correlation (
The second score is based on the genetic best linear unbiased prediction (GBLUP) method from Genome-wide Complex Trait Analysis (GCTA) software (Yang et al., 2011). All SNPs are treated as random effects in a mixed linear model adjusted for fixed effects of sex and age (Yang et al., 2011). In GBLUP, the effects of all SNPs are estimated by the genetic relationship matrix (GRM) representing the relatedness of individuals’ SNPs (Yang et al., 2011). The GRM is used to estimate the effects of all SNPs and only 20% of SNPs with a high absolute value of the effect are used to construct the GMSs. Then, the remaining SNP effects are used to construct GMSs using PLINK (Chang et al., 2015).
2.4.2 Pathway Analysis Using GMSs in a Hierarchical Component Model
After constructing the GMSs, pathway analysis is performed. Figure 1 shows the diagram of HisCoM-SM. For each metabolite, the correlated SNPs are selected by a single SNP association test and GBLUP. Then, GMSs are derived as a linear combination of these SNPs. Thus, each metabolite is linearly correlated with the selected multiple SNPs. Similarly, each pathway is also linearly correlated with multiple metabolites. First, an individual pathway is mapped to the metabolites using the KEGG pathway database. Next, the latent variables representing pathways are derived as a linear combination of these metabolites. Then, the binary outcome is used to estimate the effect of the relationship between pathways and the phenotype. Let
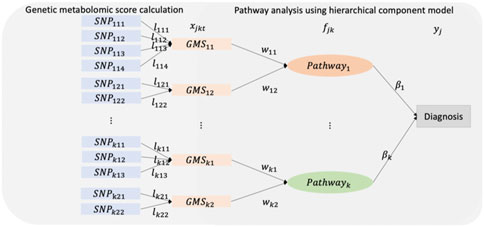
FIGURE 1. A schematic diagram of the HisCoM-SM.
To estimate the parameters of the model, we maximize a penalized log-likelihood function (Eq. 2) and use alternating least squares (ALS) for minimizing the objective function (Lee et al., 2016). Let
After estimation, the phenotype is resampled 100,000 times through permutation to generate the null distribution of coefficients of pathways to calculate empirical p-values. To correct the multiple comparisons problem, the false discovery rate (FDR) is applied (Benjamini and Hochberg, 1995). Here, we use the WISARD (workbench for integrated superfast association studies for related datasets) to perform integrative pathway analysis using GMSs (Lee et al., 2018).
3 Results
3.1 Metabolite Genome-wide Association Study in KARE Dataset
To detect genetic variants associated with metabolites, we performed the mGWAS using linear regression, adjusting for sex and age. Out of 53 metabolites, only two metabolites have significantly (p < 1e-8) associated SNPs. Specifically, we identified 17 SNPs associated with Glycine which is related to insulin sensitivity and secretion (Floegel et al., 2013). These SNPs are located on chromosome 2. We also identified 15 SNPs associated with Dimethylglycine. The list of the identified mQTL is shown in Supplementary Table S2. Figure 2 is a Manhattan plot for SNPs associated with Glycine and Dimethylglycine.
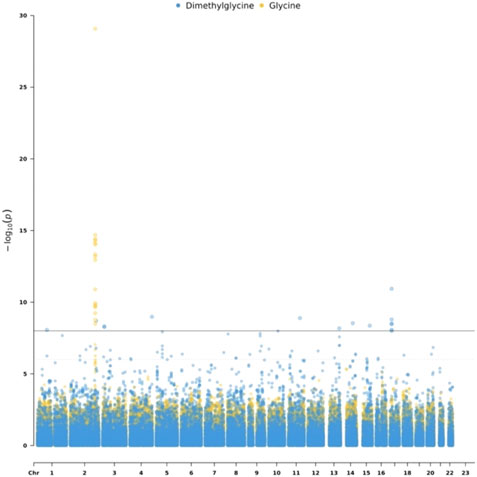
FIGURE 2. Manhattan plot for Dimethylglycine and Glycine
3.2 Pathway Analysis of T2D
HisCoM-SM was applied to SNP and metabolite data of T2D/preT2D patients and normal samples from the KARE dataset which is a large Korean population-based cohort. We first mapped the KEGG pathway database with metabolite data. Among 64 metabolites, 53 metabolites were mapped to 101 pathways. Then, the GMSs were used as components of pathways, which are latent variables in the model. Note that we used the two methods to construct GMSs: 1) Single-SNP association-based GMSs and 2) GBLUP-based GMSs. Those two methods are discussed in detail in the Methods section. The lists of identified pathways with HisCoM-SM based on single-SNP association denoted by HisCoM-SM (single) and HisCoM-SM based on GBLUP denoted by HisCoM-SM(GBLUP) are shown in Supplementary Tables S3, S4, respectively.
To detect the significant pathways associated with T2D in HisCoM-SM, we selected the pathways with high absolute coefficient values and low q-values. The metabolic pathway (map 01100) had the highest absolute effect value and the lowest q-value in both HisCoM-SM (single) and HisCoM-SM(GBLUP). Among the 49 metabolites contained in this pathway, Arginine, Tryptophan, Lactate, Trimethylamine N-oxide (TMAO), Trans-4-Hydroxy-L-proline, and Hippurate were significant in both HisCoM-SM methods. Arginine facilitates the action of glucose to stimulate insulin release (Gerich et al., 1974). In addition to Arginine, the other five metabolites have also been reported as risk factors for the incidence of T2D or the prevalence of T2D (Van Doorn et al., 2007; Crawford et al., 2010; Chen et al., 2016; Shan et al., 2017; Tang et al., 2017). In addition, both HisCoM-SM methods identified the same pathway with the second-highest absolute coefficient value and the lowest q-value. This pathway is the biosynthesis of amino acids (map 01230) and has also been reported to be associated with T2D in previous studies (Aichler et al., 2017; Lu et al., 2019). These results demonstrate that HisCoM-SM(single) and HisCoM-SM(GBLUP) can yield consistent results and identify pathways associated with T2D.
3.3 Comparison of HisCoM-SM to Conventional HisCoM Using Metabolite Data
For comparison purposes, we applied the conventional HisCoM to KARE metabolite data to identify the T2D related pathways (Supplementary Table S5). Table 3 summarizes the commonly significant (FDR q-value < 0.05) pathways by HisCoM-SM(single), HisCoM-SM(GBLUP), and conventional HisCoM using only metabolite data. These commonly significant pathways are categorized by the KEGG pathway category and subcategory. Metabolism is the category that has the greatest number of significant pathways. Among the 64 significant pathways, 31 pathways are included in the metabolism category. Figure 3 is a scatter plot for the FDR q-values and the correlation coefficients for each pair of methods. Here, the q-values of HisCoM-SM and HisCoM showed quite consistent patterns yielding high correlation coefficients. Figure 4 is a Venn diagram to show the numbers of significant pathways (FDR q-value < 0.05) shared by different methods. Note that 64 out of 74 significant pathways were commonly identified by all three methods, indicating that HisCoM based methods yielded quite consistent results. Also, all pathways identified by HisCoM-SM (single) were identified by HisCoM-SM(GBLUP).
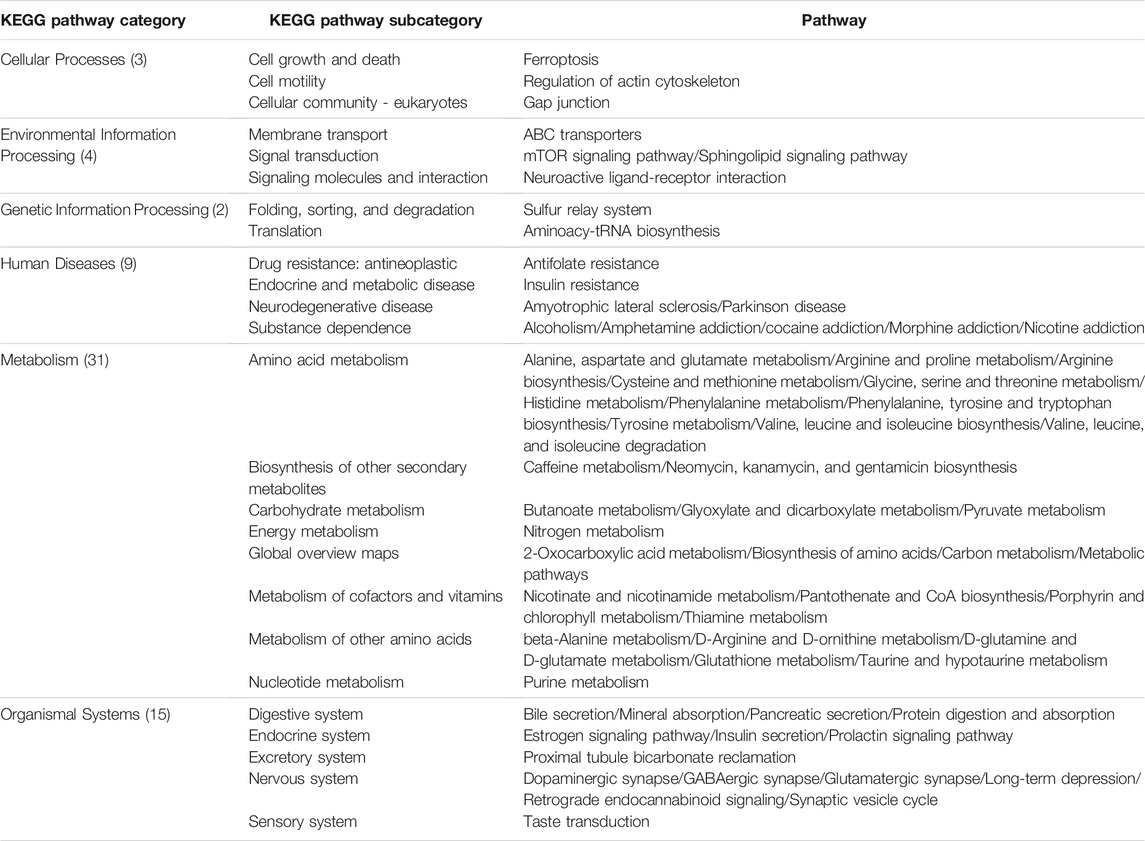
TABLE 3. Identified common pathways in HisCoM-SM and conventional HisCoM (q-value < 0.05). The pathways are categorized by KEGG pathway categories and KEGG pathway subcategories. The values in parenthesis are the number of pathways included in the KEGG pathway.
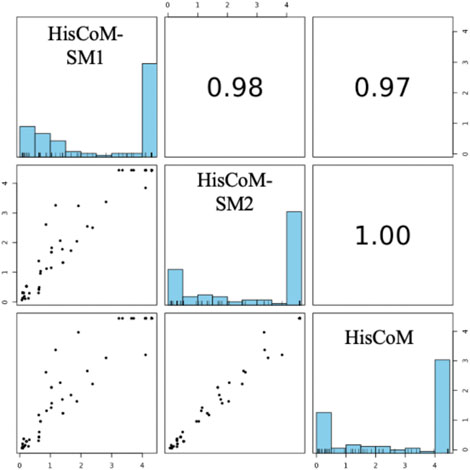
FIGURE 3. Pairwise scatter plot of 101 pathways’ FDR q-values calculated by HisCoM-SM methods and HisCoM using metabolite. Note that His-CoM-SM1 represents HisCoM-SM(single) and HisCoM-SM2 represents HisCoM-SM(GBLUP).
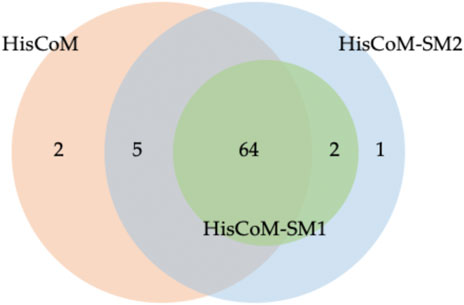
FIGURE 4. Venn Diagram for numbers of significant pathways detected for each method. Note that HisCoM-SM1 represents HisCoM-SM(single) and HisCoM-SM2 represents HisCoM-SM(GBLUP).
In Figure 4, conventional HisCoM identified two pathways that HisCoM-SM could not detect, one of which (selenocompound metabolism; map 00450) was previously reported to be associated with T2D (Shin et al., 2020). On the other hand, HisCoM-SM(GBLUP) identified three pathways, which conventional HisCoM could not find. Two out of these pathways were reported as associated with T2D. These two significant pathways are biotin metabolism (map 00780) and vascular smooth muscle contraction (map 04270) (Xie et al., 2006; Hashimoto et al., 2020). For biotin metabolism, several studies have shown that plasma triacylglycerol, low-density lipoprotein cholesterol (LDL), and fasting glucose are reduced in patients with T2D who take biotin supplementation (Maebashi et al., 1993; Revilla-Monsalve et al., 2006). Furthermore, biotin intake has been reported to be effective in improving glycaemic control through diabetic animal models (Reddi et al., 1988; Zhang et al., 1997).
4 Discussion
Several studies have suggested that pathway analysis using multi-omics data allows more insights into biological systems. Pathway analysis using more than one omics data is becoming increasingly common. However, few studies can identify disease-related pathways considering SNPs and metabolites together.
We proposed a novel pathway analysis integrating SNP and metabolite data. Our method introduced novel genetic metabolomic scores (GMSs) for pathway analysis. We used a single-SNP association and a GBLUP approach to construct GMSs. The calculated GMSs were used as components of pathways in a hierarchical model. The coefficients can be estimated by analyzing GMSs and pathways simultaneously, considering the correlations between these scores and between pathways, respectively.
We applied HisCoM-SM to the KARE cohort dataset. Our HisCoM-SM successfully identified pathways that were reported to be related to T2D. In our result, the pathways identified by HisCoM-SM and conventional HisCoM were almost overlapped, indicating that HisCoM-SM and HisCoM yielded quite consistent results, and the GMSs can be utilized for pathway analysis. Moreover, HisCoM-SM could identify the T2D-related pathways that the conventional HisCoM using only metabolite data could not detect. Since 53 targeted metabolomics in our analysis may cover only a small portion of the metabolome, modeling the effects of SNPs on these metabolites resulted in similar results from the conventional HisCoM method using only metabolites. We are planning to modify HisCoM-SM so that it allows for each pathway to have inputs from both genes and metabolites simultaneously. In other words, SNPs can directly contribute to pathways (not through metabolites), which also makes a more biological sense. The new model with a rewired structure is expected to improve the performance. We will leave it as a near-future study.
Here, we applied the clumping and thresholding process to generate genetic metabolomic scores using p-values from linear regression models. Instead of linear regression models, other approaches such as Kernel regression can be applied to detect non-linear relationships between SNPs and metabolites. Our HisCoM-SM can also use other GMSs such as the ones derived from the LD pred method (Vilhjálmsson et al., 2015). Also, once the effect of SNPs on each metabolite is obtained, it can be used to calculate the GMSs for other datasets only with SNPs. The GMSs can be calculated using the effects of SNPs. Regarding the estimation of effects of pathways and genetic metabolomic scores, we can use different types of penalty functions. For example, LASSO or Elastic Net can be easily incorporated into our model instead of the Ridge penalty. Furthermore, we can construct a predictive model using HisCoM-SM approach for diagnosis. Specifically, we will evaluate the prediction performance of HisCoM-SM and compare it with those of other models such as original HisCoM using only SNPs and metabolites in a near future.
We believe that our method may add practical biological insights into the disease-related pathways by genetic predispositions of metabolites and contribute to the understanding of molecular mechanisms and treatment for the disease.
Data Availability Statement
Publicly available datasets were analyzed in this study. This data can be found here: http://koreabiobank.re.kr.
Ethics Statement
The studies involving human participants were reviewed and approved by Seoul National University. Written informed consent for participation was not required for this study in accordance with the national legislation and the institutional requirements.
Author Contributions
TJ and TP contributed to conception and design of the study. YJ and G-SH generated the metabolite data. OK acquisition the funding. TJ and TP designed the statistical model and TJ performed the analysis. TJ wrote the first draft of the manuscript and TP edited the draft. YJ wrote sections of the manuscript. All authors contributed to manuscript revision, read, and approved the submitted version.
Funding
This research was funded by the Bio-Synergy Research Project (2013M3A9C4078158) of the Ministry of Science, ICT and Future Planning through the National Research Foundation, the Korea Health Technology R8D Project through the Korea Health Industry Development Institute (KHIDI), funded by the Ministry of Health and Welfare (HI16C2037), and the Korea Basic Science Institute (270000).
Acknowledgments
The author would like to thank Apio Catherine for the comments to edit this manuscript for English.
Conflict of Interest
The authors declare that the research was conducted in the absence of any commercial or financial relationships that could be construed as a potential conflict of interest.
Publisher’s Note
All claims expressed in this article are solely those of the authors and do not necessarily represent those of their affiliated organizations, or those of the publisher, the editors, and the reviewers. Any product that may be evaluated in this article, or claim that may be made by its manufacturer, is not guaranteed or endorsed by the publisher.
Supplementary Material
The Supplementary Material for this article can be found online at: https://www.frontiersin.org/articles/10.3389/fgene.2022.814412/full#supplementary-material
References
Aichler, M., Borgmann, D., Krumsiek, J., Buck, A., Macdonald, P. E., Fox, J. E. M., et al. (2017). N-acyl Taurines and Acylcarnitines Cause an Imbalance in Insulin Synthesis and Secretion Provoking β Cell Dysfunction in Type 2 Diabetes. Cel. Metab. 25, 1334–1347. e1334. doi:10.1016/j.cmet.2017.04.012
Benjamini, Y., and Hochberg, Y. (1995). Controlling the False Discovery Rate: a Practical and Powerful Approach to Multiple Testing. J. R. Stat. Soc. Ser. B (Methodol.) 57, 289–300. doi:10.1111/j.2517-6161.1995.tb02031.x
Chang, C. C., Chow, C. C., Tellier, L. C., Vattikuti, S., Purcell, S. M., and Lee, J. J. (2015). Second-generation PLINK: Rising to the challenge of Larger and Richer Datasets. Gigascience 4, 7. doi:10.1186/s13742-015-0047-8
Chen, T., Zheng, X., Ma, X., Bao, Y., Ni, Y., Hu, C., et al. (2016). Tryptophan Predicts the Risk for Future Type 2 Diabetes. PloS one 11, e0162192. doi:10.1371/journal.pone.0162192
Cho, Y. S., Go, M. J., Kim, Y. J., Heo, J. Y., Oh, J. H., Ban, H.-J., et al. (2009). A Large-Scale Genome-wide Association Study of Asian Populations Uncovers Genetic Factors Influencing Eight Quantitative Traits. Nat. Genet. 41, 527–534. doi:10.1038/ng.357
Crawford, S. O., Hoogeveen, R. C., Brancati, F. L., Astor, B. C., Ballantyne, C. M., Schmidt, M. I., et al. (2010). Association of Blood Lactate with Type 2 Diabetes: the Atherosclerosis Risk in Communities Carotid MRI Study. Int. J. Epidemiol. 39, 1647–1655. doi:10.1093/ije/dyq126
Dayeh, T., Volkov, P., Salö, S., Hall, E., Nilsson, E., Olsson, A. H., et al. (2014). Genome-Wide DNA Methylation Analysis of Human Pancreatic Islets from Type 2 Diabetic and Non-diabetic Donors Identifies Candidate Genes that Influence Insulin Secretion. Plos Genet. 10, e1004160. doi:10.1371/journal.pgen.1004160
Fan, S., Kind, T., Cajka, T., Hazen, S. L., Tang, W. H. W., Kaddurah-Daouk, R., et al. (2019). Systematic Error Removal Using Random forest for Normalizing Large-Scale Untargeted Lipidomics Data. Anal. Chem. 91, 3590–3596. doi:10.1021/acs.analchem.8b05592
Floegel, A., Stefan, N., Yu, Z., Mühlenbruch, K., Drogan, D., Joost, H.-G., et al. (2013). Identification of Serum Metabolites Associated with Risk of Type 2 Diabetes Using a Targeted Metabolomic Approach. Diabetes 62, 639–648. doi:10.2337/db12-0495
García-Campos, M. A., Espinal-Enríquez, J., and Hernández-Lemus, E. (2015). Pathway Analysis: State of the Art. Front. Physiol. 6, 383. doi:10.3389/fphys.2015.00383
Gerich, J. E., Charles, M. A., and Grodsky, G. M. (1974). Characterization of the Effects of Arginine and Glucose on Glucagon and Insulin Release from the Perfused Rat Pancreas. J. Clin. Invest. 54, 833–841. doi:10.1172/jci107823
Hashimoto, Y., Hamaguchi, M., Kaji, A., Sakai, R., Osaka, T., Inoue, R., et al. (2020). Intake of Sucrose Affects Gut Dysbiosis in Patients with Type 2 Diabetes. J. Diabetes Investig. 11, 1623–1634. doi:10.1111/jdi.13293
Illig, T., Gieger, C., Zhai, G., Römisch-Margl, W., Wang-Sattler, R., Prehn, C., et al. (2010). A Genome-wide Perspective of Genetic Variation in Human Metabolism. Nat. Genet. 42, 137–141. doi:10.1038/ng.507
Kahn, S. E., Cooper, M. E., and Del Prato, S. (2014). Pathophysiology and Treatment of Type 2 Diabetes: Perspectives on the Past, Present, and Future. Lancet 383, 1068–1083. doi:10.1016/s0140-6736(13)62154-6
Kao, P. Y. P., Leung, K. H., Chan, L. W. C., Yip, S. P., and Yap, M. K. H. (2017). Pathway Analysis of Complex Diseases for GWAS, Extending to Consider Rare Variants, Multi-Omics and Interactions. Biochim. Biophys. Acta (Bba) - Gen. Subj. 1861, 335–353. doi:10.1016/j.bbagen.2016.11.030
Kronenberg, F. (2012). “Metabolic Traits as Intermediate Phenotypes,” in Genetics Meets Metabolomics (Springer), 255–264. doi:10.1007/978-1-4614-1689-0_15
Lee, S., Choi, S., Kim, Y. J., Kim, B.-J., Hwang, H., Park, T., et al. (2016). Pathway-based Approach Using Hierarchical Components of Collapsed Rare Variants. Bioinformatics 32, i586–i594. doi:10.1093/bioinformatics/btw425
Lee, S., Choi, S., Qiao, D., Cho, M., Silverman, E. K., Park, T., et al. (2018). WISARD: Workbench for Integrated Superfast Association Studies for Related Datasets. BMC Med. Genomics 11, 39–44. doi:10.1186/s12920-018-0345-y
Lu, Y. C., Wang, P., Wu, Q. G., Zhang, R. K., Kong, A., Li, Y. F., et al. (2019). Hsp74/14‐3‐3σ Complex Mediates Centrosome Amplification by High Glucose, Insulin, and Palmitic Acid. Proteomics 19, 1800197. doi:10.1002/pmic.201800197
Maebashi, M., Makino, Y., Furukawa, Y., Ohinata, K., Kimura, S., and Sato, T. (1993). Therapeutic Evaluation of the Effect of Biotin on Hyperglycemia in Patients with Non-insulin Dependent Diabetes Mellitus. J. Clin. Biochem. Nutr. 14, 211–218. doi:10.3164/jcbn.14.211
Metzker, M. L. (2010). Sequencing Technologies - the Next Generation. Nat. Rev. Genet. 11, 31–46. doi:10.1038/nrg2626
Moayyeri, A., Cheung, C.-L., Tan, K. C., Morris, J. A., Cerani, A., Mohney, R. P., et al. (2018). Metabolomic Pathways to Osteoporosis in Middle-Aged Women: A Genome-Metabolome-Wide Mendelian Randomization Study. J. Bone Miner Res. 33, 643–650. doi:10.1002/jbmr.3358
Murea, M., Ma, L., and Freedman, B. I. (2012). Genetic and Environmental Factors Associated with Type 2 Diabetes and Diabetic Vascular Complications. Rev. Diabet Stud. 9, 6–22. doi:10.1900/rds.2012.9.6
Ouyang, Y., Qiu, G., Zhao, X., Su, B., Feng, D., Lv, W., et al. (2021). Metabolome‐Genome‐Wide Association Study (mGWAS) Reveals Novel Metabolites Associated with Future Type 2 Diabetes Risk and Susceptibility Loci in a Case‐Control Study in a Chinese Prospective Cohort. Glob. Challenges 5, 2000088. doi:10.1002/gch2.202000088
Park, T. J., Lee, H. S., Kim, Y. J., and Kim, B. J. (2019). Identification of Novel Non-synonymous Variants Associated with Type 2 Diabetes-Related Metabolites in Korean Population. Biosci. Rep. 39, BSR20190078. doi:10.1042/BSR20190078
Privé, F., Vilhjálmsson, B. J., Aschard, H., and Blum, M. G. (2019). Making the Most of Clumping and Thresholding for Polygenic Scores. Am. J. Hum. Genet. 105, 1213–1221. doi:10.1016/j.ajhg.2019.11.001
Reddi, A., Deangelis, B., Frank, O., Lasker, N., and Baker, H. (1988). Biotin Supplementation Improves Glucose and Insulin Tolerances in Genetically Diabetic KK Mice. Life Sci. 42, 1323–1330. doi:10.1016/0024-3205(88)90226-3
Revilla-Monsalve, C., Zendejas-Ruiz, I., Islas-Andrade, S., Báez-Saldaña, A., Palomino-Garibay, M. A., Hernández-Quiróz, P. M., et al. (2006). Biotin Supplementation Reduces Plasma Triacylglycerol and VLDL in Type 2 Diabetic Patients and in Nondiabetic Subjects with Hypertriglyceridemia. Biomed. Pharmacother. 60, 182–185. doi:10.1016/j.biopha.2006.03.005
Shan, Z., Sun, T., Huang, H., Chen, S., Chen, L., Luo, C., et al. (2017). Association between Microbiota-dependent Metabolite Trimethylamine-N-Oxide and Type 2 Diabetes. Am. J. Clin. Nutr. 106, 888–894. doi:10.3945/ajcn.117.157107
Shin, N. R., Gu, N., Choi, H. S., and Kim, H. (2020). Combined Effects of Scutellaria Baicalensis with Metformin on Glucose Tolerance of Patients with Type 2 Diabetes via Gut Microbiota Modulation. Am. J. Physiol.-Endocrinol. Metab. 318, E52–E61. doi:10.1152/ajpendo.00221.2019
Suhre, K., and Gieger, C. (2012). Genetic Variation in Metabolic Phenotypes: Study Designs and Applications. Nat. Rev. Genet. 13, 759–769. doi:10.1038/nrg3314
Tang, W. H. W., Wang, Z., Li, X. S., Fan, Y., Li, D. S., Wu, Y., et al. (2017). Increased Trimethylamine N-Oxide Portends High Mortality Risk Independent of Glycemic Control in Patients with Type 2 Diabetes Mellitus. Clin. Chem. 63, 297–306. doi:10.1373/clinchem.2016.263640
Turner, S., Armstrong, L. L., Bradford, Y., Carlson, C. S., Crawford, D. C., Crenshaw, A. T., et al. (2011). Quality Control Procedures for Genome-wide Association Studies. Curr. Protoc. Hum. Genet. Chapter 1, Unit1.19. doi:10.1002/0471142905.hg0119s68
Van Doorn, M., Vogels, J., Tas, A., Van Hoogdalem, E. J., Burggraaf, J., Cohen, A., et al. (2007). Evaluation of Metabolite Profiles as Biomarkers for the Pharmacological Effects of Thiazolidinediones in Type 2 Diabetes Mellitus Patients and Healthy Volunteers. Br. J. Clin. Pharmacol. 63, 562–574. doi:10.1111/j.1365-2125.2006.02816.x
Vilhjálmsson, B. J., Yang, J., Finucane, H. K., Gusev, A., Lindström, S., Ripke, S., et al. (2015). Modeling Linkage Disequilibrium Increases Accuracy of Polygenic Risk Scores. Am. J. Hum. Genet. 97, 576–592. doi:10.1016/j.ajhg.2015.09.001
Weyer, C., Tataranni, P. A., Bogardus, C., and Pratley, R. E. (2001). Insulin Resistance and Insulin Secretory Dysfunction Are Independent Predictors of Worsening of Glucose Tolerance during Each Stage of Type 2 Diabetes Development. Diabetes care 24, 89–94. doi:10.2337/diacare.24.1.89
Xie, Z., Su, W., Guo, Z., Pang, H., Post, S., and Gong, M. (2006). Up-Regulation of CPI-17 Phosphorylation in Diabetic Vasculature and High Glucose Cultured Vascular Smooth Muscle Cells. Cardiovasc. Res. 69, 491–501. doi:10.1016/j.cardiores.2005.11.002
Yang, J., Lee, S. H., Goddard, M. E., and Visscher, P. M. (2011). GCTA: a Tool for Genome-wide Complex Trait Analysis. Am. J. Hum. Genet. 88, 76–82. doi:10.1016/j.ajhg.2010.11.011
Zhang, H., Osada, K., Sone, H., and Furukawa, Y. (1997). Biotin Administration Improves the Impaired Glucose Tolerance of Streptozotocin-Induced Diabetic Wistar Rats. J. Nutr. Sci. Vitaminol. 43, 271–280. doi:10.3177/jnsv.43.271
Keywords: pathway analysis, multi-omics integration, mGWAS, metabolite, SNP
Citation: Jung T, Jung Y, Moon MK, Kwon O, Hwang G-S and Park T (2022) Integrative Pathway Analysis of SNP and Metabolite Data Using a Hierarchical Structural Component Model. Front. Genet. 13:814412. doi: 10.3389/fgene.2022.814412
Received: 13 November 2021; Accepted: 13 January 2022;
Published: 24 March 2022.
Edited by:
Miguel E. Rentería, QIMR Berghofer Medical Research Institute, AustraliaReviewed by:
Jung Hun Oh, Memorial Sloan Kettering Cancer Center, United StatesJianguo Xia, McGill University, Canada
Copyright © 2022 Jung, Jung, Moon, Kwon, Hwang and Park. This is an open-access article distributed under the terms of the Creative Commons Attribution License (CC BY). The use, distribution or reproduction in other forums is permitted, provided the original author(s) and the copyright owner(s) are credited and that the original publication in this journal is cited, in accordance with accepted academic practice. No use, distribution or reproduction is permitted which does not comply with these terms.
*Correspondence: Geum-Sook Hwang, Z3Nod2FuZ0BrYnNpLnJlLmty; Taesung Park, dHNwYXJrQHN0YXRzLnNudS5hYy5rcg==