- 1Flower Research Institute Yunnan Agriculture Academy Science, Kunming, China
- 2Fujian Forestry Science and Technology Experimental Center, Zhangzhou, China
- 3Yunnan Agricultural University College of Horticulture and Landscape, Kunming, China
- 4Yunnan Agriculture Academy Science, Kunming, China
Cymbidium ensifolium L. is a significant ornamental plant in Orchidaceae. Aside from its attractive flowers, its leaf coloration is also an important ornamental trait. However, there is an apparent lack of studies concerning the intricate mechanism of leaf coloration in C. ensifolium. In this study, we report a systematic evaluation of leaf coloration utilizing transcriptome and metabolome profiles of purple, yellow, and green leaves. In total, 40 anthocyanins and 67 flavonoids were quantified along with chlorophyll content. The tissue–transcriptome profile identified 26,499 differentially expressed genes (DEGs). The highest chlorophyll contents were identified in green leaves, followed by yellow and purple leaves. We identified key anthocyanins and flavonoids associated with leaf coloration, including cyanidin-3-O-sophoroside, naringenin-7-O-glucoside, delphinidin, cyanidin, petunidin, and quercetin, diosmetin, sinensetin, and naringenin chalcone. Moreover, genes encoding UDP-glucoronosyl, UDP-glucosyl transferase, chalcone synthesis, flavodoxin, cytochrome P450, and AMP-binding enzyme were identified as key structural genes affecting leaf coloration in C. ensifolium. In summary, copigmentation resulting from several key metabolites modulated by structural genes was identified as governing leaf coloration in C. ensifolium. Further functional verification of the identified DEGs and co-accumulation of metabolites can provide a tool to modify leaf color and improve the aesthetic value of C. ensifolium.
Introduction
Cymbidium ensifolium L., also known as sword-leaf cymbidium, is a perennial herbaceous plant belonging to Orchidaceae with its natural distribution across tropical and subtropical areas, including China, Indochina, Borneo, New Guinea, and the Philippines (Wang et al., 2011). C. ensifolium is an economically important ornamental with historical use in traditional Chinese orchids (Wang et al., 2011; Ai et al., 2021). Owing to its widespread commercial utilization in the horticulture industry and natural variation, several breeding programs have bred cultivars with distinct characteristics, including leaf blade, flower color, and morphology (Wang et al., 2011). Over the past few decades, many studies have focused on flower color variation in C. ensifolium (Choi et al., 2006; Siripiyasing et al., 2012; Li et al., 2014; Ogura-Tsujita et al., 2014; Nakatsuka et al., 2019; Ramya et al., 2020; Wei et al., 2020; Ke et al., 2021). However, the gradual change in leaf coloration is still not fully understood.
Although molecular mechanisms underlying leaf coloration are not fully understood in C. ensifolium, the conserved regulatory networks identified in other horticulture plants can provide a fundamental framework for understanding the molecular and genetic patterns underlying complex traits (Albert et al., 2014). Reports that are previously published suggested varying levels of co-accumulation of secondary metabolites such as betalains, flavonoids, and carotenoids responsible for plant pigmentations (Tanaka et al., 1998; Freyre and Griesbach, 2004; Grotewold, 2006; Yamamizo et al., 2011; Harborne, 2014). Flavonoids are involved in the formation and development of flowers, fruits, and seeds in plants and complement antioxidant activity, UV protection, and protection against biotic and abiotic attacks by plant pathogens (Dixon and Paiva, 1995; Winkel-Shirley, 2002). Quercetin and gossypetin are known flavonoids involved in synthesizing yellow pigments in plants (Harborne, 1965; Harborne, 1968; Ververidis et al., 2007; Li et al., 2020; Yin et al., 2020; Fu et al., 2021). Aside from pigmentation, flavonoids are involved in various physiological functions under stress conditions (Nakabayashi et al., 2014; Santos-Buelga et al., 2014; Fan et al., 2016; Liang and He, 2018; Xu and Rothstein, 2018). Phenylpropanoid biosynthesis, flavonoid metabolism, and anthocyanin metabolism are three major stages of flavonoid biosynthesis in plants. Flavonoid biosynthesis is aided by the structural genes PAL, C4H, 4CL, CHI, CHS, F3H, DFR, ANS, UFGT, and 3GT (Hichri et al., 2011).
With spectra of flower color, cymbidium is an integral part of flowering orchids in China (Xu et al., 2006; Aceto and Gaudio, 2011). Aside from abundance variation in flower color, leaf sheath and color are also important ornamental traits. A single plant displays varying colored leaves (at different developmental stages), which increases the aesthetic value of the species. Chlorophyll is the major pigment responsible for the green color in plants. Spatial regulation of anthocyanin and chlorophyll degradation are the primary sources of leaf color variation (Li et al., 2021). In general, color variation from white to yellow is attributed to the loss of chlorophyll, while red, purple, and blue coloration results from complex metabolic accumulation in flavonoid biosynthesis pathways (Wheeler and Smith, 2019). The previous report suggested that phenotypic mutation resulting from chlorophyll deficiency is the major reason for leaf color variation in C. ensifolium (Ai et al., 2021). Moreover, the study demonstrated that the lower expression of photosynthesis–antennae caused white and yellow leaves (Ai et al., 2021). Another study concerning C. ensifolium also emphasized chlorophyll degradation as a major contributor to leaf coloration (Gao et al., 2020). However, the genetic mechanisms underlying leaf color variation of C. ensifolium from yellow–purple–green remain unclear. Therefore, the current study aimed at deciphering the gene expression change during leaf color change in C. ensifolium by utilizing a multi-omics platform with systematic analyses concerning high-quality transcriptome and metabolome profiles. The study will provide a theoretical basis for leaf coloration in C. ensifolium. Moreover, further functional validation of identified genes can establish the genetic basis of leaf coloration in C. ensifolium.
Materials and methods
Plant material
Cymbidium ensifolium var. “Shi zhang hong” is a popular orchid in the Chinese market. The 3-year-old plants were obtained from the orchid germplasm nursery in the Fujian Forestry Science and Technology Experimental Center (China), grown in the small rotted pine woods with an 80% air humidity, a 25°C temperature, and an 80% shading. The material was characterized by leaf color variation during the developmental process and a single plant displays varying colored leaves. The samples of purple (Z; young), yellow (H; slightly mature), and green (L; mature) were collected from a plant at the same time. Sampling was conducted in three biological replicates (three different plants) for further downstream analyses.
Chlorophyll profiling
A series of procedures for chlorophyll profiling and other metabolites identification and quantification were carried out at Wuhan Metware Biotechnology Co., Ltd (https://www.metware.cn), following the company’s standard procedures. The chlorophyll a and b were extracted by hexane:acetone:ethanol = 2:1:1. The other metabolites such as porphobilinogen, hemin, pheophorbide a, protoporphyrin IX, 5-aminolevulinic acid, and L-glutamic acid were extracted using 70% methanol. Extracts were analyzed using liquid chromatography–mass spectrometry (LC-MS) analysis. After using the Metware Database constructed from the standards, the data detected via mass spectrometry are qualitatively and quantitatively analyzed.
Measurement of total anthocyanin content
The method of extracting total anthocyanins from Camellia sinensis by Fu et al. (2021) was used, and the extraction conditions were optimized. C. ensifolium leaves were ground into powder in liquid nitrogen. About 0.65 g of dry powder was added to 20 ml of 95% (0.1 mol−1 HCL) ethanol solution and then heated in a water bath at 60°C for 2 h. At last, the absorbance values of the extracts at 520, 620, and 650 nm were measured using an enzyme marker, and 95% ethanol (0.1 mol−1 HCL) was used as A = (A530-A620)-0.1 (A650-A620), Q = A × V× 1,000/489.72 m (mmol.g−1 FW), where V represents the volume of the extract and m represents the weight of the dried petal powder.
Flavonoids identification and quantification
A series of procedures for metabolite extraction, identification, and quantification were carried out at Wuhan Metware Biotechnology Co., Ltd (https://www.metware.cn), following the company’s standard procedures (Cao et al., 2019; Wang et al., 2019). Cryo-preserved samples were weighed and extracted with 1.0 ml of 70% methanol at 4°C. Extracts were analyzed using LC-MS/MS analysis (UPLC, Shim-pack UFLC SHIMADZU CBM30A system; MS, Applied Biosystems 6500 QTRAP). All metabolites were identified and quantified using Metware’s metabolite database and public metabolite database. Differentially accumulated flavonoids (DAFs) between samples were identified using orthogonal partial least squares discriminant analysis. Metabolites with |log2Fold Change| ≥ 1 and variable importance in project ≥ 1 were defined as differentially accumulated metabolites.
RNA extraction and sequencing transcriptome data analysis
Total RNA was extracted from the samples with the RNA Extraction kit (TIANGEN, Beijing, China). The RNA quality and concentration were assessed using agarose gel electrophoresis and NanoDrop2000 spectrophotometer. RNA sample quality testing, library construction, and sequencing for each sample were done at Biomarker Biotechnology (http://www.biomarker.com.cn), following the company’s standard procedures. Low-quality data containing adapter and poly-N were removed for downstream analysis. The resulting set of high-quality clean reads was used for transcriptome analysis. Hisat2 was used to obtain unigenes (Kim et al., 2019). Reads per kilobase mapping (FPKM) for all genes to determine gene expression values and screen for differentially expressed genes (DEGs). DESeq2 (Love et al., 2014) was used for differential expression analysis between sample groups. DESeq2 requires unsorted reads count data for the input gene, not RPKM, FPKM, etc. After the difference analysis, the Benjamini–Hochberg method was used to correct the hypothesis test probability (p-value) for multiple hypothesis testing to obtain the false discovery rate (FDR). The filter for differential genes is |log2Fold Change| > = 1 and the FDR < 0.05. The identified DEGs were further enriched using the Kyoto Encyclopedia of Genes and Genomes (KEGG) analysis. The Gene Ontology annotation and KEGG pathway enrichment analysis were applied using Tbtools software (Chen et al., 2020). Heat maps were generated using the OmicStudio tools at https://www.omicstudio.cn/tool. Correlation analysis between key genes in the phenylpropanoid–flavonoid pathway and anthocyanins was performed using the R package Hmisc (Team, 2013) to calculate Pearson correlation coefficients.
Results
Phenotypic characterization of leaf coloration
Cymbidium ensifolium changes leaf color over the developmental stages. We observed the leaf color variation in young, slightly mature, and mature leaves. Young leaves are purple, turning yellow, and finally green (Figure 1). All three colors can be observed in the mature plant, as shown in Figure 1B. The distinct coloration pattern increases the aesthetic appeal of C. ensifolium as an additional ornamental characteristic aside from flowers.
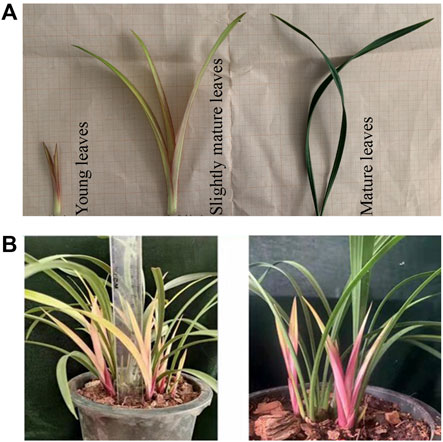
FIGURE 1. A pictorial description of Cymbidium ensifolium leaf coloration. (A) leaf color alteration pertaining to development. (B) leaf color variation in mature C. ensifolium leaves depicting yellow, purple, and green coloration.
To understand the molecular mechanisms underlying color variation in leaf, we collected leaf samples at each stage in three replicates for further downstream analysis, viz., metabolite characterization and transcriptome profiling.
Chlorophyll accumulation
Chlorophyll accumulation was tested in three leaf tissues using LC-MS/MS analysis. Chlorophyll b contents were higher in green leaf tissue compared to yellow and purple (Figure 2A). Purple leaf tissues had the lowest accumulation of chlorophyll b contents. Both chlorophylls a and b were tested for the respective accumulation; however, we found that with a normal accumulation pattern of chlorophyll b, chlorophyll a was not detected. We assumed that the chlorophyll a standard product might be degraded. To verify this, the samples were compared with the 500 ppm mixed standard (YLS_500 ppm_N). The comparison results showed normal peaks for chlorophyll b, whereas no peaks were observed for chlorophyll a, conferring the degradation of chlorophyll a standard product (Supplementary Figure S1).
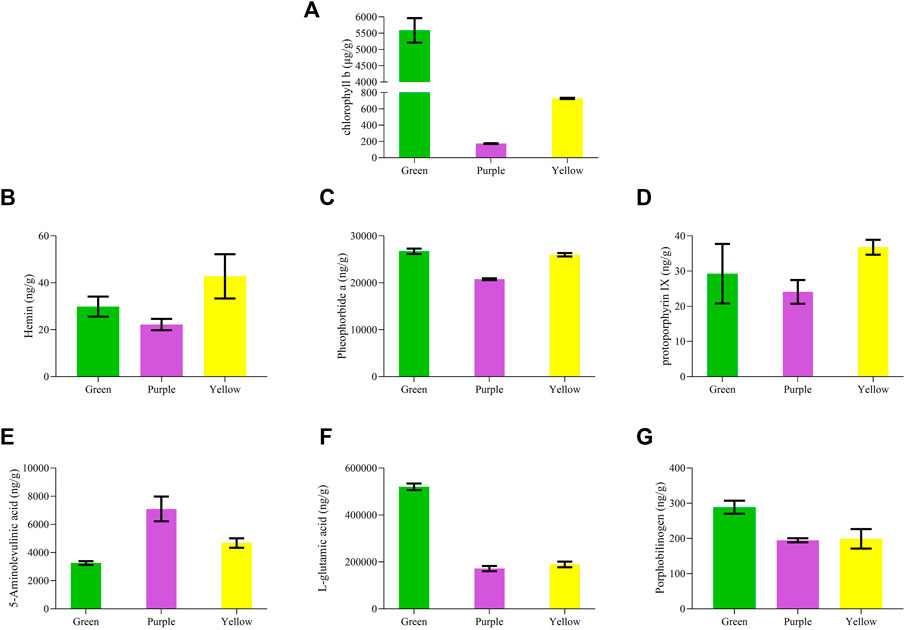
FIGURE 2. Chlorophyll profiling of purple, yellow, and green leaves in C. ensifolium. (A) chlorophyll b, (B) hemin, (C) pheophorbide, (D) protoporphyrin IX, (E) 5-aminolevulinic acid, (F) L-glutamic acid, and (G) porphobilinogen.
Moreover, we quantified several compounds, which are usually a by-product of chlorophyll degradation, such as porphobilinogen, hemin, pheophorbide a, protoporphyrin, 5-aminolevulinic acid, and L-glutamic acid (Figures 2B–G). Hemin depicted a significantly higher accumulation in yellow leaves than in purple and green. Pheophorbide a and protoporphyrin IX were estimated with higher accumulation in yellow leaves but lowest in purple leaves. Moreover, porphobilinogen and L-glutamic acid increased with the change in color from purple to yellow to green. By contrast, 5-aminolevulinic acid gradually decreased with the color variation from purple to yellow to green.
Anthocyanin profiling
Leaf tissue samples were further studied using target metabolite identification (UPLC MS/MS) for anthocyanins, resulting in the identification of 40 anthocyanin compounds from five different subclasses, including cyanidin, peonidin, delphinidin, flavonoids, petunidin, pelargonidin, malvidin, and procyanidin (Supplementary Table S1). The quality was ensured by observing the instrument’s accuracy following quality control measures, as previously explained by Fiehn et al. (2000), Superimposed display analysis of mass spectrometry total ion current (TIC) and extracted ion chromatogram of samples were run at a different time (Supplementary Figure S2). The overlapped TIC suggested the stability of the instrument as a quality check.
Comparing green, yellow, and purple tissues yielded 16, 18, and 2 differentially accumulated anthocyanins in L vs. H, L vs. Z, and Z vs. H, respectively (Figure 3A). Delphinidin-3-O-glucoside, cyanidin-3-O-glucoside, cyanidin-3-O-(6-O-malonyl-beta-D-glucoside), cyanidin-3-O-xyloside, petunidin-3-O-(6-O-malonyl-beta-D-glucoside), pelargonidin-3-O-(6-O-malonyl-beta-D-glucoside), peonidin-3-O-galactoside, peonidin-3-O-arabinoside, peonidin-3-O-(6-O-malonyl-beta-D-glucoside), quercetin-3-O-glucoside, rutin, kaempferol-3-O-rutinoside, and delphinidin-3-O-(6-O-malonyl)-glucoside-3′-glucoside were identified with upaccumulation in yellow leaves compared to green leaves, suggesting a significant role of in differential coloration (Figure 3B and Supplementary Table S1). Although petunidin-3-O-galactoside, petunidin-3-O-glucoside, and dihydromyricetin depicted a down accumulation pattern in yellow leaves. The above-mentioned anthocyanins depicted a similar regulation pattern in comparison with L vs. Z, except for pelargonidin-3-O-(6-O-malonyl-beta-D-glucoside). Moreover, three anthocyanins, including cyanidin-3-O-sophoroside, naringenin-7-O-glucoside, and procyanidin B3, were upaccumulated explicitly in purple leaves compared to green leaves (Figure 3B). The results signify the potential role of cyanidin-3-O-sophoroside, naringenin-7-O-glucoside, and procyanidin B3 in purple color formation in C. ensifolium. In the Z vs. H comparison, only two differentially accumulated anthocyanins were identified, including cyanidin-3-O-xyloside (upaccumulated) and petunidin-3-O-(6-O-malonyl-beta-D-glucoside) (downaccumulated).
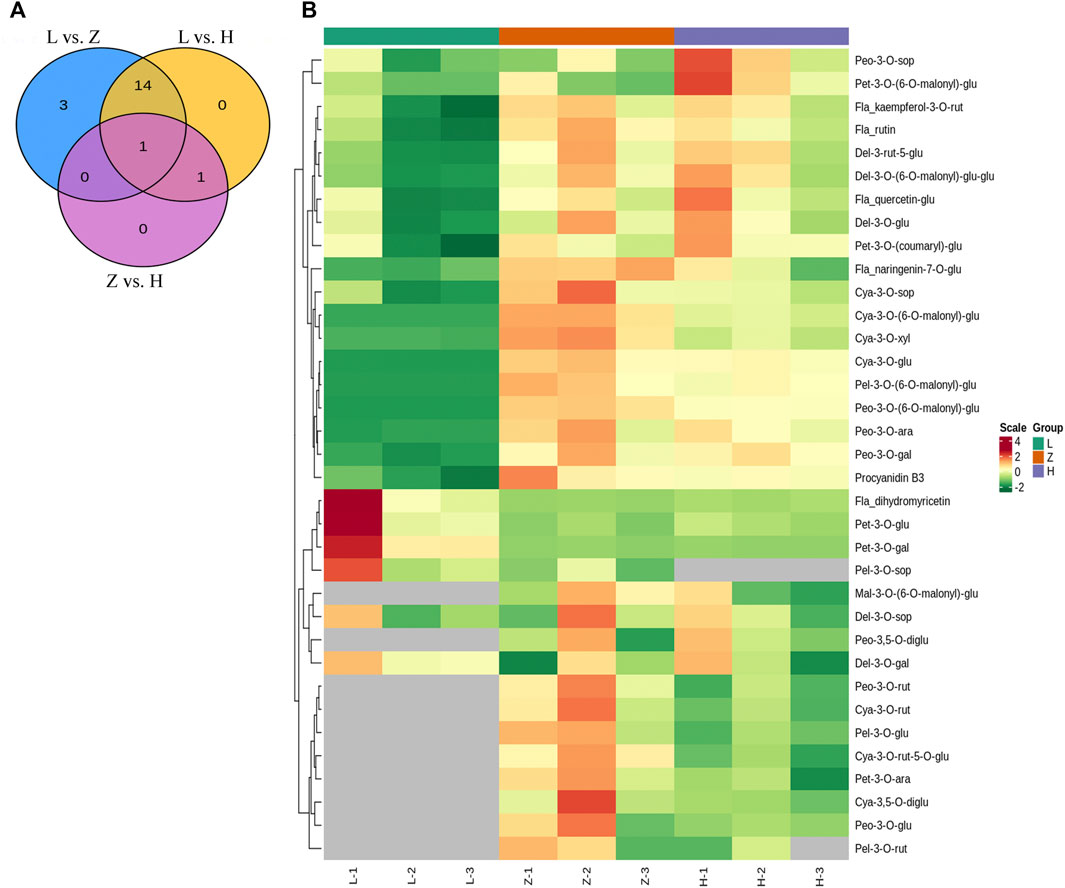
FIGURE 3. Anthocyanin profile. (A) venn diagram depicting differentially accumulated anthocyanins in each group with overlap, where L, H, and Z correspond to green, yellow, and purple leaves, respectively. (B) heatmap depicting accumulation pattern of identified anthocyanins in green, yellow, and purple leaf tissues. The numbers 1, 2, and 3 correspond to each replication.
Flavonoids associated with leaf coloration
Targeted metabolic profile identified 67 flavonoids, including chalcones (6), flavanols (6), flavanones (7), flavone glycosides (4), flavones (18), flavonols (15), isoflavanones (3), phenolic acids (1), and other flavonoids (7) (Supplementary Table S2). PCA was performed to check the repeatability of data sets. The first two components, viz., PC1 and PC2, covered 74% variation and clustered replicates from each colored leaf (Figure 4B). We further compared samples from different colored leaf tissues and identified DAFs (Figure 4A). Comparison L vs. H identified 12 DAFs, including hydroxysafflor yellow A, tangeretin, oroxin A, syringaldehyde, nicotiflorin, rutin, genistin, astragalin, baimaside, apigenin 7-glucoside, homoplantaginin, and naringenin chalcone. All DAFs were upregulated in yellow leaves, whereas only one flavonoid homoplantaginin from the flavonoes subclass, depicted down accumulation in yellow leaves compared to green leaves (Supplementary Table S3). Likewise, a comparison of green leaves and purple leaves yielded 12 DAFs, including diosmetin, hydroxysafflor yellow A, tangeretin, syringaldehyde, nicotiflorin, rutin, schaftoside, astragalin, baimaside, sinensetin, homoplantaginin, naringenin, and chalcone. Except for rutin and baimaside, all DAFs depicted upaccumulation in purple leaves compared to green leaves (Supplementary Table S3). It is of interest that hydroxysafflor yellow A, tangeretin, syringaldehyde, nicotiflorin, rutin, astragalin, homoplantaginin, and naringenin chalcone were upaccumulated in both yellow and purple leaves compared to green leaves. Therefore, the color variation from purple to yellow to green can be attributed to the variable levels of these flavonoids.
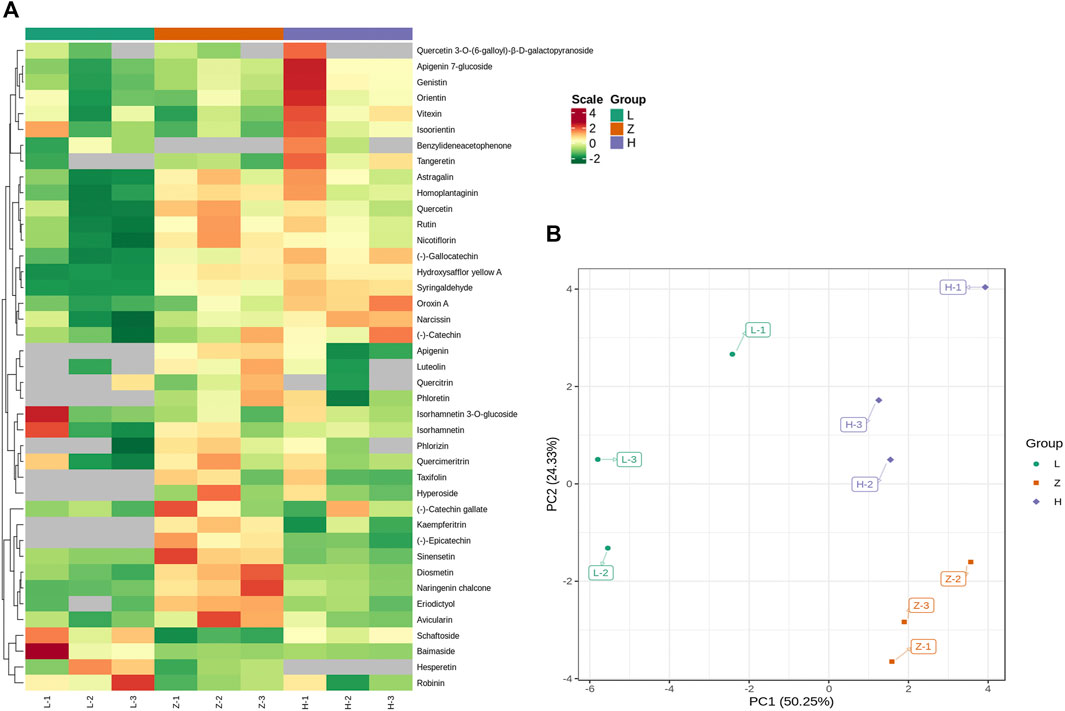
FIGURE 4. Differential accumulation of flavonoids in three leaf tissues, L (green leaves), H (Yellow leaves), and Z (purple leaves). (A) accumulation pattern of 41 DAFs (at least differentially expressed in one comparison). (B) PCA plot depicting PC-based distribution of samples and their replicates. L, H, and Z correspond to green, yellow, and purple leaves. The numbers 1, 2, and 3 correspond to each replication.
Moreover, a comparison of purple and yellow tissues identified six DAFs (two upaccumulated and four downaccumulated). Tangeretin and schaftoside depicted upaccumulation in yellow leaves, whereas diosmetin, eriodictyol, sinensetin, and naringenin chalcone were downaccumulated in yellow leaves. Diosmetin, sinensetin, and naringenin chalcone were identified with upaccumulation in purple leaves compared to yellow and green leaves (Supplementary Table S3). The results emphasized that a gradual decrease in diosmetin, sinensetin, and naringenin chalcone accumulation might be the reason for differential coloration.
Transcription control of leaf color variation
The metabolome is referred to as the end product in biological pathways. Therefore, to identify the genes responsible for differential accumulation of anthocyanins, flavonoids, and chlorophyll, we sequenced the transcriptome of different colored leaf tissues. A total of nine cDNA libraries were constructed with three replicates for each color group. The transcriptomic sequencing yielded 0.44 billion raw reads, and after filtering low-quality reads, we obtained 0.43 billion clean reads with 64.71 Gb of data (Supplementary Table S4). After mapping, the FPKM values were calculated based on read counts and used for further downstream analysis. The quantified genes were subjected to PCA and PCC. The results signify the credibility and repeatability of transcriptomic datasets. The first two PCs covered 40.96% variation, and replicates from each colored group were clustered together (Figure 5A). PCC results also emphasized a strong correlation among the replicates from each colored group (Figure 5B).
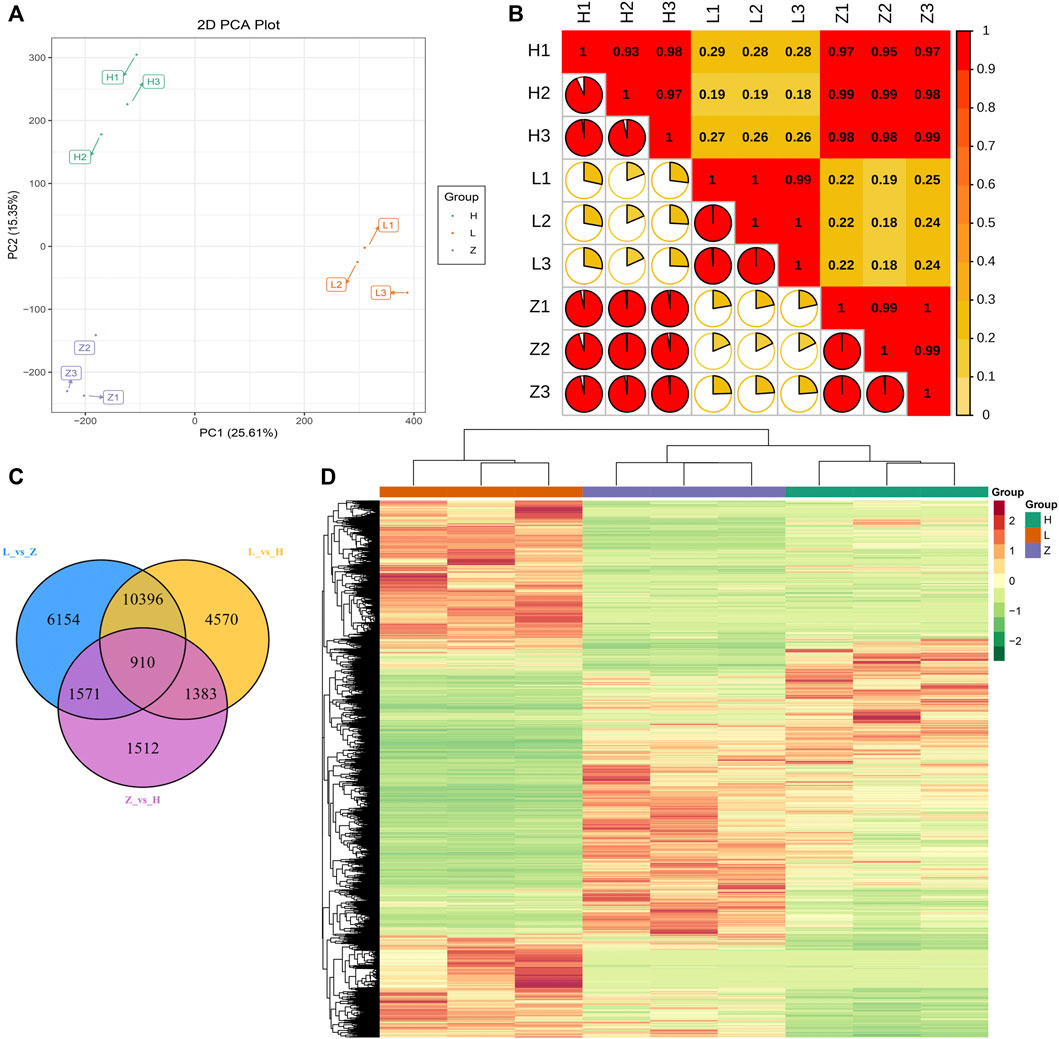
FIGURE 5. Transcriptome profiling of three different colored leaves of C. ensifolium. (A) PCA plot based on FPKM values of all the quantified genes. (B) correlation plot of quantified genes. (C) venn diagram representing differentially expressed genes and their overlap in comparison between green, yellow, and purple leaves, viz., L vs. H, L vs. Z, and Z vs. H. (D) heatmap representing FPKM values of all the quantified genes through transcriptome profiling.
The transcriptome datasets were further analyzed to identify DEGs related to color variation. Overall FPKM values for the genes differentiated the identified genes into three groups consistent with the leaf color (Figure 5D). Thus, we compared each group and further categorized DEGs from each group. A total of 26,499 DEGs (at least differentially expressed in one comparison) were identified (Supplementary Table S5). Comparison L vs. H depicted 17,259 DEGs with 9,236 downregulated and 8,023 upregulated genes in yellow leaves compared to green leaves. Likewise, comparisons L vs. Z and Z vs. H identified 19,031 DEGs (9,320 downregulated and 9,711 upregulated) and 5,376 DEGs (2,586 downregulated and 2,790 upregulated), respectively. The annotation information of identified DEGs in each group suggested enrichment of pathways related to photosynthesis, phenylpropanoid biosynthesis, flavonoid biosynthesis, and circadian rhythm (Supplementary Figures S3–S5). We further identified 910 conserved DEGs between the three groups (Figure 5C). A comparison of DEGs from each group suggested that more changes in gene expression are required for green coloration than yellow and purple. Moreover, we identified 151 DEGs (at least expressed in one comparison) related to flavonoid biosynthesis, isoflavonoid biosynthesis, phenylpropanoid biosynthesis, flavone, and flavonol biosynthesis.
Based on annotation information, we further characterized the identified DEGs related to differential coloration. A total of 151 DEGs (at least differentially expressed in one comparison) were identified as color regulators. Differential statistics for these DEGs have been presented in Figure 6. In three comparisons, viz., L vs. H, L vs. Z, and Z vs. H, 103, 120, and 34 DEGs were identified, respectively (Figure 6A). It is interesting that leaf color variation from purple to yellow (Z vs. H) depicted the lowest number of overall DEGs and color-related DEGs, further emphasizing our assumption of minimal changes in gene expression from purple to yellow while requiring extensive changes in color variation from purple to yellow to green. We further characterized the expression of each gene in three tissues. Moreover, based on PCC calculated using corresponding FPKM values, the identified DEGs can be classified into five groups (Figure 6B).
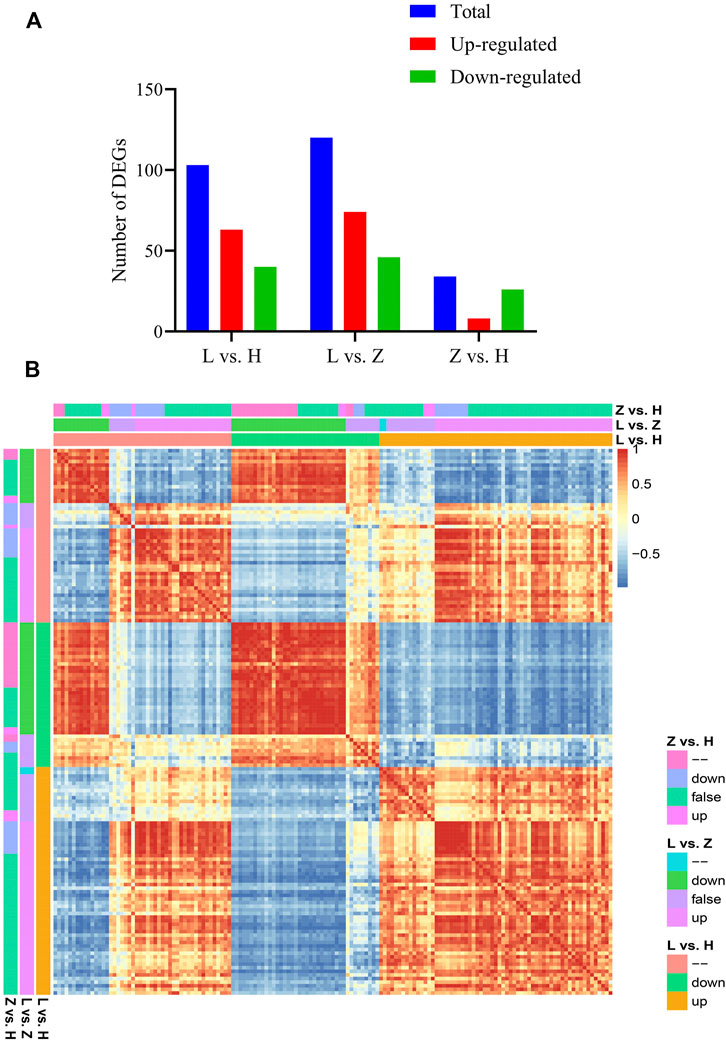
FIGURE 6. Characterization of color-related DEGs identified based on the annotation information. (A) statistics for color-related DEGs in three comparisons between green, yellow, and purple leaves, viz., L vs. H, L vs. Z, and Z vs. H. (B) correlation plot representing PCC between color-related DEGs (151), where down = downregulated, up = upregulated, false = log2Fold Change is between −1 and 1.
Forty genes encoding cytochrome P450, UDP-glucoronosyl, and UDP-glucosyl transferase, PDDEXK-like, non-haem dioxygenase in morphine synthesis N-terminal, O-methyltransferase domain, glycosyltransferase 4-like domain, NAD-dependent epimerase/dehydratase family, 2OG-Fe (II) oxygenase superfamily, Kelch motif, heam oxygenase, and Myb-like DNA-binding domain depicted significant upregulation in green leaves compared to yellow and purple leaves, suggesting a significant role of these DEGs in regulating pigmentation in C. ensifolium leaves. On the other hand, 11 genes, viz., Cluster-12991.59020, Cluster-12991.60709, Cluster-12991.120400, Cluster-12991.121138, Cluster-12991.121355, Cluster-12991.116930, Cluster-12991.92049, Cluster-12991.108016, Cluster-12991.110524, Cluster-12991.106370, and Cluster-12991.108125, depicted conserved differential expression in all three comparisons. These genes encode cytochrome P450, NmrA-like family, O-methyltransferase domain, UDP-glucoronosyl, UDP-glucosyl transferase, chalcone and stilbene synthases, N-terminal domain, and AMP-binding enzyme. It is interesting that only cytochrome was upregulated in green leaves compared to yellow and purple leaves, whereas genes encoding NmrA-like family, O-methyltransferase domain, UDP-glucoronosyl, UDP-glucosyl transferase, chalcone, stilbene synthases N-terminal domain, and AMP-binding enzyme displayed the highest expression in purple leaves. Therefore, we assume that differential expression of these genes might be the key reason for leaf color variation in C. ensifolium, and a gradual decrease in expression leads to the color variation from purple to yellow to green leaves.
Moreover, 31 DEGs were upregulated in green leaves compared to yellow and purple leaves. These genes include cytochrome P450 CYP2 subfamily, iron/ascorbate family oxidoreductases, UDP-glucuronosyl and UDP-glucosyl transferase, flavonol reductase/cinnamoyl-CoA reductase, iron/ascorbate family oxidoreductases, FOG: Kelch repeat, heam oxygenase, Myb superfamily, and their homologs. On the other hand, only two genes, viz., Cluster-12991.164172 and Cluster-12991.59020 (cytochrome P450 homologs), Genes in green leaves are compared with yellow and purple leaves (Supplementary Table S5).
Genes and pathways regulating leaf coloration in C. ensifolium
Together, chlorophyll contents, anthocyanins and flavonoid profiling, and transcriptomic characterization improve our understanding of leaf color variation in C. ensifolium. Chlorophyll contents are major pigmentation for green color variation in plants. Therefore, we characterized the genes associated with chlorophyll contents and identified 101 DEGs associated with chlorophyll contents. These DEGs encoding chlorophyll A–B binding protein, coenzyme F420 hydrogenase/dehydrogenase, photosystem II protein, Myb-like DNA-binding domain, NAD(P)H-binding, photosystem I psaA/psaB protein, ABC1, Rieske (2Fe-2S) domain, PPR, NUBPL iron transfer P-loop NTPase, and PCRF were identified (Figure 7 and Supplementary Table S5). It is interesting that the number of DEGs increased from purple to yellow to green leaves, which is consistent with a gradual increase in chlorophyll contents. Comparison Z vs. H depicted upregulation of 25 genes, whereas 65 and 58 DEGs depicted upregulation in green leaves compared to purple and yellow leaves, respectively (Figures 7A,B). The results provide a molecular basis to further manipulate the chlorophyll accumulation pattern in C. ensifolium.
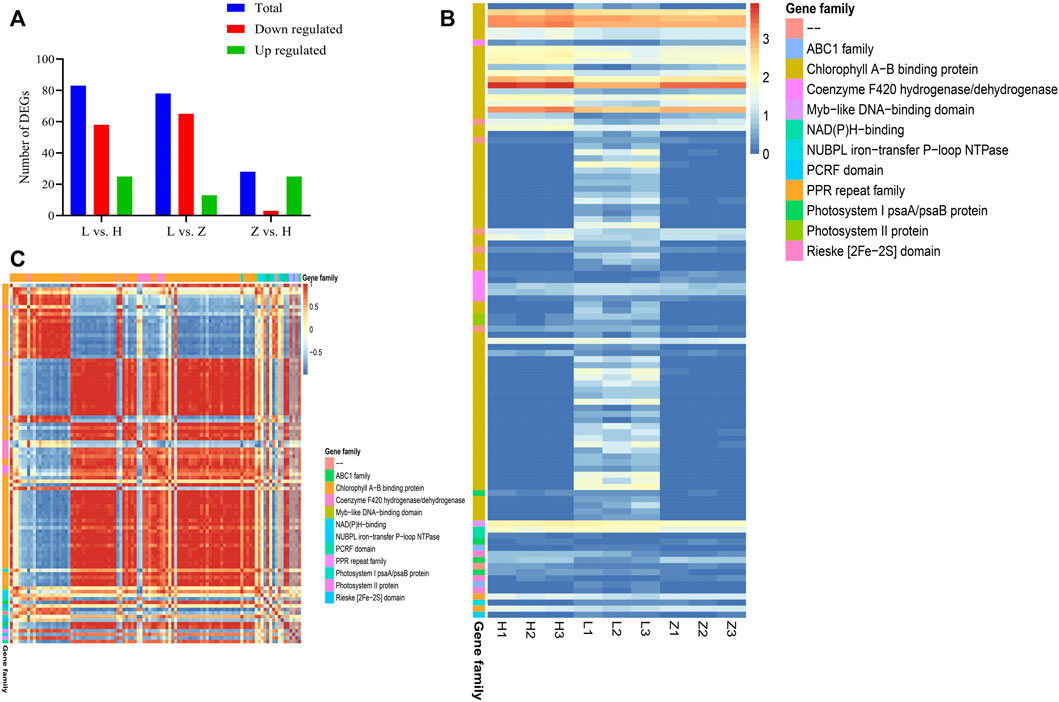
FIGURE 7. Characterization of DEGs associated with the chlorophyll contents. (A) statistics for chlorophyll-related DEGs in three comparisons between green, yellow, and purple leaves, viz., L vs. H, L vs. Z, and Z vs. H. (B) heatmap of 151 chlorophyll-related DEGs based on corresponding FPKM values. (C) correlation plot representing PCC between 101 chlorophyll-related DEGs.
Anthocyanins accumulation pattern in three colored leaves suggested the absence of cyanidin-3,5-O-diglucoside, pelargonidin-3-O-glucoside, peonidin-3,5-O-diglucoside, cyanidin-3-O-rutinoside, malvidin-3-O-(6-O-malonyl-beta-D-glucoside), peonidin-3-O-glucoside, peonidin-3-O-rutinoside, petunidin-3-O-arabinoside, cyanidin-3-rutinoside-5-glucoside, delphinidin-3-O-(6-O-malonyl-beta-D-glucoside), and pelargonidin-3-O-rutinoside in green leaves. Based on annotation information, we screened 22 DEGs from four gene families: transferase family, cytochrome P450, ABC1 family, and UDP-glucosyl transferase (Supplementary Table S5). It is interesting that most of the DEGs associated with anthocyanin accumulation were downregulated in green leaves, except for four genes, viz., Cluster-12991.114567, Cluster-12991.113887, Cluster-12991.201069, and Cluster-12991.153858. Moreover, dihydroflavonol 4-reductase (DFR), a major gene in the anthocyanin biosynthesis pathway, was identified with downregulation in green leaves compared to yellow and purple leaves. Seven genes, viz., Cluster-12991.119374, Cluster-12991.119375, Cluster-12991.119368, Cluster-12991.119369, Cluster-12991.119371, Cluster-12991.119372, and Cluster-12991.119373 were identified encoding DFR protein (Supplementary Table S5). Anthocyanin accumulation pattern and differential regulation of genes encoding DFR suggested the key role of DFR genes in regulating leaf color in C. ensifolium (Figure 8). Together, the differential regulation of genes associated with anthocyanin accumulation regulates leaf coloration in C. ensifolium.
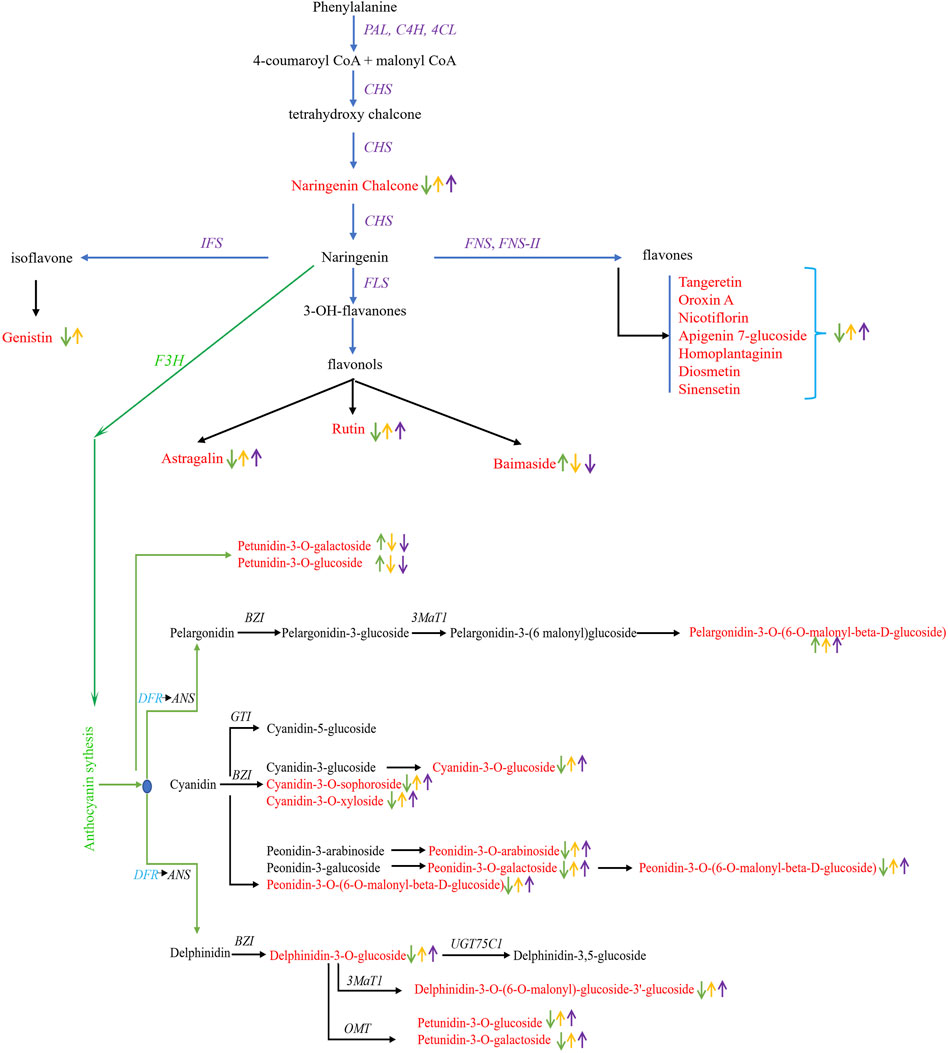
FIGURE 8. Differential regulation of flavonoid biosynthesis in C. ensifolium leaves. Differentially accumulated flavonoids and anthocyanins are presented in red text. The upward and downward arrows in green, yellow, and purple color indicated the accumulation pattern in green, yellow, and purple leaves, respectively. The pathway was reconstructed by following the layout and nomenclature available on https://www.genome.jp/kegg/kegg2.html.
qRT-PCR-based validation of selected genes
We selected 20 genes based on their corresponding annotation information and differential expression in green, yellow, and purple leaves to further verify their expression pattern through qRT-PCR (Supplementary Table S6). Similar to expression patterns in transcriptome data, qRT_PCR results depicted significant variation in the regulation pattern of the 20 selected genes (Figure 9). Among the 20 genes, 9, 7, and 4 were related to flavonoid biosynthesis, chlorophyll accumulation, and anthocyanin biosynthesis, respectively. Comparisons L vs. H and L vs. Z identified the most significant variation in gene expression. Cluster-12991.59020, Cluster-12991.60709, Cluster-12991.174940, Cluster-12991.165439, and Cluster-12991.201069 were identified with higher expression in purple tissues compared to yellow and green tissues. It is interesting that all the genes except Cluster-12991.125725 showed similar expression patterns in yellow and purple leaves, whereas Cluster-12991.125725 showed a lower expression level in yellow leaves than in purple leaves.
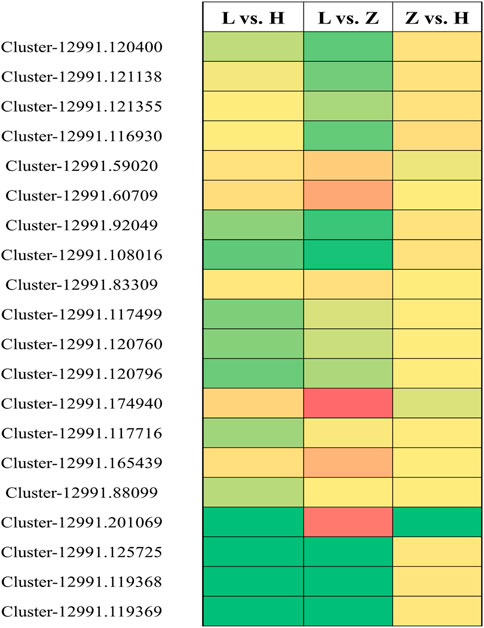
FIGURE 9. qRT-PCR-based verification for 20 selected genes related to flavonoid biosynthesis, chlorophyll accumulation, and anthocyanin synthesis. Green, yellow, and red boxes indicate unchanged, moderately upregulated, and highly upregulated genes, respectively.
Discussion
The leaf sheath color in C. ensifolium ranges from purple to yellow to green. Aside from flower coloration, leaf color variation is an important additional ornamental characteristic. Flavonoids are involved in the formation and development of flowers, fruits, and seeds in plants and other functions such as antioxidant activity, UV protection, and protection against biotic and abiotic stresses (Samanta et al., 2011; Baskar et al., 2018; Chin et al., 2018; Agati et al., 2020). Most studies concerning ornamentals generally focus on flower color variation and leaf shape (de Souza et al., 2012; Zhao and Tao, 2015; Manzoor et al., 2019). However, the molecular basis of C. ensifolium leaf color variation has not been studied. In this study, we systematically used metabolomics and transcriptomics approaches to identify the major contributors to leaf coloration and screened key genes associated with coloration, providing critical information for the enrichment of C. ensifolium germplasm.
Chlorophyll, flavonoids, and anthocyanins are the primary factors influencing the coloration of different plant organs (Guo et al., 2009; Li et al., 2019). Chlorophyll is the primary pigment developing green color while varying concentration of carotenoids and anthocyanins is necessary for plants’ yellow to purple pigmentation (Wilkinson et al., 2002; Croft et al., 2017). Our results suggested significant differences in chlorophyll accumulation in purple, yellow, and green leaves. In general, chlorophyll degradation coupled with anthocyanins and carotenoids leads to leaf color variation from green to yellow to reddish. However, in C. ensifolium, leaf color changes from purple to yellow to green during developmental phases. Therefore, an increase in chlorophyll contents with successive development provides a strong basis for color variation in C. ensifolium. Moreover, the chlorophyll-related DEGs also depicted significantly higher expression in green leaves, signifying the role of chlorophyll accumulation in green pigmentation.
Several studies have demonstrated the essential role of anthocyanins in color formation. For instance, Xue et al. (2021) depicted the association of anthocyanins with red-colored seed coats in peanuts. A study by Qiu et al. (2020) concerning passion fruit found that the total anthocyanin contents of purple fruit were significantly higher than that of yellow fruit. White, yellow, blue, and pink Primula vulgaris (Li et al., 2020) showed a gradual increase in total anthocyanin content as the color deepened. We identified several anthocyanins with differential expressions in purple, yellow and green leaves. It is interesting that cyanidin-3-O-sophoroside, naringenin-7-O-glucoside, and procyanidin B3 were identified as upaccumulated in purple leaves. Several studies have reported that variable concentrations of cyanidin-3-O-sophoroside result in the development of purple pigmentations in plants (Terahara et al., 2004; Morita et al., 2005; Oliveira et al., 2006). Moreover, Yin et al. (2019) identified naringenin-7-O-glucoside as a potential contributor to the reddish petal color in Brassica napus. Moreover, copigmentation resulting from the differential accumulation of delphinidin, cyanidin, petunidin, and quercetin contributed to yellow leaves, and these results are in line with the findings of several studies (Nielsen et al., 2005; Lambert et al., 2011; Benmeziane et al., 2016; Fu et al., 2018). Several key genes encoding NmrA-like family, O-methyltransferase domain, UDP-glucoronosyl, UDP-glucosyl transferase, chalcone synthesis (CHS), and stilbene synthases N-terminal domain and AMP-binding enzyme were identified as color regulators. CHS is a key regulator in anthocyanin accumulation pathways (Yang et al., 2002). Yang et al. (2002) characterized the CHS gene family as a contributor to the petal color variation in Dendranthema. Further functional verification of these identified genes can unveil regulatory mechanisms underlying pigmentation in C. ensifolium.
Likewise, differential accumulation patterns of flavonoids, such as diosmetin, sinensetin, and naringenin chalcone, depicted a gradual decrease from purple to yellow to green leaves. We considered these flavonoids to be key leaf coloration regulators based on annotation information and previously published statistics. Diosmetin has been previously identified as a major contributor to indigo pigmentation in woad (Pauk et al., 2022). By contrast, sinensetin, along with rosmarinic acid and eupatorine, were identified in Orthosiphon aristatus, regulating color variation from purple to white (Faramayuda et al., 2020). Several DEGs were identified related to phenylpropanoid pathways, including UDP-glucoronosyl and UDP-glucosyl transferase, flavodoxin, cytochrome P450, AMP-binding enzyme, multicopper oxidase, Kelch motif, aldehyde dehydrogenase family, and Myb-like DNA-binding domain.
Several metabolites and key genes were identified through transcriptome and metabolome analysis. Transcriptome analysis is an important tool for identifying genes responsible for a stage-specific trait. The analysis of different comparison groups revealed that only a few genes showed an upregulation trend in expression as leaf color deepened, suggesting that the process of color deepening requires only a few key involvements. Moreover, the functional enrichment of DEGs indicated that changes in differential gene expression caused significant changes in metabolic activities. The results suggested that copigmentation of several anthocyanins and flavonoids governed by structural genes resulted in the color change of C. ensifolium leaves. The study provides a molecular basis for leaf coloration in C. ensifolium. However, further functional verification of identified genes can provide insights into regulatory pathways underlying pigmentation in C. ensifolium. Moreover, C. ensifolium leaves can be used as a source of natural pigmentation.
Data availability statement
Data used in this study is available as accession number PRJNA790719 in the public database of the National Center of Biotechnology Information.
Author contributions
Funding acquisition, HL and JW; sources of material, nursery, and sampling, XC and WZ; writing–original draft, HC and HL; data curation and analysis of the metabolome and transcriptome, YZ, HL, HC, XT, LM, and LL; lab experimental design, qRT-PCR, and chlorophyll quantification, HL, HC, SCL, XC, WZ, and LM; writing—review and editing, XT and LM.
Funding
This research was funded by grants from Yunnan Province Science and Technology Department Technology Talent and Platform Program (202005AD160014), Yunnan Province Science and Technology Department Key Research and Development Program (2018IB012), the Green Food Brand-Build a Special Project (Floriculture) supported by Science and Technology (530000210000000013742), and the National Natural Science Foundation of China (31960612).
Conflict of interest
The authors declare that the research was conducted in the absence of any commercial or financial relationships that could be construed as a potential conflict of interest.
Publisher’s note
All claims expressed in this article are solely those of the authors and do not necessarily represent those of their affiliated organizations, or those of the publisher, the editors, and the reviewers. Any product that may be evaluated in this article, or claim that may be made by its manufacturer, is not guaranteed or endorsed by the publisher.
Supplementary material
The Supplementary Material for this article can be found online at: https://www.frontiersin.org/articles/10.3389/fgene.2022.923082/full#supplementary-material
References
Aceto, S., and Gaudio, L. (2011). The MADS and the beauty: genes involved in the development of orchid flowers. Cg 12, 342–356. doi:10.2174/138920211796429754
Agati, G., Brunetti, C., Fini, A., Gori, A., Guidi, L., Landi, M., et al. (2020). Are flavonoids effective antioxidants in plants? Twenty years of our investigation. Antioxidants 9, 1098. doi:10.3390/antiox9111098
Ai, Y., Li, Z., Sun, W.-H., Chen, J., Zhang, D., Ma, L., et al. (2021). The Cymbidium genome reveals the evolution of unique morphological traits. Hortic. Res. 8. doi:10.1038/s41438-021-00709-6
Albert, N. W., Davies, K. M., Lewis, D. H., Zhang, H., Montefiori, M., Brendolise, C., et al. (2014). A conserved network of transcriptional activators and repressors regulates anthocyanin pigmentation in eudicots. Plant Cell 26, 962–980. doi:10.1105/tpc.113.122069
Baskar, V., Venkatesh, R., and Ramalingam, S. (2018). “Flavonoids (antioxidants systems) in higher plants and their response to stresses,” in Antioxidants and antioxidant enzymes in higher plants. Editors D. K. Gupta, J. M. Palma, and F. J. Corpas (Heidelberg,Germany: Springer), 253–268. doi:10.1007/978-3-319-75088-0_12
Benmeziane, F., Cadot, Y., Djamai, R., and Djermoun, L. (2016). Determination of major anthocyanin pigments and flavonols in red grape skin of some table grape varieties (Vitis vinifera sp.) by high-performance liquid chromatography–photodiode array detection (HPLC-DAD). Oeno One 50, 125–135. doi:10.20870/oeno-one.2016.50.3.56
Cao, H., Ji, Y., Li, S., Lu, L., Tian, M., Yang, W., et al. (2019). Extensive metabolic profiles of leaves and stems from the medicinal plant Dendrobium officinale Kimura et Migo. Metabolites 9, 215. doi:10.3390/metabo9100215
Chen, C., Chen, H., Zhang, Y., Thomas, H. R., Frank, M. H., He, Y., et al. (2020). TBtools: an integrative toolkit developed for interactive analyses of big biological data. Mol. plant 13, 1194–1202. doi:10.1016/j.molp.2020.06.009
Chin, S., Behm, C., and Mathesius, U. (2018). Functions of Flavonoids in plant-nematode interactions. Plants 7, 85. doi:10.3390/plants7040085
Choi, S. H., Kim, M. J., Lee, J. S., and Ryu, K. H. (2006). Genetic diversity and phylogenetic relationships among and within species of oriental cymbidiums based on RAPD analysis. Sci. Hortic. 108, 79–85. doi:10.1016/j.scienta.2006.01.010
Croft, H., Chen, J. M., Luo, X., Bartlett, P., Chen, B., and Staebler, R. M. (2017). Leaf chlorophyll content as a proxy for leaf photosynthetic capacity. Glob. Change Biol. 23, 3513–3524. doi:10.1111/gcb.13599
De Souza, E. H., Souza, F. V. D., De Carvalho Costa, M. A. P., Costa, D. S., Dos Santos-Serejo, J. A., Amorim, E. P., et al. (2012). Genetic variation of the Ananas genus with ornamental potential. Genet. Resour. Crop Evol. 59, 1357–1376. doi:10.1007/s10722-011-9763-9
Dixon, R. A., and Paiva, N. L. (1995). Stress-induced phenylpropanoid metabolism. plant Cell 7, 1085. doi:10.2307/3870059
Fan, X., Fan, B., Wang, Y., and Yang, W. (2016). Anthocyanin accumulation enhanced in Lc-transgenic cotton under light and increased resistance to bollworm. Plant Biotechnol. Rep. 10, 1–11. doi:10.1007/s11816-015-0382-3
Faramayuda, F., Mariani, T. S., Elfahmi, E., and Sukrasno, S. (2020). Callus induction in purple and white-purple varieties of Orthosiphon aristatus (Blume) Miq. Biodiversitas J. Biol. Divers. 21, 4967–4972. doi:10.13057/biodiv/d211063
Fiehn, O., Kopka, J., Dörmann, P., Altmann, T., Trethewey, R. N., and Willmitzer, L. (2000). Metabolite profiling for plant functional genomics. Nat. Biotechnol. 18, 1157–1161. doi:10.1038/81137
Freyre, R., and Griesbach, R. J. (2004). Inheritance of flower color in Anagallis monelli L. HortSci 39, 1220–1223. doi:10.21273/hortsci.39.6.1220
Fu, M., Yang, X., Zheng, J., Wang, L., Yang, X., Tu, Y., et al. (2021). Unraveling the regulatory mechanism of color diversity in Camellia japonica petals by integrative transcriptome and metabolome analysis. Front. Plant Sci. 12, 685136. doi:10.3389/fpls.2021.685136
Fu, X., Cheng, S., Liao, Y., Huang, B., Du, B., Zeng, W., et al. (2018). Comparative analysis of pigments in red and yellow banana fruit. Food Chem. 239, 1009–1018. doi:10.1016/j.foodchem.2017.07.046
Gao, J., Liang, D., Xu, Q., Yang, F., and Zhu, G. (2020). Involvement of CsERF2 in leaf variegation of cymbidium sinense 'dharma'. Planta 252, 29–15. doi:10.1007/s00425-020-03426-x
Grotewold, E. (2006). The genetics and biochemistry of floral pigments. Annu. Rev. Plant Biol. 57, 761–780. doi:10.1146/annurev.arplant.57.032905.105248
Guo, J., Han, W., and Wang, M. H. (2009). Ultraviolet and environmental stresses involved in the induction and regulation of anthocyanin biosynthesis: A review. Afr. J. Biotechnol. 725, 4966–4972.
Harborne, J. B. (1968). Comparative biochemistry of the flavonoids-VII. Phytochemistry 7, 1215–1230. doi:10.1016/s0031-9422(00)85616-2
Harborne, J. B. (1965). Plant polyphenols-XV. Phytochemistry 4, 647–657. doi:10.1016/s0031-9422(00)86234-2
Harborne, J. (2014). Introduction to ecological biochemistry. Massachusetts, United States: Academic Press.
Hichri, I., Barrieu, F., Bogs, J., Kappel, C., Delrot, S., and Lauvergeat, V. (2011). Recent advances in the transcriptional regulation of the flavonoid biosynthetic pathway. J. Exp. Bot. 62, 2465–2483. doi:10.1093/jxb/erq442
Ke, Y.-J., Zheng, Q.-D., Yao, Y.-H., Ou, Y., Chen, J.-Y., Wang, M.-J., et al. (2021). Genome-wide identification of the MYB gene family in cymbidiumensifolium and its expression analysis in different flower colors. Ijms 22, 13245. doi:10.3390/ijms222413245
Kim, D., Paggi, J. M., Park, C., Bennett, C., and Salzberg, S. L. (2019). Graph-based genome alignment and genotyping with HISAT2 and HISAT-genotype. Nat. Biotechnol. 37, 907–915. doi:10.1038/s41587-019-0201-4
Lambert, S. G., Asenstorfer, R. E., Williamson, N. M., Iland, P. G., and Jones, G. P. (2011). Copigmentation between malvidin-3-glucoside and some wine constituents and its importance to colour expression in red wine. Food Chem. 125, 106–115. doi:10.1016/j.foodchem.2010.08.045
Li, L., Ye, J., Li, H., and Shi, Q. (2020). Characterization of metabolites and transcripts involved in Flower pigmentation in Primula vulgaris. Front. Plant Sci. 11, 572517. doi:10.3389/fpls.2020.572517
Li, M., Coneva, V., Robbins, K. R., Clark, D., Chitwood, D., and Frank, M. (2021). Quantitative dissection of color patterning in the foliar ornamental coleus. Plant physiol. 187, 1310–1324. doi:10.1093/plphys/kiab393
Li, X., Xu, W., Chowdhury, M., and Jin, F. (2014). Comparative proteomic analysis of labellum and inner lateral petals in Cymbidium ensifolium flowers. Ijms 15, 19877–19897. doi:10.3390/ijms151119877
Li, Y., Sun, Y., Jiang, J., and Liu, J. (2019). Spectroscopic determination of leaf chlorophyll content and color for genetic selection on Sassafras tzumu. Plant methods 15, 73–11. doi:10.1186/s13007-019-0458-0
Liang, J., and He, J. (2018). Protective role of anthocyanins in plants under low nitrogen stress. Biochem. Biophysical Res. Commun. 498, 946–953. doi:10.1016/j.bbrc.2018.03.087
Love, M. I., Huber, W., and Anders, S. (2014). Moderated estimation of fold change and dispersion for RNA-seq data with DESeq2. Genome Biol. 15, 550–621. doi:10.1186/s13059-014-0550-8
Manzoor, A., Ahmad, T., Bashir, M., Hafiz, I., and Silvestri, C. (2019). Studies on colchicine induced chromosome doubling for enhancement of quality traits in ornamental plants. Plants 8, 194. doi:10.3390/plants8070194
Morita, Y., Hoshino, A., Kikuchi, Y., Okuhara, H., Ono, E., Tanaka, Y., et al. (2005). Japanese morning glory dusky mutants displaying reddish‐brown or purplish‐gray flowers are deficient in a novel glycosylation enzyme for anthocyanin biosynthesis, UDP‐glucose: anthocyanidin 3‐O‐glucoside‐2′′‐O‐glucosyltransferase, due to 4‐bp insertions in the gene. Plant J. 42, 353–363. doi:10.1111/j.1365-313x.2005.02383.x
Nakabayashi, R., Yonekura‐Sakakibara, K., Urano, K., Suzuki, M., Yamada, Y., Nishizawa, T., et al. (2014). Enhancement of oxidative and drought tolerance in Arabidopsis by overaccumulation of antioxidant flavonoids. Plant J. 77, 367–379. doi:10.1111/tpj.12388
Nakatsuka, T., Suzuki, T., Harada, K., Kobayashi, Y., Dohra, H., and Ohno, H. (2019). Floral organ-and temperature-dependent regulation of anthocyanin biosynthesis in Cymbidium hybrid flowers. Plant Sci. 287, 110173. doi:10.1016/j.plantsci.2019.110173
Nielsen, A. H., Olsen, C. E., and Møller, B. L. (2005). Flavonoids in flowers of 16 Kalanchoe blossfeldiana varieties. Phytochemistry 66, 2829–2835. doi:10.1016/j.phytochem.2005.09.041
Ogura-Tsujita, Y., Miyoshi, K., Tsutsumi, C., and Yukawa, T. (2014). First flowering hybrid between autotrophic and mycoheterotrophic plant species: breakthrough in molecular biology of mycoheterotrophy. J. plant Res. 127, 299–305. doi:10.1007/s10265-013-0612-0
Oliveira, J., Fernandes, V., Miranda, C., Santos-Buelga, C., Silva, A., De Freitas, V., et al. (2006). Color properties of four cyanidin− pyruvic acid adducts. J. Agric. food Chem. 54, 6894–6903. doi:10.1021/jf061085b
Pauk, V., Michalčáková, J., Jagošová, K., and Lemr, K. (2022). Origin of indigo colorants revealed by ion mobility spectrometry coupled to mass spectrometry followed by supervised classification. Dyes Pigments 197, 109943. doi:10.1016/j.dyepig.2021.109943
Qiu, W., Su, W., Cai, Z., Dong, L., Li, C., Xin, M., et al. (2020). Combined analysis of transcriptome and metabolome reveals the potential mechanism of coloration and Fruit quality in yellow and purple Passiflora edulis sims. J. Agric. Food Chem. 68, 12096–12106. doi:10.1021/acs.jafc.0c03619
Ramya, M., Jang, S., An, H.-R., Lee, S.-Y., Park, P.-M., and Park, P. H. (2020). Volatile organic compounds from orchids: From synthesis and function to gene regulation. Int. J. Mol. Sci. 21, 1160. doi:10.3390/ijms21031160
Santos-Buelga, C., Mateus, N., and De Freitas, V. (2014). Anthocyanins. Plant pigments and beyond. J. Agric. Food Chem. 62, 6879–6884. doi:10.1021/jf501950s
Siripiyasing, P., Kaenatana, K., Mokkamul, P., Tanee, T., Sudmoon, R., and Chaveerach, A. (2012). DNA barcoding of the Cymbidium species (Orchidaceae) in Thailand. Afr. J. Agric. Res. 7, 393–404. doi:10.5897/ajar11.1434
Tanaka, Y., Tsuda, S., and Kusumi, T. (1998). Metabolic engineering to modify flower color. Plant Cell physiology 39, 1119–1126. doi:10.1093/oxfordjournals.pcp.a029312
Team, R. C. (2013). R: A language and environment for statistical computing. Vienna, Austria: R Foundation for Statistical Computing. http://www.Rproject.org/.
Terahara, N., Konczak, I., Ono, H., Yoshimoto, M., and Yamakawa, O. (2004). Characterization of acylated anthocyanins in callus induced from storage root of purple-fleshed sweet potato, Ipomoea batatas L. J. Biomed. Biotechnol., 2004(5), 279–286. doi:10.1155/s1110724304406056
Ververidis, F., Trantas, E., Douglas, C., Vollmer, G., Kretzschmar, G., and Panopoulos, N. (2007). Biotechnology of flavonoids and other phenylpropanoid‐derived natural products. Part II: Reconstruction of multienzyme pathways in plants and microbes. Biotechnol. J. Healthc. Nutr. Technol. 2, 1235–1249. doi:10.1002/biot.200700184
Wang, H.-Z., Lu, J.-J., Hu, X., and Liu, J.-J. (2011). Genetic variation and cultivar identification in Cymbidium ensifolium. Plant Syst. Evol. 293, 101–110. doi:10.1007/s00606-011-0429-z
Wang, Y., Zeng, X., Xu, Q., Mei, X., Yuan, H., Jiabu, D., et al. (2019). Metabolite profiling in two contrasting Tibetan hulless barley cultivars revealed the core salt-responsive metabolome and key salt-tolerance biomarkers. AoB Plants 11, plz021. doi:10.1093/aobpla/plz021
Wei, Y., Jin, J., Yao, X., Lu, C., Zhu, G., and Yang, F. (2020). Transcriptome Analysis Reveals Clues into leaf-like flower mutant in Chinese orchid Cymbidium ensifolium. Plant Divers. 42, 92–101. doi:10.1016/j.pld.2019.12.001
Wheeler, L. C., and Smith, S. D. (2019). Computational modeling of anthocyanin pathway evolution: biases, hotspots, and trade-offs. Integr. Comp. Biol. 59, 585–598. doi:10.1093/icb/icz049
Wilkinson, D. M., Sherratt, T. N., Phillip, D. M., Wratten, S. D., Dixon, A. F., and Young, A. J. (2002). The adaptive significance of autumn leaf colours. Oikos 99, 402–407. doi:10.1034/j.1600-0706.2002.990223.x
Winkel-Shirley, B. (2002). Biosynthesis of flavonoids and effects of stress. Curr. Opin. plant Biol. 5, 218–223. doi:10.1016/s1369-5266(02)00256-x
Xu, Y., Teo, L. L., Zhou, J., Kumar, P. P., and Yu, H. (2006). Floral organ identity genes in the orchid Dendrobium crumenatum. Plant J. 46, 54–68. doi:10.1111/j.1365-313x.2006.02669.x
Xu, Z., and Rothstein, S. J. (2018). ROS-Induced anthocyanin production provides feedback protection by scavenging ROS and maintaining photosynthetic capacity in Arabidopsis. Plant Signal Behav. 13, e1451708. doi:10.1080/15592324.2018.1451708
Xue, Q., Zhang, X., Yang, H., Li, H., Lv, Y., Zhang, K., et al. (2021). Transcriptome and metabolome analysis unveil anthocyanin metabolism in pink and red testa of peanut (Arachis hypogaea L.). Int. J. Genomics 2021, 5883901. doi:10.1155/2021/5883901
Yamamizo, C., Hirashima, M., Kishimoto, S., and Ohmiya, A. (2011). Carotenoid composition in the yellow and pale green petals of Primula species. Bull. Natl. Inst. Flor. Sci. 11, 67–72.
Yang, J., Huang, J., Gu, H., Zhong, Y., and Yang, Z. (2002). Duplication and adaptive evolution of the chalcone synthase genes of Dendranthema (Asteraceae). Mol. Biol. Evol. 19, 1752–1759. doi:10.1093/oxfordjournals.molbev.a003997
Yin, N.-W., Wang, S.-X., Jia, L.-D., Zhu, M.-C., Yang, J., Zhou, B.-J., et al. (2019). Identification and characterization of major constituents in different-colored rapeseed petals by UPLC–HESI-MS/MS. J. Agric. food Chem. 67, 11053–11065. doi:10.1021/acs.jafc.9b05046
Yin, X., Lin, X., Liu, Y., Irfan, M., Chen, L., and Zhang, L. (2020). Integrated metabolic profiling and transcriptome analysis of pigment accumulation in diverse petal tissues in the lily cultivar 'Vivian. BMC Plant Biol. 20, 446. doi:10.1186/s12870-020-02658-z
Keywords: leaf coloration, RNA-seq, flavonoid biosynthesis, chlorophyll accumulation, pigment
Citation: Cao H, Li H, Chen X, Zhang Y, Lu L, Li S, Tao X, Zhu W, Wang J and Ma L (2022) Insight into the molecular mechanisms of leaf coloration in Cymbidium ensifolium. Front. Genet. 13:923082. doi: 10.3389/fgene.2022.923082
Received: 18 April 2022; Accepted: 27 June 2022;
Published: 12 August 2022.
Edited by:
Samir Sawant, National Botanical Research Institute (CSIR), IndiaReviewed by:
Irfan Ali Sabir, Shanghai Jiao Tong University, ChinaShelby Ellison, University of Wisconsin-Madison, United States
Copyright © 2022 Cao, Li, Chen, Zhang, Lu, Li, Tao, Zhu, Wang and Ma. This is an open-access article distributed under the terms of the Creative Commons Attribution License (CC BY). The use, distribution or reproduction in other forums is permitted, provided the original author(s) and the copyright owner(s) are credited and that the original publication in this journal is cited, in accordance with accepted academic practice. No use, distribution or reproduction is permitted which does not comply with these terms.
*Correspondence: Lulin Ma, mll@yaas.org.com; Jihua Wang, wjh@yaas.org.cn
†These authors have contributed equally to this work and share the first authorship
 Hua Cao
 Han Li1†
 Lin Lu