 Yan Gao
 Jin-Yuan Li
 Jia-Ying Mao
 Jia-Fan Zhou
 Lu Jiang
 Xue-Ping Li
- 1Department of Medical Oncology, Sun Yat-sen University Cancer Center, Guangzhou, China
- 2State Key Laboratory of Oncology in South China, Collaborative Innovation Center for Cancer Medicine, Guangzhou, China
- 3Department of Hematologic Oncology, Sun Yat-sen University Cancer Center, Guangzhou, China
- 4Department of Nephrology, The Sixth Affiliated Hospital, Sun Yat-sen University, Guangzhou, China
- 5Shanghai Institute of Hematology, State Key Laboratory of Medical Genomics, National Research Center for Translational Medicine at Shanghai, Ruijin Hospital, Shanghai Jiao Tong University School of Medicine, Shanghai, China
Acute myeloid leukemia (AML) is a highly heterogeneous hematological malignancy that imposes great challenges in terms of drug resistance and relapse. Previous studies revealed heterogeneous leukemia cells and their relevant gene markers, such as CRIP1 as clinically prognostic in t (8;21) AML patients. However, the expression and role of CRIP1 in AML are poorly understood. We used the single-cell RNA sequencing and gene expression data from t (8;21) AML patients to analyze the immune and regulation networks of CRIP1. Two independent cohorts from GSE37642 and The Cancer Genome Atlas (TCGA) datasets were employed as validation cohorts. In addition, the methylation data from TCGA were used to analyze the methylation effect of the CRIP1 expression. Gene expression profile from t (8;21) AML patients showed that the CRIP1-high group exhibited an enrichment of immune-related pathways, including tumor necrosis factor (TNF)α signaling via nuclear factor kappa B (NFκB) pathways. Further studies using CIBERSORT showed that the CRIP1-high group had a significantly higher infiltration of exhausted CD8 T cells and activated mast cells. The CRIP1 expression was validated in the GSE37642-GPL96, GSE37642-GPL570, and TCGA datasets. In addition, with the methylation data, four CpG probes of CRIP1 (cg07065217, cg04411625, cg25682097, and 11763800) were identified as negatively associated with the CRIP1 gene expression in AML patients. Our data provide a comprehensive overview of the regulation of CRIP1 expression in AML patients. The evaluation of the TNFα-NFκB signaling pathway as well as the immune heterogeneity might provide new insights for exploring improvements in AML treatment.
Introduction
Acute myeloid leukemia (AML) is a highly heterogeneous hematological malignancy characterized by the malignant proliferation of clonal myeloid precursor cells that progress rapidly (Döhner et al., 2015). t (8;21) AML related to the RUNX1-RUNX1T1 (AML1-ETO, AE) fusion gene, accounts for approximately 7% of adult primary AML (Arber et al., 2016; Faber et al., 2016; Papaemmanuil et al., 2016; Döhner et al., 2017). At present, with standard chemotherapy (anthracycline combined with cytarabine) , t (8;21) AML patients under the age of 60 could achieve a complete remission rate (CR) of more than 80%. However, over 40% of t (8;21) AML patients relapsed and responded poorly to salvage chemotherapy, with the 5-year overall survival (OS) rate less than 50% (Zhu et al., 2013; Hospital et al., 2014; Papaemmanuil et al., 2016).
AML leukemia cells can evade the surveillance of the bone marrow (BM) immune system. Immune dysfunction of AML, including the downregulation of major histocompatibility complex class II genes, is associated with relapse (Christopher et al., 2018). In addition, the impaired immune cells (such as T cells and NK cells) of the AML BM microenvironment are prognostic of clinical outcome (Fauriat et al., 2007; Lion et al., 2012; van Galen et al., 2019; Tang et al., 2020).
In recent years, with the rapid development of single-cell sequencing, researchers have been able to discover previously unknown cells, especially the heterogeneity of immune-infiltrating cells in the tumor microenvironment (Guo et al., 2018; Li et al., 2019; Zhang et al., 2020). Through single-cell RNA-seq (scRNA-seq) analysis, we previously identified the CD34+CD117dim leukemia cells and their characteristic gene markers (LGALS1, EMP3,and CRIP1) in t (8;21) AML patients (Jiang et al., 2020). A retrospective analysis confirmed that the proportion of the CD34+CD117dim cells was clinically relevant to the OS.
Among the markers of the CD34+CD117dim cells, cysteine-rich intestinal protein (CRIP1) belongs to the LIM/double-zinc finger protein family and is abnormally expressed in a variety of tumors, including breast cancer, colorectal tumors, and thyroid cancer (Ludyga et al., 2013; Li et al., 2017; He et al., 2019; Zhang et al., 2019). CRIP1 may have tumor-type-specific oncogenic or tumor-suppressive properties (Sun et al., 2021). In detail, using the RNA-seq data from the Cancer Genome Atlas (TCGA) AML project, we discovered that CRIP1 was highly expressed in AML patients, including the M0–M7 subtypes (Li et al., 2021). Using the COX regression model, our previous research demonstrated CRIP1 as an independent risk factor for the OS of t (8;21) AML patients (Li et al., 2021). However, the regulation of CRIP1 expression in t (8;21) AML leading to poor outcomes as well as the clinical significance of CRIP1 in AML remain unclear. This study analyzed the immune infiltration state as well as the epigenetic effect on the CRIP1 expression in AML.
Methods
Data Collection
scRNA-seq data via 10x Genomics and RNA-seq data of t (8;21) AML patients were downloaded from our previous studies, which were deposited in the National Omics Data Encyclopedia (http://www.biosino.org/node/project/detail/OEP000629). Detailed treatment information was provided, as previously described (Jiang et al., 2020). This study was approved by the Ruijin Hospital Review Board, and informed consent was obtained from all patients in accordance with the Declaration of Helsinki. Clinical and transcriptome information of TCGA LAML was downloaded from the online database (https://portal.gdc.cancer.gov/) (Cancer Genome Atlas Research et al., 2013). GSE37642 (AMLCG 1999) and GSE116438 could be downloaded from the Gene Expression Omnibus databases.
Gene Expression Analysis
To quantify the RUNX1-RUNX1T1 transcript, Salmon (Patro et al., 2017) were used to determine the transcripts per kilobase million value, as previously described (Jiang et al., 2020). Gene set enrichment analysis (GSEA) was performed using the GSEA software (www.broadinstitute.org/gsea) and the Molecular Signatures Database, as described previously (Jiang et al., 2020; Li et al., 2021). The ingenuity pathway analysis (IPA) software (Qiagen Redwood City) with the default parameters was employed to identify the upstream regulator.
Protein–Protein Interaction Network Construction
The signature of CD34+CD117dim populations was extracted from previous scRNA-seq data with the criteria of an average log Fold Change (avg_logFC) > 0.5 and an adjusted p value <0.05. The Search Tool for the Retrieval of Interacting Genes/Proteins (STRING) database (https://cn.string-db.org) was then used to predict the protein–protein interaction (PPI) network (Szklarczyk et al., 2021) of the signature of CD34+CD117dim populations. The minimum required interaction score was 0.4, and the interaction predictions included text mining, experiments, databases, etc.
Immune Infiltration Analysis in Acute Myeloid Leukemia Dataset
To study the enrichment of immune cells in the BM microenvironment of AML patients, we used CIBERSORT (Newman et al., 2015). For each sample, relative abundance of 22 types of infiltrating immune cells, including T, B, and NK cells, and macrophages were analyzed. A correlation between immune cells inferred by CIBERSORT and CRIP1 expression was evaluated using Spearman’s correlation. The distribution of immune cells between high- and low-CRIP1 groups was compared using two-sided Wilcoxon test.
Cancer Cell Line Encyclopedia Database
The gene expression data of cancer cell line encyclopedia (CCLE) were extracted from the dataset (https://portals.broadinstitute.org/ccle/data) (Barretina et al., 2012) for analysis.
MEXPRESS, cBioPortal, and Cistrome
MEXPRESS (http://mexpress.be) (Koch et al., 2019) and cBioPortal (http://cbioportal.org/) (Gao et al., 2013) were utilized to explore the association between the CRIP1 expression and methylation levels at multiple DNA sites. The CistromeDB Toolkit (http://dbtoolkit.cistrome.org/) (Zheng et al., 2019) was used to analyze a large database of uniformly analyzed published ChIP-seq data.
Genomics of Drug Sensitivity in Cancer Database
RNA-seq and predicted chemotherapeutic response were downloaded from the Genomics of Drug Sensitivity in Cancer (GDSC) database (https://www.cancerrxgene.org/) (Yang et al., 2013). The prediction process was implemented by R package “pRRophetic.” The samples’ half-maximal inhibitory concentration (IC50) was estimated using ridge regression. All the parameters were set as the default values. Using the batch effect of the combat and tissue type of all tissue, the duplicate gene expression was summarized as the mean value.
Statistical Analysis
Univariate COX regression analysis and forest analysis were performed using the forestplot package. The Kaplan–Meier method was employed to estimate the probabilities of OS and relapse-free survival, and the log-rank test was used to compare the p value. Statistical analyses were performed using R software (version 4.0.2, https://www.r-project.org/).
Results
Clinical Features and Outcomes for CRIP1 in Acute Myeloid Leukemia Patients
The previous scRNA-seq data of nine t (8;21) AML patients were used (Jiang et al., 2020). The signatures of CD34+CD117dim populations were extracted using the criteria of an average log Fold Change (avg_logFC) >0.5 and an adjusted p value <0.05 (Supplementary Table S1). We then used the STRING database (https://cn.string-db.org) to analyze the PPI network (Supplementary Figure S1).
Out of all hub genes, CRIP1 was demonstrated to be the prognostic of t (8;21) AML patients using the COX regression model, and it was highly expressed in AML subtypes, including M0–M7 (Li et al., 2021). For AML subtypes M0 and M2, patients with a higher CRIP1 expression showed a significantly worse OS (Supplementary Figure S2). In addition, we analyzed the correlation of CRIP1 expression with clinical characteristics, including age, sex, white blood cell (WBC) count, and gene mutations. The AML patients with a higher WBC count had a significantly higher CRIP1 expression (p < 0.001), while the gene mutations, including TP53, RUNX1, and FLT3-ITD, had no significant correlation with CRIP1 expression (Supplementary Figure S3). Here, based on previous research, we attempted to reveal the expression and regulation of CRIP1 in AML patients.
Immune Dysregulation in the CRIP1-High Group of t (8;21) AML Patients
First, to explore the upregulation pathway of CRIP1 in t (8;21) AML patients, the gene expression profile from previous RNA-seq data of 62 de novo t (8;21) AML patients was analyzed (Jiang et al., 2020). The patients were classified into high- and low-CRIP1 groups according to the median value of CRIP1 expression. GSEA results revealed that the CRIP1-high group (n = 31) had an enrichment of immune-related pathway, such as IL2-STAT5 signaling, IL6-JAK-STAT3 signaling, and tumor necrosis factor (TNF)α signaling via the nuclear factor kappa B (NFκB) pathways (Figures 1A,B). For the CRIP1-low group (n = 31), we observed a significant enrichment of DNA repair and E2F target pathway (Figure 1A). This highly activated immune-related pathway indicated immune dysregulation in the CRIP1-high group of t (8;21) AML patients.

FIGURE 1. Gene set enrichment analysis (GSEA) and immune infiltration analysis of CRIP1 expression in the t (8;21) acute myeloid leukemia (AML) patients. (A) Top enriched pathways in the high- (n = 31) and low- (n = 31) CRIP1 expression groups from the 62 de novo t (8;21) AML patients. They were classified based on the median level of CRIP1 expression. (B) Representative GSEA plots showing the activated immune-related pathways in the high-CRIP1 expression group from the t (8;21) AML patients. Normalized enrichment score (NES) and false discovery rate (FDR) values are given. (C) Proportion of immune infiltrated cells between high- and low- CRIP1 expression of t (8;21) AML patients based on the CIBERSORT algorithm. *, p < 0.05; **, p < 0.01; and ***, p < 0.001. Statistical significance was determined using two-sided Wilcoxon test. (D) Correlation analysis of CRIP1 expression with the proportion of differential immune cells of t (8;21) AML patients. Spearman’s correlation analysis and correlation coefficient (R) are shown. (E) Correlation analysis of CRIP1 expression with the exhaustion marker of CD8 T cells. Spearman’s correlation analysis and correlation coefficient (R) are shown.
Thus, the immune infiltration of the 22 immune cell proportions in t (8;21) AML patients was analyzed and compared based on the CIBERSORT algorithm (Newman et al., 2015). Of the 22 immune cells, the CRIP1-high group had a significantly higher infiltration of T cells CD8 and Mast cells activated (Figure 1C), whereas the CRIP1-low group had a significantly higher proportion of macrophages M0 and mast cells resting (Figure 1C). Furthermore, Spearman’s correlation analysis demonstrated that the CRIP1 expression had a positive correlation with the mast cells activated (R = 0.32, p = 0.011) and CD8 T cells (R = 0.4, p = 0.0012). In contrast, the CRIP1 expression had a negative correlation with resting mast cells (R = −0.26, p = 0.043) and neutrophils (R = −0.27, p = 0.036) (Figure 1D). The higher proportion of CD8 T cells and inferior outcome of the CRIP1-high group made us further explore the functional status of T cells. The expression of the exhaustion T cell markers, including 2B4, TIM-3, and TCF-1, was analyzed. The CRIP1 expression had a positive correlation with 2B4 (R = 0.44, p < 0.001) and TIM-3 (R = 0.52, p < 0.001) and a negative correlation with TCF-1 (HNF1A) (R = −0.32, p = 0.012) (Figure 1E).
CRIP1 Expression Could be Regulated by the TNFα–NFκB Pathway
Next, we explored the regulation network that promoted the high CRIP1 expression in t (8;21) AML patients. A previous study had compared the gene mutations of RTK/Ras family, transcription factors, epigenetic modifiers, cohesion complexes, or signaling pathways. No significant differences in gene mutations mentioned above were observed between the CRIP1-high and -low groups (Li et al., 2021). Considering that the immune pathway was activated, we questioned whether the CRIP1 was upregulated by the immune regulators of the BM microenvironment. We performed the ingenuity pathway analysis (IPA) using the single-cell RNA-seq (scRNA-seq) data of t (8;21) AML patients, and TNF was identified as the main regulator (Figure 2A).
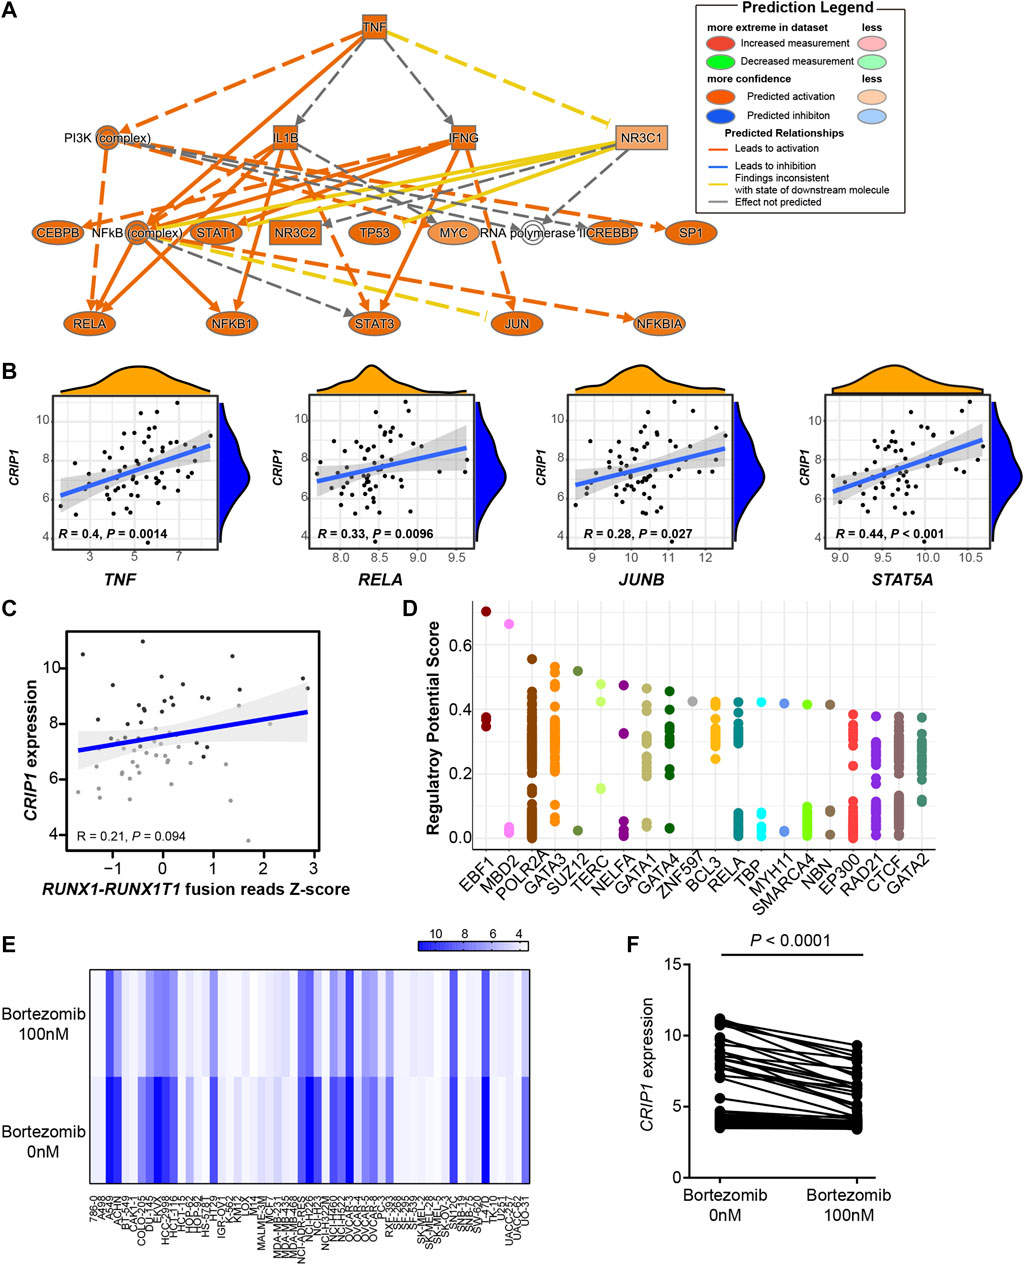
FIGURE 2. CRIP1 could be regulated by the tumor necrosis factor (TNF)α–nuclear factor kappa B pathway. (A) Ingenuity pathway analysis upstream analysis based on the CD34+CD117dim scRNA-seq gene signature from t (8;21) acute myeloid leukemia (AML) patients. (B) Correlation analysis of CRIP1 with TNF, RELA, JUNB, and STAT5A. R as correlation. Spearman’s correlation analysis and correlation coefficient (R) were shown. (C) Correlation analysis of CRIP1 with RUNX1-RUNX1T1 fusion based on the RNA-seq data of t (8;21) AML patients. Spearman’s correlation analysis and correlation coefficient (R) were shown. (D) The top 20 putative and potential transcription factors for CRIP1 from ChIP-seq datasets by Cistrome. The Y axis represents the regulatory potential score and the X axis represents different factors. Each dot represents a ChIP-seq sample. (E) Heatmap of the CRIP1 expression in different cell lines after exposure to bortezomib (100 nM) or control group (0 nM) for 24 h from GSE116438. Each column represents a cell line. Each row represents the different concentrations of bortezomib, 0 nM (control) or 100 nM. (F) Comparison of the CRIP1 expression in different cell lines after exposure to bortezomib (100 nM) for 24 h from GSE116438. Statistical significance was determined using two-sided Student’s t-test.
Further correlation analysis demonstrated that the CRIP1 expression had a significant positive correlation with TNF (R = 0.4, p = 0.0014), RELA (R = 0.33, p = 0.0096), and JUNB (R = 0.28, p = 0.027), all of whom participated in the TNFα–NFκB pathway (Figure 2B). Considering the role of RUNX1-RUNX1T1 fusion transcript in t (8;21) AML pathogenesis, we questioned whether the CRIP1 expression was regulated by the fusion gene. As a result, there was no significant correlation with the coefficient of 0.21 with a p = 0.094 (Figure 2C), thereby suggesting that the RUNX1–RUNX1T1 fusion has no direct influence on the CRIP1 expression.
The putative and potential transcription factors (TF) for the CRIP1 gene from the ChIP-seq datasets by Cistrome (Mei et al., 2017; Zheng et al., 2019) were then analyzed. Neither TF RUNX1 (AML1) nor RUNX1T1 (ETO) were included as the top putative targets (Figure 2D). Instead, MBD2, RELA, and BCL3 were shown as the top putative factors, which belong to the TNFα–NFκB pathway.
To test whether the CRIP1 expression was regulated by the TNFα–NFκB pathway, we analyzed the drug-induced gene expression change across different cell lines following the exposure to the NFκB inhibitor bortezomib from GSE116438 to mimic the knockdown of the TNFα–NFκB pathway. For the 55 cell lines tested, when treated with bortezomib for 24 h, the CRIP1 expression was significantly lower (p < 0.0001) (Figures 2E,F), which further demonstrated that CRIP1 was regulated by the TNFα–NFκB pathway.
Epigenetics Effect on the CRIP1 Expression in Acute Myeloid Leukemia Patients
We then explored the epigenetics’ influence on the CRIP1 expression in t (8;21) AML patients. GSEA showed that the CRIP1-high group has a significant enrichment in histone deacetylase (HDAC) and HDAC7 targets (Figure 3A). However, the CRIP1-low group showed enrichment in H3K27ME3 (Figure 3A).
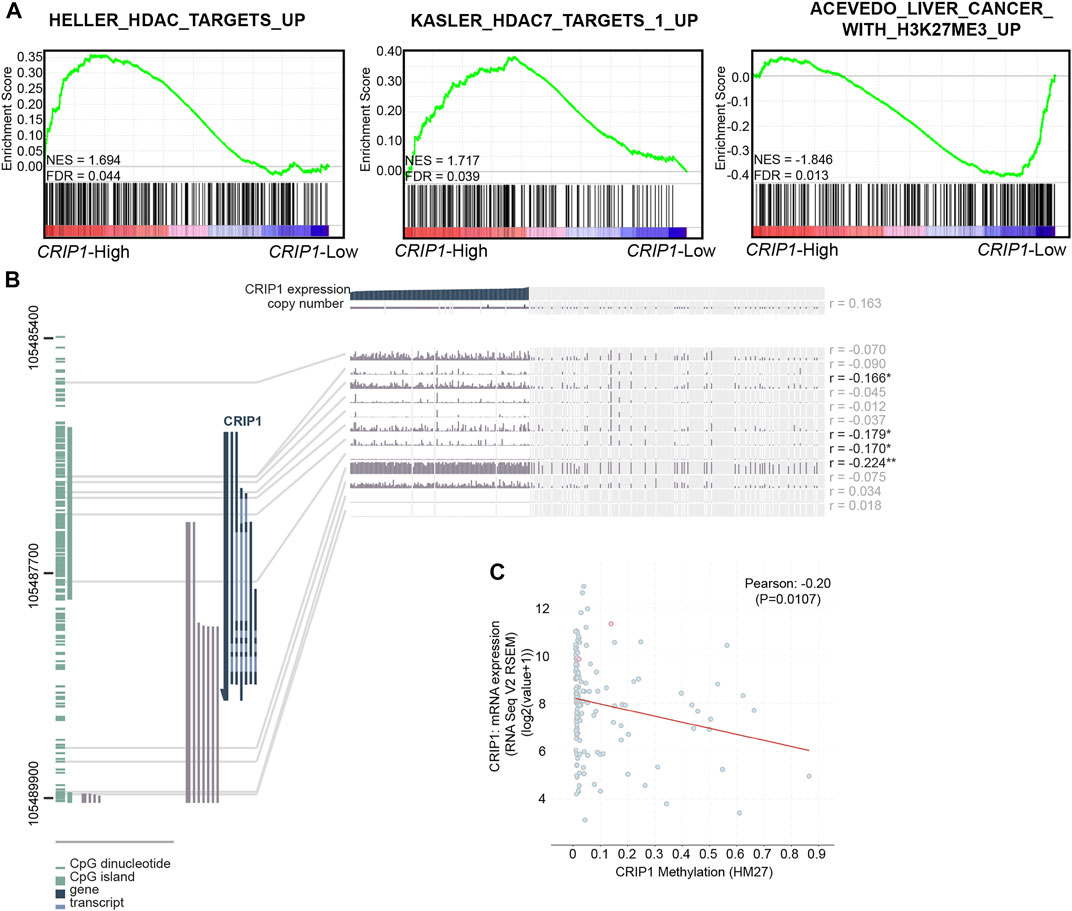
FIGURE 3. Epigenetic effect on the CRIP1 expression in acute myeloid leukemia (AML) patients. (A) Representative activated HDAC-related pathways in the high- and low-CRIP1 expressions of t (8;21) AML patients. Normalized enrichment score (NES) and false discovery rate (FDR) values are given. (B). MEXPRESS view of the Cancer Genome Atlas (TCGA) data for CRIP1 in AML patients. The samples were ordered by CRIP1 expression. (C) Scatter plot of the mRNA expression compared with DNA methylation data (HM27) of CRIP1 in AML patients with data available (n = 159) based on the TCGA database via cBioPortal. The correlation of CRIP1 expression with DNA methylation status was shown. Pearson’s correlation analysis and correlation coefficient (R) were shown.
Next, we explored the relationship between the CRIP1 expression and the methylation level of the CRIP1 promoter in AML (Cancer Genome Atlas Research et al., 2013) data using MEXPRESS (Figure 3B). In addition, the correlation of the CRIP1 expression with the methylation level from the Human Methylation 27k (HM27) platform of TCGA AML patients was analyzed using the cBioPortal (Gao et al., 2013). The DNA methylation level of CRIP1 was negatively correlated with CRIP1 expression (Figure 3C). In addition, we identified four CpG probes of CRIP1 (cg07065217, cg04411625, cg25682097, and 11763800) that were negatively associated with the CRIP1 gene expression in AML patients.
CRIP1 Expression with Immune Regulation was Tested in Other Independent Cohorts
From the CCLE database, the CRIP1 expression of AML cell lines was analyzed (Figure 4A) with the highest expression in THP-1 (acute monocytic leukemia) and lowest in NB-4 (acute promyelocytic leukemia, APL). The GSE37642-GPL96, GSE37642-GPL570, and TCGA datasets were used as the validation cohort-1 (Figures 4D,E), validation cohort-2 (Figures 4B,C), and validation cohort-3 (Figures 5A,B).
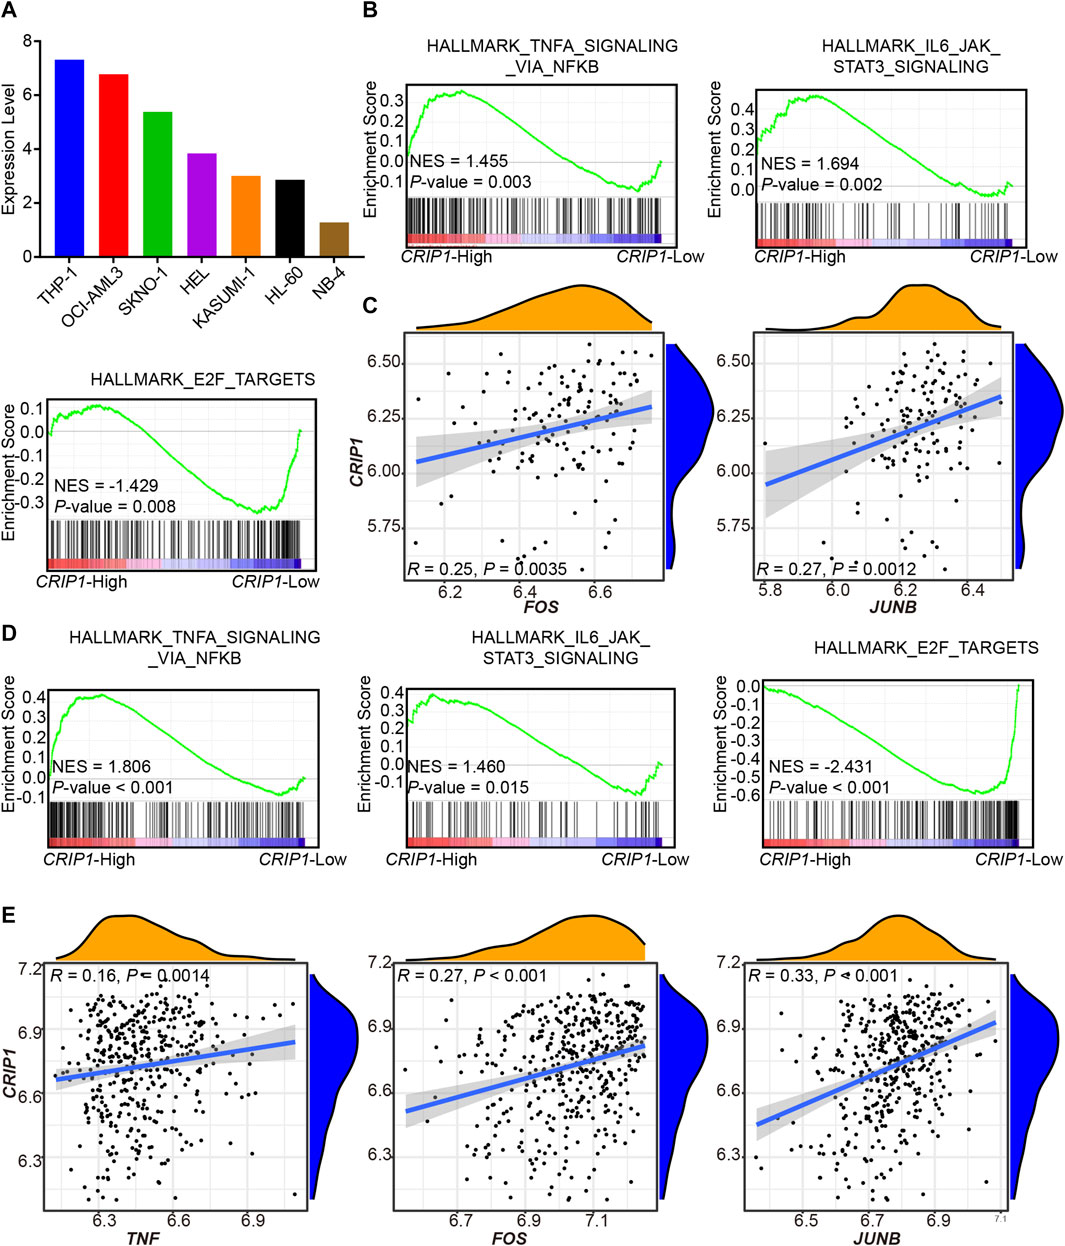
FIGURE 4. Validation of CRIP1 expression under the tumor necrosis factor (TNF)α–nuclear factor kappa B (NFκB) pathway in the GSE37642 dataset. (A) The CCLE database showed the CRIP1 expression among the AML cell lines. (B) Representative gene set enrichment analysis (GSEA) plots showing the activated immune-related pathways in the high-CRIP1 expression group from the GSE37642 (GPL 570, n = 140) cohort. Normalized enrichment score (NES) and nominal p value were given. (C) Correlation analysis of the CRIP1 expression with the transcription factor of the TNFα–NFκB pathway from the GSE37642 (GPL 570, n = 140) cohort. Spearman’s correlation analysis and correlation coefficient (R) were shown. (D) Representative GSEA plots showing the activated immune-related pathways in the high--CRIP1 expression group from the GSE37642 (GPL 96, n = 422) cohort. Normalized enrichment score (NES) and nominal p value were given. (E) Correlation analysis of the CRIP1 expression with the transcription factor of the TNFα–NFκB pathway from the GSE37642 (GPL 96, n = 422) cohort. Spearman’s correlation analysis and correlation coefficient (R) were shown.
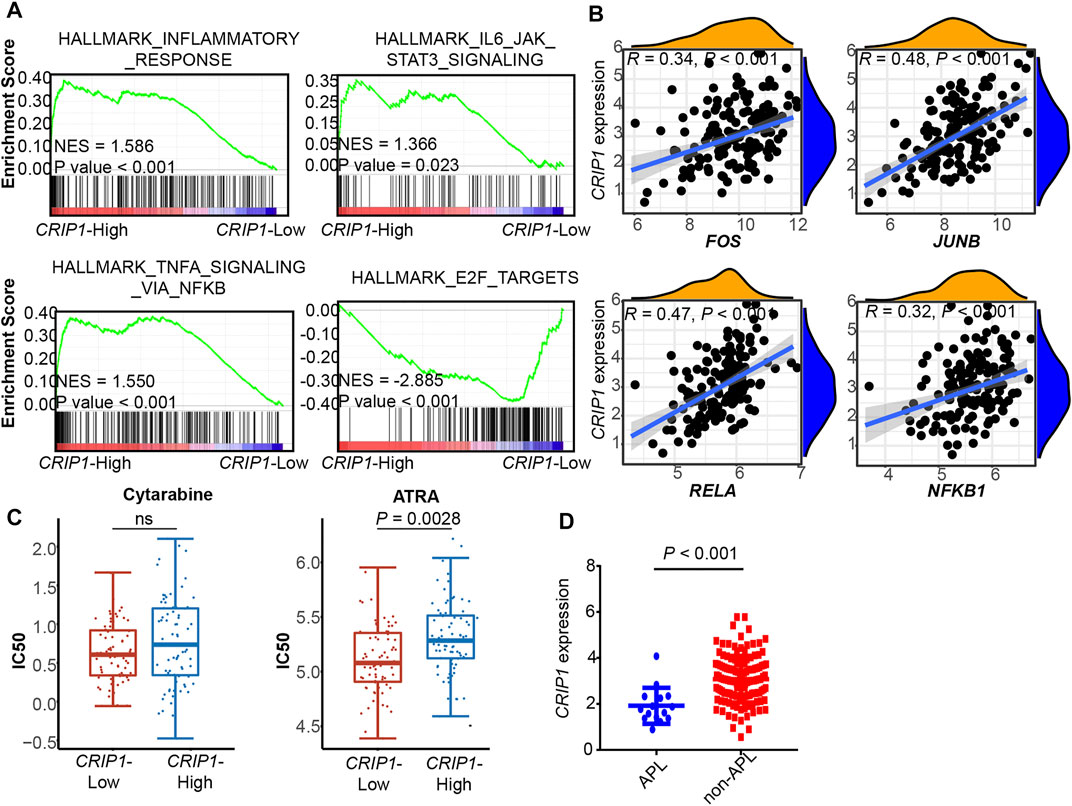
FIGURE 5. Validation of CRIP1 expression under the TNFα–NFκB pathway in the TCGA dataset. (A) Representative gene set enrichment analysis plots showing the activated immune-related pathways in the high-CRIP1 expression group from the Cancer Genome Atlas (TCGA) LAML (n = 130) cohort. Normalized enrichment score (NES) and nominal p value are given. (B) Correlation analysis of the CRIP1 expression with the transcription factor of the TNFα–NFκB pathway from the TCGA LAML (n = 130) cohort. Spearman’s correlation analysis and correlation coefficient (R) are shown. (C) The distribution of IC50 for cytarabine and all-trans retinoic acid (ATRA) between the high- and low-CRIP1 expression of AML patients. The statistical difference of the two groups was compared using the Wilcox test. (D) The comparison of the CRIP1 expression in APL and non-APL AML patients with data from TCGA LAML. Statistical difference was determined using two-sided Student’s t-test.
In the three validation cohorts, we observed the activated enrichment of immune-related pathways in the BM microenvironment, including the TNFA signaling via the NFKB pathway and IL6-JAK-STAT3 signaling pathways in the CRIP1-high group. In addition, the CRIP1-low group showed a significant enrichment in the E2F target pathway in the three validation cohorts. Further, the immune infiltration cells in these validation cohorts were analyzed using the differential infiltration profile (Supplementary Figures S4, S5). The exhaustion CD8 T cells in t (8;21) AML were not observed in these validation cohorts. This may be due to the complex heterogeneity of AML. Thus, further exploration is required.
In addition, the CRIP1 expression under the TNFα-NFκB regulation was analyzed. In the three cohorts, the CRIP1-high group showed significant enrichment of immune-related pathway. Detailed correlation analysis also demonstrated that the CRIP1 had a positive correlation with TNF, JUNB, and FOS (Figures 4C,E, 5B).
CRIP1 Expression was Higher in Non-Acute Promyelocytic Leukemia Patients than Acute Promyelocytic Leukemia Patients
The IC50 distribution of cytarabine and all-trans retinoic acid (ATRA) was analyzed using data from the GDSC dataset. The CRIP1-high group had a trend of higher IC50 of cytarabine (Figure 5C), though it did not reach statistical significance. In addition, the CRIP1-high group had a significantly higher IC50 of ATRA (p = 0.0028).
In addition, we compared the CRIP1 expression in APL and non-APL AML patients using the TCGA AML data. Compared with APL patients, non-APL AML patients had a significantly higher CRIP1 expression (p < 0.001) (Figure 5D).
The higher CRIP1 expression in non-APL patients made us explore the pattern of CRIP1 expression in normal myeloid differentiation. Using data from BloodSpot (Bagger et al., 2019), a database of healthy and malignant hematopoiesis, late promyelocyte did have a rather low CRIP1 expression (Supplementary Figures S6A,B). In addition, we observed a higher CRIP1 expression in mature monocytes compared to the hematopoietic stem and progenitor cells, including multipotential progenitors, common myeloid progenitor cell, and granulocyte monocyte progenitors (Supplementary Figure S6A).
Discussion
This study examined the genetic and epigenetic regulation of CRIP1 expression in AML patients via multidimensional analyses of gene expression and methylation data. It further explored the immune regulation of CRIP1 expression, especially the TNFα–NFκB signaling pathway in AML. Our preliminary research might provide new insights for exploring improvements in AML treatment.
The role of CRIP1 expression in AML patients has been rarely reported and is largely unknown. In fact, CRIP1 was reported to have tumor-specific oncogenic or tumor-suppressive properties (Sun et al., 2021). In colorectal cancer, CRIP1 could facilitate the 5-FU drug resistance by downregulating the Fas and Fas-mediated apoptosis-related proteins’ expression (Zhang et al., 2019). However, in breast cancer patients, low CRIP1 expression could enhance cell proliferation and invasion by enhancing the mitogen-activated protein kinase phosphorylation and reducing the CDC2 phosphorylation (Ludyga et al., 2013). In a previous study, we demonstrated that CRIP1 was highly expressed in AML patients, including the M0–M7 subtype (Li et al., 2021). The prognostic value of CRIP1 expression in t (8;21) AML was first reported by our group (Li et al., 2021). In this work, based on the scRNA-seq and gene expression data of t (8;21) AML patients, we reported that the CRIP1 was regulated by the TNFα–NFκB pathway. In addition, the CRIP1-low group demonstrated significant enrichment of E2F target pathway in the t (8;21) AML cohort (OEP000629) and three other validation cohorts. This activation of E2F targets was consistent with the enrichment result of the CD34+CD117bri population, which showed a lower CRIP1 expression in our previous studies (Jiang et al., 2020).
Previous studies have shown that AML leukemia cells can produce endogenous TNFα, which then activated the downstream NFκB-signaling pathway, thereby resulting in leukemia cell proliferation and drug resistance (Hemmati et al., 2017). The transcription factor AML1 inhibits the NFκB-signaling pathway by interacting with the IκB kinase complex, while the fusion gene AML1-ETO lacks the inhibitory effect on the NFκB-signaling pathway (Lin et al., 2017). In this work, combined with ChIP-seq data, the CRIP1 expression was abnormally activated by the TNFα–NFκB signaling pathway, which promoted the proliferation of leukemia cells, thereby resulting in relapse and drug resistance of t (8;21) AML patients. This was further validated in two independent cohorts of AML patients.
Through further exploration of the expression pattern during myeloid differentiation, we found that at the late promyelocyte stage, the CRIP1 expression was lower, while the monocyte had a rather high level of CRIP1 expression. However, the role of CRIP1 in the myeloid differentiation still needs further exploration.
Up to date, the treatment of AML still faces challenges of drug resistance and relapse. Multiple studies have shown that immunotherapy is playing an integral role in AML (Berger et al., 2008; Zhang et al., 2009; Kasakovski et al., 2018). The single-arm, phase 2 study explored the efficiency of adding PD-1 monoclonal antibody (nivolumab) to the standard IA regimen for AML (idarubicin combined with cytarabine). It was reported to reduce the recurrence rate and improve the prognosis of AML (Ravandi et al., 2019). However, there are still patients with a poor response to immunotherapy. Through the immune infiltration of t (8;21) AML patients, we found that the CRIP1-high group had a higher proportion of exhausted CD8 T cells. In fact, the dysfunction of immune cells, especially T cells, was revealed to affect the prognosis of patients with tumors, including nonsmall cell lung cancer, colorectal cancer, and melanoma (Guo et al., 2018; Li et al., 2019; Zhang et al., 2020). However, the immune infiltration analysis of gene expression profile from other validation cohorts did not observe the same pattern of higher exhausted CD8 T cells in AML patients. An in-depth study of the immune regulation mechanism of AML will help improve its efficacy.
In conclusion, our data provide a comprehensive overview of the regulation of CRIP1 expression in AML patients. The evaluation of the TNFα-NFκB signaling pathway as well as the immune heterogeneity might provide new insights for exploring improvements in AML treatment.
Data Availability Statement
The original contributions presented in the study are included in the article/supplementary material, further inquiries can be directed to the corresponding authors.
Author Contributions
X-PL and LJ conceived and designed the research; YG, J-YL, and X-PL performed the experiments and the bioinformatics analyses; J-FZ and J-YM provided technical support; and X-PL and LJ wrote the manuscript.
Funding
This work was supported by China Postdoctoral Science Foundation (2021M693657), Guangdong Basic and Applied Basic Research Foundation (2021A1515110012), and Shanghai Rising-Star Program (22QA1405600).
Conflict of Interest
The authors declare that the research was conducted in the absence of any commercial or financial relationships that could be construed as a potential conflict of interest.
Publisher’s Note
All claims expressed in this article are solely those of the authors and do not necessarily represent those of their affiliated organizations or those of the publisher, the editors, and the reviewers. Any product that may be evaluated in this article or claim that may be made by its manufacturer is not guaranteed or endorsed by the publisher.
Acknowledgments
We thank our colleagues at the Sun Yat-Sen University Cancer Center and Ruijin Hospital affiliated to Shanghai Jiao Tong University School of Medicine for their constructive discussions and technical help.
Supplementary Material
The Supplementary Material for this article can be found online at: https://www.frontiersin.org/articles/10.3389/fgene.2022.923568/full#supplementary-material
References
Arber, D. A., Orazi, A., Hasserjian, R., Thiele, J., Borowitz, M. J., Le Beau, M. M., et al. (2016). The 2016 Revision to the World Health Organization Classification of Myeloid Neoplasms and Acute Leukemia. Blood 127 (20), 2391–2405. doi:10.1182/blood-2016-03-643544
Bagger, F. O., Kinalis, S., and Rapin, N. (2019). BloodSpot: a Database of Healthy and Malignant Haematopoiesis Updated with Purified and Single Cell mRNA Sequencing Profiles. Nucleic Acids Res. 47 (D1), D881–D885. doi:10.1093/nar/gky1076
Barretina, J., Caponigro, G., Stransky, N., Venkatesan, K., Margolin, A. A., Kim, S., et al. (2012). The Cancer Cell Line Encyclopedia Enables Predictive Modelling of Anticancer Drug Sensitivity. Nature 483 (7391), 603–607. doi:10.1038/nature11003
Berger, R., Rotem-Yehudar, R., Slama, G., Landes, S., Kneller, A., Leiba, M., et al. (2008). Phase I Safety and Pharmacokinetic Study of CT-011, a Humanized Antibody Interacting with PD-1, in Patients with Advanced Hematologic Malignancies. Clin. Cancer Res. 14 (10), 3044–3051. doi:10.1158/1078-0432.ccr-07-4079
Cancer Genome Atlas Research, N., Ley, T. J., Miller, C., Ding, L., Raphael, B. J., Mungall, A. J., et al. (2013). Genomic and Epigenomic Landscapes of Adult De Novo Acute Myeloid Leukemia. N. Engl. J. Med. 368 (22), 2059–2074. doi:10.1056/NEJMoa1301689
Christopher, M. J., Petti, A. A., Rettig, M. P., Miller, C. A., Chendamarai, E., Duncavage, E. J., et al. (2018). Immune Escape of Relapsed AML Cells after Allogeneic Transplantation. N. Engl. J. Med. 379 (24), 2330–2341. doi:10.1056/nejmoa1808777
Döhner, H., Estey, E., Grimwade, D., Amadori, S., Appelbaum, F. R., Büchner, T., et al. (2017). Diagnosis and Management of AML in Adults: 2017 ELN Recommendations from an International Expert Panel. Blood 129 (4), 424–447. doi:10.1182/blood-2016-08-733196
Döhner, H., Weisdorf, D. J., and Bloomfield, C. D. (2015). Acute Myeloid Leukemia. N. Engl. J. Med. 373 (12), 1136–1152. doi:10.1056/nejmra1406184
Faber, Z. J., Chen, X., Gedman, A. L., Boggs, K., Cheng, J., Ma, J., et al. (2016). The Genomic Landscape of Core-Binding Factor Acute Myeloid Leukemias. Nat. Genet. 48 (12), 1551–1556. doi:10.1038/ng.3709
Fauriat, C., Just-Landi, S., Mallet, F., Arnoulet, C., Sainty, D., Olive, D., et al. (2007). Deficient Expression of NCR in NK Cells from Acute Myeloid Leukemia: Evolution during Leukemia Treatment and Impact of Leukemia Cells in NCRdull Phenotype Induction. Blood 109 (1), 323–330. doi:10.1182/blood-2005-08-027979
Gao, J., Aksoy, B. A., Dogrusoz, U., Dresdner, G., Gross, B., Sumer, S. O., et al. (2013). Integrative Analysis of Complex Cancer Genomics and Clinical Profiles Using the cBioPortal. Sci. Signal 6 (269), pl1. doi:10.1126/scisignal.2004088
Guo, X., Zhang, Y., Zheng, L., Zheng, C., Song, J., Zhang, Q., et al. (2018). Global Characterization of T Cells in Non-small-cell Lung Cancer by Single-Cell Sequencing. Nat. Med. 24 (7), 978–985. doi:10.1038/s41591-018-0045-3
He, G., Zhu, H., Yao, Y., Chai, H., Wang, Y., Zhao, W., et al. (2019). Cysteine-rich Intestinal Protein 1 Silencing Alleviates the Migration and Invasive Capability Enhancement Induced by Excessive Zinc Supplementation in Colorectal Cancer Cells. Am. J. Transl. Res. 11 (6), 3578–3588.
Hemmati, S., Haque, T., and Gritsman, K. (2017). Inflammatory Signaling Pathways in Preleukemic and Leukemic Stem Cells. Front. Oncol. 7, 265. doi:10.3389/fonc.2017.00265
Hospital, M.-A., Prebet, T., Bertoli, S., Thomas, X., Tavernier, E., Braun, T., et al. (2014). Core-binding Factor Acute Myeloid Leukemia in First Relapse: a Retrospective Study from the French AML Intergroup. Blood 124 (8), 1312–1319. doi:10.1182/blood-2014-01-549212
Jiang, L., Li, X.-P., Dai, Y.-T., Chen, B., Weng, X.-Q., Xiong, S.-M., et al. (2020). Multidimensional Study of the Heterogeneity of Leukemia Cells in T(8;21) Acute Myelogenous Leukemia Identifies the Subtype with Poor Outcome. Proc. Natl. Acad. Sci. U.S.A. 117 (33), 20117–20126. doi:10.1073/pnas.2003900117
Kasakovski, D., Xu, L., and Li, Y. (2018). T Cell Senescence and CAR-T Cell Exhaustion in Hematological Malignancies. J. Hematol. Oncol. 11 (1), 91. doi:10.1186/s13045-018-0629-x
Koch, A., Jeschke, J., Van Criekinge, W., van Engeland, M., and De Meyer, T. (2019). MEXPRESS Update 2019. Nucleic Acids Res. 47 (W1), W561–W565. doi:10.1093/nar/gkz445
Li, H.-g., Zhao, L.-h., Zhang, Z.-h., Liu, J.-z., Ren, K., Li, S.-y., et al. (2017). The Impact of Cysteine-Rich Intestinal Protein 1 (CRIP1) on Thyroid Carcinoma. Cell Physiol. Biochem. 43 (5), 2037–2046. doi:10.1159/000484184
Li, H., van der Leun, A. M., Yofe, I., Lubling, Y., Gelbard-Solodkin, D., van Akkooi, A. C. J., et al. (2019). Dysfunctional CD8 T Cells Form a Proliferative, Dynamically Regulated Compartment within Human Melanoma. Cell 176 (4), 775–789. doi:10.1016/j.cell.2018.11.043
Li, X., Dai, Y., Chen, B., Huang, J., Chen, S., and Jiang, L. (2021). Clinical Significance of CD34(+)CD117dim/CD34(+)CD117bri Myeloblast-Associated Gene Expression in T(8;21) Acute Myeloid Leukemia. Front. Med. 15 (4), 608–620. doi:10.1007/s11684-021-0836-7
Lin, S., Mulloy, J. C., and Goyama, S. (2017). RUNX1-ETO Leukemia. Adv. Exp. Med. Biol. 962, 151–173. doi:10.1007/978-981-10-3233-2_11
Lion, E., Willemen, Y., Berneman, Z. N., Van Tendeloo, V. F. I., and Smits, E. L. J. (2012). Natural Killer Cell Immune Escape in Acute Myeloid Leukemia. Leukemia 26 (9), 2019–2026. doi:10.1038/leu.2012.87
Ludyga, N., Englert, S., Pflieger, K., Rauser, S., Braselmann, H., Walch, A., et al. (2013). The Impact of Cysteine-Rich Intestinal Protein 1 (CRIP1) in Human Breast Cancer. Mol. Cancer 12, 28. doi:10.1186/1476-4598-12-28
Mei, S., Qin, Q., Wu, Q., Sun, H., Zheng, R., Zang, C., et al. (2017). Cistrome Data Browser: a Data Portal for ChIP-Seq and Chromatin Accessibility Data in Human and Mouse. Nucleic Acids Res. 45 (D1), D658–D662. doi:10.1093/nar/gkw983
Newman, A. M., Liu, C. L., Green, M. R., Gentles, A. J., Feng, W., Xu, Y., et al. (2015). Robust Enumeration of Cell Subsets from Tissue Expression Profiles. Nat. Methods 12 (5), 453–457. doi:10.1038/nmeth.3337
Papaemmanuil, E., Gerstung, M., Bullinger, L., Gaidzik, V. I., Paschka, P., Roberts, N. D., et al. (2016). Genomic Classification and Prognosis in Acute Myeloid Leukemia. N. Engl. J. Med. 374 (23), 2209–2221. doi:10.1056/nejmoa1516192
Patro, R., Duggal, G., Love, M. I., Irizarry, R. A., and Kingsford, C. (2017). Salmon Provides Fast and Bias-Aware Quantification of Transcript Expression. Nat. Methods 14 (4), 417–419. doi:10.1038/nmeth.4197
Ravandi, F., Assi, R., Daver, N., Benton, C. B., Kadia, T., Thompson, P. A., et al. (2019). Idarubicin, Cytarabine, and Nivolumab in Patients with Newly Diagnosed Acute Myeloid Leukaemia or High-Risk Myelodysplastic Syndrome: a Single-Arm, Phase 2 Study. Lancet Haematol. 6 (9), e480–e488. doi:10.1016/s2352-3026(19)30114-0
Sun, H., Zhou, R., Zheng, Y., Wen, Z., Zhang, D., Zeng, D., et al. (2021). CRIP1 Cooperates with BRCA2 to Drive the Nuclear Enrichment of RAD51 and to Facilitate Homologous Repair upon DNA Damage Induced by Chemotherapy. Oncogene 40 (34), 5342–5355. doi:10.1038/s41388-021-01932-0
Szklarczyk, D., Gable, A. L., Nastou, K. C., Lyon, D., Kirsch, R., Pyysalo, S., et al. (2021). The STRING Database in 2021: Customizable Protein-Protein Networks, and Functional Characterization of User-Uploaded Gene/measurement Sets. Nucleic Acids Res. 49 (D1), D605–D612. doi:10.1093/nar/gkaa1074
Tang, L., Wu, J., Li, C.-G., Jiang, H.-W., Xu, M., Du, M., et al. (2020). Characterization of Immune Dysfunction and Identification of Prognostic Immune-Related Risk Factors in Acute Myeloid Leukemia. Clin. Cancer Res. 26 (7), 1763–1772. doi:10.1158/1078-0432.ccr-19-3003
van Galen, P., Hovestadt, V., Wadsworth Ii, M. H., Hughes, T. K., Griffin, G. K., Battaglia, S., et al. (2019). Single-Cell RNA-Seq Reveals AML Hierarchies Relevant to Disease Progression and Immunity. Cell 176 (6), 1265–1281. doi:10.1016/j.cell.2019.01.031
Yang, W., Soares, J., Greninger, P., Edelman, E. J., Lightfoot, H., Forbes, S., et al. (2013). Genomics of Drug Sensitivity in Cancer (GDSC): a Resource for Therapeutic Biomarker Discovery in Cancer Cells. Nucleic Acids Res. 41 (Database issue), D955–D961. doi:10.1093/nar/gks1111
Zhang, L., Gajewski, T. F., and Kline, J. (2009). PD-1/PD-L1 Interactions Inhibit Antitumor Immune Responses in a Murine Acute Myeloid Leukemia Model. Blood 114 (8), 1545–1552. doi:10.1182/blood-2009-03-206672
Zhang, L., Li, Z., Skrzypczynska, K. M., Fang, Q., Zhang, W., O’Brien, S. A., et al. (2020). Single-Cell Analyses Inform Mechanisms of Myeloid-Targeted Therapies in Colon Cancer. Cell 181 (2), 442–459. doi:10.1016/j.cell.2020.03.048
Zhang, L., Zhou, R., Zhang, W., Yao, X., Li, W., Xu, L., et al. (2019). Cysteine-rich Intestinal Protein 1 Suppresses Apoptosis and Chemosensitivity to 5-fluorouracil in Colorectal Cancer through Ubiquitin-Mediated Fas Degradation. J. Exp. Clin. Cancer Res. 38 (1), 120. doi:10.1186/s13046-019-1117-z
Zheng, R., Wan, C., Mei, S., Qin, Q., Wu, Q., Sun, H., et al. (2019). Cistrome Data Browser: Expanded Datasets and New Tools for Gene Regulatory Analysis. Nucleic Acids Res. 47 (D1), D729–D735. doi:10.1093/nar/gky1094
Keywords: AML, immune infiltration, CRIP1, gene expression profiling, single-cell RNA sequencing
Citation: Gao Y, Li J-Y, Mao J-Y, Zhou J-F, Jiang L and Li X-P (2022) Comprehensive Analysis of CRIP1 Expression in Acute Myeloid Leukemia. Front. Genet. 13:923568. doi: 10.3389/fgene.2022.923568
Received: 19 April 2022; Accepted: 16 June 2022;
Published: 22 July 2022.
Edited by:
Mario Zanfardino, IRCCS SDN, ItalyReviewed by:
Minjie Zhang, University of Southern California, United StatesYa-Zhen Qin, Peking University People’s Hospital, China
Copyright © 2022 Gao, Li, Mao, Zhou, Jiang and Li. This is an open-access article distributed under the terms of the Creative Commons Attribution License (CC BY). The use, distribution or reproduction in other forums is permitted, provided the original author(s) and the copyright owner(s) are credited and that the original publication in this journal is cited, in accordance with accepted academic practice. No use, distribution or reproduction is permitted which does not comply with these terms.
*Correspondence: Lu Jiang, amwxMTg5MUByamguY29tLmNu; Xue-Ping Li, bGl4cDFAc3lzdWNjLm9yZy5jbg==
†These authors have contributed equally to this work.