- 1School of Life Science, Anhui Province Key Laboratory of Translational Cancer Research, Bengbu Medical College, Bengbu, China
- 2Department of Gynecologic Oncology, First Affiliated Hospital of Bengbu Medical College, Bengbu, Anhui, China
- 3Department of Gastrointestinal Surgery, First Affiliated Hospital of Bengbu Medical College, Bengbu, Anhui, China
Objective: Transcription elongation factor 1 (TCERG1) is a nuclear protein consisted of multiple protein structural domains that plays an important role in regulating the transcription, extension, and splicing regulation of RNA polymerase II. However, the prognostic and immunological role of TCERG1 in human cancer remains unknown. In this study, we analyzed the expression of TCERG1 gene in hepatocellular carcinoma (HCC) patients, its clinical significance, and its possible prognostic value by bioinformatics.
Methods: RNA sequencing data and clinicopathological characteristics of patients with HCC were collected from TCGA and CCLE databases. The Wilcoxon rank-sum test was used to analyze the expression of TCERG1 in HCC tissues and normal tissues. The protein levels of TCERG1 between normal and liver cancer tissues were analyzed by the Human Protein Atlas Database (HPA) (www.proteinatlas.org). Validation was performed using the Gene Expression Omnibus (GEO) dataset of 167 samples. The expression of TCERG1 in HCC cells were verified by qRT-PCR, and CCK-8, scratch assay and Transwell assay were performed to detect cell proliferation, migration and invasion ability. According to the median value of TCERG1 expression, patients were divided into high and low subgroups. Logistic regression, GSEA enrichment, TME, and single-sample set gene enrichment analysis (ssGSEA) were performed to explore the effects of TCERG1 on liver cancer biological function and immune infiltrates. TCERG1 co-expression networks were studied through the CCLE database and the LinkedOmics database to analyze genes that interact with TCERG1.
Results: The expression levels of TCERG1 in HCC patient tissues were significantly higher than in normal tissues. Survival analysis showed that high levels of TCERG1 expression were significantly associated with low survival rates in HCC patients. Multifactorial analysis showed that high TCERG1 expression was an independent risk factor affecting tumor prognosis. This result was also verified in the GEO database. Cellular experiments demonstrated that cell proliferation, migration and invasion were inhibited after silencing of TCERG1 gene expression. Co-expression analysis revealed that CPSF6 and MAML1 expression were positively correlated with TCERG1. GSEA showed that in samples with high TCERG1 expression, relevant signaling pathways associated with cell cycle, apoptosis, pathways in cancer and enriched in known tumors included Wnt signaling pathway, Vegf signaling pathway, Notch signaling pathway, MAPK signaling pathway and MTOR pathways. The expression of TCERG1 was positively correlated with tumor immune infiltrating cells (T helper two cells, T helper cells).
Conclusion: TCERG1 gene is highly expressed in hepatocellular carcinoma tissues, which is associated with the poor prognosis of liver cancer, and may be one of the markers for the diagnosis and screening of liver cancer and the prediction of prognosis effect. At the same time, TCERG1 may also become a new target for tumor immunotherapy.
Introduction
Hepatocellular carcinoma is a common primary liver cancer that more occurs in male patients and has a high morbidity and mortality rate. According to the World Health Organization in 2020, the incidence and mortality rates of HCC ranked seventh and fourth, respectively, and both gradually increased with age. According to statistics, about 50% of patients are in China, which has become a serious threat to patient health and safety (Chen et al., 2016; Harding et al., 2018; Hasan et al., 2020). The onset of HCC is a multifactorial, multi-step complex process influenced by dual factors of the environment and the patient itself, but the molecular mechanism by which it occurs and develops remains unclear (Hu et al., 2018). Among them, hepatitis B virus (HBV), hepatitis C virus (HCV) infection, aflatoxin, obesity, metabolic syndrome, and genetic factors are the more prominent risk factors (Jindal et al., 2019).
The common clinical treatment strategies for HCC are surgical resection, chemotherapy, radiotherapy, radiofrequency ablation, etc. Ultrasound (US) and serum alpha-fetoprotein (AFP) are common diagnostic methods for it, but the diagnostic results still lack specificity and sensitivity (Wang and Wei, 2020). Patients with HCC have no obvious early symptoms, and most of them are diagnosed at advanced stages or have distant metastases and have lost the opportunity for radical surgery (Hasan et al., 2020). In order to better diagnose early HCC, new biomarkers have become a hot spot for research. The biological and clinical diversity of HCC poses a great challenge for individualized clinical treatment (Jeng et al., 2015; Forner et al., 2018; Thorsson et al., 2018).
Although advances have been made in the treatment and diagnosis of hepatocellular carcinoma in the last decade, its survival prognosis is poor and 5-year survival rates remain unsatisfactory (Kulik and El-Serag, 2019; Chen et al., 2020). The pathogenesis of HCC is extremely complex, involving cell cycle regulation, signal transduction and other processes. This reflects the different functions and multiple interactions of many genes (Craig et al., 2020). Therefore, exploring the specific mechanisms of hepatocarcinogenesis and analyzing the prognostic factors of hepatocellular carcinoma may be helpful in improving the prognosis of patients and finding effective therapeutic targets (Quaresma et al., 2015).
Transcriptional extension regulator 1 (TCERG1) is a highly conserved human nuclear protein, formerly known as CA150, that contains multiple protein domains, specifically three WW domains at the amino terminal and six consecutive FF domains at the carboxyl terminal. The transcriptional elongation factor used to regulate HIV-1 Tat gene activation was originally discovered from the nuclear extract fraction of HeLa cells. Subsequently, it was identified in highly purified spliceosomes (Sune et al., 1997; Neubauer et al., 1998; Makarov et al., 2002; Lin et al., 2004; Deckert et al., 2006). TCERG1 is localized at the splicing factor-rich nuclear speckle interface and nearby transcriptional sites (Sanchez-Alvarez et al., 2006), and is involved in a variety of events including pre-mRNA splicing regulation and regulation of RNA polymerase II transcriptional elongation. Transcriptomic studies showed that TCERG1 is highly expressed in the brain (hippocampus, cortex, lateral ventricles and cerebellum). Interestingly, TCERG1 is involved in the pathogenesis of Huntington’s disease (HD) (Arango et al., 2006; Andresen et al., 2007) and plays a neuroprotective role in HD due to its overexpression that can rescue neuronal cell death caused by mutant HTT neurotoxicity. TCERG1 has also been identified as a genetic regulator of Tau neurotoxicity (Blard et al., 2007). Many studies have found (Wang et al., 2000; Smith et al., 2004) that TCERG1 is involved in the regulation of apoptosis. It sensitizes cells to apoptotic agents and thus promotes apoptosis by regulating the variable splicing of apoptotic genes Bcl-x and Fas/CD95. There are indications that the effect of TCERG1 on apoptosis also involves changes in mitochondrial membrane permeability (Montes et al., 2015).
At present, the role of TCERG1 gene in cancer has been reported less, but the clinical pathological significance and systematic analysis of TCERG1 gene in liver cancer patients have not been reported. Therefore, this study was conducted to assess the prognostic significance of TCERG1 gene expression in HCC by bioinformatics analysis of clinical features and survival data from The Genome Atlas of Liver Cancer (TCGA-LIHC).
Material methods
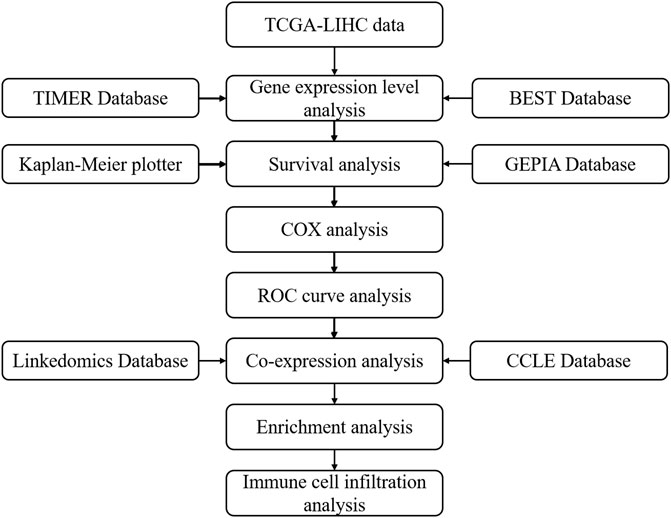
The flowchart of the study is shown in Figure 1.
Data collection
The expression data of RNA-seq of hepatocellular carcinoma (TCGA-LIHC) (HTSeq-FPKM was selected from Workflow Type column) and clinical information were downloaded from TCGA database (https://portal.gdc.cancer.gov/). A total of 50 normal tissue samples and 374 tumor tissue samples were obtained. RNA-seq transcriptome sequencing data (transcriptome corrected expression) were also downloaded from the CCLE database for analysis. In addition, the gene expression and clinical information file GSE76427 was downloaded from the Gene Expression Omnibus database (GEO) (https://www.ncbi.nlm.nih.gov/geo/) (Laurent et al., 2011).
TCERG1 gene expression analysis
Firstly, we analyzed TCERG1 expression levels in different types of human cancers by TIMER database (https://cistrome.shinyapps.io/timer/) and GEPIA database (http://gepia2.cancer-pku.cn/#analysis). Secondly, the expression levels of TGERG1 in hepatocellular carcinoma also verified using the online web tool BEST (https://rookieutopia.com/app_direct/BEST/). The BEST website contains over 50,000 samples from 27 solid tumors and is divided into eight main modules that explore gene expression, prognosis, functional characteristics, immunotherapy, immune infiltration, immunomodulators, genomic mutations, and even the development of small molecule drugs, while the TCGA-LIHC data downloaded from TCGA (Normal group N = 50, tumor group T = 374) were normalized by using the limma and beeswarm packages in R software (version 4.1.2), and the TCERG1 expression in the tumor and normal groups were extracted for mapping. The patient samples were further screened and analyzed, and the samples from the same patients in the paracancer group were paired with those in the tumor group (50 pairs in total).
Survival analysis
TCERG1 gene expression and overall survival (OS) of 370 TCGA-LIHC patients were analyzed using the SURVIVAL package in R software. The Kaplan Meier (http://kmplot.com/analysis) (Menyhart et al., 2018) and the GEPIA online database (Tang et al., 2017) were used to validate the survival curve analysis of the TCERG1 gene.
Clinical diagnostic value analysis
We removed the patient data with incomplete clinical information by combining the patient’s age, sex, grade, TNM staging and distant metastasis from the relevant clinical data of liver cancer patients downloaded, and finally obtained the data of 329 patients. The patients were divided into high and low groups according to the median value of TCERG1 gene expression. We used the survival ROC package for ROC curve plotting analysis and obtained the area under the curve (AUC). Potential prognostic factors were screened using univariate Cox analysis, multivariate Cox regression to analyze the effects of TCERG1 expression and other clinical variables on total survival (OS).
Co-expression analysis
To further investigate the molecular mechanisms associated with TCERG1, the LinkedOmics database (http://linkedomics.org/login.php) (Zhou et al., 2019) was used to identify TCERG1 co-expression genes by pearson and the results were displayed by heat map. Using the Limma package in R software, 489 co-expressed genes were obtained by filtering with a person coefficient >0.4 and p < 0.01. Finally, the co-expressed genes were sorted by cor value, and 10 genes were taken for each of low and high expression (only mRNA was analyzed) and heat map was plotted using the ggplot2 package in R software. Finally, the top 50 genes associated with TCERG1 in both databases were selected to take the intersection for further analysis.
Enrichment analysis
TCGA-LIHC data (expression with duplicate genes removed using the Limma package in R software) were subjected to GSEA enrichment analysis based on the median value of TCERG1 gene expression. 1,000 gene set alignments were performed for each analysis. Enrichment pathways with NES >1, NOM p-value < 0.05 and FDR q-value < 0.25 were considered to be statistically significant. GO and KEGG functional analyses were also performed for TCERG1 and its co-expressed genes CPSF6 and MAML1.
Analysis of TCERG1 in immune cells
The TISIDB database (http://cis.hku.hk/TISIDB/index.php), a website that integrates multiple types of data resources into tumor immunology (Ru et al., 2019), collects a large number of human cancer datasets from the TCGA database. The correlation between TCERG1 expression in HCC by immune or molecular subtypes was explored through the TISIDB database. p values less than 0.05 were considered to be statistically significant. Single sample gene set enrichment analysis (ssGSEA) was performed on tumor samples from 24 immune cell types using the GSVA software package (Bindea et al., 2013; Hanzelmann et al., 2013).
Cell culture
LO2, SMMC-7721, SNU-449, HUH-7 and MHCC97-H cells were cultured in DMEM medium (Gibco, ThermoFisher Scientific, United States) with 10% fetal bovine serum (Life Technologies, United States), 1% penicillin and streptomycin (100u/ml penicillin and 100 mg/ml streptomycin of Life Technologies) in an incubator humidified air at 37°C with 5% CO2.
Quantitative real-time (qRT) PCR assay
Total RNA was extracted from cells according to instructions using the TRIzol (Invitrogen) method. Contaminated genomic DNA was removed with RQ1 DNase (Promega, Madison, WI, american). Reverse transcription of total RNA into cDNA according to the TAKARA kit reaction system. qRT-PCR was quantitatively analyzed using SYBR. Primer: hTCERG1-fw:ggcgagagtgaacgattcaac. hTCERG1-rv:tggaggaggtcgcatcagag. hGAPDH-fw:actttggtatcgtggaaggactcat. hGAPDH-rv:gtttttctagacggcaggtcagg.
Western blot
Normal control (NC) group and interfering group (Si-TCERG1-1, si-TCERG1-2) cells were collected and lysed on ice for 30 min with appropriate amounts of RIPA and PMSF, and protein quantification by BCA. Separated by SDS-PAGE electrophoresis, transferred to PVDF membrane, closed for 2 h, followed by primary antibody (1:1000) overnight at 4°C and incubated with secondary antibody for 2 h the next day for development analysis and detection of protein bands.
Cell proliferation assay
CCK8 experiments were divided into NC group and interference group (Si-TCERG1-1, si-TCERG1-2), SMMC-7721 and Huh-7 cells after gene regulation were inoculated in 96-well plates at 2000/well, with three replicate wells/group, and 10ul/well CCK-8 reagent was added at 0 h, 24 h, 48 h and 72 h, respectively, and the cells were incubated at 37°C for 2 h, and the absorbance value A450 nm was detected to observe the cell proliferation.
Wound healing scratch test
Hepatocellular carcinoma cells were inoculated in a six-well plate and scratched with a 10ul short shotgun tip after 24 h. The scratched cells were removed by washing with PBS and incubated with serum-free medium. The cell gaps were photographed with microscope, and the migration was observed after 0 h and 24 h. The cells were analyzed by ImageJ software.
Cell migration and invasion assay
The cells of each group were digested with trypsin and evenly seeded in Transwell chambers, 800ul of complete culture medium was added to the lower chamber, and after 24 h of incubation, the cells of Transwell chambers were fixed with methanol for 30 min, stained with crystal violet for 20 min, washed with PBS for floating color, and the number of migrated cells was counted after air-drying. For cell invasion assay, Matrigel was added to the upper chamber of Transwell, and after it solidified, cells were seeded in the upper chamber coated with Matrigel, and 800 ul of complete medium was added to the lower chamber and incubated at 37°C for 24 h. The number of cell invasion was detected in the same way.
Statistical analysis
Statistical analyses and plots were performed using R software (version 4.1.2) and GraphPad software. t test, Mann-Whitney U test were used were performed to compare between the two groups. Wilcoxon s rank sum test and logistic regression were used to analyze the correlation between clinical characteristics of HCC and TCERG1 expression. p values less than 0.05 were regarded as statistically significant. Univariate and multivariate Cox proportional risk models were used to assess survival analysis. The Spearman rank correlation coefficient method was used to analyze the relationship between TCERG1 and the level of immune cell infiltration. In addition, statistical significance of cell line experiments was assessed by t-test in GraphPad Prism version8 software. The difference was considered to be statistically significant at ∗p < 0.05, ∗∗p < 0.01, ∗∗∗p < 0.001.
Results
Identification of TCERG1 differential expression in human cancers
To explore the role of TCERG1 in the clinical prognosis of HCC patients, we first analyzed the expression of TCERG1 in different cancer types. The results of TIMER database showed that TCERG1 gene was significantly high expression in BLCA, CHOL, COAD, ESCA, HNSC, KIRC, KIRP, LIHC, LUAD, LUSC, READ STAD and other cancers, while it was low expression in GBM and THCA (Figure 2A). The results of GEPIA database analysis showed that they are supplementary results of several cancers without normal tissue pairing in TIMER database (Figure 2B). The results suggested that the dysregulation of TCERG1 expression may be involved in the occurrence and development of various tumors.
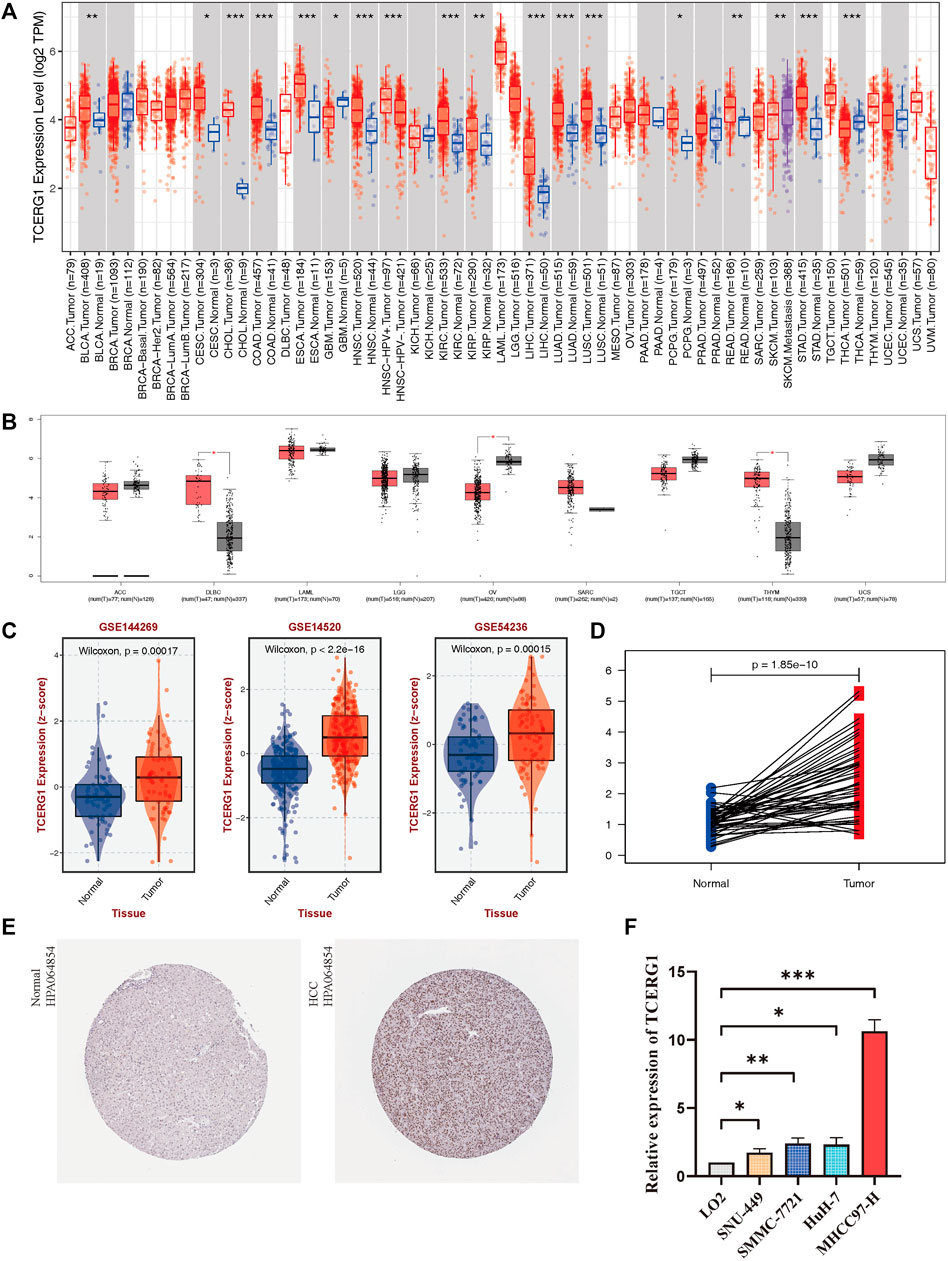
FIGURE 2. Expression level of TCERG1 in tumors.(A) TIMER database analysis of TCERG1 expression levels in different cancer types in the TCGA database; (B)TCERG1 expression in several cancers and paired normal tissues in the GEPIA database; TCERG1 (C) 50 pairwise analysis of TCERG1 gene expression in the paracancer group versus the tumor group; TCERG1 (D) TCERG1 gene expression in liver cancer tissues and normal liver tissues in BEST database (E) Immunohistochemical analysis of TCERG1 protein expression in HPA database normal and HCC tissues. Normal liver cancer tissue - patient id: 3402, antibody: HPA064854, staining: not detected, intensity: weak, quantity: <25%; tumor tissue - patient id: 5031, antibody: HPA064854 Staining: medium, intensity: moderate, quantity: >75%; (F) mRNA expression levels of TCERG1 in HCC cell lines. Three independent experiments were performed. (*p < 0.05, **p < 0.01, ***p < 0.001).
TCERG1 gene is highly expressed in HCC
We analyzed the expression level of TCERG1 gene in HCC by the BEST and TCGA databases. The results showed that the expression levels of TCERG1 gene was significantly higher in LIHC than in normal tissues (p = 2.497e-21, p = 1.85e-10) (Figure 2C-D, Supplementary Table S2). In addition, immunohistochemical analysis obtained by HPA showed that TCERG1 had higher expression levels in tumor tissues compared to non-tumor tissues (Figure 2G), while qRT-PCR further verified that TCERG1 gene was highly expressed in HCC (Figure 2H). These results implied that TCERG1 overexpression might play an important role in the occurrence and development of HCC.
Clinical correlation analysis of TCERG1 expression in HCC patients
In order to explore the correlation between TCERG1 gene and clinical characteristics, we analyzed the prognostic role of TCERG1 gene in HCC combined with the relevant clinical data in TCGA database. The results showed that TCERG1 overexpression was significantly correlated with clinical status, T stage, pathologic stage, histologic grade, tumor status, age, weight, and AFP (ng/ml) (Figure 3, Supplementary Table S3) (*p < 0.05, **p < 0.01, ***p < 0.001).
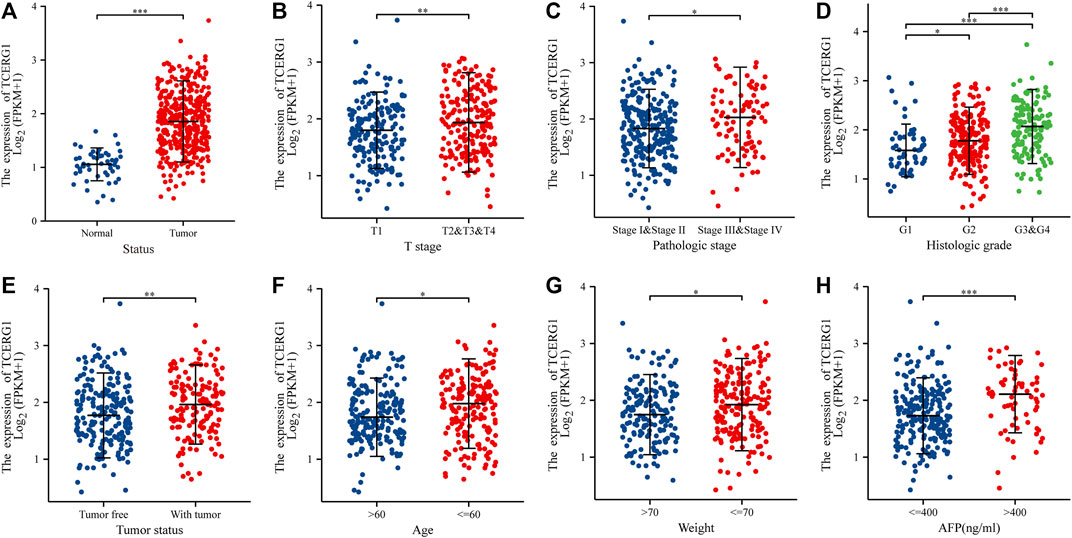
FIGURE 3. Correlation between TCERG1 gene expression and clinicopathological characteristics. (A) Clinical status; (B) T stage; (C) Pathologic stage; (D) histologic grad; (E) tumor status; (F)age; (G) weight; (H) AFP levels.
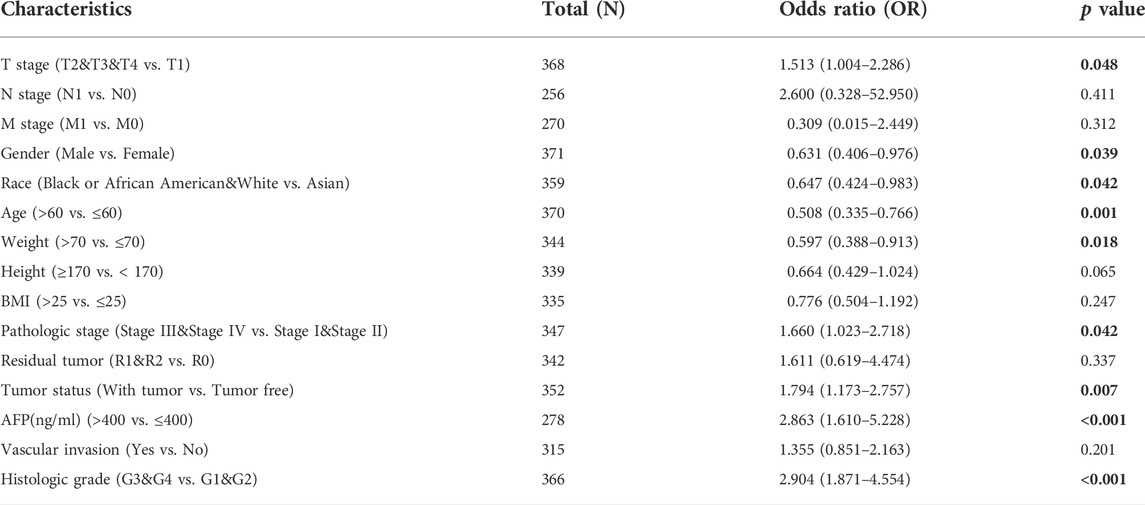
Univariate analysis of logistic regression showed that TCERG1 gene expression was a categorical dependent variable associated with clinical characteristics of poor prognosis (Table 1). High TCERG1 expression level was associated with T stage (p = 0.048), gender (p = 0.039), race (p = 0.042), age (p = 0.001), and weight (p = 0.018), Pathologic stage (p = 0.042) Tumor status (p = 0.007) and histologic grad correlated (p < 0.001). These results indicate that high expression of TCERG1 is an independent risk factor affecting overall survival in patients with HCC.
To determine the relationship between TCERG1 expression levels and prognosis, we plotted the survival curves of TCERG1 gene by combining clinical data from HCC patients (N = 370) in TCGA. The analysis showed that high TCERG1 expression and poor prognosis were associated (p = 0.017) (Figure 4A). Subsequently, the survival analysis of TCERG1 gene was further validated using GEPIA and Kaplan Meier databases to obtain OS (p = 0.029) and OS (p = 0.00094), respectively (Figures 4B,C); It was also found that DSS (p = 0.0072), PFS (p = 5.1e-05) and RFS (p = 0.0065) were significantly lower in the TCERG1 high expression group than in the low expression group, The results indicate that patients with low expression had better survival, while patients with high expression had significantly lower survival (Figures 4.D–F). Subgroup analysis of different clinical characteristics showed that high TCERG1 expression and poor prognosis were significantly correlated in age (p = 0.011), Pathologic stage (p = 0.012), histologic grade (p = 0.011, Figures 4G–I). In HCC, high TCERG1 expression and shortened survival time and poor prognosis were positively correlated, indicating that TCERG1 could be used as an indicator of disease progression and prognosis in HCC patients.
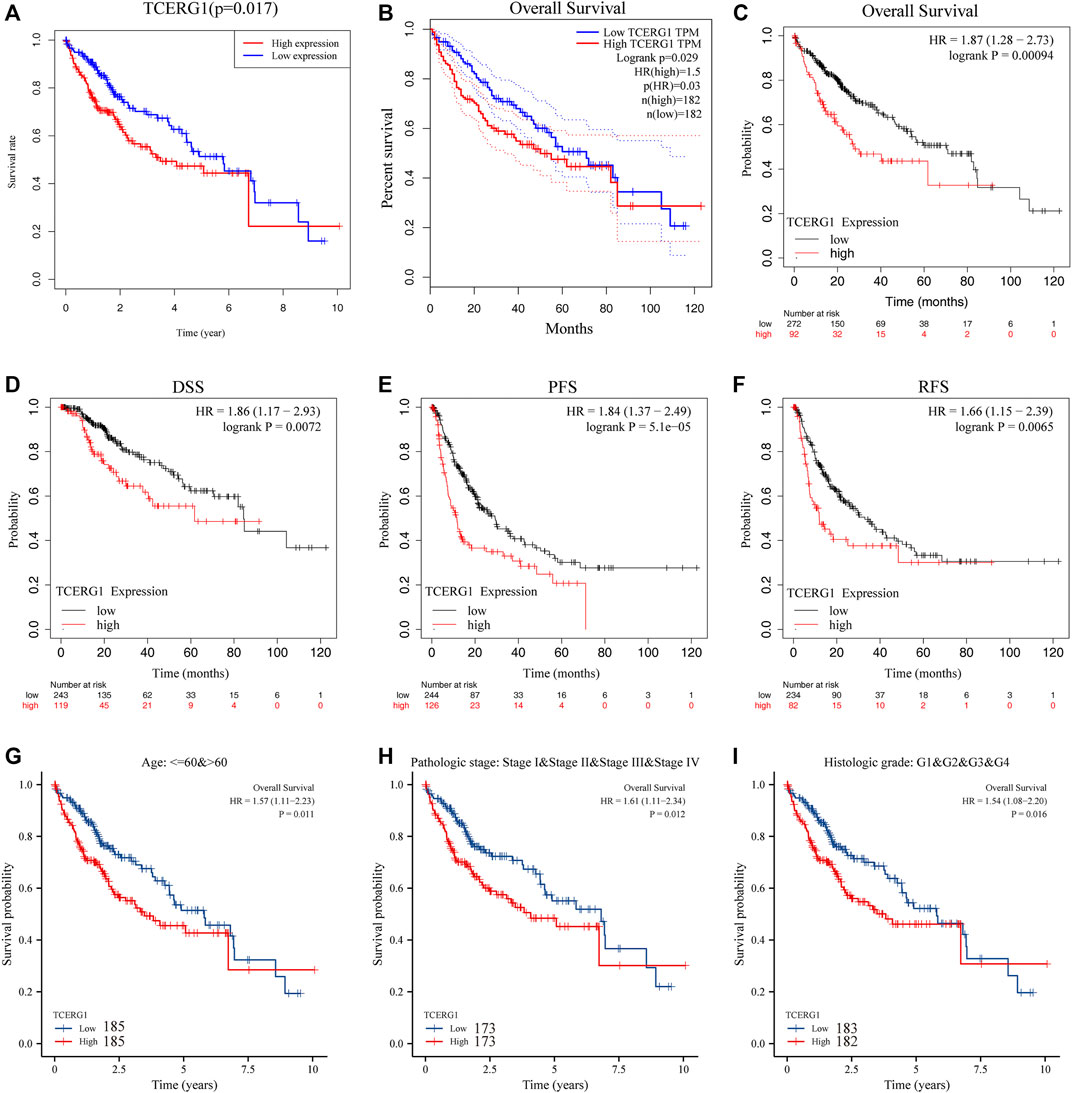
FIGURE 4. Survival analysis of TCERG1 gene expression in HCC patients from TCGA-LIHC database. (A)TCGA database of TCERG1 expression level in HCC in relation to OS; (B)GEPIA database analysis of TCERG1 expression level in HCC patients in relation to OS; (C–F) Kaplan-Meier website analysis of TCERG1 expression level in HCC patients in relation to OS, DSS, PFS, RFS; (G–I).age, Pathologic stage, histologic grade OS: overall survival; DSS: disease-specific survival; PFS: progression-free survival; RFS: disease-free survival.
Identification of factors influencing the prognosis of HCC
We performed ROC curve analysis on TCERG1 gene expression data to assess the diagnostic value of this gene. The AUC value is within the range [0.5–1.0](AUC = 0.716), which has some clinical diagnostic value (Figure 5A). The risk score and survival status are shown in Figure 5B,C. The negative prognostic impact of higher TCERG1 expression was validated in the GEO database (GSE76427 Figure ). Meanwhile, we obtained data information from 240 patients for Univariate COX analysis, and the results showed that the expression of TCERG1 gene in patients with hepatocellular carcinoma (HR = 1.29; 95% CI =1.12–1.48; p < 0.001), stage (HR = 1.86; 95% CI = 1.46–2.39; p < 0.001), T (HR = 1.80; 95% CI = 1.43–2.27; p < 0.001) and M (HR = 3.84; 95% CI = 1.21–12.28; p = 0.023) were also high risk factors. Similarly, the results of multivariate Cox regression analysis showed that the expression level of TCERG1 gene (HR = 1.30; 95% CI = 1.11–1.52; p = 0.001) was still independently associated with OS (Figures 5H,I) In conclusion, TCERG1 gene could be an independent prognostic factor for patients with HCC.
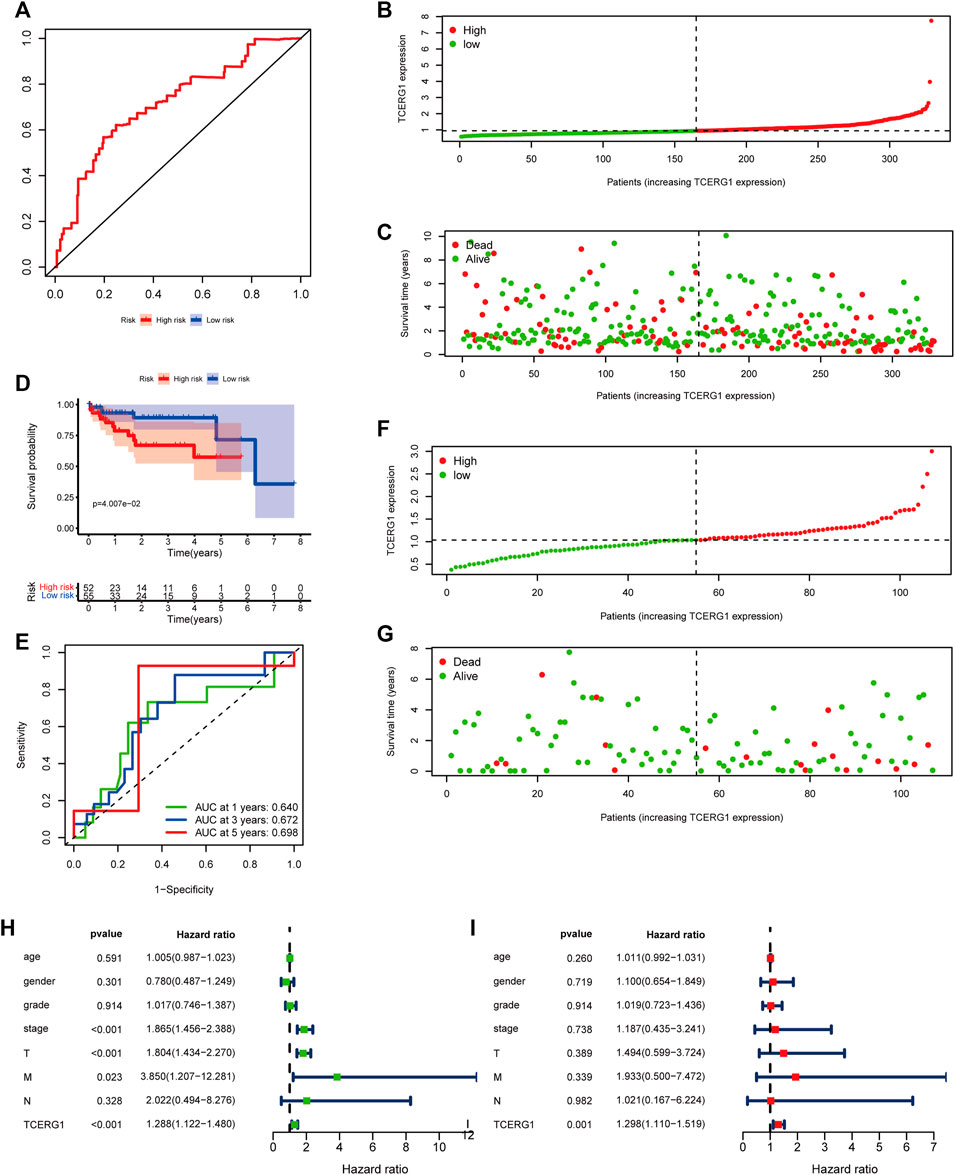
FIGURE 5. Prognostic analysis of TCERG1 in HCC.(A) ROC curve analysis; (B,C) Risk score distribution and survival status of TCERG1 in HCC; (D–G) Prognostic analysis of TCERG1 in HCC in the GEO dataset; (H) Univariate Cox regression analysis of risk scores regarding OS in HCC; (I)Multivariate cox analysis.
Co-expression analysis of TCERG1 gene
To further investigate the possible role of TCERG1 in hepatocarcinogenesis, we next performed data mining through Linkedomics and CCLE databases to screen for proteins interacting with TCERG1. The results of Linkedomics database showed that 7,726 genes were significantly positively correlated with TCERG1 in HCC and 3245 genes were negatively correlated (FDR <0.01). The heat map shows the top 50 genes positively and negatively associated with TCERG1 (Figures 6A–C). The CCLE database results showed the top 10 genes positively and negatively associated with TCERG1 genes in the heat map (mRNA only analysis) (Figure 6D, Supplementary Table S6, p < 0.01). Finally, the intersection of the top 50 genes significantly associated with TCERG1 in both databases revealed that CPSF6 and MAML1 were present in both databases, and the results showed that CPSF6 and MAML1 were positively associated with TCERG1 (Figures 6E,F). In addition, it has been shown that high expression of CPSF6 and MAML1 in HCC is associated with poor patient prognosis and they might serve as a potential prognostic marker to predict hepatocarcinogenesis (Wang et al., 2016; Tan et al., 2021). These results above suggested that TCERG1 and its co-expressed genes CPSF6 and MAML1 might be jointly involved in hepatocarcinogenesis, leading to a lower survival rate in patients with hepatocellular carcinoma.
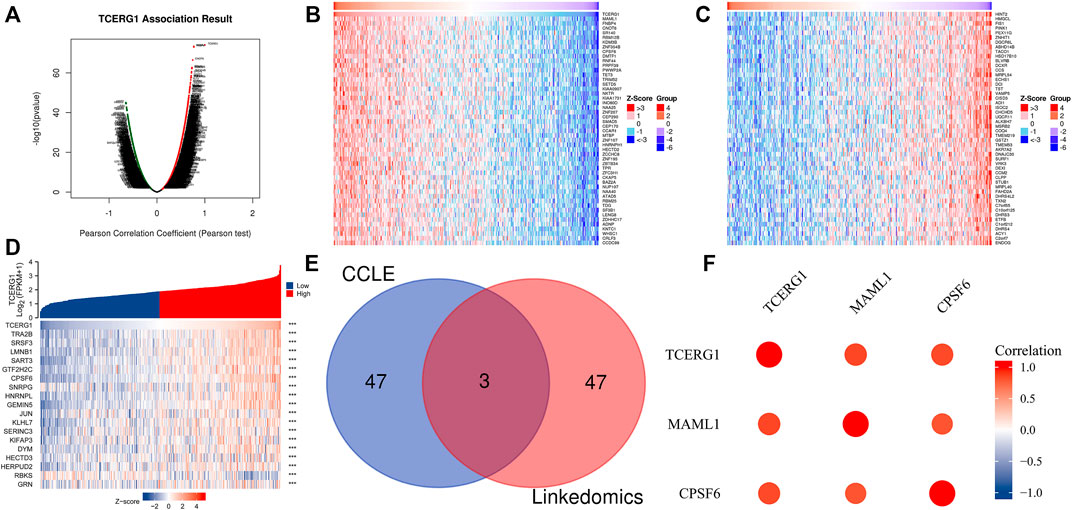
FIGURE 6. Co-expressed genes of TCERG1 in HCC. (A) LinkedOmics database analysis of co-expressed genes of TCERG1 in HCC; (B,C) heat map of the top 50 positive co-expressed genes (B) and negative co-expressed genes with TCERG1 (C); (D) CCLE database analysis of the top 10 positively and negatively associated co-expressed genes; (E) Venn diagram of significantly associated genes from LinkedOmics and CCLE databases; (F) CPSF6, MAML1 and TCERG1 are positively correlated.
GO and KEGG analysis
Next, gene set enrichment analysis (GSEA) was used to determine the major gene ontology (GO) of TCERG1 co-expressed genes. TCERG1, CPSF6, MAML1 and their co-expressed genes were found to be enriched in RNA splicing, nuclear speck, chromosomal region, and ribonucleoprotein complex binding (Figures 7A–C). Then, we performed Kyoto Encyclopedia of Genes and Genomes (KEGG) pathway analysis in Linkedomivs database, and the results showed that TCERG1, CSPF6, MAML1 were all enriched in Cell cycle, Fanconi anemia pathway, MicroRNAs in cancer, Spliceosome and TGF-β signaling pathway, and ErbB signaling pathway (Figures 7D,E). These results suggested that TCERG1 and its co-expressed genes CPSF6 and MAML1 might be jointly involved in the development of hepatocarcinoma.
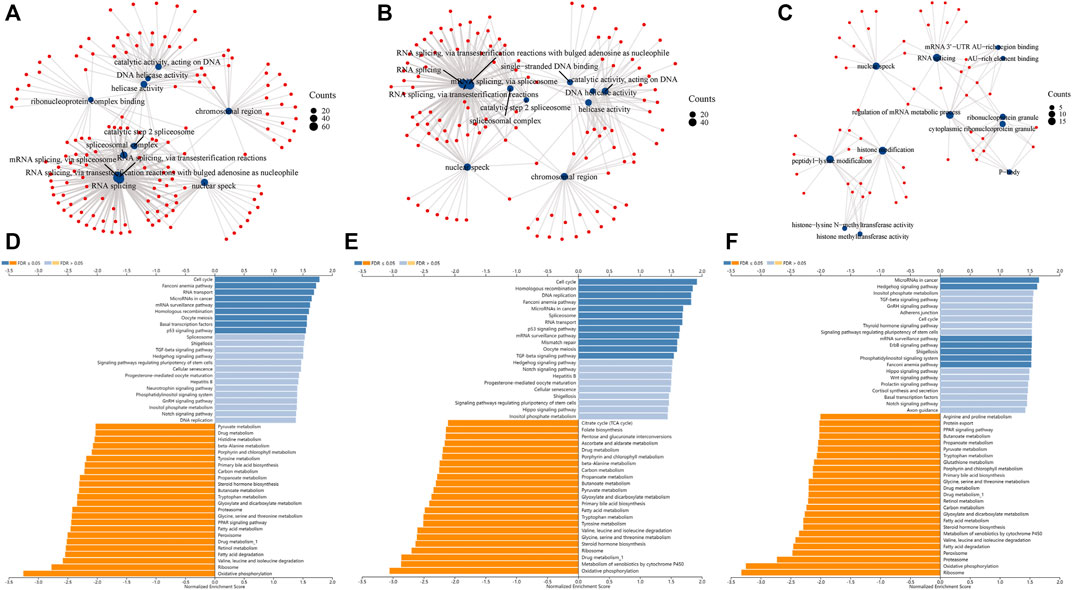
FIGURE 7. GO and KEGG functional analysis of TCERG1 and its co-expression genes CPSF6 and MAML1. (A–C) GO analysis of TCERG1, CPSF6 and MAML1 in HCC; (D–F) KEGG analysis of TCERG1, CPSF6 and MAML1 in HCC.
TCERG1 correlation signal path analysis is based on GSEA
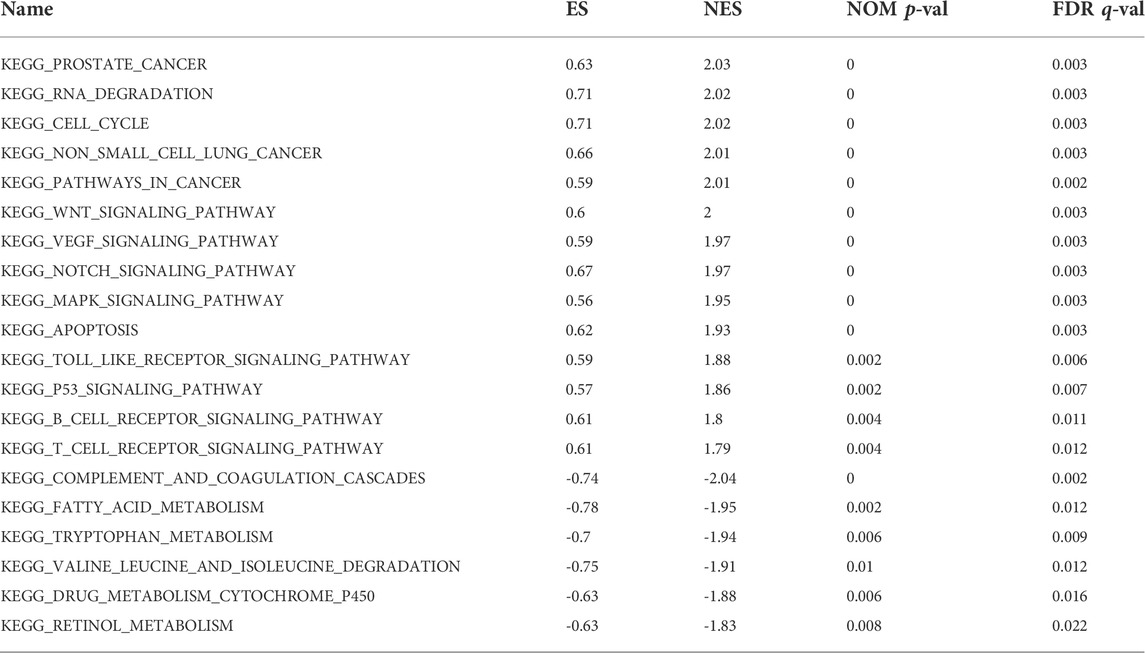
To investigate the potential function of TCERG1 gene in HCC, we divided TCGA-LIHC clinical patient data samples into high and low expression groups according to the median value of TCERG1 gene expression. Then, we performed GSEA enrichment score analysis to identify the signaling pathways that are differentially activated between high and low TCERG1 gene expression phenotypes in HCC. Analysis of the enrichment results showed that 134 of 178 signaling pathways were upregulated and 44 were downregulated, of which 88 were upregulated and nine were downregulated (NOM p < 0.05). The results showed that the samples with high TCERG1 gene expression were significantly enriched in cancer-related signaling pathways such as cell cycle, apoptosis and pathways in cancer, as well as signaling pathways known to be associated with hepatocellular carcinoma such as Wnt signaling pathway, Vegf signaling pathway, Notch signaling pathway, MAPK signaling pathway and MTOR signaling pathway (Figure 8). The high TCERG1 phenotype was also enriched in immune cell-related signaling pathways such as B cell, T cell, etc. Complement and coagulation cascades, fatty acid metabolism, tryptophan metabolism, valine leucine and isoleucine degradation, drug metabolism cytochrome P450, and retinol metabolism were enriched in the low TCERG1 phenotype (Figure 8B; Table 2). These suggested that TCERG1 might be involved in immunomodulation and play potential role in the occurrence and development of liver cancer.
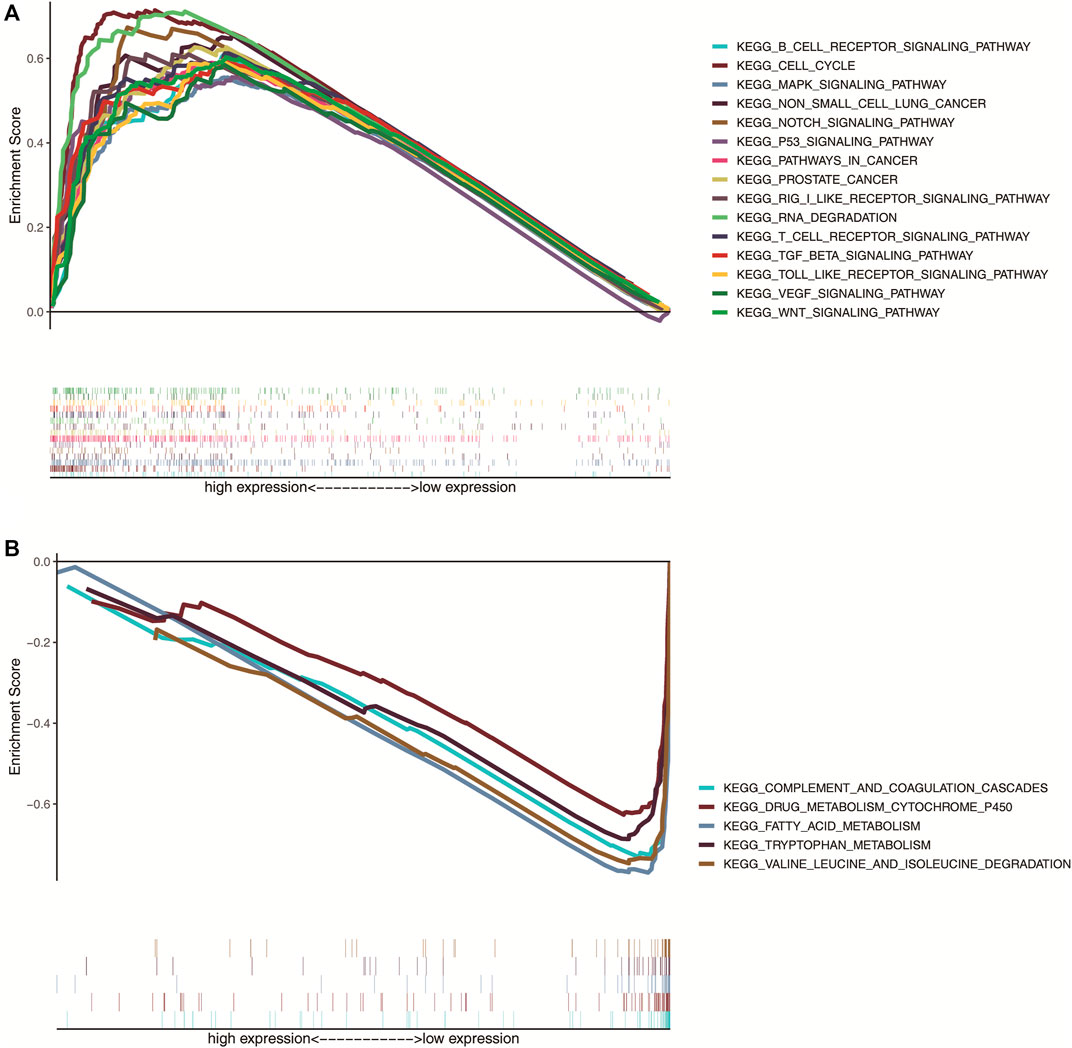
FIGURE 8. Pathway enrichment analysis of TCERG1 gene. (A) 15 important signaling pathways associated with high TCERG1 expression; (B) five important signaling pathways associated with low TCERG1 expression (NOM p < 0.05 and FDR q < 0.05).
Correlation of TCERG1 gene expression levels and immune infiltrating cells
TCERG1 was found to be significantly enriched in immune cells by GSEA enrichment analysis. Next, through the TISIDB website, we explored the role of TCERG1 gene expression in the immune and molecular subtypes of hepatocellular carcinoma. The results showed that in HCC, TCERG1 was highly expressed in C1 and C4. We also noticed that TCERG1 expression in HCC was correlated with molecular subtypes, in which iCluster1 was high expression (Figures 9A,B).
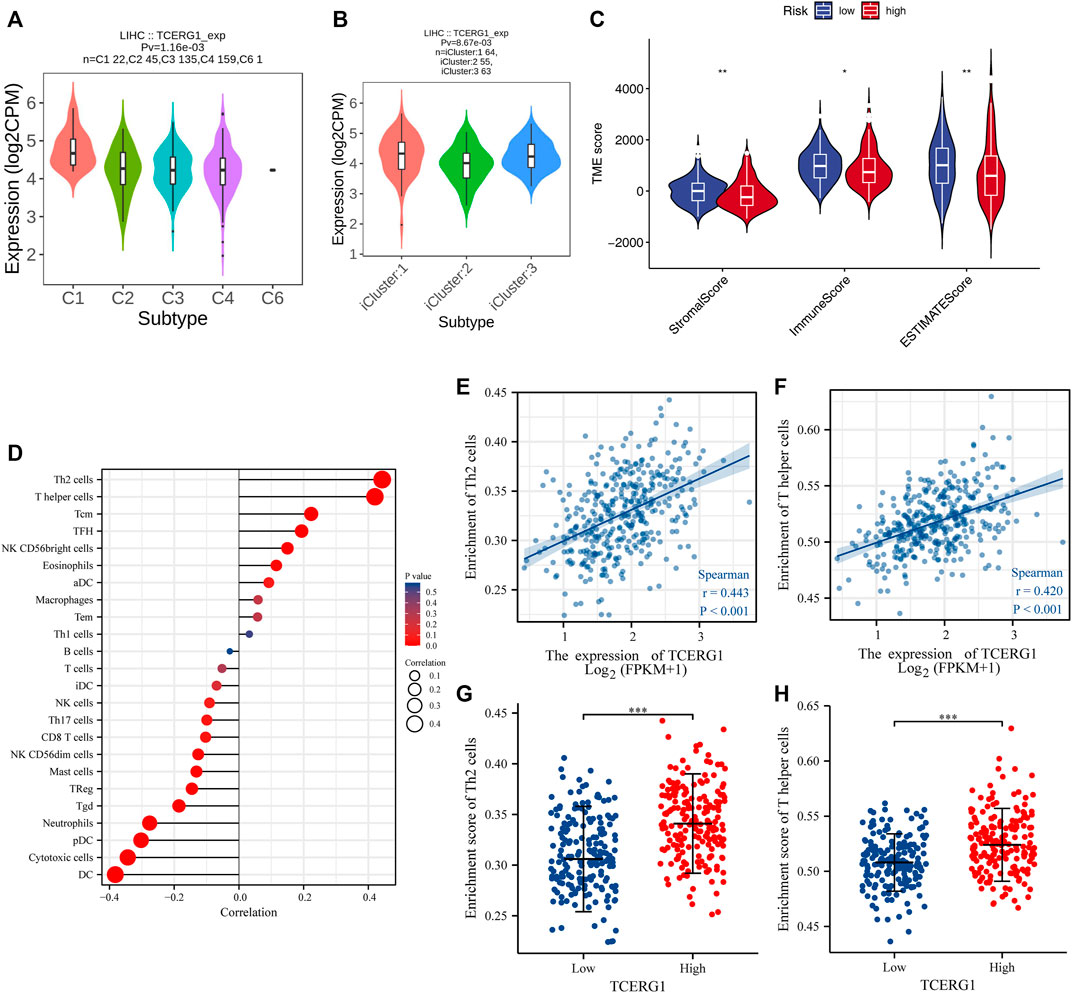
FIGURE 9. Correlation between TCERG1 gene expression and immune infiltration of tumor microenvironment. (A,B) Correlation between TCERG1 expression and immune, molecular subtypes of hepatocellular carcinoma; (C) Correlation between TCERG1 score and immune, stromal scores; (D) Correlation between TCERG1 and 24 immune cells using Spearman correlation method; (E,F) Correlation between TCERG1 expression level and Th2 cells, T helper cells; (G,H) the correlation between TCERG1 gene expression level and the abundance of Th2 cells, T helper cells using Wilcoxon rank sum test.
After demonstrating the differential expression of TCERG1 in different immune and molecular subtypes, we explored the potential relationship between TCERG1 expression and immune cell infiltration in hepatocellular carcinoma. The results showed that the StromalScore, Immunescore, and EstimateScore were higher in the low-expressing HCC group (Figure 9C). Through spearman correlation analysis, the relationship between the expression level of TCERG1 in the HCC tumor microenvironment and the level of immune cell infiltration by the ssGSEA quorum was determined. The results showed that the expression of TCERG1 was positively correlated with Th2 cells, T helper cells, Tcm, TFH, NK CD56 bright cells, Eosinophils; and negatively correlated with DCs, Cytotoxic cells, pDCs, Mast cells, Neutrophils, Tgd, and TReg (Figure 9D). Among them, Th2 cells and T herper cells were significantly positively correlated with TCERG1 expression, with Spearman R up to 0.443 and 0.420 with p values < 0.001. (Figures 9E–H). Therefore, our findings suggested that TCERG1 was involved in regulating the functions of Th2 cells and T helper cells in HCC.
Knockdown of TCERG1 inhibits HCC cell proliferation, migration and invasion
The results of RT-qPCR showed that TCERG1 was highly expressed in hepatocellular carcinoma cell lines SNU-449, SMMC-7721, Huh-7 and MHCC97-H compared with normal hepatocytes LO2, and the difference was statistically significant. To investigate the biological function of TCERG1 in HCC, 2 cell lines, SMMC-7721 and Huh-7, were selected for the experiment. Subsequently, TCERG1 expression was reduced in HCC cell lines using two independent small interfering RNAs (siRNAs) and the efficiency of siRNA was verified by Western blot (Figure 10A); CCK8 results showed that knockdown of TCERG1 inhibited the value-added viability of SMMC-7721 and Huh-7 cell lines compared to the NC group (Figures 10B,C).
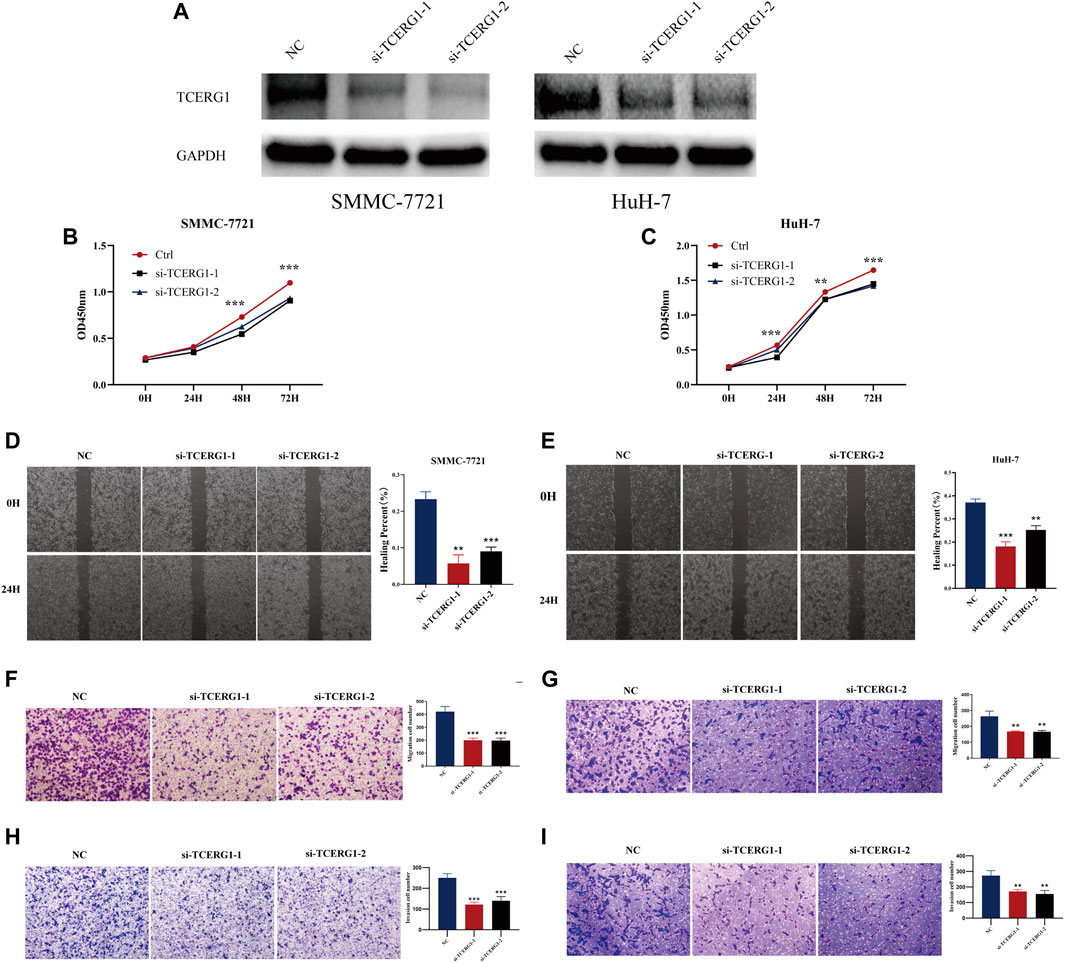
FIGURE 10. Knockdown of TCERG1 in HCC cell suppresses proliferation, migration and invasion of HCC cells. (A) WB shows TCERG1 protein levels under two different TCERG1-siRNA treatments, (B,C) cck8 assay on the proliferation ability of cells in NC and Si-TCERG groups. (D,E) Wound-healing assay for detection of cell migration in NC and Si-TCERG1 cells. (F,I) Transwell assays for the effects of TCERG1 knockdown on HCC cell migration and invasion. (Left: HCC cell line SMMC-7721, Right: HCC cell line Huh-7, quantitative analyses, n = 3, *p < 0.05; **p < 0.01; ***p < 0.001)
The results of the scratch assay showed that the 24 h scratch width was wider in the Si-TCERG1 group compared with the NC group, and knockdown of TCERG1 decreased the wound healing ability of Huh-7, SMMC-7721 cells (Figures 10D,E). Transwell results showed that the number of migrating and invading cells crossing the chamber membrane at 24 h was significantly reduced in the Si-TCERG1-1 group compared with the NC group (Figures 10F–I), indicating that knockdown of TCERG1 significantly inhibited the migration and invasion of HCC cells.
Discussion
HCC is a common type of cancer, and in recent years, its incidence has continued to increase with poor prognosis and high mortality (Zhao et al., 2020). Late diagnosis and rapid metastasis are the main causes of malignant death in patients with hepatocellular carcinoma. Although the study of hepatocellular carcinoma pathology has gradually advanced over the past few years and progress has been made in the diagnosis and management of treatment strategies for patients with hepatocellular carcinoma, but the specific molecular mechanisms of HCC metastasis are still unclear, the success rate and clinical outcomes of treatment remain poor (Lurje et al., 2019). The occurrence, development, and metastasis of liver cancer is a very complex process, and studies in recent years have shown that the occurrence and poor prognosis of HCC may be related to abnormal gene expression (Montes et al., 2012). With the continuous discovery of molecular biomarkers, prognostic indicators will become a promising clinical tool for liver cancer (Elliott and Sutterwala, 2015). It is necessary to find effective molecular mechanisms for the occurrence and development of HCC and to develop new biomarkers for liver cancer diagnosis and prognosis to aid in clinical diagnosis and prediction [39, 40].
TCERG1 is a highly conserved human protein, which plays an important role in regulating the transcription rate of RNA polymerase II and in alternative splicing. Studies have shown that TCERG1 can stimulate the elongation of RNAP II, and its overexpression causes a shift to Bcl-xs proapoptotic splice variant, which is involved in the regulation of apoptosis (Montes et al., 2012). The expression of TCERG1 gene and the potential mechanisms of its prognostic impact on HCC patients have not been evaluated yet.
We used TCGA-LIHC data to assess the prognostic value of TCERG1. Our analysis is the first to identify TCERG1 as a biomarker for hepatocellular carcinoma. In this study, the expression of TCERG1 in pan-cancer was explored through multiple platforms, and further verified using qRT-PCR, and the results showed that the expression of TCERG1 gene in tumor tissue was increased. By exploring the correlation between the TCERG1 gene and clinical features, TCERG1 overexpression was significantly associated with various clinical traits. Survival analysis found that patients with low expression of the TCERG1 gene had better survival and high expression had significantly lower survival, and the results were validated in both the Kaplan Meier and GEPIA databases. Our study found that high expression of the TCERG1 gene is associated with poor prognosis as an independent prognostic factor for OS in HCC patients. ROC analysis also validated this diagnostic value (AUC = 0.716). As well, these results are verified in an independent GEO cohort. However, its specific significance in the prognosis of HCC is unclear. In addition, in vitro experiments using TCERG1 gene intervention in hepatocellular carcinoma cell lines SMMC-7721 and Huh-7 demonstrated that knockdown of TCERG1 inhibited the proliferation, migration and invasion process of hepatocellular carcinoma cells, which is an important complement to the functional and clinical significance of TCERG1.
We next investigated the genes co-expressed with TCERG1 using Linkedomics and CCLE databases. By taking the intersection of the top 50 genes positively associated with TCERG1 in both databases, we found that CPSF6 and MAML1 may be involved in the development of hepatocellular carcinoma together with TCERG1. It has been reported that CPSF6 (Tan et al., 2021) and MAML1 (Wang et al., 2016) are highly expressed in HCC, and their overexpression is associated with poor prognosis of patients, and they promote the proliferation, migration and invasion of HCC cells in vitro and in vivo. The results of GO and KEGG further suggest that TCERG1, CPSF6 and MAML1 may be involved in the development of HCC through cell cycle, DNA replication and other physiological processes.
In addition, GSEA enrichment results showed that the high expression phenotype of TCERG1 gene was closely associated with cell cycle, apoptosis, pathway in cancer and other signaling pathways. Apoptosis is a programmed form of cell death in multicellular organisms. Several studies have also found (Montes et al., 2015) that TCERG1 affects both intrinsic and extrinsic apoptotic pathways, and TCERG1 sensitizes apoptotic agents and promotes apoptosis by modulating selective splicing of the key apoptotic genes Bcl-x and Fas/CD95. The specific mechanism for TCERG1 in hepatocellular carcinoma apoptosis has not been reported in detail and needs to be further explored.
In GSEA enrichment results, we found that the high TCERG1 phenotype was also enriched in immune cell-related signaling pathways such as B cell and T cell. Stromal Score, Immune score and Estimate Score were found to be higher in the low expression HCC group in TME. Next, we used ssGSEA and Spearman correlation analysis to explore the relationship between high TCERG1 expression and immune infiltration level in hepatocellular carcinoma. We found that TCERG1 expression was positively correlated with most immune cells, especially with Th2 cells, T herper cells. Th2 cells Elliott and Sutterwala (Elliott and Sutterwala, 2015) can produce Th2 cytokines, such as IL-4, IL-5,IL-10 and IL-13, which are important components of immune cells. Elevation of TCERG1 expression increased Th2 cells and T herper cells. The findings may suggest that TCERG1 has a function in regulating Th2 cells and T herper cells in HCC, but the exact mechanism is unclear and needs to be further explored.
In summary, our study suggest that TCERG1 is upregulated in HCC and high TCERG1 expression is associated with clinical progression and is considered to be an independent risk factor for OS in HCC patients. Co-expressed genes CPSF6 and MAMAL1 may be jointly involved in the development of hepatocellular carcinoma with TCERG1. In addition, cell cycle, cancer pathway, and Wnt signaling pathway may be key signaling pathways regulated by TCERG1 in HCC. With a better understanding of its function, TCERG1 could serve as an effective tool for the diagnosis and treatment of HCC and may help to make biomarker therapy a promising option for the treatment of liver disease in the future. However, the specific molecular mechanisms underlying the disease progression of HCC need to be further explored.
Data availability statement
The original contributions presented in the study are included in the article/Supplementary Material, further inquiries can be directed to the corresponding authors.
Author contributions
A Conception and design: PY, GL, HW; Administrative support: None; Provision of study materials: YL and QG; Collection and assembly of data: XC, JC, YL, Data analysis and interpretation: RD and CL; Manuscript writing: PY, HL and SC; Final approval of manuscript: All authors read and approved the final manuscript.
Funding
This work was supported by the Natural Science Foundation of the Higher Education Institutions of Anhui Province (KJ2021A0774), Graduate Innovative Research Program of Bengbu Medical College (Byycxz21055) and the Undergraduate Innovative Training Program of China (202110367059).
Conflict of interest
The authors declare that the research was conducted in the absence of any commercial or financial relationships that could be construed as a potential conflict of interest.
Publisher’s note
All claims expressed in this article are solely those of the authors and do not necessarily represent those of their affiliated organizations, or those of the publisher, the editors and the reviewers. Any product that may be evaluated in this article, or claim that may be made by its manufacturer, is not guaranteed or endorsed by the publisher.
Supplementary material
The Supplementary Material for this article can be found online at: https://www.frontiersin.org/articles/10.3389/fgene.2022.959832/full#supplementary-material
References
Andresen, J. M., Gayan, J., Cherny, S. S., Brocklebank, D., Alkorta-Aranburu, G., Addis, E. A., et al. (2007). Replication of twelve association studies for Huntington's disease residual age of onset in large Venezuelan kindreds. J. Med. Genet. 44 (1), 44–50. doi:10.1136/jmg.2006.045153
Arango, M., Holbert, S., Zala, D., Brouillet, E., Pearson, J., Regulier, E., et al. (2006). CA150 expression delays striatal cell death in overexpression and knock-in conditions for mutant huntingtin neurotoxicity. J. Neurosci. 26 (17), 4649–4659. doi:10.1523/JNEUROSCI.5409-05.2006
Bindea, G., Mlecnik, B., Tosolini, M., Kirilovsky, A., Waldner, M., Obenauf, A. C., et al. (2013). Spatiotemporal dynamics of intratumoral immune cells reveal the immune landscape in human cancer. Immunity 39 (4), 782–795. doi:10.1016/j.immuni.2013.10.003
Blard, O., Feuillette, S., Bou, J., Chaumette, B., Frebourg, T., Campion, D., et al. (2007). Cytoskeleton proteins are modulators of mutant tau-induced neurodegeneration in Drosophila. Hum. Mol. Genet. 16 (5), 555–566. doi:10.1093/hmg/ddm011
Chen, W., Zhang, S., Zeng, H., Bray, F., Zheng, R., Baade, P. D., et al. (2016). Cancer statistics in China, 2015. Ca. Cancer J. Clin. 66 (2), 115–132. doi:10.3322/caac.21338, ,
Chen, Z., Xie, H., Hu, M., Huang, T., Hu, Y., Sang, N., et al. (2020). Recent progress in treatment of hepatocellular carcinoma. Am. J. Cancer Res. 10 (9), 2993–3036.
Craig, A. J., Von Felden, J., Garcia-Lezana, T., Sarcognato, S., and Villanueva, A. (2020). Tumour evolution in hepatocellular carcinoma. Nat. Rev. Gastroenterol. Hepatol. 17 (3), 139–152. doi:10.1038/s41575-019-0229-4
Deckert, J., Hartmuth, K., Boehringer, D., Behzadnia, N., Will, C. L., Kastner, B., et al. (2006). Protein composition and electron microscopy structure of affinity-purified human spliceosomal B complexes isolated under physiological conditions. Mol. Cell. Biol. 26 (14), 5528–5543. doi:10.1128/MCB.00582-06
Elliott, E. I., and Sutterwala, F. S. (2015). Initiation and perpetuation of NLRP3 inflammasome activation and assembly. Immunol. Rev. 265 (1), 35–52. doi:10.1111/imr.12286
Forner, A., Reig, M., and Bruix, J. (2018). Hepatocellular carcinoma. Lancet (London, Engl. 391 (10127), 1301–1314. doi:10.1016/S0140-6736(18)30010-2
Hanzelmann, S., Castelo, R., and Guinney, J. (2013). Gsva: Gene set variation analysis for microarray and RNA-seq data. BMC Bioinforma. 14 (7). doi:10.1186/1471-2105-14-7
Harding, J. J., Abu-Zeinah, G., Chou, J. F., Owen, D. H., Ly, M., Lowery, M. A., et al. (2018). Frequency, morbidity, and mortality of bone metastases in advanced hepatocellular carcinoma. J. Natl. Compr. Canc. Netw. 16 (1), 50–58. doi:10.6004/jnccn.2017.7024
Hasan, S., Abel, S., Uemura, T., Verma, V., Koay, E. J., Herman, J., et al. (2020). Liver transplant mortality and morbidity following preoperative radiotherapy for hepatocellular carcinoma. HPB Oxf. 22 (5), 770–778. doi:10.1016/j.hpb.2019.10.006
Hu, X., Jiang, J., Xu, Q., Ni, C., Yang, L., and Huang, D. (2018). A systematic review of long noncoding RNAs in hepatocellular carcinoma: Molecular mechanism and clinical implications. Biomed. Res. Int. 2018, 8126208. doi:10.1155/2018/8126208
Jeng, K. S., Chang, C. F., Jeng, W. J., and Sheen, I. S. (2015). Heterogeneity of hepatocellular carcinoma contributes to cancer progression. Crit. Rev. Oncol. Hematol. 94 (3), 337–347. doi:10.1016/j.critrevonc.2015.01.009
Jindal, A., Thadi, A., and Shailubhai, K. (2019). Hepatocellular carcinoma: Etiology and current and future drugs. J. Clin. Exp. Hepatol. 9 (2), 221–232. doi:10.1016/j.jceh.2019.01.004
Kulik, L., and El-Serag, H. B. (2019). Epidemiology and management of hepatocellular carcinoma. Gastroenterology 156 (2), 477–491. doi:10.1053/j.gastro.2018.08.065
Laurent, C., Valet, F., Planque, N., Silveri, L., Maacha, S., Anezo, O., et al. (2011). High PTP4A3 phosphatase expression correlates with metastatic risk in uveal melanoma patients. Cancer Res. 71 (3), 666–674. doi:10.1158/0008-5472.CAN-10-0605
Lin, K. T., Lu, R. M., and Tarn, W. Y. (2004). The WW domain-containing proteins interact with the early spliceosome and participate in pre-mRNA splicing in vivo. Mol. Cell. Biol. 24 (20), 9176–9185. doi:10.1128/MCB.24.20.9176-9185.2004
Lurje, I., Czigany, Z., Bednarsch, J., Roderburg, C., Isfort, P., Neumann, U. P., et al. (2019). Treatment strategies for hepatocellular carcinoma ⁻ a multidisciplinary approach. Int. J. Mol. Sci. 20 (6), E1465. doi:10.3390/ijms20061465
Makarov, E. M., Makarova, O. V., Urlaub, H., Gentzel, M., Will, C. L., Wilm, M., et al. (2002). Small nuclear ribonucleoprotein remodeling during catalytic activation of the spliceosome. Science 298 (5601), 2205–2208. doi:10.1126/science.1077783
Menyhart, O., Nagy, A., and Gyorffy, B. (2018). Determining consistent prognostic biomarkers of overall survival and vascular invasion in hepatocellular carcinoma. R. Soc. Open Sci. 5 (12), 181006. doi:10.1098/rsos.181006
Montes, M., Cloutier, A., Sanchez-Hernandez, N., Michelle, L., Lemieux, B., Blanchette, M., et al. (2012). TCERG1 regulates alternative splicing of the Bcl-x gene by modulating the rate of RNA polymerase II transcription. Mol. Cell. Biol. 32 (4), 751–762. doi:10.1128/MCB.06255-11
Montes, M., Coiras, M., Becerra, S., Moreno-Castro, C., Mateos, E., Majuelos, J., et al. (2015). Functional consequences for apoptosis by transcription elongation regulator 1 (TCERG1)-Mediated bcl-x and fas/CD95 alternative splicing. PLoS One 10 (10), e0139812. doi:10.1371/journal.pone.0139812
Neubauer, G., King, A., Rappsilber, J., Calvio, C., Watson, M., Ajuh, P., et al. (1998). Mass spectrometry and EST-database searching allows characterization of the multi-protein spliceosome complex. Nat. Genet. 20 (1), 46–50. doi:10.1038/1700
Quaresma, M., Coleman, M. P., and Rachet, B. (2015). 40-year trends in an index of survival for all cancers combined and survival adjusted for age and sex for each cancer in england and wales, 1971-2011: A population-based study. Lancet (London, Engl. 385 (9974), 1206–1218. doi:10.1016/S0140-6736(14)61396-9
Ru, B., Wong, C. N., Tong, Y., Zhong, J. Y., Zhong, S. S. W., Wu, W. C., et al. (2019). Tisidb: An integrated repository portal for tumor-immune system interactions. Bioinformatics 35 (20), 4200–4202. doi:10.1093/bioinformatics/btz210
Sanchez-Alvarez, M., Goldstrohm, A. C., Garcia-Blanco, M. A., and Sune, C. (2006). Human transcription elongation factor CA150 localizes to splicing factor-rich nuclear speckles and assembles transcription and splicing components into complexes through its amino and carboxyl regions. Mol. Cell. Biol. 26 (13), 4998–5014. doi:10.1128/MCB.01991-05
Smith, M. J., Kulkarni, S., and Pawson, T. (2004). FF domains of CA150 bind transcription and splicing factors through multiple weak interactions. Mol. Cell. Biol. 24 (21), 9274–9285. doi:10.1128/MCB.24.21.9274-9285.2004
Sune, C., Hayashi, T., Liu, Y., Lane, W. S., Young, R. A., and Garcia-Blanco, M. A. (1997). CA150, a nuclear protein associated with the RNA polymerase II holoenzyme, is involved in Tat-activated human immunodeficiency virus type 1 transcription. Mol. Cell. Biol. 17 (10), 6029–6039. doi:10.1128/mcb.17.10.6029
Tan, S., Zhang, M., Shi, X., Ding, K., Zhao, Q., Guo, Q., et al. (2021). CPSF6 links alternative polyadenylation to metabolism adaption in hepatocellular carcinoma progression. J. Exp. Clin. Cancer Res. 40 (1), 85. doi:10.1186/s13046-021-01884-z
Tang, Z., Li, C., Kang, B., Gao, G., and Zhang, Z. (2017). Gepia: A web server for cancer and normal gene expression profiling and interactive analyses. Nucleic Acids Res. 45 (W1), W98–W102. doi:10.1093/nar/gkx247
Thorsson, V., Gibbs, D. L., Brown, S. D., Wolf, D., Bortone, D. S., Ou Yang, T. H., et al. (2018). The immune landscape of cancer. Immunity 48 (4), 812–830. doi:10.1016/j.immuni.2018.03.023
Wang, J., Zhang, S. M., Wu, J. M., Lu, Z. C., Yang, J. R., Wu, H. S., et al. (2016). Mastermind-like transcriptional coactivator 1 overexpression predicts poor prognosis in human with hepatocellular carcinoma. Ann. Clin. Lab. Sci. 46 (5), 502–507.
Wang, K. C., Cheng, A. L., Chuang, S. E., Hsu, H. C., and Su, I. J. (2000). Retinoic acid-induced apoptotic pathway in T-cell lymphoma: Identification of four groups of genes with differential biological functions. Exp. Hematol. 28 (12), 1441–1450. doi:10.1016/s0301-472x(00)00546-4
Wang, W., and Wei, C. (2020). Advances in the early diagnosis of hepatocellular carcinoma. Genes Dis. 7 (3), 308–319. doi:10.1016/j.gendis.2020.01.014
Zhao, Y., Xue, C., Xie, Z., Ouyang, X., and Li, L. (2020). Comprehensive analysis of ubiquitin-specific protease 1 reveals its importance in hepatocellular carcinoma. Cell Prolif. 53 (10), e12908. doi:10.1111/cpr.12908
Keywords: biomarker, gene set enrichment analysis, hepatocellular carcinoma, TCERG1, prognosis
Citation: Yang P, Liu H, Li Y, Gao Q, Chen X, Chang J, Li Y, Chen S, Dong R, Wu H, Liu C and Liu G (2022) Overexpression of TCERG1 as a prognostic marker in hepatocellular carcinoma: A TCGA data-based analysis. Front. Genet. 13:959832. doi: 10.3389/fgene.2022.959832
Received: 02 June 2022; Accepted: 21 September 2022;
Published: 10 October 2022.
Edited by:
Nejat Dalay, Istanbul University, TurkeyReviewed by:
Wentao Wang, Sichuan University, ChinaLibo Wang, First Affiliated Hospital of Zhengzhou University, China
Copyright © 2022 Yang, Liu, Li, Gao, Chen, Chang, Li, Chen, Dong, Wu, Liu and Liu. This is an open-access article distributed under the terms of the Creative Commons Attribution License (CC BY). The use, distribution or reproduction in other forums is permitted, provided the original author(s) and the copyright owner(s) are credited and that the original publication in this journal is cited, in accordance with accepted academic practice. No use, distribution or reproduction is permitted which does not comply with these terms.
*Correspondence: Gaofeng Liu, bGdmbXlAYmJtYy5lZHUuY24=; Changqing Liu, bGNxNzgxM0BiYm1jLmVkdS5jbg==; Huazhang Wu, MzQ2MTgwMjYyQHFxLmNvbQ==
†These authors have contributed equally to this work
 Pan Yang
 Huaifeng Liu
 Yan Li
 Qunwei Gao1
 Shuran Chen
 Rui Dong
 Changqing Liu
 Gaofeng Liu