 C. A. Ryan
 D. P. Berry
 A. O’Brien1
 T. Pabiou
 D. C. Purfield
- 1Teagasc, Co. Cork, Ireland
- 2Munster Technological University, Cork, Ireland
- 3Irish Cattle Breeding Federation, Cork, Ireland
Introduction: The ability to accurately predict breed composition using genomic information has many potential uses including increasing the accuracy of genetic evaluations, optimising mating plans and as a parameter for genotype quality control. The objective of the present study was to use a database of genotyped purebred and crossbred cattle to compare breed composition predictions using a freely available software, Admixture, with those from a single nucleotide polymorphism Best Linear Unbiased Prediction (SNP-BLUP) approach; a supplementary objective was to determine the accuracy and general robustness of low-density genotype panels for predicting breed composition.
Methods: All animals had genotype information on 49,213 autosomal single nucleotide polymorphism (SNPs). Thirteen breeds were included in the analysis and 500 purebred animals per breed were used to establish the breed training populations. Accuracy of breed composition prediction was determined using a separate validation population of 3,146 verified purebred and 4,330 two and three-way crossbred cattle.
Results: When all 49,213 autosomal SNPs were used for breed prediction, a minimal absolute mean difference of 0.04 between Admixture vs. SNP-BLUP breed predictions was evident. For crossbreds, the average absolute difference in breed prediction estimates generated using SNP-BLUP and Admixture was 0.068 with a root mean square error of 0.08. Breed predictions from low-density SNP panels were generated using both SNP-BLUP and Admixture and compared to breed prediction estimates using all 49,213 SNPs (representing the gold standard). Breed composition estimates of crossbreds required more SNPs than predicting the breed composition of purebreds. SNP-BLUP required ≥3,000 SNPs to predict crossbred breed composition, but only 2,000 SNPs were required to predict purebred breed status. The absolute mean (standard deviation) difference across all panels <2,000 SNPs was 0.091 (0.054) and 0.315 (0.316) when predicting the breed composition of all animals using Admixture and SNP-BLUP, respectively compared to the gold standard prediction.
Discussion: Nevertheless, a negligible absolute mean (standard deviation) difference of 0.009 (0.123) in breed prediction existed between SNP-BLUP and Admixture once ≥3,000 SNPs were considered, indicating that the prediction of breed composition could be readily integrated into SNP-BLUP pipelines used for genomic evaluations thereby avoiding the necessity for a stand-alone software.
Introduction
While genomic information in livestock breeding and management has predominately been used for parentage verification and discovery as well as genomic evaluations, it also has other potential applications such as the prediction of breed composition (Kuehn et al., 2011; Mcclure et al., 2017). In the absence of genomic information, the breed proportion of an animal is assumed to be simply the average breed composition of both parents (Sölkner et al., 2010). However, breed composition of the offspring from a crossbred parent may deviate from expectation owing to parental recombination of chromosomes during gametogenesis. Genomic information should be more precise in predicting the breed composition of animals due to its capacity to determine the parental contribution (Strucken et al., 2017; Kumar et al., 2021) and therefore can help correct pedigree errors and estimate kinships when ancestry data are missing.
The ability to accurately predict the breed composition of an animal using genomic information has many potential uses. Firstly, genomic information can be used to verify that an animal is a purebred, thus preserving the integrity of the herd book. This may be of particular benefit for rare breeds where limited purebred breeding individuals exist or where no pedigree information is recorded and, therefore, it can help correct pedigree errors and estimate kinships when ancestry data are missing. Secondly, prediction of breed composition could assist in delivering consumer confidence in the authenticity of products from certain breeds which may command a higher market price (Judge et al., 2017; O’Brien et al., 2020). Furthermore, where service providers genotype animals from multiple breeds, comparing breed composition estimates from genotype data against the expected breed composition for a given genotyping plate could curtail pedigree errors and act as a quality control measure by identifying mislabelled genotypes prior to their inclusion in downstream analyses (Kumar et al., 2021). While sex is a routine quality control step in the genotyping process, using breed composition prediction as an additional quality control measure may be particularly useful if a plate of exclusively male or female genotypes is mis-oriented. Additionally, the accurate determination of an animal’s breed composition may improve the robustness of genetic evaluations where breed composition is frequently employed as an adjustment factor (Thomasen et al., 2013; McHugh et al., 2017), to correct for the differences in allele frequency and the relationship between SNPs and quantitative trait loci across breeds. Indeed, due to the mosaic nature of a crossbred animal’s genome, Sevillano et al. (2017) confirmed that accounting for breed-specific SNP effects in admixed genomic evaluations outperformed genomic prediction models where the SNP effects were assumed to be the same across breeds. This suggests that the accurate determination of breed composition can enhance genomic predictions.
The SNP-BLUP method routinely used in genomic evaluations can also be used to predict breed composition, as proposed in sheep by O’Brien et al. (2020). By in large, the SNP-BLUP approach uses an infinitesimal model which assumes that the trait of interest is controlled by large number of SNPs, each of very small effect, fitted as random effects with a common variance structure. As SNP-BLUP is often used in genomic evaluations, the ability to exploit existing pipelines for predicting breed composition could be advantageous for quality control and be more computationally efficient than using a stand-alone software for breed prediction. Therefore, the objective of the present study was to use a large database of genotyped purebred and crossbred cattle to compare breed composition predictions using a freely available software, Admixture (Alexander et al., 2009), with those from SNP-BLUP. While statistical metrics and methods such as Fst and PCA have been used to select informative SNPs to discriminate between cattle breeds (Wilkinson et al., 2011; Hulsegge et al., 2013), we wanted to determine the effectiveness of these methods in particular for identifying informative SNPs for predicting crossbred breed composition. Moreover, we aimed to compare the performance of these methods against other SNP selection approaches, including machine learning algorithms. Therefore, an additional objective was to determine the accuracy and general robustness of low-density genotype panels for predicting breed composition which was achieved by varying 1) the SNP density, and 2) the SNP selection strategy for alternative custom-derived low-density panels.
Materials and methods
Genotypic data
A total of 52,655 SNP were available from 703,078 dairy and beef cattle generated using a custom Illumina beadchip (IDBV3) which was developed to primarily increase the accuracy of genomic predictions whilest generating genotype information for mutations of interest (Mullen et al., 2013). All animals had a call rate ≥90%. Only autosomal SNPs, SNPs with a known chromosome and position on the ARS UCD 1.2 genome build, and those with a call rate
Establishment of purebred populations
Expected breed composition was available on all animals based on their recorded ancestry; 98,883 genotyped animals from 13 breeds were expected (based on ancestry) to be purebred. Breeds included were Angus, Aubrac, Blonde d'Aquitaine, Belgian Blue, Charolais, Friesian, Hereford, Holstein, Limousin, Parthenaise, Saler, Shorthorn, and Simmental. Using the available genotypes, a principal component analysis (PCA) based on a genomic relationship matrix was calculated using the approaches described by Yang et al. (2011) in the GCTA software package (Yang et al., 2011) to ensure animals were recorded correctly as being purebred. The 49,213 SNPs were pruned prior to PCA analysis by excluding one SNP from a pair of SNPs in strong linkage disequilibrium (pairwise squared correlation
Admixture V1.3 (Alexander et al., 2009) was also used to verify each animal’s breed composition using the 22,606 pruned SNPs dataset as suggested by Alexander et al. (2009). The pruned dataset was used solely to verify purebred status but the full SNP dataset was used for breed prediction analyses and SNP selection. An unsupervised analysis was initially performed to determine the most appropriate number of breed clusters (K) from 11 to 14. K = 13 was the chosen number of breed clusters as it had the lowest cross-validation error; each of the 13 breeds separated into a distinct cluster. Individuals with a subsequent ancestry assignment of

TABLE 1. Number of animals per breed within the purebred training, validation and SNP selection populations.
Purebred training population
Within breed identity-by-state (IBS) clustering was performed on all purebred animals in Plink V1.9 (Purcell et al., 2007), which investigates whether animals share zero, one, or two alleles at each locus across the genome. IBS clustering was used to identify the most genomically diverse animals within each breed to represent the training population. Within each breed, 500 clusters were created, and animals that had similar genomes were grouped together. One animal was randomly chosen from each cluster to represent the purebred training population for breed assignment. The purebred training population was established to calibrate models for predicting breed composition.
Purebred and admixed validation populations
To validate whether breed composition could be predicted using SNP data, a population of purebred and crossbred animals which had no direct relationship (i.e., parent-offspring and vice-versa) to the purebred training population was generated. Where possible, 250 purebred-verified animals from each of the 13 breeds were included in the validation population.
In order to identify a known admixed population for validating SNP-BLUP and Admixture breed composition predictions, a supervised Admixture analysis (K = 13) was completed on all genotyped animals. The 500 purebred animals within each of the 13 breeds from the training population were fixed as purebred in a supervised Admixture analysis and the breed composition of all remaining admixed animals was predicted. Animals compromised of, at most 4 breeds were subsequently selected where each of the breeds represented had to belong to one of the 13 purebred populations included in the present study. In the two-way crosses, animals which had an Admixture breed composition prediction between 45%–55%:45%–55%, 20%–30%:70%–80% or 70%–80%:20%–30% were retained as a two-way validation population, consisting of 2,281 animals. Animals with an admixed breed composition comprised of
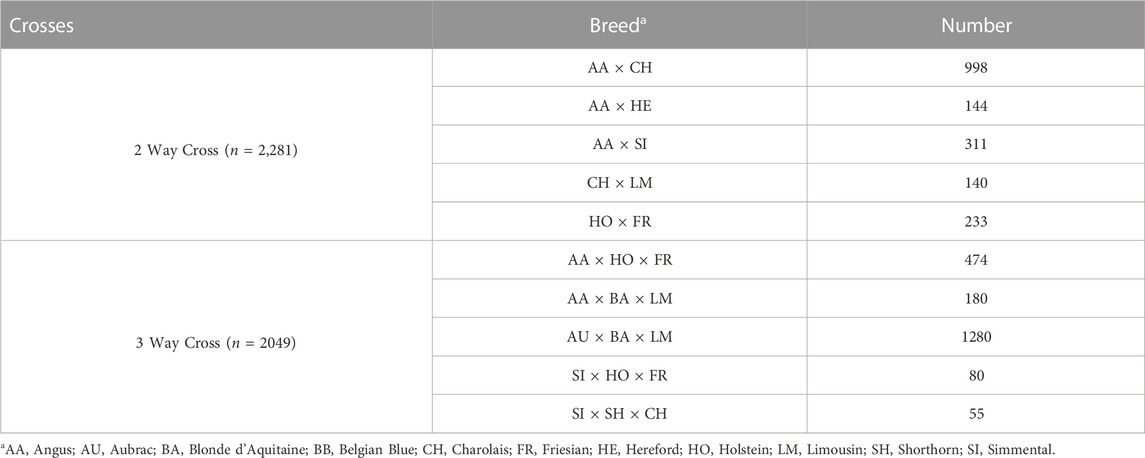
TABLE 2. Number of animals in the crossbred validation population.
Purebred SNP selection population
An additional purebred SNP selection population was established in order to quantify the information content of individual SNPs in predicting breed composition; this was necessary to rank the SNPs for the development of low-density panels. This SNP selection population consisted of 1,000 purebred animals per breed where possible that were not included in the purebred training or validation populations. The number of animals per breed included in the SNP selection population was capped at 1,000 where possible in order to keep a relatively similar number of animal per breed. This SNP selection population consisted of 9,955 purebred animals (Table 1).
Divergence among breeds
The pairwise
where
Breed composition estimated using single nucleotide polymorphisms best linear unbiased prediction
SNP-BLUP using MIX99 software (Mix99 Development Team, 2017) was used to estimate the breed composition of animals in the validation population, with the results compared to breed composition estimates from Admixture (Alexander et al., 2009). The SNP-BLUP approach followed the pipeline described by O’Brien et al. (2020) for predicting breed composition in sheep using SNP genotypes. All SNPs were fitted as random effects which were assumed to be identically and independently distributed with mean zero and common variance structure N (0,I
where the dependant variable
All subsequent breed predictions <0.05 were set to 0. The sum of all predicted breed compositions for each animal were rescaled as per O’Brien et al. (2020), where each animal’s breed proportion estimated for the breed under investigation was divided by the sum of that animal’s breed proportions estimated for all 13 breeds. Purebreds in the validation population were considered assigned if the prediction of breed composition was
Breed composition estimated using Admixture
Using the same training and validation populations and all 49,213 SNPs, a supervised analysis (K = 13) was conducted in Admixture (Alexander et al., 2009). In the Admixture analysis, the same purebreds that were used in the SNP-BLUP analysis were set as purebreds for that breed, and the breed composition of the animals in the validation population was estimated. All breed proportion estimates
Development of low-density genotype panels
Seven alternative low-density panels (i.e., 100, 500, 1,000, 2,000, 3,000, 5,000 and 7,500 SNPs) were generated using seven different SNP selection strategies. The SNP selection population (Table 1) was used to rank SNPs based on potential informativeness for the generation of these low-density panels. The number of SNP chosen per chromosome remained constant for each of the seven SNP selection methods evaluated and was proportional to the genome length of each chromosome (Supplementary Table S1). The seven alternative methods used to generate the panels were as follows.
Random selection
The number of predefined SNP required per chromosome was randomly selected until each of the respective panel densities was obtained.
Partitioning-around-medoids (PAM)
The partitioning-around-medoids (PAM) algorithm clusters SNPs on each chromosome together based on their proximity in genomic position, not taking LD into account. The algorithm was run for each chromosome separately with the number of clusters created per chromosome set to the number of predefined SNPs for that chromosome. The SNP located in the middle of each cluster was selected, as described by Lashmar et al. (2021) when developing low-density panels to assess imputation accuracy in cattle. The PAM algorithm was implemented in the R package “cluster” (V2.1.2 Maechler et al., 2021).
Fixation index (
The fixation index (
a)
b)
c) Highest ranking SNPs based on
PCA
SNP weightings were calculated using the “smartpca” algorithm in Eigensoft v7.2.1 (Patterson et al., 2006) applied to the SNP selection population. The greater the difference in allele frequency between populations, the greater the SNP weighting. Three alternative methods of picking SNPs based on PCA ranking were investigated similar to the
a) PCA ranking and block method: The SNP with the highest SNP weighting within each block was chosen.
b) PCA ranking and PAM method: The SNP with the highest SNP weighting within each PAM cluster was selected.
c) Highest ranking SNPs based on PCA: SNPs in the nth highest ranking based on PCA SNP weightings were chosen per chromosome, irrespective of location on the chromosome, where n was the number of predefined number of SNPs for that chromosome.
SNP-BLUP variance
SNP-BLUP was used to estimate the SNP effects within the SNP selection population of each breed individually using all 49,213 SNPs. From this, the standard deviation (SD) of the BLUP model solutions per SNP were estimated within the SNP selection population of all 13 breeds and SNPs were ranked based on the SD of the SNP effect across all 13 breeds; SNPs with a larger standard deviation were given a higher ranking. Three alternative methods of picking SNPs based on using the SNP-BLUP SD were investigated.
a) SNP-BLUP variance and block method: The SNP with the largest standard deviation of SNP effects within each block was chosen.
b) SNP-BLUP variance and PAM method: The SNP with the largest standard deviation of SNP effects within each PAM cluster was selected.
d) Highest ranking SNPs based on SNP-BLUP variance: SNPs in the nth highest ranking based on the standard deviation of SNP effects were chosen per chromosome, irrespective of location on the chromosome, where n was the number of predefined number of SNPs for that chromosome.
Random Forest
Random Forest is a machine-learning method (Breiman, 2001) that employs decision trees, which are a set of rules for splitting data in a way that minimises variation. The Random Forest analysis was conducted in the R package random forest (Liaw and Wiener, 2001) using the genotypes of the SNP selection population to predict the dependant variable, which was breed, and was numbered 1 to 13. The built-in variable importance measures (VIM) ranked the SNPs according to their relevance for predicting breed. The highest ranking SNPs of a predefined number per chromosome were retained.
PLSDA
Partial least square discriminant analysis (PLSDA) is another machine learning method based on the PLS approach (Barker and Rayens, 2003). In the present study, a PLSDA regression model was constructed using the purebred SNP selection population and their corresponding genotypes in the R package Caret (Kuhn, 2020) for discriminative SNP selection. The dependant variable was breed, and was coded numerically as +1 or −1. If an animal was a member of the breed class under analysis, that animal was coded as +1, which is referred to as the ‘in-group’ and it it was a different breed group it was coded as −1, representing the ‘out-group’ (Brereton and Lloyd, 2014). The regression model was run 13 times, once for each breed. Each SNP received a weighting, and SNPs which were the most informative for distinguishing between breed classes ranked highest. The highest ranking SNPs of a predefined number per chromosome were retained.
Evaluating the difference in breed composition predictions using the low-density panels
Breed composition predictions from SNP-BLUP using all 49,213 SNPs were considered the gold standard and used for comparing the prediction performance from each of the low-density panels. Animals in the purebred validation population were considered to be accurately assigned when their estimated breed proportion of a specific breed was predicted to be ≥0.90. The difference in the main breed proportion estimates for crossbred animals predicted using all the low-density panels and the gold standard 49,213 SNPs were compared. In addition, the three SNP selection methods with the smallest mean difference in breed composition predictions from the gold standard, were also used for breed composition prediction using Admixture (Alexander et al., 2009). The Admixture breed predictions using the low-density panels where then compared to those from the gold standard SNP-BLUP.
Results
Population structure
The greatest genetic differentiation was observed between the Salers and both the Simmental and Shorthorns (
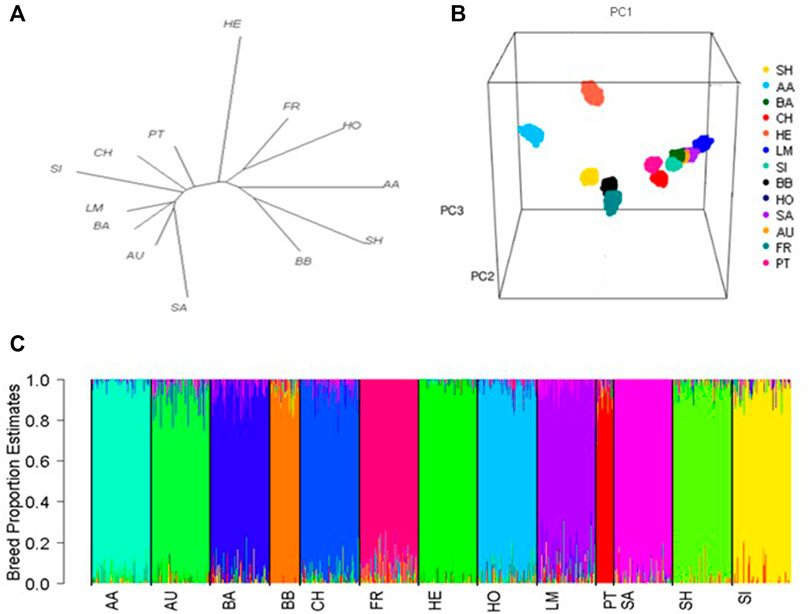
FIGURE 1. (A) Phylogenetic tree showing the genetic distance between breeds based on pairwise fixation index (
Breed composition prediction
The mean difference in predicted breed composition between SNP-BLUP and Admixture using all 49,213 SNPs was 0.04 across both purebred and crossbreds, which was not different (p > 0.05) from zero, suggesting that there is no systematic difference between the methods that would lead to over or underestimation of breed composition. Both SNP-BLUP and Admixture accurately assigned
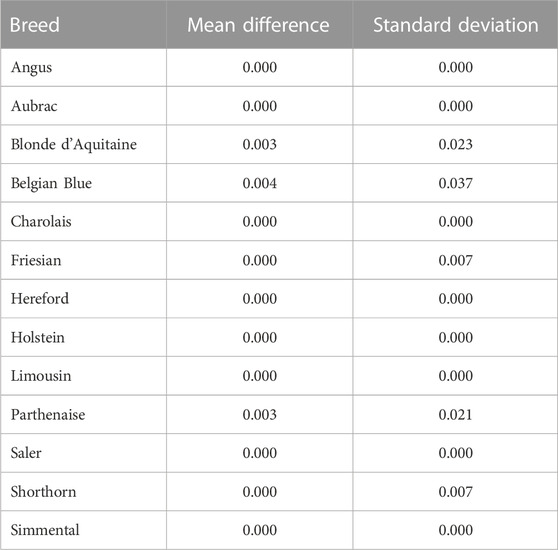
TABLE 3. Mean absolute difference and standard deviation of the difference of the absolute values between the SNP-BLUP and Admixture breed predictions for the purebred validation population in each breed.
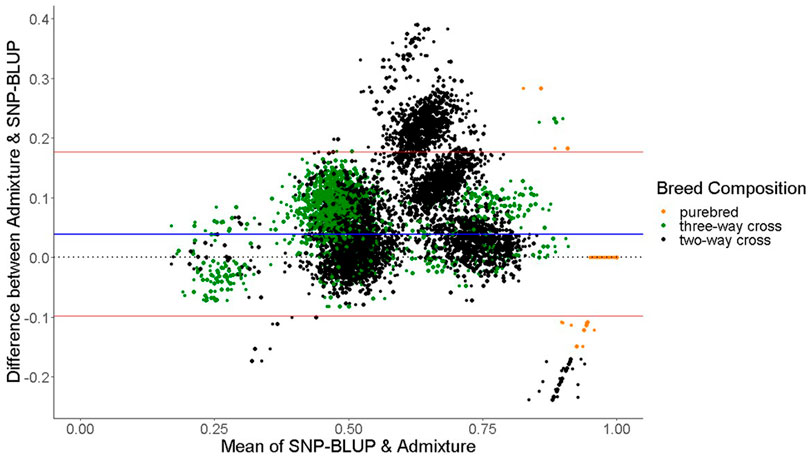
FIGURE 2. Bland-Altman plot displaying the differences (y-axis) against the mean of the values (x-axis) of SNP-BLUP and Admixture breed proportions for two-way cross, three-way cross, and purebred animals. The horizontal red lines represent the mean
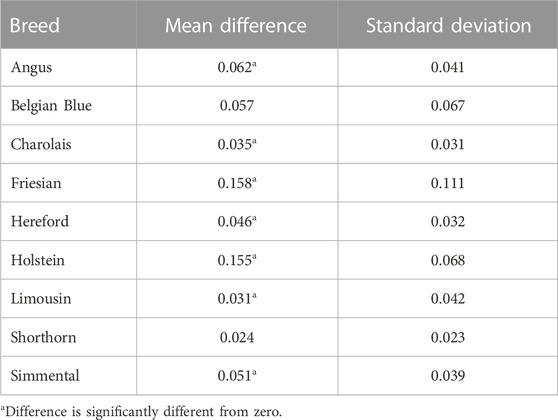
TABLE 4. Mean absolute difference and standard deviation of the difference of the absolute values between the SNP-BLUP and Admixture breed predictions for the crossbred validation population.
Low-density panel predictions of breed composition with SNP-BLUP
Purebred predictions
In general, the number of correctly assigned purebreds increased with increasing panel density across all SNP selection strategies (Figure 3). All SNP selection strategies correctly assigned >85% of the purebred validation population when the SNP density was ≥2,000 SNPs, with the exception of the PLSDA and Random selection method, which both required a minimum of 3,000 SNPs to correctly assign >85% of the purebred validation population to their respective breeds (Figure 3).
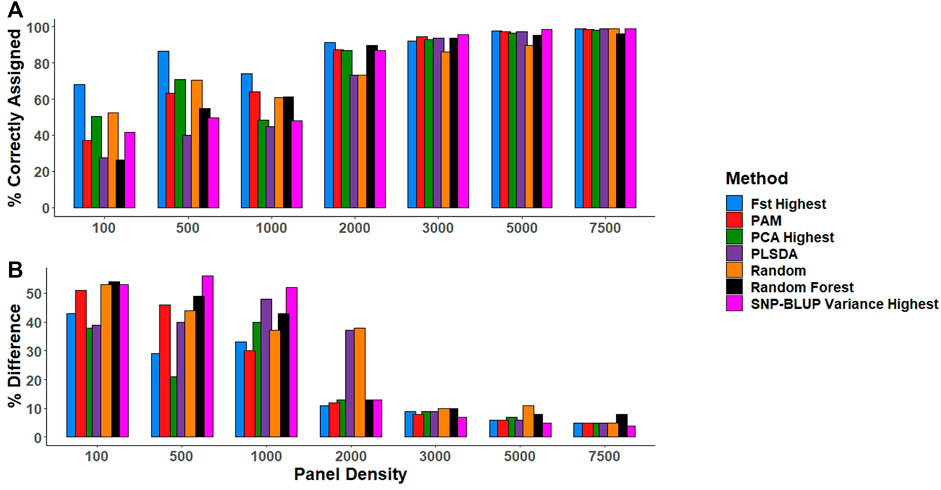
FIGURE 3. (A) The percentage of animals in the purebred validation population correctly assigned to the respective breed (i.e., predicted to have a breed proportion >0.9 for their respective breed). (B) The percentage difference between the gold standard (estimates using all 49,213 SNPs) and low-density breed proportion estimates for crossbreds. SNP selection methods for the creation of low-density panels included pairwise fixation index highest (Fst highest), partitioning-around-medoids (PAM), principal component analysis highest (PCA highest), partial least square discriminant analysis (PLSDA), random SNP selection (Random), Random Forest, and SNP-BLUP variance highest.
Crossbred predictions
Similarly, as panel density increased the mean difference between the gold standard breed composition estimates and breed prediction estimates using the low-density panels reduced for crossbreds (Figure 3). The estimation of crossbred breed composition was more challenging than that of purebreds, requiring a minimum of 3,000 SNPs for accurate crossbred breed composition predictions across the different SNP selection strategies, regardless of whether they were two or three-way crosses (Figure 3). When panel density was
Comparison of SNP selection strategies
There was little overlap in the actual SNPs selected by each SNP selection strategy (Supplementary Figure S2). There was a minimal difference in performance between the SNPs selected using the various SNP selection methods for predicting breed composition at panel densities
Comparison with Admixture predictions
When 49,213 SNPs were used, there was no systematic difference between the breed composition predictions by SNP-BLUP versus Admixture. SNPs selected using the three most accurate SNP selection methods (i.e.,
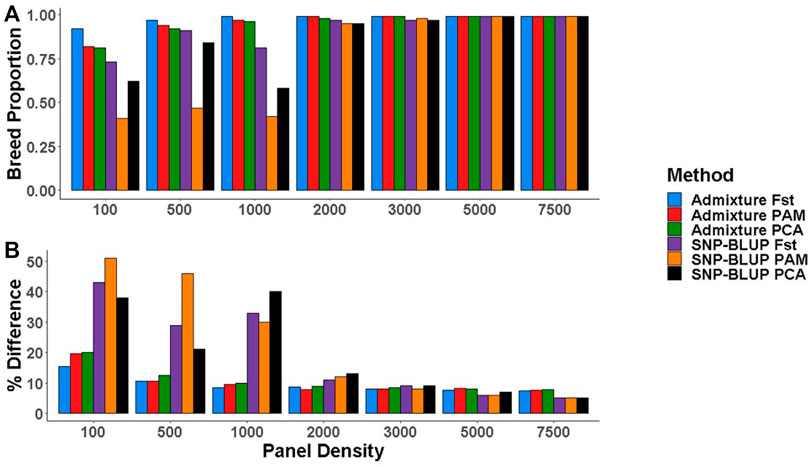
FIGURE 4. (A) Purebred breed proportion estimates from Admixture and SNP-BLUP using low-density panels, (B) The percentage difference between the gold standard (estimates using all 49,213 SNPs) and low-density breed proportion estimates from Admixture and SNP-BLUP. SNP selection methods for the creation of low-density panels included pairwise fixation index highest (Fst), partitioning-around-medoids (PAM), and principal component analysis highest (PCA).
Discussion
The objective of the present study was to compare SNP-BLUP and Admixture as methods to predict the breed composition of purebred and crossbred cattle; of particular interest also was to investigate if the accuracy of predicting breed composition was eroded as SNP density reduced, and also if the approach to select these SNP impacted the conclusion. Marginal differences existed between both breed prediction methods once genotypes from >2,000 informative SNPs were available on all animals. Moreover, once animals were genotyped for >3,000 SNPs (which is generally the norm in cattle), how these SNPs were selected did not impact greatly the predictions.
SNP-BLUP vs. Admixture
The only discrepancies observed between SNP-BLUP and Admixture breed composition predictions for purebreds using the full SNP dataset was for Blonde d'Aquitaine, Belgian Blue, and Parthenaise. Some animals in these breeds were misassigned to another closely related breed; this phenomenon may be due to the relatively smaller sample sizes of these breeds in the validation population (i.e., sampling variability) as well as their close genetic resemblance to other breeds. The largest discrepancy in prediction of breed composition detected between Admixture and SNP-BLUP predictions for crossbred animals was for the two-way Holstein-Friesian crosses (Figure 2); because these two breeds are genetically similar, differentiating which portion of the genome is attributed to Holstein and which attributed to Friesian was challenging. Because the Holstein and Friesian compositions in a three-way cross animal represented a smaller proportion of the animal’s overall breed composition, lesser differences between Admixture and SNP-BLUP predictions were evident in three-way crosses with a Holstein-Friesian component than in two-way crosses comprised of exclusively Holstein and Friesian. It should also be noted that only animals with a breed composition made up of at most four breeds were included in the crossbred validation population. The rationale behind this was that animals with more than four breeds in their genome might have experienced degraded breed haplotypes inherited from their ancestors over time, which would likely make predicting their breed composition particularly challenging.
In order to assess how mislabeled individuals in the training population affect breed composition predictions using SNP-BLUP and Admixture, 250 purebred Angus animals were substituted with 250 two-way cross Angus animals in the training population; they were all labelled as purebred Angus. All 250 purebred Angus animals in the validation population were predicted by Admixture to be ≥0.90 Angus. In contrast, when predictions were based on SNP-BLUP, only six of the 250 purebred Angus animals in the validation population were predicted to be ≥0.60 Angus. Therefore, SNP-BLUP appears to be more sensitive to mislabeled individuals in the training population, while Admixture was able to accurately estimate breed composition even with 250 (i.e., half the population) mislabeled individuals present.
Low-density panels
SNP-BLUP required a minimum of 2,000 and 3,000 SNPs to accurately predict purebred and crossbred breed composition, respectively; the respective values for Admixture was 500 and 1,000 SNPs, corroborating results of Bjørnstad and Røed (2002) who concluded that assigning crossbred (horses) to the correct breed using the frequency method outlined by Paetkau et al. (1995) is more challenging than that of purebreds. It should be noted that in the present study, a separate population was used to select SNPs for the creation of the low density panels so as to minimise SNP selection bias. Strucken et al. (2017) emphasised the importance of utilising a separate population for the selection of SNPs for predicting breed composition, reporting that when the prediction equations were not generated from a population independent of the test dataset, it resulted in a substantial increase in ascertainment bias.
Many factors impact the number of SNPs required for the accurate prediction of breed composition. These factors include, but are not limited to, the breeds included in the study (Lewis et al., 2011; Hulsegge et al., 2013), given that breeds which are closely related are likely to have similar allele frequencies and therefore be more difficult to differentiate than breeds which are not genetically similar (Wilkinson et al., 2011; Kavakiotis et al., 2015). In addition, the effective population size of the population also contributes to the number of SNPs needed to accurately determine breed composition as populations with larger effective population sizes are genetically more diverse. The effective population of the breeds in the present study were previously estimated by McParland et al. (2007) to range between 64 and 127 per breed. Similar estimates in cattle have been reported elsewhere (Stachowicz et al., 2011; Rodríguez-Ramilo et al., 2015; Doekes et al., 2018) and are a reflection of the intense selection and genetic drift breeds have been subjected to. SNP selection methods therefore that choose the most informative SNPs for breed prediction require fewer SNPs for accurate breed composition predictions than using less or non-informative SNPs (Ding et al., 2011; Chhotaray et al., 2019) such as using the random SNP selection method, as demonstrated in the present study. The number of SNPs necessary for accurate breed composition predictions also depends on whether Admixture or a regression model such as SNP-BLUP is used for predictions, with Admixture requiring fewer SNPs than regression models (Strucken et al., 2017; He et al., 2018; Reverter et al., 2020).
SNP selection methods for low-density panels
The success of the Fst SNP selection method for identifying informative SNPs which can be used for the prediction of breed composition in cattle has been extensively reported previously (Lewis et al., 2011; Wilkinson et al., 2011; Hulsegge et al., 2013; Bertolini et al., 2015), as has the PCA SNP selection method (Paschou et al., 2007; Lewis et al., 2011; Bertolini et al., 2015; Chhotaray et al., 2019). Unlike some previous studies (Ding et al., 2011; Hulsegge et al., 2013; Strucken et al., 2017), a linkage disequilibrium (LD) threshold or minimum distance between selected SNPs was not implemented when creating low-density panels in this study as no prior assumptions were made about which SNPs may or may not be informative for breed prediction. As a result, the Fst and PCA highest methods both chose SNPs located in close proximity and consequently in strong LD on each autosome, particularly when panel density was
Although machine learning algorithms have been widely applied to cattle breeding for the prediction of a wide variety of traits such as lameness (Warner et al., 2020), longevity (Van Der Heide et al., 2019) and milk composition (Gianola et al., 2011; Frizzarin et al., 2021), these algorithms have not been utilized extensively in predicting breed composition in cattle. Prior research has reported that machine learning does not predict certain traits in cattle and sheep as effectively as other traditional methods such as regression models (Cortez et al., 2006; Van Hertem et al., 2014; Hempstalk et al., 2015), corroborating the findings of the present study. Previous literature has reported that the majority of PLSDA models suffer from overfitting (Westerhuis et al., 2008) and inconsistent performance (Szymańska et al., 2012). While Bertolini et al. (2015) successfully used Random Forest in conjunction with PCA for SNP selection and breed assignment in cattle, the accuracy of this method was based on the percentage of animals assigned to the correct breed, whereas accuracy in the present study was based on the more difficult task of assigning breed proportions and predicting the overall breed composition of individual cattle. Another key difference between the present study and that of Bertolini et al. (2015) is that the present study only used Random Forest for SNP selection and used SNP-BLUP and Admixture for breed proportion predictions, whereas Bertolini et al. (2015) used Random Forest to select informative SNPs, before fitting a new Random Forest algorithm to determine breed assignment.
The little overlap in SNPs selected across SNP selection approaches is likely due to the difference between the SNP selection methods used. Out of all SNP selection methods investigated, Random Forest was the only one that considered possible correlations among SNPs. Fst-based selection focused on the standardized variance in allele frequency among populations, while PCA-based selection focused on patterns in the data, identifying SNPs that had high loadings on the first three principal components, which captured the most significant patterns in the data. On the other hand, the PAM method only considered the genomic position of the SNP. Schiavo et al. (2020) also reported little overlap in SNPs selected when comparing SNPs selected using the Fst, PCA and Random Forest methods.
Training population
It should be noted that ensuring purebred animals are recorded correctly and a careful selection of the most genetically diverse animals within breed to be included in the training population is crucial. As suggested by others (Bjørnstad and Røed, 2002; Dalvit et al., 2008), when predicting breeds, some animals may never be correctly assigned regardless of the number of SNPs used because the breeds are too genetically similar or because the individuals are genetically atypical for their breeds. To avoid the latter from happening, and ensure maximum prediction accuracy, the training population in the present study consisted of very large numbers of animals in comparison to previous similar studies (Lewis et al., 2011; Wilkinson et al., 2011), increasing the within-breed variability. Bertolini et al. (2015) advocated that the more animals included in the training population the greater the within breed variability captured, possibly resulting in an enhanced performance for breed prediction. While previous studies randomly selected purebreds to represent their training population, Hulsegge et al. (2013) noted that for the optimum prediction of breed composition, when selecting the training population, it is crucial to choose the most genetically diverse animals within each breed. Bearing this in mind, a novel approach was implemented in the present study, utilising IBS clustering to aid with selecting the most genetically dissimilar animals to represent the training population for each breed. IBS clustering compares two individuals which share 0, 1 or 2 alleles at a given locus throughout the genome (Stevens et al., 2011), grouping genetically similar animals together. Randomly selecting one animal from each genetically different IBS cluster to represent the training population ensured that the training population captured the majority of the variation of genotypes in each breed.
Applications
The present study demonstrated that genomic information can be utilised in generating accurate predictions of breed composition which could potentially be useful for increasing the accuracy of genetic evaluations by being better able to fit breed covariates in an admixed population. Sevillano et al. (2017) confirmed the superior performance of genomic evaluation models that account for breed-specific SNP effects in admixed populations compared to those assuming uniform SNP effects across breeds. This suggests that the accurate determination of breed composition can enhance genomic predictions. Furthermore, accurate breed composition information could also potentially be utilised in quality control of genotypes entering the database and to further augment various breeding strategies for improvement of cattle breeds.
Conclusion
There was a strong similarity in predicted breed composition per animal between the SNP-BLUP and Admixture approaches investigated when panel density was ≥3,000 SNPs. This suggests that the prediction of breed composition could be readily integrated into the SNP-BLUP pipelines used for genomic evaluations thus replacing the use of a stand-alone software. Despite approximately 50,000 SNPs existing on most routinely-used genotyping panels, only small subsets of highly informative SNPs are required to accurately predict breed composition. This study provides a blueprint for the utilisation of the readily available next-generation sequencing technologies in the prediction of breed composition, by offering possible methods for how to identify the most informative SNPs and the optimum panel density. In general, SNPs selected using the Fst highest approach performed the best in terms of predicting purebred and crossbred breed composition, but only a marginal difference was observed between the performance of SNPs selected across all SNP selection methods when
Data availability statement
The data analyzed in this study is subject to the following licenses/restrictions: The genotypes used are owned by the Irish Breeding Cattle Federation (ICBF). Requests to access these datasets should be directed to https://www.icbf.com/.
Author contributions
CR, DB, AO’B, TP, and DP participated in the design of the study and were involved in the interpretation of the results. CR performed the analyses and wrote the first draft of the manuscript. All authors read and approved the final manuscript. All authors contributed to the article and approved the submitted version.
Funding
This publication has emanated from research supported in part by the Department of Agriculture, Food and the Marine (Dublin, Ireland) Research Stimulus Fund 2019R553 (Dairy4Beef) and by the European Commission in the frame of the Horizon 2020 INTAQT project (INnovative Tools for Assessment and Authentication of chicken meat, beef and dairy products’ QualiTies, Grant agreement ID: 101000250).
Conflict of interest
Author TP was employed by the company Irish Cattle Breeding Federation.
The remaining authors declare that the research was conducted in the absence of any commercial or financial relationships that could be construed as a potential conflict of interest.
Publisher’s note
All claims expressed in this article are solely those of the authors and do not necessarily represent those of their affiliated organizations, or those of the publisher, the editors and the reviewers. Any product that may be evaluated in this article, or claim that may be made by its manufacturer, is not guaranteed or endorsed by the publisher.
Supplementary material
The Supplementary Material for this article can be found online at: https://www.frontiersin.org/articles/10.3389/fgene.2023.1120312/full#supplementary-material
References
Alexander, D. H., Novembre, J., and Lange, K. (2009). Fast model-based estimation of ancestry in unrelated individuals. Genome Res. 19, 1655–1664. doi:10.1101/gr.094052.109
Barker, M., and Rayens, W. (2003). Partial least squares for discrimination. J. Chemom. 17, 166–173. doi:10.1002/cem.785
Bertolini, F., Galimberti, G., Calò, D. G., Schiavo, G., Matassino, D., and Fontanesi, L. (2015). Combined use of principal component analysis and random forests identify population-informative single nucleotide polymorphisms: Application in cattle breeds. J. Animal Breed. Genet. 132, 346–356. doi:10.1111/jbg.12155
Bjørnstad, G., and Røed, K. H. (2002). Evaluation of factors affecting individual assignment precision using microsatellite data from horse breeds and simulated breed crosses. Anim. Genet. 33, 264–270. doi:10.1046/j.1365-2052.2002.00868.x
Brereton, R. G., and Lloyd, G. R. (2014). Partial least squares discriminant analysis: Taking the magic away. J. Chemom. 28, 213–225. doi:10.1002/cem.2609
Chhotaray, S., Panigrahi, M., Pal, D., Ahmad, S., Bhushan, B., Gaur, G., et al. (2019). Ancestry informative markers derived from discriminant analysis of principal components provide important insights into the composition of crossbred cattle. Genomics 112, 1726–1733. doi:10.1016/j.ygeno.2019.10.008
Cortez, P., Portelinha, M., Rodrigues, S., Cadavez, V., and Teixeira, A. (2006). Lamb meat quality assessment by support vector machines. Neural Process. Lett. 24, 41–51. doi:10.1007/s11063-006-9009-6
Dalvit, C., De Marchi, M., Zotto, R., Gervaso, M., Meuwissen, T., and Cassandro, M. (2008). Breed assignment test in four Italian beef cattle breeds. Meat Sci. 80, 389–395. doi:10.1016/j.meatsci.2008.01.001
Ding, L., Wiener, H., Abebe, T., Altaye, M., Go, R. C., Kercsmar, C., et al. (2011). Comparison of measures of marker informativeness for ancestry and admixture mapping. BMC Genomics 12, 622. doi:10.1186/1471-2164-12-622
Doekes, H. P., Veerkamp, R. F., Bijma, P., Hiemstra, S. J., and Windig, J. J. (2018). Trends in genome-wide and region-specific genetic diversity in the Dutch-Flemish Holstein–Friesian breeding program from 1986 to 2015. Genet. Sel. Evol. 50, 15–16. doi:10.1186/s12711-018-0385-y
Frizzarin, M., Gormley, I. C., Berry, D. P., Murphy, T. B., Casa, A., Lynch, A., et al. (2021). Predicting cow milk quality traits from routinely available milk spectra using statistical machine learning methods. J. Dairy Sci. 104, 7438–7447. doi:10.3168/jds.2020-19576
Gianola, D., Okut, H., Weigel, K. A., and Rosa, G. J. (2011). Predicting complex quantitative traits with bayesian neural networks: A case study with Jersey cows and wheat. BMC Genet. 12, 87. doi:10.1186/1471-2156-12-87
He, J., Guo, Y., Xu, J., Li, H., Fuller, A., Tait, R. G., et al. (2018). Comparing SNP panels and statistical methods for estimating genomic breed composition of individual animals in ten cattle breeds. BMC Genet. 19, 56. doi:10.1186/s12863-018-0654-3
Hempstalk, K., Mcparland, S., and Berry, D. P. (2015). Machine learning algorithms for the prediction of conception success to a given insemination in lactating dairy cows. J. Dairy Sci. 98, 5262–5273. doi:10.3168/jds.2014-8984
Hulsegge, B., Calus, M. P. L., Windig, J. J., Hoving-Bolink, A. H., Maurice-Van Eijndhoven, M. H. T., and Hiemstra, S. J. (2013). Selection of SNP from 50K and 777K arrays to predict breed of origin in cattle. J. Animal Sci. 91, 5128–5134. doi:10.2527/jas.2013-6678
Judge, M. M., Kelleher, M. M., Kearney, J. F., Sleator, R. D., and Berry, D. P. (2017). Ultra-low-density genotype panels for breed assignment of Angus and Hereford cattle. Animal 11, 938–947. doi:10.1017/S1751731116002457
Kavakiotis, I., Triantafyllidis, A., Ntelidou, D., Alexandri, P., Megens, H.-J., Crooijmans, R. P. M. A., et al. (2015). Tres: Identification of discriminatory and informative SNPs from population genomic data. J. Hered. 106, 672–676. doi:10.1093/jhered/esv044
Kelleher, M. M., Berry, D. P., Kearney, J. F., Mcparland, S., Buckley, F., and Purfield, D. C. (2017). Inference of population structure of purebred dairy and beef cattle using high-density genotype data. Animal 11, 15–23. doi:10.1017/S1751731116001099
Kuehn, L. A., Keele, J. W., Bennett, G. L., Mcdaneld, T. G., Smith, T. P. L., Snelling, W. M., et al. (2011). Predicting breed composition using breed frequencies of 50,000 markers from the US Meat Animal Research Center 2,000 bull project. J. Animal Sci. 89, 1742–1750. doi:10.2527/jas.2010-3530
Kuhn, M. (2020). caret: Classification and regression training. R package version 6.0-85 Available at: https://cran.r-projectorg/web/packages/caret/index.html.
Kumar, H., Panigrahi, M., Chhotaray, S., Parida, S., Chauhan, A., Bhushan, B., et al. (2021). Comparative analysis of five different methods to design a breed-specific SNP panel for cattle. Anim. Biotechnol. 32, 130–136. doi:10.1080/10495398.2019.1646266
Lashmar, S. F., Berry, D. P., Pierneef, R., Muchadeyi, F. C., and Visser, C. (2021). Assessing single nucleotide polymorphism selection methods for the development of a low-density panel optimized for imputation in South African Drakensberger beef cattle. J. Animal Sci. 99, skab118. doi:10.1093/jas/skab118
Lewis, J., Abas, Z., Dadousis, C., Lykidis, D., Paschou, P., and Drineas, P. (2011). Tracing cattle breeds with principal components analysis ancestry informative SNPs. PLoS ONE 6, e18007. doi:10.1371/journal.pone.0018007
Maechler, M., Rousseeuw, P., Struyf, A., Hubert, M., and Hornik, K. (2021). cluster: Cluster analysis basics and extensions.
Mattucci, F., Galaverni, M., Lyons, L. A., Alves, P. C., Randi, E., Velli, E., et al. (2019). Genomic approaches to identify hybrids and estimate admixture times in European wildcat populations. Sci. Rep. 9, 11612. doi:10.1038/s41598-019-48002-w
McClure, M. C., McCarthy, J., Flynn, P., McClure, J. C., Dair, E., O’Connell, D. K., et al. (2018). SNP data quality control in a national beef and dairy cattle system and highly accurate SNP based parentage verification and identification. Front. Genet. 9, 84. doi:10.3389/fgene.2018.00084
McHugh, N., Pabiou, T., Wall, E., Mcdermott, K., and Berry, D. P. (2017). Impact of alternative definitions of contemporary groups on genetic evaluations of traits recorded at lambing. J. Animal Sci. 95, 1926–1938. doi:10.2527/jas.2016.1344
Mullen, M. P., Mcclure, M. C., Kearney, J. F., Waters, S. M., Weld, R., Flynn, P., et al. (2013). Development of a custom SNP chip for dairy and beef cattle breeding, parentage and research. Interbull Bull.
Novembre, J., Johnson, T., Bryc, K., Kutalik, Z., Boyko, A. R., Auton, A., et al. (2008). Genes mirror geography within Europe. Nature 456, 98–101. doi:10.1038/nature07331
O’Brien, A. C., Purfield, D. C., Judge, M. M., Long, C., Fair, S., and Berry, D. P. (2020). Population structure and breed composition prediction in a multi-breed sheep population using genome-wide single nucleotide polymorphism genotypes. animal 14, 464–474. doi:10.1017/S1751731119002398
Paetkau, D., Calvert, W., Stirling, I., and Strobeck, C. (1995). Microsatellite analysis of population structure in Canadian polar bears. Mol. Ecol. 4, 347–354. doi:10.1111/j.1365-294x.1995.tb00227.x
Paradis, E., Claude, J., and Strimmer, K. (2004). Ape: Analyses of phylogenetics and evolution in R language. Bioinformatics 20, 289–290. doi:10.1093/bioinformatics/btg412
Paschou, P., Ziv, E., Burchard, E. G., Choudhry, S., Rodriguez-Cintron, W., Mahoney, M. W., et al. (2007). PCA-correlated SNPs for structure identification in worldwide human populations. PLoS Genet. 3, 1672–1686. doi:10.1371/journal.pgen.0030160
Patterson, N., Price, A. L., and Reich, D. (2006). Population structure and eigenanalysis. PLoS Genet. 2, e190. doi:10.1371/journal.pgen.0020190
Purcell, S., Neale, B., Todd-Brown, K., Thomas, L., Ferreira, M. A. R., Bender, D., et al. (2007). Plink: A tool set for whole-genome association and population-based linkage analyses. Am. J. Hum. Genet. 81, 559–575. doi:10.1086/519795
Reverter, A., Hudson, N. J., Mcwilliam, S., Alexandre, P. A., Li, Y., Barlow, R., et al. (2020). A low-density SNP genotyping panel for the accurate prediction of cattle breeds. J. Animal Sci. 98, skaa337. doi:10.1093/jas/skaa337
Rodríguez-Ramilo, S. T., Fernández, J., Toro, M. A., Hernández, D., and Villanueva, B. (2015). Genome-wide estimates of coancestry, inbreeding and effective population size in the Spanish Holstein population. PLoS One 10, e0124157. doi:10.1371/journal.pone.0124157
Sargolzaei, M., Chesnais, J. P., and Schenkel, F. S. (2014). A new approach for efficient genotype imputation using information from relatives. BMC Genomics 15, 478. doi:10.1186/1471-2164-15-478
Schiavo, G., Bertolini, F., Galimberti, G., Bovo, S., Dall'Olio, S., Nanni Costa, L., et al. (2020). A machine learning approach for the identification of population-informative markers from high-throughput genotyping data: Application to several pig breeds. Animal 14, 223–232. doi:10.1017/S1751731119002167
Sevillano, C. A., Vandenplas, J., Bastiaansen, J. W. M., Bergsma, R., and Calus, M. P. L. (2017). Genomic evaluation for a three-way crossbreeding system considering breed-of-origin of alleles. Genet. Sel. Evol. 49, 75. doi:10.1186/s12711-017-0350-1
Sölkner, J. F., Hw, J., E, T., G, G., E, S., et al. 2010. Estimation of individual levels of admixture in crossbred populations from SNP chip data: Examples with sheep and cattle populations, Interbull Bulletin
Stachowicz, K., Sargolzaei, M., Miglior, F., and Schenkel, F. (2011). Rates of inbreeding and genetic diversity in Canadian Holstein and Jersey cattle. J. dairy Sci. 94, 5160–5175. doi:10.3168/jds.2010-3308
Stevens, E. L., Heckenberg, G., Roberson, E. D. O., Baugher, J. D., Downey, T. J., and Pevsner, J. (2011). Inference of relationships in population data using identity-by-descent and identity-by-state. PLoS Genet. 7, e1002287. doi:10.1371/journal.pgen.1002287
Strucken, E. M., Al-Mamun, H. A., Esquivelzeta-Rabell, C., Gondro, C., Mwai, O. A., and Gibson, J. P. (2017). Genetic tests for estimating dairy breed proportion and parentage assignment in East African crossbred cattle. Genet. Sel. Evol. 49, 67. doi:10.1186/s12711-017-0342-1
Szymańska, E., Saccenti, E., Smilde, A. K., and Westerhuis, J. A. (2012). Double-check: Validation of diagnostic statistics for PLS-DA models in metabolomics studies. Metabolomics 8, 3–16. doi:10.1007/s11306-011-0330-3
Team, M. D. (2017). MiX99: A software package for solving large mixed model equations. Finland: Natural Resources Institute Finland (Luke) Jokioinen.
Thomasen, J. R., Sørensen, A. C., Su, G., Madsen, P., Lund, M. S., and Guldbrandtsen, B. (2013). The admixed population structure in Danish Jersey dairy cattle challenges accurate genomic predictions. J. Animal Sci. 91, 3105–3112. doi:10.2527/jas.2012-5490
Van Der Heide, E. M. M., Veerkamp, R. F., Van Pelt, M. L., Kamphuis, C., Athanasiadis, I., and Ducro, B. J. (2019). Comparing regression, naive Bayes, and random forest methods in the prediction of individual survival to second lactation in Holstein cattle. J. Dairy Sci. 102, 9409–9421. doi:10.3168/jds.2019-16295
Van Hertem, T., Viazzi, S., Steensels, M., Maltz, E., Antler, A., Alchanatis, V., et al. (2014). Automatic lameness detection based on consecutive 3D-video recordings. Biosyst. Eng. 119, 108–116. doi:10.1016/j.biosystemseng.2014.01.009
Warner, D., Vasseur, E., Lefebvre, D. M., and Lacroix, R. (2020). A machine learning based decision aid for lameness in dairy herds using farm-based records. Comput. Electron. Agric. 169, 105193. doi:10.1016/j.compag.2019.105193
Weir, B. S., and Cockerham, C. C. (1984). Estimating F-statistics for the analysis of population structure. Evolution 38, 1358–1370. doi:10.1111/j.1558-5646.1984.tb05657.x
Westerhuis, J. A., Hoefsloot, H. C. J., Smit, S., Vis, D. J., Smilde, A. K., Van Velzen, E. J. J., et al. (2008). Assessment of PLSDA cross validation. Metabolomics 4, 81–89. doi:10.1007/s11306-007-0099-6
Wilkinson, S., Archibald, A. L., Haley, C. S., Megens, H.-J., Crooijmans, R. P., Groenen, M. A., et al. (2012). Development of a genetic tool for product regulation in the diverse British pig breed market. BMC Genomics 13, 580. doi:10.1186/1471-2164-13-580
Wilkinson, S., Wiener, P., Archibald, A. L., Law, A., Schnabel, R. D., Mckay, S. D., et al. (2011). Evaluation of approaches for identifying population informative markers from high density SNP Chips. BMC Genet. 12, 45. doi:10.1186/1471-2156-12-45
Keywords: genomic breed composition, cattle, crossbred, population assignment, low-density panels, best linear unbiased prediction, Admixture, genetic diversity
Citation: Ryan CA, Berry DP, O’Brien A, Pabiou T and Purfield DC (2023) Evaluating the use of statistical and machine learning methods for estimating breed composition of purebred and crossbred animals in thirteen cattle breeds using genomic information. Front. Genet. 14:1120312. doi: 10.3389/fgene.2023.1120312
Received: 09 December 2022; Accepted: 03 May 2023;
Published: 15 May 2023.
Edited by:
Francesco Tiezzi, University of Florence, ItalyReviewed by:
Matthew L. Spangler, University of Nebraska-Lincoln, United StatesLuiz Brito, Purdue University, United States
Hinayah Rojas De Oliveira, Purdue University, United States
Copyright © 2023 Ryan, Berry, O’Brien, Pabiou and Purfield. This is an open-access article distributed under the terms of the Creative Commons Attribution License (CC BY). The use, distribution or reproduction in other forums is permitted, provided the original author(s) and the copyright owner(s) are credited and that the original publication in this journal is cited, in accordance with accepted academic practice. No use, distribution or reproduction is permitted which does not comply with these terms.
*Correspondence: D. P. Berry, RG9uYWdoLkJlcnJ5QHRlYWdhc2MuaWU=