 Shiori Kinoshita1,2
 Kazuaki Kojima1Eriko Ohnishi1Yuka Takayama1Hiroki Kikuchi1Shuji Takada3
 Kazuhiko Nakabayashi1
 Tomoko Kawai1Kenichiro Hata1,4*
- 1Department of Maternal-Fetal Biology, National Research Institute for Child Health and Development, Tokyo, Japan
- 2Department of NCCHD Child Health and Development, Graduate School of Medical and Dental Sciences, Tokyo Medical and Dental University, Tokyo, Japan
- 3Department of Systems BioMedicine, National Research Institute for Child Health and Development, Tokyo, Japan
- 4Department of Human Molecular Genetics, Graduate School of Medicine, Gunma University, Maebashi, Gunma, Japan
Background: Epigenetic disruptions have been implicated in neurodevelopmental disorders. NSD2 is associated with developmental delay/intellectual disability; however, its role in brain development and function remains unclear.
Methods: We performed transcriptomic and epigenetic analyses using Nsd2 knockout mice to better understand the role of NSD2 in the brain.
Results and discussion: Transcriptomic analysis revealed that the loss of NSD2 caused dysregulation of genes related to synaptic transmission and formation. By analyzing changes in H3 lysine 36 dimethylation (H3K36me2), NSD2-mediated H3K36me2 mainly marked quiescent state regions and the redistribution of H3K36me2 occurred at transcribed genes and enhancers. By integrating transcriptomic and epigenetic data, we observed that H3K36me2 changes in a subset of dysregulated genes related to synaptic transmission and formation. These results suggest that NSD2 is involved in the regulation of genes important for neural function through H3K36me2. Our findings provide insights into the role of NSD2 and improve our understanding of epigenetic regulation in the brain.
1 Introduction
Epigenetic mechanisms, including DNA methylation and histone post-translational modifications, guide spatiotemporal gene expression patterns in cells and play critical roles in many biological processes. Disruption of epigenetic regulation has been implicated in human diseases, including cancer and developmental disorders (Greenberg and Bourc’his, 2019; Husmann and Gozani, 2019). With recent advances in DNA sequencing technologies, the number of variants and genes associated with the risk and etiology of neurodevelopmental disorders (NDDs), including autism spectrum disorder (ASD) and global developmental delay/intellectual disability (DD/ID), has increased (Gilissen et al., 2014; Stessman et al., 2017; Coe et al., 2019; Satterstrom et al., 2020). In addition, variants in genes encoding the epigenetic machinery are linked to NDDs (Fahrner and Bjornsson, 2019), suggesting that epigenetic regulation and its disruption are highly relevant to the etiology of NDDs and brain development.
NSD2 (also known as MMSET or WHSC1) is a member of the nuclear receptor-binding SET domain family that mediates histone H3 lysine 36 mono- and dimethylation (H3K36me2) (Kuo et al., 2011). Variable-sized deletions in chromosome 4p16.3, including NSD2, cause Wolf–Hirschhorn syndrome (also known as 4p-syndrome; OMIM#194190), which is characterized by growth retardation, DD/ID, microcephaly, hypotonia, and congenital malformations (Bergemann et al., 2005; Zollino et al., 2008; Battaglia et al., 2015). Recent human genetic studies have identified missense and truncating variants of NSD2 in individuals with DD/ID and growth retardation (known as Rauch–Steindl syndrome; OMIM#619695) (Zanoni et al., 2021). Most missense variants impair NSD2 enzymatic activity to mediate H3K36me2. This suggests that loss of NSD2 function could lead to these clinical manifestations. NSD2 plays critical roles in normal development, including cardiac development, adipose tissue development and function, follicular helper T-cell differentiation, and B-cell development (Nimura et al., 2009; Campos-Sanchez et al., 2017; Zhuang et al., 2018; Long et al., 2020); however, its function in brain development remains unclear.
In this study, we characterized the effects of loss of NSD2 on transcriptional and epigenetic landscapes in the brain using knockout (KO) mice to better understand its role in brain development and function.
2 Materials and methods
2.1 Mice
Nsd2 KO mice were generated using CRISPR/Cas9 genome editing, as described previously (Kawai et al., 2023). All mice used in this study were maintained on the C57BL/6 background. All animal experiments were conducted following the protocol approved by the Animal Care and Use Committee of the National Research Institute for Child Health and Development, Tokyo, Japan (Permit No. A2016-001).
2.2 Protein extraction and western blotting
Proteins were extracted from the embryonic brain as described previously (Oliviero et al., 2016) with slight modifications. The embryonic brain was homogenized in a lysis buffer (25 mM Tris-HCl [pH 7.6], 150 mM NaCl, 1% NP-40) with protease inhibitors (Nacalai Tesque, Kyoto, Japan). The lysates were incubated for 15 min on ice and centrifuged at 18,000 × g for 15 min at 4°C. To harvest the nuclear fraction, nuclear pellets were resuspended in high salt containing Buffer C (20 mM HEPES [pH 7.6], 20% [v/v] glycerol, 0.42 M NaCl, 1.5 mM MgCl2, 0.2 mM EDTA) with Benzonase nuclease (Merck KGaA, Darmstadt, Germany) and dounced 20 times with a homogenizer. Lysates were incubated for 45 min with rotation and centrifuged at 18,000 × g for 30 min at 4 °C. Before loading, Laemmli sample buffer with β-mercaptoethanol (Bio-Rad, Hercules, CA, United States) was added to the samples, followed by boiling at 95 °C for 5 min. Protein samples were resolved using sodium dodecyl sulfate-polyacrylamide gel electrophoresis, transferred onto a polyvinylidene fluoride membrane (Bio-Rad), blocked in 2% BSA in TBS-T or Blocking One (Nacalai Tesque), probed with primary antibodies, and detected using horseradish peroxidase-conjugated anti-rabbit or anti-mouse secondary antibodies (GE Healthcare, Chicago, IL, United States). Primary antibodies used in this study included anti-Histone H3 (ab1791, Abcam, Cambridge, United Kingdom), anti-NSD2 (ab75359, Abcam), andanti-H3K36me2 (ab9049, Abcam). Chemiluminescence was detected using ImageQuant LAS 4000 (GE Healthcare). Quantification was performed using ImageJ (Schneider et al., 2012).
2.3 Tissue fixation, sectioning, and staining
Embryonic brains from E18.5 were dissected and fixed by immersion in a 10% formalin neutral buffer solution (FUJIFILM Wako Pure Chemical Corporation, Osaka, Japan). The brains were then processed using an automated tissue processor (ASP 200, Leica Biosystems, Wetzlar, Germany), embedded in paraffin, and sectioned at a thickness of 5 μm on a rotary microtome. The sections were stained with 0.1% cresyl violet (Muto Pure Chemicals, Tokyo, Japan).
2.4 RNA sequencing (RNA-seq)
RNA-seq analysis was performed for the E15.5 brains of WT (n = 3; female = 3, male = 3) and Nsd2 KO mice (n = 3; female = 3, male = 3). Total RNA was extracted from E15.5 brains using the AllPrep DNA/RNA Mini Kit (Qiagen, Hilden, Germany). Total RNA purity and integrity were assessed using the BioAnalyzer RNA Pico kit (Agilent Technologies, Santa Clara, CA, United States). Samples with an RNA integrity number ≥7 were used for library preparation. Ribosomal RNA was depleted using the NEBNext rRNA Depletion Kit or Kit v2 (Human/Mouse/Rat) (New England Biolabs, Ipswich, MA, United States), and cDNA libraries were generated using the NEBNext Ultra II Directional RNA Library Prep Kit for Illumina (New England Biolabs) following the manufacturer’s protocol. The libraries were sequenced on either the HiSeq X platform (Illumina, San Diego, CA, United States), generating 150 bp paired-end reads or the NextSeq 550 platform (Illumina), generating 75 bp paired-end reads.
2.5 RNA-seq data processing and analysis
All 150 bp paired-end reads were trimmed to a length of 75 bp using FASTX-toolkit (v0.0.14)1 to ensure the same analytical conditions as the 75 bp paired-end reads. Reads containing adapter sequences were trimmed using cutadapt (v.2.6) (Martin, 2011). The reads were aligned to the mouse genome (mm10) using HISAT2 (v.2.1.0) (Kim et al., 2019). Transcripts were assembled and quantified using StringTie (v. 2.0.6) (Pertea et al., 2015). For analysis of RNA-seq data, all transcripts from mouse Ensembl genes 81 version (GRCm38.p4/mm10) were used. The gene counts matrix was generated by the Python script “prepDE.py” to extract read count information from StringTie output. Differential expression analysis was performed using the edgeR package (Robinson et al., 2010), and DEGs were defined using a false discovery rate cutoff of 0.05. Gene Ontology (GO) and Kyoto Encyclopedia of Genes and Genomes (KEGG) pathway enrichment analyses were performed using the Metascape software (Zhou et al., 2019).
2.6 Quantitative reverse transcription PCR (qRT-PCR)
RNA extraction was performed as described above in section 2.4. cDNA was synthesized using PrimeScript RT reagent Kit with gDNA Eraser (Perfect Real Time) (Takara Bio, Shiga, Japan). PCR was performed on the Applied Biosystems 7,500 Fast Real-Time PCR System (Thermo Fisher Scientific, Waltham, MA, United States) using TB Green Premix Ex TaqⅡ (Tli RNaseH Plus) (Takara Bio) with primers listed in Supplementary Table S1. Relative expression was calculated using the ∆∆Ct method and data were normalized to Actb expression.
2.7 Chromatin immunoprecipitation followed by DNA sequencing (ChIP-seq) and ChIP-qPCR
ChIP-seq analysis was performed for the E15.5 brains of WT and Nsd2 KO mice (n = 2; male = 2 in each group). ChIP experiments were performed using ChIP Reagents (Nippon Gene, Tokyo, Japan). ChIP assay was performed on E15.5 WT and Nsd2 KO brains. Fresh brain tissues were minced, fixed with 1% paraformaldehyde in D-PBS (−) for 10 min, and quenched with 2 M glycine for 5 min. The tissues were resuspended in NP-40 buffer containing a proteinase inhibitor cocktail (Nacalai Tesque) and homogenized using BioMAsher (Nippi, Tokyo, Japan). The homogenized tissue was incubated on ice for 10 min and centrifuged to collect the nuclear pellet. The nuclear pellet was resuspended in SDS Lysis buffer, and the lysate was sonicated to fragment the chromatin for 15 min (duty: 5, PIP: 105, cycles/burst: 200) on Covaris S220 (Covaris, Woburn, MA, United States). The fragmented chromatin was centrifuged to remove debris and immunoprecipitated with Dynabeads Protein A (Thermo Fisher Scientific)-conjugated anti-H3K36me2 antibodies (ab9049, Abcam) or normal Rabbit IgG (#2729, Cell Signaling Technology, Danvers, MA, United States) in ChIP dilution buffer containing protease inhibitor cocktail (Nacalai Tesque) for 4 h at 4°C with rotation. The beads were washed with 1× RIPA buffer (150 mM, 1× RIPA buffer (500 mM), LiCl buffer (250 mM LiCl, 10 mM Tris-HCl [pH 8.0], 0.5% NP-40, 0.5% sodium deoxycholate, and 1 mM EDTA), and TE buffer (pH 8.0). The beads were incubated in ChIP direct elution buffer with Proteinase K overnight at 65°C. ChIP DNA was purified using AMPure XP beads (Beckman Coulter, Brea, CA, United States) following the manufacturer’s protocol. For ChIP-seq, libraries were generated using the NEBNext Ultra II DNA Library Prep Kit for Illumina (New England Biolabs) following the manufacturer’s protocol. The libraries were sequenced on a NextSeq550 platform (Illumina) with 75 bp single-end and paired-end reads. ChIP-qPCR was performed on Applied Biosystems 7500 Fast Real-Time PCR System (Thermo Fisher Scientific) using TB Green Premix Ex TaqⅡ (Tli RNaseH Plus) (Takara Bio) with primers listed in Supplementary Table S2.
2.8 ChIP-seq data processing and analysis
The adapter trimming method was the same as that used for RNA-seq analysis. The ChIP-seq reads were aligned to the mouse genome (mm10) using BWA-MEM (v.0.7.17) (Li and Durbin, 2009). PCR duplicates were removed using Picard (v.2.17.11)2, and bam files of each biological replicate were merged using SAMtools (v.1.6) (Danecek et al., 2021). Bigwig tracks were generated using bamCoverage in deepTools (v.3.3.0) with options “--normalizeUsing CPM.” To calculate normalized H3K36me2 ChIP signal for each window (1 kb windows, 10 k windows), read counts were divided by input read counts using bamCompare in deepTools (v.3.3.0) (Ramírez et al., 2014) with option “--normalizeUsing CPM, -- operation ratio.” Fold change (FC) of normalized H3K36me2 ChIP- signal (10 k windows) was used to identify H3K36me2 loss or gain at thresholds of FC < 1/1.5 (loss) or >1.5 (gain). The correlation map was presented using computeMatrix and plotCorrelation in deepTools (v.3.3.0) (Ramírez et al., 2014). The pairwise correlation (Spearman’s ρ) coefficient was determined using the normalized H3K36me2 ChIP signal in 10 k windows. The blacklisted regions downloaded from the ENCODE portal (ENCFF547MET) (Amemiya et al., 2019; Luo et al., 2020) were excluded from the downstream analysis. The distribution of H3K36me2 across the mouse genome was determined using ChIPseeker (v.1.34.1) (Yu et al., 2015). Random 10 kb windows were generated using BEDTools (v. 2.26.0) (Quinlan and Hall, 2010). ChromHMM annotation-based enrichment analysis was performed using LOLA (v.1.28.0) (Sheffield and Bock, 2016) and the E15.5 mouse forebrain ChromHMM annotation downloaded from the ENCODE portal (ENCFF163AVC) (Luo et al., 2020; van der Velde et al., 2021). The heatmap and aggregation plot were depicted using computeMatrix, plotProfile, and plotHeatmap in deepTools (v.3.3.0) (Ramírez et al., 2014). For enhancer analysis, H3K4me1, H3K27ac, and H3K4me3 peak files of the E15.5 mouse forebrain were downloaded from the ENCODE portal (ENCFF871XIM, ENCFF433OHF, ENCFF112LTJ). Active enhancers were defined as both H3K4me1 and H3K27ac peaks without H3K4me3 peaks. Super enhancers were called from H3K27ac peak files (ENCFF433OHF) using ROSE (Whyte et al., 2013). Putative target genes active enhancer pairs were determined using GREAT (Tanigawa et al., 2022).
3 Results
3.1 Loss of NSD2 causes transcriptional dysregulation of synaptic transmission and formation-related genes in the brain
We previously generated an Nsd2 KO mouse model in which the entire coding sequence of Nsd2 was deleted (Supplementary Figure S1A) (Kawai et al., 2023). NSD2 protein expression was barely detectable in Nsd2 KO mice (Supplementary Figure S1B). Nsd2 KO mice exhibited lower body weight compared to wild-type (WT) mice and died within 1 day of birth (Supplementary Figure S1C).
On the basis of the high expression of Nsd2 during the embryonic stage (Supplementary Figure S1D) and the known association between epigenetic regulation and brain development (Fagiolini et al., 2009), we focused on its potential role in brain development and function during this stage. First, we evaluated the brain morphology of Nsd2 KO mice. The total brain weight of Nsd2 KO mice was significantly reduced compared to WT mice. However, there was no significant difference in the brain/body weight ratio between WT and Nsd2 KO mice (Supplementary Figure S1E), suggesting that the reduced brain weight was due to growth retardation. Although histological analysis of the brain did not reveal any apparent structural defects in Nsd2 KO mice, the cortex of Nsd2 KO mice showed a slight reduction in thickness compared to the control (Supplementary Figure S1F). Thus, loss of NSD2 has minimal effects on the cytoarchitecture of the brain during the embryonic stage.
NSD2 mediates H3K36me2, which is generally associated with active transcription (Kuo et al., 2011; Weinberg et al., 2019). We next performed RNA-seq analysis for WT and Nsd2 KO brains at embryonic day (E) 15.5 to examine the transcriptional effect of NSD2 loss. E15.5 was selected as the preferred developmental time point for our samples because it is a critical period for neurodevelopment. This includes important processes such as neurogenesis, division and differentiation of neural progenitor cells, migration, and relatively homogeneous populations of cells (Yao and Jin, 2014; La Manno et al., 2021). We identified 321 differentially expressed genes (DEGs) (excluding Nsd2). Out of these, 253 were significantly downregulated and 68 were upregulated in Nsd2 KO male brains (Figure 1A and Supplementary Table S3). Sixty-two out of the 321 DEGs consistently showed differential expression in both male and female KO mice (Supplementary Figures S2A, 2B and Supplementary Table S4). GO analysis revealed that the downregulated DEGs were involved in synaptic transmission in terms of biological processes (Figure 1B and Supplementary Figure S2C). Among the genes annotated as cellular components, the downregulated DEGs were related to the synaptic membrane and ion channel complex (Supplementary Figure S2D). Furthermore, KEGG pathway analysis revealed an enrichment of neuronal synapse and signaling pathways, specifically glutamatergic synapse, serotonergic synapse, and cAMP signaling (Supplementary Figure S2E). In contrast, the upregulated DEGs showed an enrichment of cell-cell adhesion molecules (Figure 1C). Notably, the Nsd2 KO showed an upregulation of protocadherin beta genes (Pcdhb) (Figure 1D and Supplementary Figure S2F). Clustered protocadherin genes are cell surface molecules expressed in the central nervous system. They play crucial roles in shaping optimal neural circuits and promoting neuronal diversity (Lefebvre et al., 2012; Hasegawa et al., 2016; Mountoufaris et al., 2017). To further evaluate the association between these DEGs and NDDs, we analyzed the overlap between the human ortholog DEGs and genes related to NDDs, such as ASD (SFARI score 1–3; 853 genes) (Banerjee-Basu and Packer, 2010), ID (1397 genes) (Ilyas et al., 2020), and schizophrenia (120 genes) (Trubetskoy et al., 2022). The DEGs in Nsd2 KO males and females overlapped with 3.0% and 1.1% of the NDD-related gene sets, respectively (Figure 1E and Supplementary Figure S2G). These results demonstrate that the loss of NSD2 impairs gene expression associated with synaptic transmission and formation.
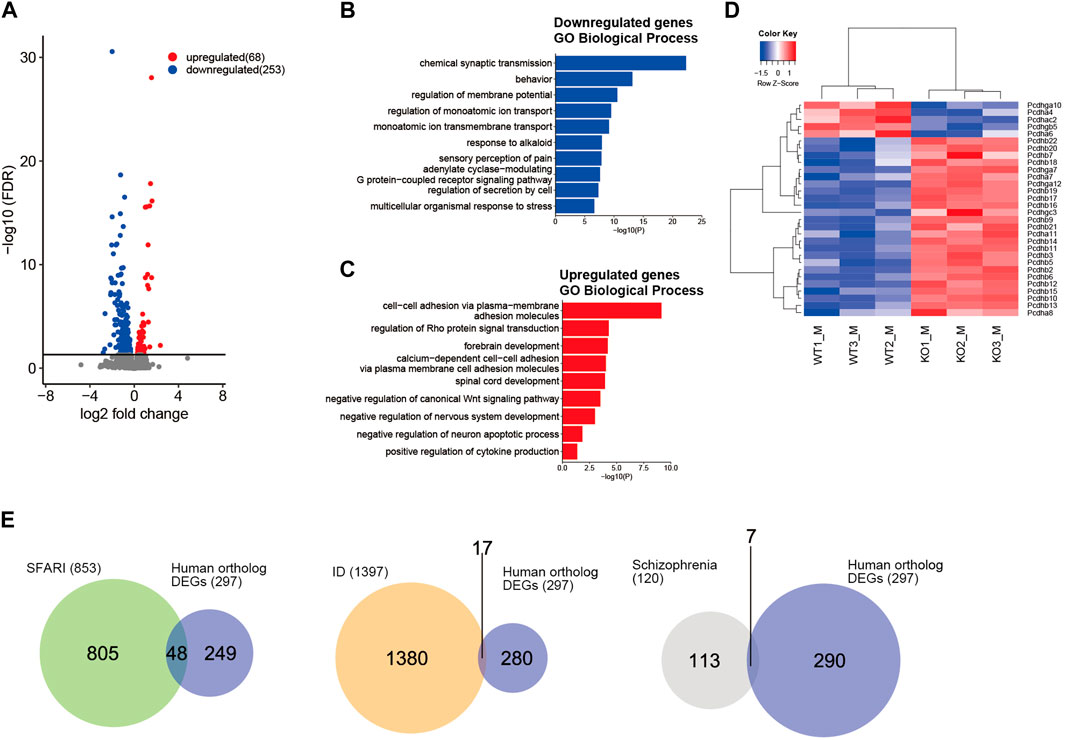
FIGURE 1. Loss of NSD2 affects gene expression in the brain. (A) Volcano plot of RNA sequencing analysis showing differentially expressed genes (DEGs) between Nsd2 knockout (KO) and wild-type (WT) male mouse brains at E15.5; n = 3 in each group. DEGs are labeled in blue (downregulated) and red (upregulated). The horizontal line indicates the false discovery rate (FDR) threshold of 0.05. (B, C) Bar plots showing enriched Gene Ontology terms among biological processes related to downregulated DEGs (B) and upregulated DEGs (C) in Nsd2 KO males (p < 0.05). (D) Heatmap showing clustered protocadherin genes differentially expressed in Nsd2 KO males by hierarchical clustering of WT and Nsd2 KO biological replicates. (E) Venn diagram showing the overlap between human ortholog DEGs in Nsd2 KO male and neurodevelopmental disorder gene sets, including autism spectrum disorder from SFARI (left), intellectual disability (middle), and schizophrenia (right). ASD, autism spectrum disorder; ID, intellectual disability.
3.2 Loss of NSD2 causes global changes in H3K36me2 in the brain
To determine whether the loss of NSD2 affected H3K36me2 levels in the brain, we initially evaluated overall H3K36me2 levels. The bulk H3K36me2 levels were significantly decreased in E15.5 Nsd2 KO brains (Supplementary Figure S3A). To gain more insight into the role of NSD2 in the H3K36me2 landscape in the brain, we conducted a ChIP-seq analysis using E15.5 brains. H3K36me2 ChIP-seq data were highly correlated (Spearman correlation coefficients >0.9) between biological replicates, and WT and Nsd2 KO were separated into distinct clusters by hierarchical clustering (Supplementary Figure S3B). As the two biological replicates were well correlated across the genome, we merged them for further analysis. We identified 16.6% of the genome with H3K36me2 loss/gain in Nsd2 KO brains (Figure 2A and Supplementary Tables S5, S6). Loss and gain of H3K36me2 were observed in both genic and intergenic regions (Figure 2B). Consistent with previous studies (Weinberg et al., 2019; Li et al., 2022), H3K36me2 loss was predominantly observed in the distal intergenic regions (Figure 2C). Conversely, the gain was largely observed in promoters and genic regions, including exons and intronic regions (Figure 2C).
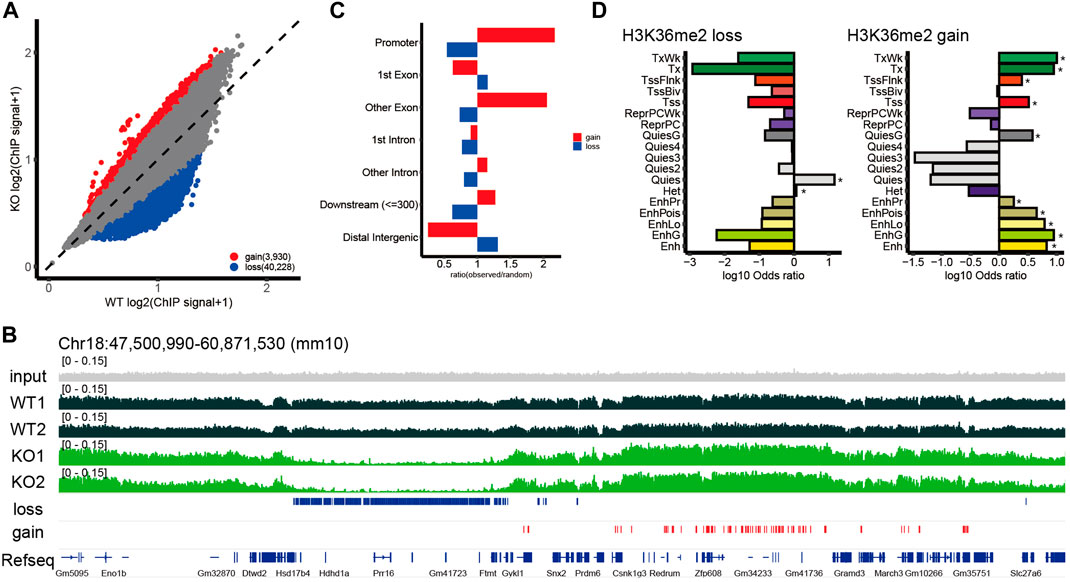
FIGURE 2. Genome-wide changes in H3K36me2. (A) Scatterplot showing normalized H3K36me2 chromatin immunoprecipitation (ChIP) signal for the 10 kb window in wild-type (WT) and Nsd2 knockout (KO) E15.5 brains. The windows with loss or gain of H3K36me2 were defined as normalized H3K36me2 ChIP signal ratio between Nsd2 KO versus WT E15.5 brain <1/1.5 or >1.5 and labeled in blue (loss) and red (gain). (B) Genome browser snapshot showing representative H3K36me2 ChIP signal in WT and Nsd2 KO E15.5 brains. H3K36me2 loss/gain in Nsd2 KO are shown as red and blue bars, respectively, and genes (from RefSeq) are annotated at the bottom. (C) Bar plot showing the ratio of observed-to-random H3K36me2 loss and gain in annotated genomic regions in Nsd2 KO E15.5 brains. (D) Bar plots showing enrichment analysis of ChromHMM annotation for H3K36me2 loss (left) and gain (right) in Nsd2 KO E15.5 brains. Asterisks indicate significance (q value <0.05) for background versus H3K36me2 loss/gain using Fisher’s exact test.
To further characterize the regions where changes in H3K36me2 were observed, we applied ChromHMM annotations of developing mouse tissues from ENCODE (van der Velde et al., 2021) and performed enrichment analysis. The quiescent chromatin state (Quies), characterized by very low signals for canonical histone marks and high DNA methylation, accounted for a large fraction of H3K36me2 loss. H3K36me2 gain was enriched in actively transcribed genes (Tx and TxWk) and enhancer-related states (EnhG, Ehn, EnhLo, EnhPr, and EnhPois) (Figure 2D). Overall, NSD2-mediated H3K36me2 shows preferential enrichment at the quiescent genomic regions in the embryonic brain, and redistribution of H3K36me2 in Nsd2 KO occurs mainly at actively transcribed genes and enhancers.
3.3 Changes in H3K36me2 affect gene expression related to synaptic transmission and formation in the brain
Epigenetic states are associated with transcription, and their dysregulation causes transcriptional changes (Allis and Jenuwein, 2016). First, we examined the average H3K36me2 profile grouped by gene expression levels to characterize the relationship between H3K36me2 and gene expression levels. H3K36me2 profiles in highly expressed genes (Q4 and Q3) showed enrichment in the proximal region of the transcription start site (TSS) and gradually decayed in the 3′region of genes, consistent with previous studies (Kuo et al., 2011; Weinberg et al., 2019). In contrast, H3K36me2 profiles in weakly expressed genes and those with zero value (Q2, Q1, and zero) showed neutral patterns from the 5′to 3′region of genes except for the TSS with higher H3K36me2 levels than those of highly expressed genes (Figure 3A), suggesting that H3K36me2 levels are likely to be negatively correlated with gene expression levels in the embryonic brain. In accordance with the findings of the ChromHMM analysis, highly expressed genes (Q3, Q4) gained H3K36me2, while genes with zero value (zero) lost H3K36me2 in Nsd2 KO.
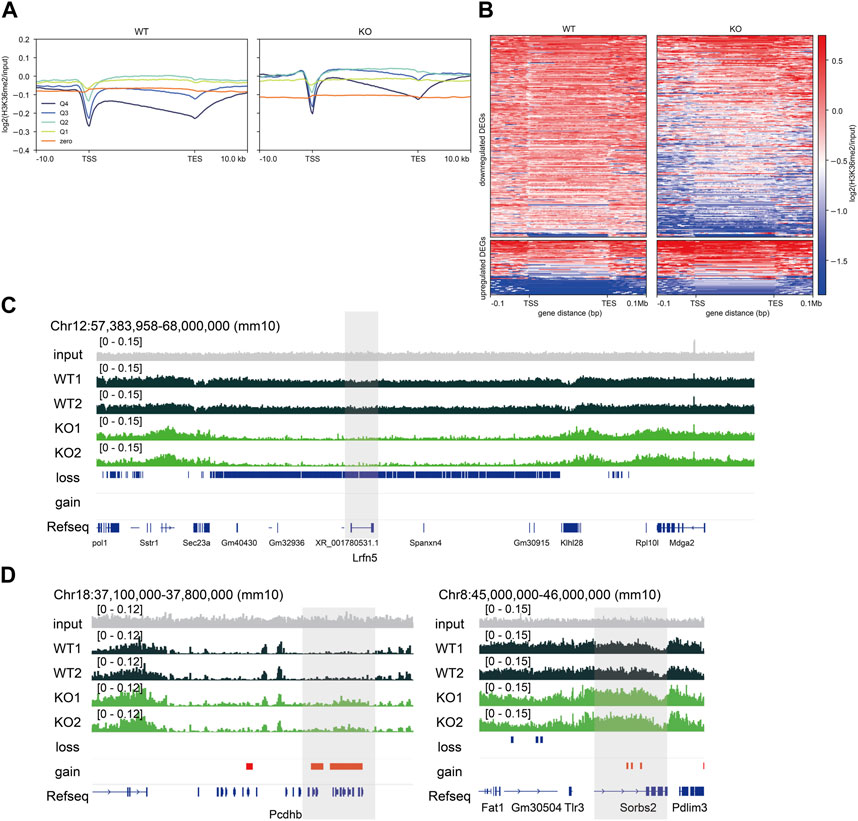
FIGURE 3. Relationship between gene expression and H3K36me2 levels. (A) Plot showing averaged H3K36me2 chromatin immunoprecipitation (ChIP) signal grouped into quartiles (Q4-Q1) and zero by transcripts per million and zero value in wild-type (WT) and knockout (KO) E15.5 brains. (B) Heatmaps showing H3K36me2 ChIP signal enrichment of differentially expressed genes (DEGs). (C) Genome browser snapshot showing representative H3K36me2 ChIP signal in WT and Nsd2 knockout (KO) E15.5 brains. The shaded areas indicate Lrfn5 (downregulated DEG) and (D) Pcdhb genes and Sorbs2 (upregulated DEGs). H3K36me2 loss/gain in Nsd2 KO are shown as red and blue bars, respectively, and genes (from RefSeq) are annotated at the bottom. TSS, transcription start site; TES, transcription end site.
Next, we examined whether changes in the levels of H3K36me2 were associated with changes in gene expression in Nsd2 KO brains. We identified that 56% of DEGs showed changes in H3K36me2 levels (150/253 downregulated DEGs and 32/68 upregulated DEGs). The changes in H3K36me2 levels in upregulated DEGs were modest compared to the changes in downregulated DEGs. The majority of genes with H3K36me2 loss or gain showed no significant changes in gene expression (Supplementary Figure S4A). However, the DEGs with changes in H3K36me2 included genes related to synaptic transmission and formation. The downregulated or upregulated DEGs mainly showed loss or gain of H3K36me2 at their loci, respectively (Figures 3B–D), and we validated changes in gene expression and H3K36me2 using qPCR and ChIP-qPCR (Supplementary Figures S4B, S4C). Specifically, H3K36me2 loss in the downregulated DEGs was observed in a broader region extending up to 0.1 Mb upstream and downstream of TSS and transcription end site (TES) (Figures 3B, C). These results suggest that NSD2 affects the expression of genes important for neural function in the embryonic brain by regulating H3K36me2 at a sub-Mb scale domain.
H3K36me2 marks are typically located in both intergenic and genic regions. Changes in H3K36me2 at intergenic regions affect enhancer activity (Lhoumaud et al., 2019; Farhangdoost et al., 2021; Rajagopalan et al., 2021). To gain further insight into the functions of NSD2-mediated H3K36me2 in regulating gene expression, we examined the overlap between H3K36me2 loss and active enhancers. H3K36me2 loss included 183 active enhancers, defined by H3K4me1 and H3K27ac without H3K4me3 in E15.5 brain samples, but did not overlap with super-enhancers defined using H3K27ac and ROSE (Whyte et al., 2013). We identified 194 putative target gene active enhancer pairs, and these overlapped with only 54 DEGs (Supplementary Figure S4D). This indicates that changes in H3K36me2 may have a limited effect on enhancers in Nsd2 KO.
4 Discussion
Perturbations in epigenetic regulation lead to NDDs, highlighting the importance of epigenetic modifiers in brain development and function. In this study, we characterized the transcriptomic and epigenomic changes in Nsd2 KO brains using genome-wide approaches. Our analysis of transcriptomic profiles in Nsd2 KO brains showed that the loss of NSD2 led to the dysregulation of gene expression involved in synaptic transmission and formation, which are essential for brain function. Synaptic dysfunction has been implicated in NDDs (Zoghbi and Bear, 2012; Südhof, 2018). The downregulated DEGs included genes previously reported to be associated with NDDs, such as Gria4, Csmd3, and Kcnd2 (Lee et al., 2014; Martin et al., 2017; Lin et al., 2018; Zhang et al., 2021; Song et al., 2022; Wang et al., 2022). In addition, the upregulated DEGs included Pcdhb genes, which are involved in axon targeting and interneuron survival (Hasegawa et al., 2016). The upregulation of Pcdhb genes has been observed in several mouse models of NDD and ASD that exhibit abnormal behaviors (Balan et al., 2021; Hagelkruys et al., 2022). These observations suggest that the dysregulation of gene expression following the loss of NSD2 could contribute to neurological dysfunction. Further investigation is required to understand the connection between these gene expression changes and the pathogenesis of NDDs in Nsd2 KO mice.
Although we observed a global loss of H3K36me2 in Nsd2 KO brains, the loss of NSD2 did not completely deplete H3K36me2. Recent studies have reported that NSD1 is required for the patterning of H3K36me2 and DNA methylation in the nervous system and plays an important role in neuronal identity (Hamagami et al., 2023; Zheng et al., 2023). The loss of NSD1 in neocortices showed a global reduction in H3K36me2 throughout the whole genome, including both genic and intergenic regions. However, single knockouts of Nsd1 or Nsd2 result in limited loss of H3K36me2, suggesting that NSD1 and NSD2 redundantly contribute to the broad H3K36me2 pattern in the nervous system. Pathogenic variants of NSD1 have been identified in Sotos syndrome, which is characterized by overgrowth and learning disabilities (Kurotaki et al., 2002; Tatton-Brown and Rahman, 2007). In addition, pathogenic variants of the H3K36 methyltransferases SETD2 and ASH1L have also been identified in patients with NDDs (de Ligt et al., 2012; Luscan et al., 2014; Wang et al., 2016; Okamoto et al., 2017). Understanding the overlapping and distinct roles of these H3K36 methyltransferases will be useful for understanding the mechanism of related NDDs. Moreover, we also observed gains of H3K36me2 in Nsd2 KO brains. Similar increases in H3K36me2 levels have also been observed in other knockout/knockdown experiments of H3K36 methyltransferases in mammalian cells (Weinberg et al., 2019; Farhangdoost et al., 2021; Hamagami et al., 2023). H3K36 methylation cross-talks with other epigenetic modifications, and changes in H3K36me2 can affect other histone modifications such as H3K27me3 and H3K27ac, DNA methylation, and chromatin accessibility (Streubel et al., 2018; Lhoumaud et al., 2019; Weinberg et al., 2019; Fang et al., 2021; Hamagami et al., 2023). Furthermore, since other H3K36 methyltransferases, including NSD1, SETD2, and ASH1L are also expressed in the developing brain, they can mediate H3K36me2 under conditions of NSD2 loss. Therefore, this might be a consequence of the redistribution of other H3K36 methyltransferases through changes in H3K36me2 and subsequent epigenetic modifications.
Using chromatin state annotation, it was found that NSD2-mediated H3K36me2 mainly marks quiescent state chromatin in the E15.5 brain. Additionally, higher H3K36me2 signals were observed in weakly expressed genes. Previous studies have shown that H3K36me2 is associated with actively transcribed genes in mammalian cells (Kuo et al., 2011; Weinberg et al., 2019). However, recent studies have suggested that impaired deposition of H3K36me2 leads to the loss of non-CpG methylation and gene activation in the adult mouse brain (Hamagami et al., 2023; Khazaei et al., 2023; Zheng et al., 2023). Non-CpG methylation in the brain is acquired during postnatal development (Lister et al., 2013). Therefore, H3K36me2 may serve as a bookmark for gene repression in the embryonic brain.
In our study, we observed changes in H3K36me2 in a subset of DEGs, suggesting that these genes are direct targets of NSD2. On the other hand, there are DEGs that were not affected by H3K36me2 in Nsd2 KO. Histone modification enzymes, including NSD2, have non-catalytic functions (Tian et al., 2019; Sun et al., 2023). These proteins bind to chromatin and act as transcriptional coregulators independently of their catalytic activity. Additionally, NSD2 methylates non-histone proteins (Park et al., 2018; Zhang et al., 2019). Non-histone methylation has been implicated in protein-protein interactions and affects the downstream pathway of the substrate protein. Such non-canonical functions of NSD2 may explain DEGs that are not affected by changes in H3K36me2. Additionally, most genes with loss of H3K36me2 did not show changes in expression or enrichment of any GO terms or KEGG pathways. These included clusters of genes, such as olfactory receptor genes, keratin genes, and immune genes (Supplementary Table S6). Further investigation into the detailed mechanisms of NSD2 recruitment and gene regulation by NSD2 in the brain is warranted.
The present study has limitations that need to be considered. We used bulk embryonic brain tissue composed of heterogeneous cell populations. This was limited to accurately assessing changes in gene expression and H3K36me2 levels. Furthermore, we focused on the brain at the embryonic stage due to high levels of Nsd2 expression. The development and maturation of the mammalian brain continue after birth with epigenetic changes (Lister et al., 2013). Dynamic analysis of specific cell types across brain development can provide deeper insights into NSD2 function in the brain.
In summary, our results showed that NSD2 is involved in gene regulation that is important for neural functioning through H3K36me2. Elucidating the function of NSD2 in the brain is important for understanding NSD2-associated NDDs and epigenetic regulation in the brain.
Data availability statement
The datasets presented in this study can be found in online repositories. The names of the repository/repositories and accession number(s) can be found below: https://www.ncbi.nlm.nih.gov/geo/, GSE232566.
Ethics statement
The animal study was approved by the Animal Care and Use Committee of the National Research Institute for Child Health and Development. The study was conducted in accordance with the local legislation and institutional requirements.
Author contributions
SK: Writing–original draft, Writing–review and editing, Investigation, Conceptualization, Formal Analysis. KK: Writing–review and editing, Investigation, Conceptualization. EO: Writing–review and editing, Investigation. YT: Writing–review and editing, Investigation. HK: Writing–review and editing, Investigation. ST: Writing–review and editing, Resources. KN: Writing–review and editing, Writing–original draft. TK: Writing–review and editing, Funding acquisition, Conceptualization. KH: Writing–review and editing, Funding acquisition, Supervision.
Funding
The author(s) declare financial support was received for the research, authorship, and/or publication of this article. This work was supported by AMED (JP22ek0109489 to KH and JP19ek0109205 to TK), JSPS KAKENHI (JP21H02887 and JP21K19584 to KH), the National Center for Child Health and Development (NCCHD 2022A-3 to KH), and Gunma University for the promotion of scientific research (to KH).
Acknowledgments
We thank Ms. Hiromi Kamura and Dr. Keisuke Ishiwata for their technical assistance. We thank members of the laboratory for helpful discussions. We would also like to thank Editage for English language editing.
Conflict of interest
The authors declare that the research was conducted in the absence of any commercial or financial relationships that could be construed as a potential conflict of interest.
The author(s) declared that they were an editorial board member of Frontiers, at the time of submission. This had no impact on the peer review process and the final decision.
Publisher’s note
All claims expressed in this article are solely those of the authors and do not necessarily represent those of their affiliated organizations, or those of the publisher, the editors and the reviewers. Any product that may be evaluated in this article, or claim that may be made by its manufacturer, is not guaranteed or endorsed by the publisher.
Supplementary material
The Supplementary Material for this article can be found online at: https://www.frontiersin.org/articles/10.3389/fgene.2024.1308234/full#supplementary-material
Footnotes
1http://hannonlab.cshl.edu/fastx_toolkit/
2https://broadinstitute.github.io/picard/
References
Allis, C. D., and Jenuwein, T. (2016). The molecular hallmarks of epigenetic control. Nat. Rev. Genet. 17, 487–500. doi:10.1038/nrg.2016.59
Amemiya, H. M., Kundaje, A., and Boyle, A. P. (2019). The ENCODE blacklist: identification of problematic regions of the genome. Sci. Rep. 9, 9354. doi:10.1038/s41598-019-45839-z
Balan, S., Iwayama, Y., Ohnishi, T., Fukuda, M., Shirai, A., Yamada, A., et al. (2021). A loss-of-function variant in SUV39H2 identified in autism-spectrum disorder causes altered H3K9 trimethylation and dysregulation of protocadherin β-cluster genes in the developing brain. Mol. Psychiatry 26, 7550–7559. doi:10.1038/s41380-021-01199-7
Banerjee-Basu, S., and Packer, A. (2010). SFARI Gene: an evolving database for the autism research community. Dis. Model. Mech. 3, 133–135. doi:10.1242/dmm.005439
Battaglia, A., Carey, J. C., and South, S. T. (2015). Wolf-Hirschhorn syndrome: a review and update. Am. J. Med. Genet. C Semin. Med. Genet. 169, 216–223. doi:10.1002/ajmg.c.31449
Bergemann, A. D., Cole, F., and Hirschhorn, K. (2005). The etiology of Wolf-Hirschhorn syndrome. Trends Genet. 21, 188–195. doi:10.1016/j.tig.2005.01.008
Campos-Sanchez, E., Deleyto-Seldas, N., Dominguez, V., Carrillo-de-Santa-Pau, E., Ura, K., Rocha, P. P., et al. (2017). Wolf-hirschhorn syndrome candidate 1 is necessary for correct hematopoietic and B cell development. Cell Rep. 19, 1586–1601. doi:10.1016/j.celrep.2017.04.069
Coe, B. P., Stessman, H. A. F., Sulovari, A., Geisheker, M. R., Bakken, T. E., Lake, A. M., et al. (2019). Neurodevelopmental disease genes implicated by de novo mutation and copy number variation morbidity. Nat. Genet. 51, 106–116. doi:10.1038/s41588-018-0288-4
Danecek, P., Bonfield, J. K., Liddle, J., Marshall, J., Ohan, V., Pollard, M. O., et al. (2021). Twelve years of SAMtools and BCFtools. Gigascience 10, giab008. doi:10.1093/gigascience/giab008
de Ligt, J., Willemsen, M. H., van Bon, B. W. M., Kleefstra, T., Yntema, H. G., Kroes, T., et al. (2012). Diagnostic exome sequencing in persons with severe intellectual disability. N. Engl. J. Med. 367, 1921–1929. doi:10.1056/NEJMoa1206524
Fagiolini, M., Jensen, C. L., and Champagne, F. A. (2009). Epigenetic influences on brain development and plasticity. Curr. Opin. Neurobiol. 19, 207–212. doi:10.1016/j.conb.2009.05.009
Fahrner, J. A., and Bjornsson, H. T. (2019). Mendelian disorders of the epigenetic machinery: postnatal malleability and therapeutic prospects. Hum. Mol. Genet. 28, R254–R264. doi:10.1093/hmg/ddz174
Fang, Y., Tang, Y., Zhang, Y., Pan, Y., Jia, J., Sun, Z., et al. (2021). The H3K36me2 methyltransferase NSD1 modulates H3K27ac at active enhancers to safeguard gene expression. Nucleic Acids Res. 49, 6281–6295. doi:10.1093/nar/gkab473
Farhangdoost, N., Horth, C., Hu, B., Bareke, E., Chen, X., Li, Y., et al. (2021). Chromatin dysregulation associated with NSD1 mutation in head and neck squamous cell carcinoma. Cell Rep. 34, 108769. doi:10.1016/j.celrep.2021.108769
Gilissen, C., Hehir-Kwa, J. Y., Thung, D. T., van de Vorst, M., van Bon, B. W. M., Willemsen, M. H., et al. (2014). Genome sequencing identifies major causes of severe intellectual disability. Nature 511, 344–347. doi:10.1038/nature13394
Greenberg, M. V. C., and Bourc’his, D. (2019). The diverse roles of DNA methylation in mammalian development and disease. Nat. Rev. Mol. Cell Biol. 20, 590–607. doi:10.1038/s41580-019-0159-6
Hagelkruys, A., Horrer, M., Taubenschmid-Stowers, J., Kavirayani, A., Novatchkova, M., Orthofer, M., et al. (2022). The HUSH complex controls brain architecture and protocadherin fidelity. Sci. Adv. 8, eabo7247. doi:10.1126/sciadv.abo7247
Hamagami, N., Wu, D. Y., Clemens, A. W., Nettles, S. A., Li, A., and Gabel, H. W. (2023). NSD1 deposits histone H3 lysine 36 dimethylation to pattern non-CG DNA methylation in neurons. Mol. Cell 83, 1412–1428.e7. doi:10.1016/j.molcel.2023.04.001
Hasegawa, S., Kumagai, M., Hagihara, M., Nishimaru, H., Hirano, K., Kaneko, R., et al. (2016). Distinct and cooperative functions for the protocadherin-α, -β and -γ clusters in neuronal survival and axon targeting. Front. Mol. Neurosci. 9, 155. doi:10.3389/fnmol.2016.00155
Husmann, D., and Gozani, O. (2019). Histone lysine methyltransferases in biology and disease. Nat. Struct. Mol. Biol. 26, 880–889. doi:10.1038/s41594-019-0298-7
Ilyas, M., Mir, A., Efthymiou, S., and Houlden, H. (2020). The genetics of intellectual disability: advancing technology and gene editing. F1000Res 9, F1000 Faculty Rev-22. doi:10.12688/f1000research.16315.1
Kawai, T., Kinoshita, S., Takayama, Y., Onishi, E., Kamura, H., Kojima, K., et al. (2023). DNA methylation signature in NSD2 loss-of-function variants appeared similar to that in Wolf-Hirschhorn syndrome. bioRxiv, 2023. doi:10.1101/2023.01.06.522834
Khazaei, S., Chen, C. C. L., Andrade, A. F., Kabir, N., Azarafshar, P., Morcos, S. M., et al. (2023). Single substitution in H3.3G34 alters DNMT3A recruitment to cause progressive neurodegeneration. Cell 186, 1162–1178. doi:10.1016/j.cell.2023.02.023
Kim, D., Paggi, J. M., Park, C., Bennett, C., and Salzberg, S. L. (2019). Graph-based genome alignment and genotyping with HISAT2 and HISAT-genotype. Nat. Biotechnol. 37, 907–915. doi:10.1038/s41587-019-0201-4
Kuo, A. J., Cheung, P., Chen, K., Zee, B. M., Kioi, M., Lauring, J., et al. (2011). NSD2 links dimethylation of histone H3 at lysine 36 to oncogenic programming. Mol. Cell 44, 609–620. doi:10.1016/j.molcel.2011.08.042
Kurotaki, N., Imaizumi, K., Harada, N., Masuno, M., Kondoh, T., Nagai, T., et al. (2002). Haploinsufficiency of NSD1 causes Sotos syndrome. Nat. Genet. 30, 365–366. doi:10.1038/ng863
La Manno, G., Siletti, K., Furlan, A., Gyllborg, D., Vinsland, E., Mossi Albiach, A., et al. (2021). Molecular architecture of the developing mouse brain. Nature 596, 92–96. doi:10.1038/s41586-021-03775-x
Lee, H., Lin, M.-C. A., Kornblum, H. I., Papazian, D. M., and Nelson, S. F. (2014). Exome sequencing identifies de novo gain of function missense mutation in KCND2 in identical twins with autism and seizures that slows potassium channel inactivation. Hum. Mol. Genet. 23, 3481–3489. doi:10.1093/hmg/ddu056
Lefebvre, J. L., Kostadinov, D., Chen, W. V., Maniatis, T., and Sanes, J. R. (2012). Protocadherins mediate dendritic self-avoidance in the mammalian nervous system. Nature 488, 517–521. doi:10.1038/nature11305
Lhoumaud, P., Badri, S., Rodriguez-Hernaez, J., Sakellaropoulos, T., Sethia, G., Kloetgen, A., et al. (2019). NSD2 overexpression drives clustered chromatin and transcriptional changes in a subset of insulated domains. Nat. Commun. 10, 4843. doi:10.1038/s41467-019-12811-4
Li, H., and Durbin, R. (2009). Fast and accurate short read alignment with Burrows-Wheeler transform. Bioinformatics 25, 1754–1760. doi:10.1093/bioinformatics/btp324
Li, Z., Zhang, X., Xie, S., Liu, X., Fei, C., Huang, X., et al. (2022). H3K36me2 methyltransferase NSD2 orchestrates epigenetic reprogramming during spermatogenesis. Nucleic Acids Res. 50, 6786–6800. doi:10.1093/nar/gkac533
Lin, M.-C. A., Cannon, S. C., and Papazian, D. M. (2018). Kv4.2 autism and epilepsy mutation enhances inactivation of closed channels but impairs access to inactivated state after opening. Proc. Natl. Acad. Sci. U. S. A. 115, E3559–E3568. doi:10.1073/pnas.1717082115
Lister, R., Mukamel, E. A., Nery, J. R., Urich, M., Puddifoot, C. A., Johnson, N. D., et al. (2013). Global epigenomic reconfiguration during mammalian brain development. Science 341, 1237905. doi:10.1126/science.1237905
Long, X., Zhang, L., Zhang, Y., Min, M., Lin, B., Chen, J., et al. (2020). Histone methyltransferase Nsd2 is required for follicular helper T cell differentiation. J. Exp. Med. 217, e20190832. doi:10.1084/jem.20190832
Luo, Y., Hitz, B. C., Gabdank, I., Hilton, J. A., Kagda, M. S., Lam, B., et al. (2020). New developments on the Encyclopedia of DNA Elements (ENCODE) data portal. Nucleic Acids Res. 48, D882–D889. doi:10.1093/nar/gkz1062
Luscan, A., Laurendeau, I., Malan, V., Francannet, C., Odent, S., Giuliano, F., et al. (2014). Mutations in SETD2 cause a novel overgrowth condition. J. Med. Genet. 51, 512–517. doi:10.1136/jmedgenet-2014-102402
Martin, M. (2011). Cutadapt removes adapter sequences from high-throughput sequencing reads. EMBnet.J. 17, 10–12. doi:10.14806/ej.17.1.200
Martin, S., Chamberlin, A., Shinde, D. N., Hempel, M., Strom, T. M., Schreiber, A., et al. (2017). De novo variants in GRIA4 lead to intellectual disability with or without seizures and gait abnormalities. Am. J. Hum. Genet. 101, 1013–1020. doi:10.1016/j.ajhg.2017.11.004
Mountoufaris, G., Chen, W. V., Hirabayashi, Y., O’Keeffe, S., Chevee, M., Nwakeze, C. L., et al. (2017). Multicluster Pcdh diversity is required for mouse olfactory neural circuit assembly. Science 356, 411–414. doi:10.1126/science.aai8801
Nimura, K., Ura, K., Shiratori, H., Ikawa, M., Okabe, M., Schwartz, R. J., et al. (2009). A histone H3 lysine 36 trimethyltransferase links Nkx2-5 to Wolf-Hirschhorn syndrome. Nature 460, 287–291. doi:10.1038/nature08086
Okamoto, N., Miya, F., Tsunoda, T., Kato, M., Saitoh, S., Yamasaki, M., et al. (2017). Novel MCA/ID syndrome with ASH1L mutation. Am. J. Med. Genet. A 173, 1644–1648. doi:10.1002/ajmg.a.38193
Oliviero, G., Brien, G. L., Waston, A., Streubel, G., Jerman, E., Andrews, D., et al. (2016). Dynamic protein interactions of the polycomb repressive complex 2 during differentiation of pluripotent cells. Mol. Cell. Proteomics 15, 3450–3460. doi:10.1074/mcp.M116.062240
Park, J. W., Chae, Y.-C., Kim, J.-Y., Oh, H., and Seo, S.-B. (2018). Methylation of Aurora kinase A by MMSET reduces p53 stability and regulates cell proliferation and apoptosis. Oncogene 37, 6212–6224. doi:10.1038/s41388-018-0393-y
Pertea, M., Pertea, G. M., Antonescu, C. M., Chang, T.-C., Mendell, J. T., and Salzberg, S. L. (2015). StringTie enables improved reconstruction of a transcriptome from RNA-seq reads. Nat. Biotechnol. 33, 290–295. doi:10.1038/nbt.3122
Quinlan, A. R., and Hall, I. M. (2010). BEDTools: a flexible suite of utilities for comparing genomic features. Bioinformatics 26, 841–842. doi:10.1093/bioinformatics/btq033
Rajagopalan, K. N., Chen, X., Weinberg, D. N., Chen, H., Majewski, J., Allis, C. D., et al. (2021). Depletion of H3K36me2 recapitulates epigenomic and phenotypic changes induced by the H3.3K36M oncohistone mutation. Proc. Natl. Acad. Sci. U. S. A. 118, e2021795118. doi:10.1073/pnas.2021795118
Ramírez, F., Dündar, F., Diehl, S., Grüning, B. A., and Manke, T. (2014). deepTools: a flexible platform for exploring deep-sequencing data. Nucleic Acids Res. 42, W187–W191. doi:10.1093/nar/gku365
Robinson, M. D., McCarthy, D. J., and Smyth, G. K. (2010). edgeR: a Bioconductor package for differential expression analysis of digital gene expression data. Bioinformatics 26, 139–140. doi:10.1093/bioinformatics/btp616
Satterstrom, F. K., Kosmicki, J. A., Wang, J., Breen, M. S., De Rubeis, S., An, J.-Y., et al. (2020). Large-scale exome sequencing study implicates both developmental and functional changes in the neurobiology of autism. Cell 180, 568–584.e23. doi:10.1016/j.cell.2019.12.036
Schneider, C. A., Rasband, W. S., and Eliceiri, K. W. (2012). NIH Image to ImageJ: 25 years of image analysis. Nat. Methods 9, 671–675. doi:10.1038/nmeth.2089
Sheffield, N. C., and Bock, C. (2016). LOLA: enrichment analysis for genomic region sets and regulatory elements in R and Bioconductor. Bioinformatics 32, 587–589. doi:10.1093/bioinformatics/btv612
Song, W., Li, Q., Wang, T., Li, Y., Fan, T., Zhang, J., et al. (2022). Putative complement control protein CSMD3 dysfunction impairs synaptogenesis and induces neurodevelopmental disorders. Brain Behav. Immun. 102, 237–250. doi:10.1016/j.bbi.2022.02.027
Stessman, H. A. F., Xiong, B., Coe, B. P., Wang, T., Hoekzema, K., Fenckova, M., et al. (2017). Targeted sequencing identifies 91 neurodevelopmental-disorder risk genes with autism and developmental-disability biases. Nat. Genet. 49, 515–526. doi:10.1038/ng.3792
Streubel, G., Watson, A., Jammula, S. G., Scelfo, A., Fitzpatrick, D. J., Oliviero, G., et al. (2018). The H3K36me2 methyltransferase Nsd1 demarcates PRC2-mediated H3K27me2 and H3K27me3 domains in embryonic stem cells. Mol. Cell 70, 371–379. doi:10.1016/j.molcel.2018.02.027
Südhof, T. C. (2018). Towards an understanding of synapse formation. Neuron 100, 276–293. doi:10.1016/j.neuron.2018.09.040
Sun, Z., Lin, Y., Islam, M. T., Koche, R., Hedehus, L., Liu, D., et al. (2023). Chromatin regulation of transcriptional enhancers and cell fate by the Sotos syndrome gene NSD1. Mol. Cell 83, 2398–2416. doi:10.1016/j.molcel.2023.06.007
Tanigawa, Y., Dyer, E. S., and Bejerano, G. (2022). WhichTF is functionally important in your open chromatin data? PLoS Comput. Biol. 18, e1010378. doi:10.1371/journal.pcbi.1010378
Tatton-Brown, K., and Rahman, N. (2007). Sotos syndrome. Eur. J. Hum. Genet. 15, 264–271. doi:10.1038/sj.ejhg.5201686
Tian, T. V., Di Stefano, B., Stik, G., Vila-Casadesús, M., Sardina, J. L., Vidal, E., et al. (2019). Whsc1 links pluripotency exit with mesendoderm specification. Nat. Cell Biol. 21, 824–834. doi:10.1038/s41556-019-0342-1
Trubetskoy, V., Pardiñas, A. F., Qi, T., Panagiotaropoulou, G., Awasthi, S., Bigdeli, T. B., et al. (2022). Mapping genomic loci implicates genes and synaptic biology in schizophrenia. Nature 604, 502–508. doi:10.1038/s41586-022-04434-5
van der Velde, A., Fan, K., Tsuji, J., Moore, J. E., Purcaro, M. J., Pratt, H. E., et al. (2021). Annotation of chromatin states in 66 complete mouse epigenomes during development. Commun. Biol. 4, 239. doi:10.1038/s42003-021-01756-4
Wang, H., Liu, J., Li, F., Teng, Z., Liu, M., and Gu, W. (2022). Novel heterozygous missense variant in GRIA4 gene associated with neurodevelopmental disorder with or without seizures and gait abnormalities. Front. Genet. 13, 859140. doi:10.3389/fgene.2022.859140
Wang, T., Guo, H., Xiong, B., Stessman, H. A. F., Wu, H., Coe, B. P., et al. (2016). De novo genic mutations among a Chinese autism spectrum disorder cohort. Nat. Commun. 7, 13316. doi:10.1038/ncomms13316
Weinberg, D. N., Papillon-Cavanagh, S., Chen, H., Yue, Y., Chen, X., Rajagopalan, K. N., et al. (2019). The histone mark H3K36me2 recruits DNMT3A and shapes the intergenic DNA methylation landscape. Nature 573, 281–286. doi:10.1038/s41586-019-1534-3
Whyte, W. A., Orlando, D. A., Hnisz, D., Abraham, B. J., Lin, C. Y., Kagey, M. H., et al. (2013). Master transcription factors and mediator establish super-enhancers at key cell identity genes. Cell 153, 307–319. doi:10.1016/j.cell.2013.03.035
Yao, B., and Jin, P. (2014). Unlocking epigenetic codes in neurogenesis. Genes Dev. 28, 1253–1271. doi:10.1101/gad.241547.114
Yu, G., Wang, L.-G., and He, Q.-Y. (2015). ChIPseeker: an R/Bioconductor package for ChIP peak annotation, comparison and visualization. Bioinformatics 31, 2382–2383. doi:10.1093/bioinformatics/btv145
Zanoni, P., Steindl, K., Sengupta, D., Joset, P., Bahr, A., Sticht, H., et al. (2021). Loss-of-function and missense variants in NSD2 cause decreased methylation activity and are associated with a distinct developmental phenotype. Genet. Med. 23, 1474–1483. doi:10.1038/s41436-021-01158-1
Zhang, J., Lee, Y.-R., Dang, F., Gan, W., Menon, A. V., Katon, J. M., et al. (2019). PTEN methylation by NSD2 controls cellular sensitivity to DNA damage. Cancer Discov. 9, 1306–1323. doi:10.1158/2159-8290.CD-18-0083
Zhang, Y., Tachtsidis, G., Schob, C., Koko, M., Hedrich, U. B. S., Lerche, H., et al. (2021). KCND2 variants associated with global developmental delay differentially impair Kv4.2 channel gating. Hum. Mol. Genet. 30, 2300–2314. doi:10.1093/hmg/ddab192
Zheng, Y., Zhao, C., Song, Q., Xu, L., Zhang, B., Hu, G., et al. (2023). Histone methylation mediated by NSD1 is required for the establishment and maintenance of neuronal identities. Cell Rep. 42, 113496. doi:10.1016/j.celrep.2023.113496
Zhou, Y., Zhou, B., Pache, L., Chang, M., Khodabakhshi, A. H., Tanaseichuk, O., et al. (2019). Metascape provides a biologist-oriented resource for the analysis of systems-level datasets. Nat. Commun. 10, 1523. doi:10.1038/s41467-019-09234-6
Zhuang, L., Jang, Y., Park, Y.-K., Lee, J.-E., Jain, S., Froimchuk, E., et al. (2018). Depletion of Nsd2-mediated histone H3K36 methylation impairs adipose tissue development and function. Nat. Commun. 9, 1796. doi:10.1038/s41467-018-04127-6
Zoghbi, H. Y., and Bear, M. F. (2012). Synaptic dysfunction in neurodevelopmental disorders associated with autism and intellectual disabilities. Cold Spring Harb. Perspect. Biol. 4, a009886. doi:10.1101/cshperspect.a009886
Zollino, M., Murdolo, M., Marangi, G., Pecile, V., Galasso, C., Mazzanti, L., et al. (2008). On the nosology and pathogenesis of Wolf-Hirschhorn syndrome: genotype-phenotype correlation analysis of 80 patients and literature review. Am. J. Med. Genet. C Semin. Med. Genet. 148C, 257–269. doi:10.1002/ajmg.c.30190
Keywords: NSD2, neurodevelopmental disorder, RNA sequencing, ChIP sequencing, H3K36me2
Citation: Kinoshita S, Kojima K, Ohnishi E, Takayama Y, Kikuchi H, Takada S, Nakabayashi K, Kawai T and Hata K (2024) Loss of NSD2 causes dysregulation of synaptic genes and altered H3K36 dimethylation in mice. Front. Genet. 15:1308234. doi: 10.3389/fgene.2024.1308234
Received: 06 October 2023; Accepted: 29 January 2024;
Published: 14 February 2024.
Edited by:
Valentina Massa, University of Milan, ItalyReviewed by:
Guerau Fernandez, Sant Joan de Déu Hospital, SpainAnna Stroynowska-Czerwinska, Polish Academy of Sciences, Poland
Copyright © 2024 Kinoshita, Kojima, Ohnishi, Takayama, Kikuchi, Takada, Nakabayashi, Kawai and Hata. This is an open-access article distributed under the terms of the Creative Commons Attribution License (CC BY). The use, distribution or reproduction in other forums is permitted, provided the original author(s) and the copyright owner(s) are credited and that the original publication in this journal is cited, in accordance with accepted academic practice. No use, distribution or reproduction is permitted which does not comply with these terms.
*Correspondence: Kenichiro Hata, a2hhdGFAZ3VubWEtdS5hYy5qcA==