Abstract
Gene transcription is a stochastic process that occurs in all organisms. Transcriptional bursting, a critical molecular dynamics mechanism, creates significant heterogeneity in mRNA and protein levels. This heterogeneity drives cellular phenotypic diversity. Currently, the lack of a comprehensive quantitative model limits the research on transcriptional bursting. This review examines various gene expression models and compares their strengths and weaknesses to guide researchers in selecting the most suitable model for their research context. We also provide a detailed summary of the key metrics related to transcriptional bursting. We compared the temporal dynamics of transcriptional bursting across species and the molecular mechanisms influencing these bursts, and highlighted the spatiotemporal patterns of gene expression differences by utilizing metrics such as burst size and burst frequency. We summarized the strategies for modeling gene expression from both biostatistical and biochemical reaction network perspectives. Single-cell sequencing data and integrated multiomics approaches drive our exploration of cutting-edge trends in transcriptional bursting mechanisms. Moreover, we examined classical methods for parameter estimation that help capture dynamic parameters in gene expression data, assessing their merits and limitations to facilitate optimal parameter estimation. Our comprehensive summary and review of the current transcriptional burst dynamics theories provide deeper insights for promoting research on the nature of cell processes, cell fate determination, and cancer diagnosis.
1 Introduction
There are currently two primary recognized modes of gene expression: constitutive and bursty. Explosive transcription is a common occurrence in the human genome. In 2012, Dar et al. provided strong evidence of a theoretical framework for comparing gene expression patterns in cellular expression profiles (Dar et al., 2012). Transcriptional bursting represents a type of molecular dynamics that manifests as the heterogeneous expression of identical genes across different cells. The stochastic nature of transcriptional bursting and its potential for feedback regulation are integral to the maintenance of complex networks of biochemical interactions in living organisms.
An electron microscopy imaging study in the 1970s provided direct visual evidence of the discontinuous transcription of genes. Miller chromatin spreads from Drosophila embryos showed nascent transcripts distributed unequally along the gene sequence (Miller Jr and McKnight, 1979). The advent of fluorescence microscopy has advanced gene expression detection techniques such as single-molecule fluorescence in situ hybridization (smFISH) (Femino et al., 1998) and RNA phage MS2 stem-loop detection methods (Bertrand et al., 1998) on fixed cells. The studies in single cells have consistently recorded the rapid emergence and subsequent short-term disappearance of multiple mRNAs within a single gene (Raj et al., 2006; Battich et al., 2013; Larson et al., 2013; Lenstra et al., 2016). These imaging techniques not only confirm the discontinuity of transcription but also reveal transcriptional bursting that occurs on a timescale of minutes. In eukaryotes and prokaryotes, the dynamics of rapidly producing large amounts of mRNA in a short period is referred to as a “transcriptional burst”. Given the myriad life processes ongoing within an organism, cells continuously adjust their transcription processes to meet the demands of these activities. However, the internal dynamics of this process are complex (Tunnacliffe and Chubb, 2020). The study of rapid balance of gene states determines the state and function of discrete phenotypic cells, and feedback regulation significantly affects the switching of individual gene states (Ge et al., 2015). Ge et al. proposed a wave rate model to investigate the effect of random gene state switching dynamics by operons on the regulation of cell phenotypic specificity (Ge et al., 2018). Investigating the characteristics of transcriptional bursting, including the size and frequency of bursts and the degree of response to environmental, chemical, and genetic stimuli, we provide insights into the principles of transcriptional functions within the nucleus at the single-molecule level. Moreover, studies have reported that variations in the transcriptional bursting features can alter the cellular state (Fritzsch et al., 2018; Wang and Wang, 2021). Different cellular states can in turn influence the dynamics of transcription initiation and elongation (Mines et al., 2022). This is dependent on the interaction between internal and external noises, forming a rudimentary feedback loop in the regulation network. Transcriptional burst models of gene expression often discretize the continuous dynamics of gene expression into mathematical models of promoter switching. One of the earliest models used to describe gene expression was the protein synthesis model based on a Markovian framework (Peccoud and Ycart, 1995), known as the stochastic telegraph model of gene expression. This model characterizes the random switching of genes between the active and inactive states. With advancements in sequencing technology, the moment estimation method for inferring parameters in protein models has been improved to inferred mRNA models (Larsson et al., 2019). However, simplifying gene expression mechanisms by ignoring the complexity of intermediate states sacrifices many hidden stochastic molecular processes (Fritzsch et al., 2018). Therefore, Schwabe et al., Rodriguez et al., and Jia et al. independently developed multi-state models to map the mechanisms of sequence-encoded regulation on a genome-wide scale (Schwabe et al., 2012; Larsson et al., 2019; Jia and Grima, 2023). The steady-state solution of the analytical model reflects the dynamic equilibrium state of the gene expression system. In 2013, Kim et al. presented the Poisson-beta model based on the steady-state solution of the telegraph model, which was the first use of single-cell RNA sequencing (scRNA-seq) data (Kim and Marioni, 2013). In 2017, Jiang et al. proposed the SCALE framework to overcome ignoring technical variations in the model and attributed the source of noise in PHO5 gene expression to nucleosome occupation and the differential expression of genes to the regulation of burst frequency (Jiang et al., 2017). In 2019, Larsson et al. inferred burst frequency and burst size from endogenous mouse and human genes using scRNA-seq data, which provided insights into how cis-regulatory sequences and transcriptional machinery govern these bursting characteristics (Larsson et al., 2019). Integrating transcriptional bursting with other factors or investigative methods is essential for the study of gene expression, regulation of gene activity, and the specificity of gene functions. In 2024, Wang et al. developed a comprehensive framework that integrated the dynamics of chromatin accessibility and transcriptional bursting (Wang et al., 2024). They enriched the theoretical modeling of gene expression mechanisms by constructing a stochastic gene expression model with feedback regulation. This model combines static promoter structures and dynamic regulatory networks using scRNA-seq data. In the same year, Fallacaro et al. quantified the molecular dynamics of transcription factor-specific hubs in Drosophila embryos using imaging technology and single-molecule tracking (Fallacaro et al., 2024). Their study showed that variations in burst duration, magnitude, and frequency control the different ways in which genes are expressed in the same cell nucleus (Fallacaro et al., 2024). Recently, Mayer et al. developed a gene expression model for multinucleated cells and showed that the division of transcriptional labor allows the syncytium to circumvent the tradeoff between gene expression efficiency and precision (Mayer et al., 2024). The stochastic nature of gene expression originates from regulation at different levels; intracellularly, multiple copies of the same gene can achieve similar developmental expression patterns during transcriptional bursting and receive distinct regulatory inputs for individual genes, a process that contributes to protein function diversity. Transcriptional bursting can affect expression states and behaviors by altering the communication between cells. This behavior results in the diversity and specificity of non-genetic transcription and sensitivity of cellular states to external interventions. Moreover, it affects how cells respond to the microenvironment and the modes of cell death. In emerging fields, such as spatiotemporal molecular medicine, transcriptional bursting provides novel insights into the molecular mechanisms underlying drug resistance (Wang and Wang, 2021).
The above studies either focused on specific medical directions without sufficient evidence or experimental results to support a unified conclusion (Rodriguez and Larson, 2020; Tunnacliffe and Chubb, 2020; Wang and Wang, 2021). The natural question is how to more comprehensively explain the stochasticity in the gene expression process using models or how to use advanced technology, such as scRNA-seq technology, to investigate the dynamics of transcriptional bursting in gene expression.
In this study, we provide a comprehensive review of the research contributions and current popular focus areas related to the mechanisms of transcriptional bursting, beginning with a systematic combination of various gene expression models and their applicability. Second, we elaborate on and summarize the key indicators of transcriptional bursting, the temporal scale separation of species-related mechanisms, and their degrees of impact. We then show the strategies for gene expression models from different perspectives and the philosophies, advantages, and disadvantages of classical parameter inference methods. Finally, we delve into the omics of single-cell data that drive the establishment of new gene expression mechanism models. We focus on the latest advancements and potential developments in the study of the mechanisms of transcriptional bursting dynamics. We further discuss the possible methods for exploring these dynamics and meaningful research directions. This study provides a comprehensive synthesis guidance for researchers in this field.
2 Models and methods
2.1 Gene expression model
In multicellular organisms, the configuration or compositional elements of promoters are crucial molecular mechanisms that determine transcriptional bursts. This is reflected in the allocation of promoter states and the stochastic pausing associated with the formation of specific biomolecular complexes at these promoters. The nucleosome in eukaryotes is the basic structural unit of chromatin, where the nucleosome is formed by combining DNA with histone proteins. The tight structure of chromatin leads to the silencing of genes, which is not conducive to transcription. During the slow opening of the DNA strand on the nucleosome, the gene will go through multiple deactivated states and eventually bind to transcriptional regulatory elements to activate transcription (Minnoye et al., 2021). At the transcriptional level, one way of the gene expression regulating is through induction fine-tuning, and an inducible gene is silenced most of the time. Such genes are briefly expressed when activated by external signals such as hormones, sugar and temperature. In order to model this biological process, Peccoud et al. first constructed model of the random switching of promoter states, which included the random switching of promoters between active and inactive states (Peccoud and Ycart, 1995). Two-state model of gene expression is commonly used as the random transcription model. However, for genome-wide studies, many experiments and theories have led to the development of multistep models to reflect the transcriptional dynamics and explain the heterogeneity of developmental gene expression. Here, we present the existing classical promoter state-switching models that represent one of the important advancements in understanding gene expression dynamics.
2.1.1 One-state model
To explore the source of heterogeneity in transcriptional dynamics and the most essential cause of random fluctuations, we need to understand the most basic one-state model of gene expression (the constitutive gene expression model). The one-state model describes the birth and death processes of gene products. Gene expression models describe genes that have multiple activated (ON) and inactivated (OFF) states: in the ON state, genes produce RNAs continuously at a constant rate, while existing RNA transcripts are degraded at a constant rate; in the OFF state, they stop producing RNAs, yet the degradation of existing RNA transcripts continues, as in the ON state. The one-state model of gene expression generally includes only a single active state (see Figure 1A) (Klindziuk and Kolomeisky, 2018), and some experiments have shown that the burst size of the gene follows a geometric distribution (Paulsson and Ehrenberg, 2000; Golding et al., 2005). At this point, the transcription process of the gene involves two simultaneous activities: the generation of RNA molecules at a constant rate and the degradation of RNA molecules at a constant rate. The rate is proportional to the number of existing RNA transcripts in the system. The one-state model consists of two effective reactions.
FIGURE 1

Classical transcriptional burst model of random gene expression (A) The one-state model of gene expression, where represents the transcription rate of RNA (B) The two-state model of gene expression (the random telegraph model), represents the translation rate of protein production, represents the rate of gene activation, represents the rate of gene inactivation, represents the rate of mRNA degradation, and represents the rate of protein degradation (C) The three-state model of gene expression includes the inactived state of two genes: the deeply inactived state and the inactived state (D) The classical chain four-state model of gene expression includes the inactived states of three genes: deep inactived state , deep inactived state , and inactived state (E) The circular multi-state model of gene expression, consisting of multiple discrete gene inactived states and one activated state (F) The continuum model of gene expression, consisting of an actived state and an inactive state of a gene, and regulatory factors continuously regulating transcriptional initiation behavior over a long period.
Single-molecule RNA fluorescence in situ hybridization (smFISH) can measure differences in RNA abundance and reveal differences between cells; however, the one-state model is not suitable for highly variable smFISH data (Nicolas et al., 2017). Furthermore, the steady-state distribution of the RNA molecules produced by the one-state model conforms to a Poisson distribution. However, this unique distribution of variance, equal to the mean, could not cover the transcriptional distribution of all genes and could not account for the overdispersion phenomenon in the results of the difference significance test of gene expression. Paulsson et al. found that adding additional gene expression states to the model could explain the differential expression phenomenon based on smFISH data (Paulsson, 2005).
2.1.2 Two-state model
Studies on transcription in both prokaryotic and eukaryotic systems have yielded conflicting evidence about the primary modes of gene expression over extended periods. Several studies have focused on the elevated expression of mRNA alone (Golding et al., 2005; Taniguchi et al., 2010). By constructing a three-dimensional noise-space analysis framework, Dar et al. quantitatively analyzed the dynamic expression behavior of 8,000 gene loci and proved that the majority of human genomic loci appear to stochastically fire during episodic bursts. Combined with the high production rate and short activation time, bursting kinetics enable a more realistic distribution than previously studied one-state models (Herbach, 2019).
The two-state model of gene expression (see Figure 1B), is a phenomenological model that quantifies the burst dynamics of genes (Peccoud and Ycart, 1995). It does not require specifying the molecular identity of the burst parameters (Lammers et al., 2020). It can produce mRNA distributions of various shapes and mRNA copy numbers to reveal the underlying dynamics of the promoters. For example, short activation states cause long tails and high (hyperPoisson) variances in mRNA distributions; the slow promoter conversion rate and long waiting time for activated and inactivated states of the promoter cause two peaks in the mRNA distribution (Nicolas et al., 2017). The complete chemical reaction, based on the two-state model, is as follows:
The assumptions of the two-state model are brief but limited, and models containing multiple actived or inactived states are increasingly becoming alternatives to modeling transcription mechanisms that cannot be explained by them (Neuert et al., 2013; Bothma et al., 2014). This requires a careful balance between overfitting and predictive power of the model. Transcriptional burst behavior occurs on multiple timescales (see section 2.2 for details). The transcriptional burst gene expression models are a characterization of the degree of discretization of a continuous process in which chromatin compact structures are fully opened and fully closed. Promoter activity states have different fluctuations on multiple time scales; importantly, the transition between states may involve multiple rate-limiting steps, branching pathways, and molecular events (Tantale et al., 2016). However, the two-state model does not account for randomness.
2.1.3 Three-state model
Genes produce mRNAs almost simultaneously at an unsteady rate, followed by a period of deactivation. Several models have focused on regulating parameters such as burst size and burst frequency to understand these dynamics (Brouwer and Lenstra, 2019). The two-state model largely fails to satisfactorily describe the transcription process. The two-state model assumes that burst decentralization is a secondary issue of transcription, occurring only because of specific internal molecular noise, and does not account for external sources of variation. In fact, chromatin opening is a slow process, and genes go through the refractory period before being activated again. Thus, a direct case for expanding the two-state model is to increase the refractory period (Suter et al., 2011a). The refractory period extends the two-state model to a three-state model (Figure 1C). The three-state model refines the long-occupied inactive state into a deeply inactive state and an inactive state . The complete chemical reaction, based on the three-state model, is as follows:
The latter allows a faster switch to the active state (Brouwer and Lenstra, 2019; Rodriguez et al., 2019). The three-state model also contains some variants (Figure 2(A1-A2)). The type-1 three-state model of gene expression (Figure 2A1) has multiple sub-OFF states, with the TATA-box binding protein (TBP) being a key protein and an important target for gene regulation (Tantale et al., 2016). An intermediate state appears when TBP is bound, and the long state appears when TBP is dissociated, encompassing the states of two non-licensing periods: and . The type 2 three-state model of gene expression type 2 (Figure 2A2), where RNA Polymerase II (RNA Pol II) pausing occurs on a minute timescale, is characterized by forced pausing (Pimmett et al., 2021). The three-state model with obligatory pause describes the systematic entry of all RNA Pol II molecules into a paused state, followed by extension and pause in mRNA production, while the three-state model with non-obligatory pause describes a random entry of a subset of RNA Pol II molecules into a paused state, followed by extension and pause in mRNA production.
FIGURE 2
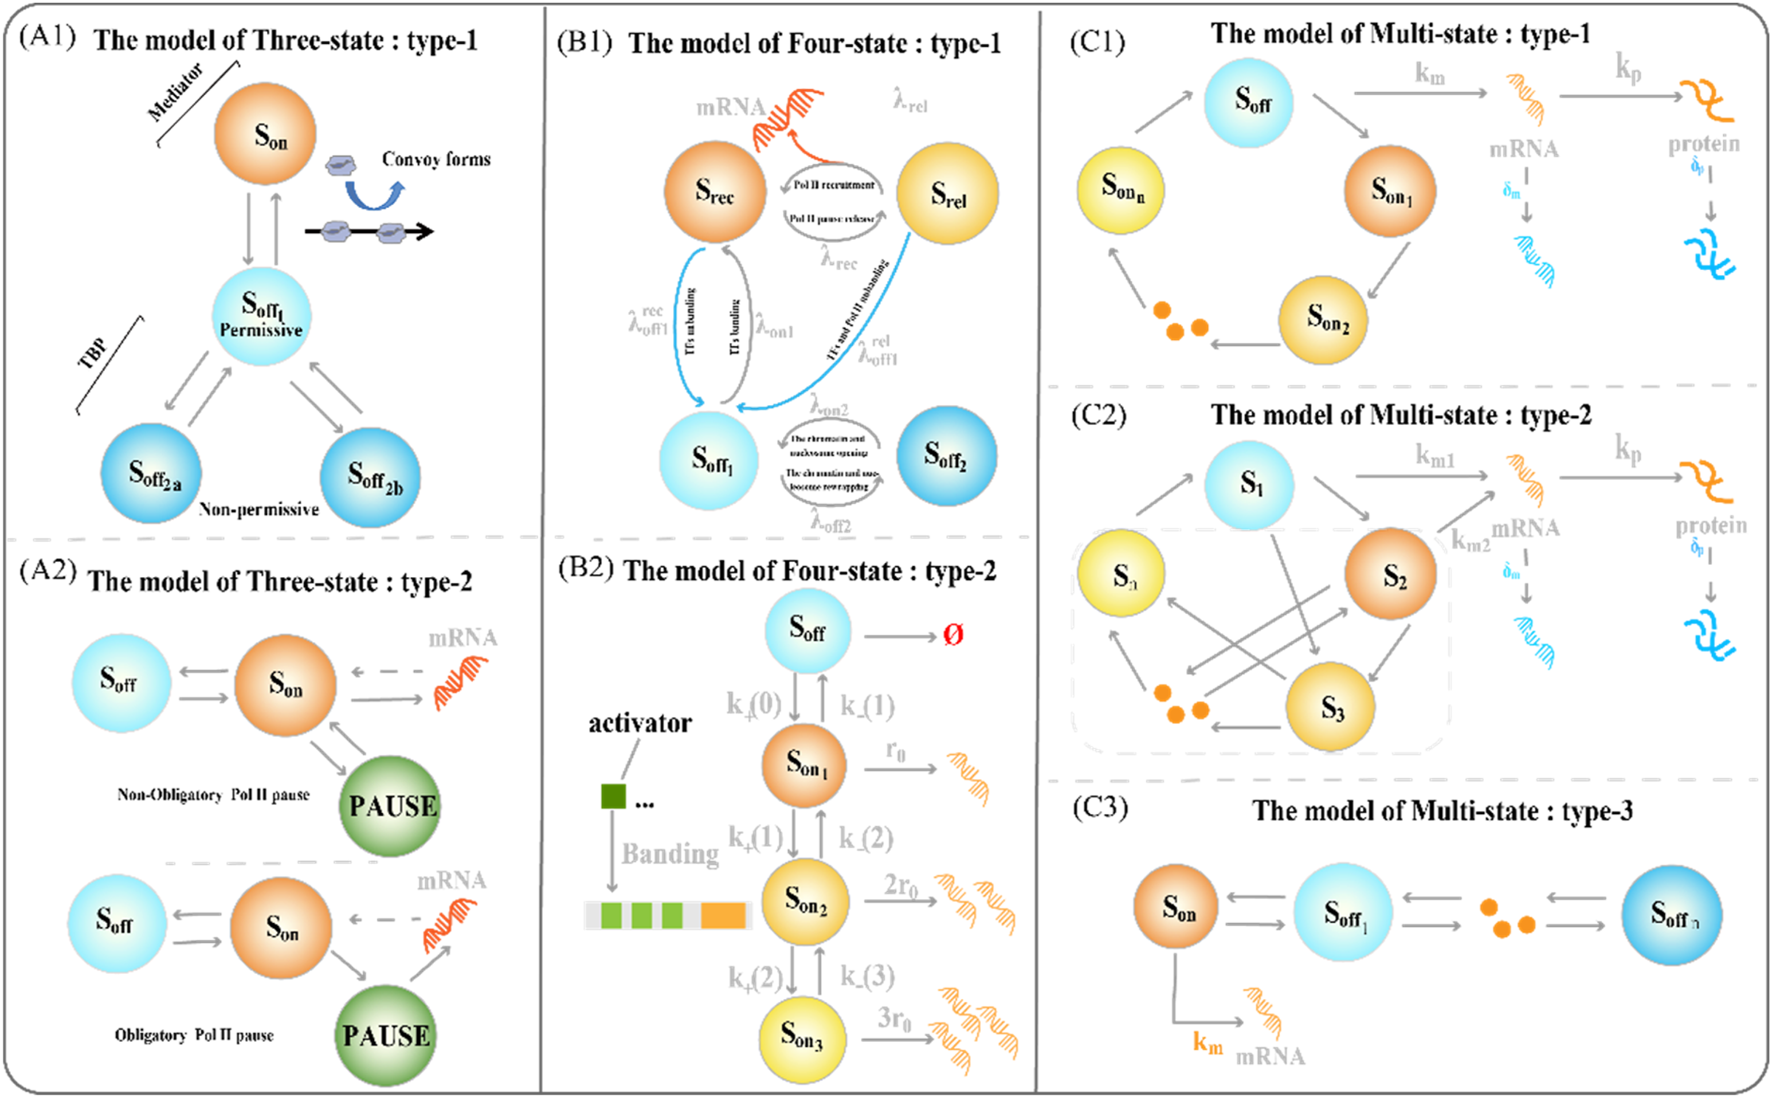
Classical transcriptional burst model of random gene expression (A1) The type-1 three-state model of gene expression. The regulation of the key factor TATA-box binding protein (TBP) determines the structure of the sub-OFF state (A2) The type 2 three-state model of gene expression type 2. The different degrees of RNA polymerase suspension shaped variants of the two three-state models (B1) The type-1 four-state model of gene expression integrates a framework that combines chromatin accessibility with transcriptional burst dynamics (B2) The type-2 four-state model type of gene expression consists of one inactive state and three activated states (C1) The type-1 multi-state model of gene expression consists of one inactive state and three activated states (C2) The type-2 circular multi-state model of gene expression consists of one activated state and several discrete inactivated states, with arbitrary connections between states (C3) The type-3 chain multi-state model of gene expression consists of one inactive state and several discrete sequentially activated states.
2.1.4 Four-state model
To refine the process of the slow opening of chromatin and capture important random events, we often need to add more states to accurately describe how static promoter sequences encode transcriptional burst dynamics. The classical four-state model of gene expression is a chain model (Figures 1D, 2B2) (Neuert et al., 2013; Rodriguez et al., 2019; Lammers et al., 2020). Furthermore, the integration of promoter-switching models with other dynamic models aims to uncover gene expression mechanisms that encompass more comprehensive information. Recently, Wang et al. addressed how upstream genomic spatial organization, particularly enhancer-promoter spatial communication, affects downstream transcriptional bursting dynamics by constructing a four-state model (Figure 2B1) (Wang et al., 2024). The OFF state of the model contains a deep inactive state () and an activated but inactive state (), whereas the ON state of the model contains the Pol II recruitment state ( (Fuda et al., 2009)) and Pol II suspended release state ( (Chen et al., 2017)). Genes synthesize mRNA during the transition from state to state. The number of rate-limiting steps in gene transcription is usually small; therefore, the Markov’s four-state model can balance feasibility and efficiency. However, the context-specific four-state model is limited in its interpretation of transcriptional phenomena involving other molecular processes.
2.1.5 Multi-state model
Early research on bacteria developed a series of in vitro single-molecule and live-cell experiments to model transcriptional bursting, where the waiting time between states of the two-state model follows an exponential distribution (Chong et al., 2014). However, there is a “refractory” behavior in genes transcription of mammalian cells that produces a distribution of non-exponential peaks (Suter et al., 2011a). Promoters with multiple activation states also exist, resulting in a non-exponential distribution of activated state wait times (Sepúlveda et al., 2016). Corrigan et al. found that continuously varying activation states can describe experimental data more accurately than discrete states, enabling a wide dynamic range of cellular responses to stimuli (Corrigan et al., 2016). The “refractory” behavior in this gene reflects molecular memory, and the existence of molecular memory in different states further affects the differential peak shape of gene product number distribution. In fact, molecular memory is a feedback mechanism for inducing bimodal, fine-tuning expression noise, and inducing promoter-switching memory (Zhang and Zhou, 2019). Molecular memory is a non-Markov process that simulates reactions within cells, helping to identify more molecular details of biological processes. The previous model reduced the non-Markov problem to a Markov problem without considering that the switching of gene states between active and inactive states is a multi-step process. At present, there have been studies to reveal the non-Markov properties of kinetics by modeling the waiting time of each state as a non-exponential distribution. We introduce these models in the following sections.
2.1.5.1 Typical multi-state model
Understanding how multiple interacting elements cause genes to switch randomly between different depths of active states during transcription is crucial. Therefore, we constructed a multi-state model of gene expression to study the dynamics of transcriptional bursts. A chain multi-state model is the first to explain this complex promoter-switching mechanism (Figure 2C3). Previous studies focused on the steady-state behavior of systems. The steady-state distribution of mRNA copy numbers usually satisfies the generalized hypergeometric functions. A natural choice is to extend the chain multi-state model to a ring model with one active and multiple inactive gene states (Figure 1E).
From the perspective of the transient behavior of the system, Jia et al. studied the time-dependent distribution of mRNA and protein copy number (Jia and Li, 2023). They integrated multiple promoter configurations to establish a gene expression model that described complex promoter switching. The complete chemical reactions based on this model are as follows:
Where the parameter follows a geometric distribution, . The first line of reaction in the system indicates that the promoter switches between all gene states at the rate ; the second line of reaction describes the generation of gene product in all gene states. When , the generation of gene product is constitutive, and when , the generation of gene product is bursty. The last line of reactant shows that the gene product decays at rate . The rate and indicate the reaction tendency functions and describe the state switch of the promoter. When the promoter is in the state, the gene product is produced at rate , and when the promoter is in the state, the gene product is produced at rate . When , is active state, , is inactive. In this case, the active period presents an exponential distribution, and the corresponding model is called the multiple OFF states model (Figure 2C1), and the inactive period may present a non-exponential distribution. When is inactive, , , is the active state, the active period is non-exponential distribution, and the corresponding model is called the multiple ON states model (Figure 2C2). Dividing multi-state models directly based on the activation state of genes is a simple and direct approach. Some studies categorize multi-state models according to the waiting time of the activation state (Daigle et al., 2015).
2.1.5.2 Continuum model
The snapshot data obtained from the population of dead cells via scRNA-seq did not allow the observation and quantification of the continuous evolution of transcriptional behavior over time (Chubb et al., 2006). A quantitative imaging study of actin gene transcription revealed that its activity of gene transcription is not strictly discrete, but resembles a continuous or dynamic spectrum of states (Corrigan et al., 2016). This suggests that there is a wide dynamic range of cellular responses to stimulation. Corrigan et al. constructed a continuum model of gene expression based on the two-state burst model (Corrigan et al., 2016). This model includes a long-term inactivated state of the gene and the activation state of genes that continuously switch due to slow fluctuations in the activation rate (Figure 1F). The continuum model simulates suitable dynamic gene expression data for the immediate response of cells to stimuli (Featherstone et al., 2015) and provides a suitable scenario for interpreting the continuous output of transcriptional products (Sepúlveda et al., 2016). The study found that most promoters have more than two effective states (Harper et al., 2011; Zhang et al., 2012). In the multi-state model, transitions between switching states expand the reaction steps to describe more complex transcriptional burst regulation mechanisms (Schwabe et al., 2012).
2.1.6 Comparison of models
The telegraph model first rigorously links transcriptional dynamics to random gene expression. Researchers commonly use the two-state model for gene expression studies owing to the conciseness of its assumptions. The simplicity of this model stems largely from the assumption of constant rates during gene state switching and transcription. Morepver, these assumptions attribute burst behavior to internal molecular noise, without accounting for the influence of external variant signals. In particular, the two-state model is insufficient to explain the dynamic process of eukaryotic gene transcription that involves a large number of regulatory proteins and cofactors (Schwabe et al., 2012). Earlier reports have added to the bias between the refractory period and the two-state model; the bias extends to the three-state model, which includes refined periods of activity and inactivity (Suter et al., 2011a). The advantage of this model is in its ability to explain the control of explosive mRNA production and is suitable for genome-wide studies. However, it may lead inefficient information transfer in multi-state transcription. Models with only one or two gene states cannot accurately describe the dynamic transcription of several genes. Multi-state models can avoid these limitations of and offer a more accurate depiction of gene expression dynamics (Elgart et al., 2011; Schwabe et al., 2012; Zhang and Zhou, 2014; Zoller et al., 2015; Livingston et al., 2023; Wang et al., 2023; Chen et al., 2024). However, researchers have guided the design of the model based on prior knowledge of the system, specific research objectives, and the subjects limiting it. Table 1 summarizes the advantages and disadvantages of the various gene expression models.
TABLE 1
| Model | Bcr | Advantage | Disadvantage | Ref. |
|---|---|---|---|---|
| One-State Model | Equation 1 | A fixed initiation rate | Lack of complexity Overdispersion |
Klindziuk and Kolomeisky (2018) |
| Two-State Model | Equation 2 | Widely applicable Distribution BS Steady-state distribution of mRNA. |
Constant rate Lack of randomness No external noise |
Peccoud and Ycart (1995), Lammers et al. (2020) |
| Three-State Model | Equation 3 | Controlled burst synthesis Genome-wide applicability |
Inefficiency of information transfer | Suter et al. (2011a), Tantale et al. (2016), Pimmett et al. (2021) |
| Lack of complexity | ||||
| Multi-State Model | Equation 4 | Gene regulation High flexibility |
Clear object of study | Daigle et al. (2015), Corrigan et al. (2016), Chen et al. (2024) |
| Specific prior assumption |
Summary and comparison of random gene expression models, where BCR is biochemical reaction.
Overall, using a two-state model to simplify the description of a gene’s transcriptional burst should not be the default approach; likewise, some form of multi-state structure is not guaranteed to be more descriptive (Nicolas et al., 2017). Therefore, we must choose the most suitable model that can best reveal the nature of the differentiation destiny of a certain organism according to various data types to achieve a better match between the theoretical model and experimental data. In addition, the gene expression models we constructed were all independent models based on specific problem situations, with a large number of models and varying degrees of complexity. Therefore, biological processes in complex biological systems require the integration of multiple models for regulation. Random telegraph model can be used as the basic unit to construct interaction gene regulatory networks (Herbach et al., 2017).
Traditional multi-state models of gene expression lack the ability to capture randomness affecting observed mRNA numbers, such as the inability of telegraph models to account for the effects of external noise on gene transcription and switching rates. Fortunately, several studies have addresssed this by modeling the effects of noise on mRNA and protein abundances, that can affect parameter estimates, from data and model driven perspectives, respectively. From a model perspective, Durrieu et al. coupled gene expression to cell size and cell-specific nuclei (Durrieu et al., 2023); Jia et al. and Wang et al. correlated polymorphic models of gene expression with cell size, cell cycle stage, and gene dosage compensation coupling (Jia and Grima, 2023) (Wang et al., n.d.); and Thomas et al. coupled gene expression with cell division and cell differentiation (Thomas and Shahrezaei, 2021). From a data perspective, Tang et al. considered the effects of cell size and counting noise on gene expression (Tang et al., 2023), and Grima et al. identified the source of external noise in gene expression based on parameter deviation characteristics (Grima and Esmenjaud, 2024). In conclusion, focusing on improving model randomness in gene expression research is more in line with the complexity of biochemical systems.
2.2 Molecular mechanism of transcriptional burst and its regulatory factors
2.2.1 Time scale of transcriptional burst mechanism
Bacteria, as representative prokaryotes, and mammalian cells, as representative eukaryotes, intermittently produce transcripts on different timescales. The synthesis and processing of these products involve molecular mechanisms across multiple scales of time. The experimental results of gene expression measurements at different time resolutions, ranging from milliseconds to days (Harper et al., 2011; Fritzsch et al., 2018; Rodriguez et al., 2019), provide a basis for understanding gene regulation mechanisms.
The duration of a transcriptional burst is the sum of the time course during which multiple transcription initiation events occur (Wang et al., 2018). Despite advances in imaging techniques and single-cell sequencing, the accurate measurement of the duration of transcriptional bursts remains challenging. The existence of multiple time scales Figure 3 can be explained by variations in the duration of individual transcriptional bursts across different organisms and genes (Figure 3 (1–3), Table 2 and 3) and variations in the temporal resolution of different underlying molecular processes related to transcription (Figure 3 (4–11) and Table 4). Experiments by Pichon et al. on the molecular activity of the TATA-binding protein (TBP) and the pre-initiation complex (PIC) revealed the following three timescales of promoter activation in steady-state systems (Pichon et al., 2018): (1) long inactive periods and brief active periods, (2) 1-min transcriptional intervals produced by TBP binding, and (3) faster fluctuations between active and inactive promoter states induced by TBP binding and subsequent molecular activities. It is critical to determine the timescales of the transcription process and build interpretable and analyzable mathematical models of promoter states. Different genes display distinct bursting characteristics in biological processes with different timescales, and regulation of burst size influences the degree to which cells respond to stimuli and the extent of variability in downstream gene products.
FIGURE 3

Temporal scale separation of transcriptional bursting and its underlying molecular processes across different species. The time scales of transcriptional bursts at different species levels are shown above the time scale arrows. The time scales of potential molecular processes associated with transcriptional bursts are shown below the time scale arrows (A) Transcriptional bursts in an embryo of the fruit fly Drosophila melanogaster, yeast, and bacteria occur on timescales of a few minutes (B) Transcriptional bursts in the nematode Caenorhabditis elegans occur on timescales of minutes to hours (C) Transcriptional bursts in human cells occur on timescales of a few hours (D) The process of DNA wrapping or unwrapping of nucleosomes occurs on timescales of milliseconds (E) Nucleosome turnover in the chromatin of eukaryotic cells occurs on timescales of minutes to hours (F) Histone modification occurs on timescales of minutes to days (G) Transcription factor binding occurs on timescales of a few seconds (H–I) Enhancer-promoter interaction and transcription initiation occur on timescales of seconds to minutes (J) RNA polymerase cluster kinetics occurs on timescales of seconds to minutes (K) Media cluster dynamics occur on timescales of seconds to minutes (L) The promoter-proximal pausing behavior occurs on timescales of seconds to minutes. The details are shown in Table 2.
TABLE 2
| Bio-system | Bacteria | Fruit fly embryo | Nematode | Human, mouse | Amoeba |
|---|---|---|---|---|---|
| Gene |
In vitro
Tet system |
even-skipped Notch signaling; gap genes; hunchback |
Notch signaling | TGF-β Signaling TFF-1 signaling; liver genes; Mammalian genes |
actin gene family 1 actin gene family 2 |
| Timescale | minutes | minutes | minutes hours |
hours | minutes hours |
| Ref. | Chong et al. (2014) | Bothma et al. (2014), Desponds et al. (2016), Falo-Sanjuan et al. (2018), Lammers et al. (2018), Zoller et al. (2018), Berrocal et al. (2020) | Lee et al. (2019) | Suter et al. (2011a), Molina et al. (2013), Bahar Halpern et al. (2015) | Corrigan et al. (2016), Tunnacliffe et al. (2018) |
Time separation of single transcriptional bursts in different biological systems.
TABLE 3
| Molecular processes | Nucleosomal DNA wrapping/unfolding | Nucleosome Turnover |
Histone modification |
|---|---|---|---|
| Regulatory molecule | Mononucleosomes Mononucleosomes Mononucleosomes |
Histone H3.3 Histone H3 Histone H1,H2B,H3and H4 tagged with GFP |
dCas9 inducible recruitment rTet Rinducible recruitment Histone H3 Targeted recruitment; liver genes; Histone H2a, H2b, H3, H4 Histone H2, H2a, H2b |
| Organism | In vitro reconstitution | Fruit fly cell Yeast, Plant cell Human cell |
Mammalian cell Human cell Yeast Mammalian cell |
| Times-scale | Milliseconds Seconds |
Hours Minutes |
Day Hours Minutes |
| Ref. | Kassabov et al. (2003), Li et al. (2004), Tomschik et al. (2005) | Waterborg (1993), Misteli et al. (2000), Kimura and Cook (2001), Dion et al. (2007), Deal et al. (2010) | Chestier and Yaniv (1979), Katan-Khaykovich and Struhl (2002), Zee et al. (2010), Hathaway et al. (2012), Bintu, 2016; Braun et al. (2017) |
Time isolation of potential transcriptional molecular mechanisms in eukaryotes.
TABLE 4
Molecular regulatory mechanisms affecting transcriptional bursts in higher eukaryotic genes, as depicted in Figure 5.
Burst size (BS): the number of copies transferred by a transcription burst.
Burst frequency (BF): the number of transcriptional bursts that occur in a fixed cycle.
Within a single gene, these multiscale transcriptional bursts can occur independently and simultaneously (Tantale et al., 2016), encompassing the complex dynamics of bursting behavior. Recently, several studies have focused on extending the traditional two-state model to include additional insights and validations of these stochastic processes (see Table 4), while preserving the tractability of the model analysis (Kim and Marioni, 2013; Vu et al., 2016; Larsson et al., 2019; Chen et al., 2022; Grima and Esmenjaud, 2024).
2.2.2 Regulatory factors affecting transcriptional burst mechanism
Cells with the same genome in a common environment exhibit heterogeneity in gene expression, which is reflected in expression patterns and degrees of expression. In eukaryotic organisms, a greater degree of gene-specific behavior in gene expression relies on the description of burst characteristics, with burst size and burst frequency commonly used to analyze the mechanisms of transcriptional bursting. These burst features are regulated by molecular mechanisms such as the local chromatin environment, nuclear occupancy, histone modifications, number and affinity of cis-regulatory elements, DNA looping, and transcription factors (see Figure 1). To understand the extent to which these molecular mechanisms drive burst dynamics, we analyzed the influence of molecular mechanisms on burst size and frequency, drawing from a comprehensive body of literature that quantitatively assesses the impact of regulatory factors in various gene expression contexts (Table 4). The degree of influence on the burst indicators was proportionally delineated based on the referenced volume in the literature. The number of cis-regulatory elements exclusively affects burst size (Dey et al., 2015). However, nuclear occupancy, particularly at transcription termination sites (TTS), dominates the regulation of burst frequency and it acts as a key factor driving burst dynamics (Raj et al., 2006; Suter et al., 2011b; Senecal et al., 2014). Histone modifications and the affinity of cis-regulatory elements primarily influence burst size, whereas DNA looping and the acquisition of transcription factors mainly affect burst frequency. A study based on the two-state model revealed that the local concentration of transcription factors around a gene and their residence time at the binding sites jointly regulate the size and duration of transcriptional bursts (Suter et al., 2011a). However, the relationship between the activity of target genes and the binding rates of transcription factors is being further investigated (Ochiai et al., 2020), as the correlation between transcription factor binding rates and transcriptional burst frequency is not universally observed (Rullan et al., 2018). In addition, other cellular factors may play a role in the regulation of transcriptional dynamics (Lenstra et al., 2016), such as the regulation of burst frequency by promoter-enhancer proximity during dominant developmental processes (Antolović et al., 2017; Alexander et al., 2018; Chen et al., 2018).
2.3 Research methods for gene expression models
We divided existing analysis and solution methods of previously reported gene expression models into two categories: the biostatistical perspective and the biochemical reaction network perspective. To capture the randomness of transcriptional burst mechanisms in gene expression, models usually assume that all biochemical random events are Markov processes, considering the ease of the model. From the perspective of biostatistics, the best way to characterize the randomness of gene products is through a probability distribution. The goal of the researchers is to fit ideally the steady-state distribution predicted by gene expression models with the count distribution of single-cell mRNA snapshots generated by sequencing techniques, such as smFISH or scRNA-seq. From the perspective of the master equation, a biochemical reaction network describes the dynamic changes in the state of a transcriptional burst biochemical system. It is a group of differential equations that describes the probability density function of the change in the number of species in a biochemical system. The appropriate choice of statistical tools helps gain finer insights from the same transcriptome data.
2.3.1 Biostatistical perspective
From a traditional biostatistical perspective, transcription is described as a low-probability event. In eukaryotic cells, transcriptional products are generally considered to be generated by the Poisson process, based on the classical telegraph model of gene expression. In the case of bursts, a negative binomial distribution is considered to be the canonical distribution of intracellular dynamics. When the introduced technical noise and biological noise are considered, the mRNA counts are divided into real counts and observed counts, and the mRNA counts of the telegraph model are often characterized by a mixed distribution (Wang et al., 2018; Luo et al., 2022a). Based on the results of cell-sequencing experiments, we often need to assume the probability distribution of the observed sequencing counts to supplement the analysis before modeling the gene expression mechanism. The authenticity of the biological processes and their rationality must be considered. The count data for gene expression are generally discretized, and discrete distribution is best used to describe such data, excluding cases where the entire number of expression counts is extremely high (Amrhein et al., 2019).
2.3.1.1 Poisson distribution
Poisson distribution is prevalent in various random dynamics of gene expression, regardless of whether it is time-dependent or stationary. The Poisson distribution describes the number of independent events within a given period. In systems biology, the Poisson distribution variable represents the number of independent events that produce a biomolecule. The Poisson distribution was derived from a simple gene expression one-state birth-and-death model. The Poisson process describes the number of generated events in the time interval of transcription bursts, which represents the lifetime of a molecule destined to survive for a given duration. The negative binomial distribution of mRNA counts occurs as a steady-state distribution derived from a kinetic model that produces mRNA molecules in a burst form (Amrhein et al., 2019). It assumes a convenient tradeoff between computational complexity and biological simplicity.
2.3.1.2 Negative binomial distribution
Most mammalian genes are described using transcriptional burst models of gene expression, which implicitly serve as the basis for a negative binomial model of scRNA-seq counting (Gorin and Pachter, 2020). The negative binomial distribution is itself a distribution of discrete random variables that describe the probability of the number of failed events observed in a series of independent Bernoulli experiments until a predefined number of successes occurs, that is , where the success probability is and the predefined number of successes is . The probability quality function of the number of failed events is Equation 5
In early studies of gene expression, the negative binomial (NB) distribution was considered suitable for random gene expression models in mathematics, but there was no adequate explanation in biology (Raj et al., 2006). In 2019, Amrhein et al. combined stochastic differential equations and the chemical master equation (CME) to build an interpretable mechanism model that could directly derive the NB distribution under steady-state conditions (Amrhein et al., 2019). In the parameter setting, they regarded transcription events as failure events and gene inactivation events as success events. In gene expression models that include splicing dynamics, the NB distribution exists as a marginal distribution containing the combined distribution of nascent and mature mRNA counts, which helps fit the observed single-cell data (Gorin et al., 2021). The solution of the telegraph model in the burst limit can be approximated as a negative binomial distribution (Paulsson and Ehrenberg, 2000) or a zero-expansion NB distribution, such as the three-state model of gene expression (Jia, 2020). Of course, it is difficult to directly obtain a mechanistic model of NB distribution under a steady state. Therefore, continuous Poisson-beta and Poisson-gamma distributions are common methods for inferring the evolution process. The Poisson-beta, Poisson-gamma, and NB distributions are mathematically equivalent.
2.3.1.3 Poisson-beta distribution
Based on the classical telegraph model of random gene expression, when all aspects of biological variation and technical noise, including cell size and dropout rate, are considered, the mRNA count is divided into two types: real and observed counts. Owing to the overly decentralized nature of gene expression data, a common statistical method is to use the Poisson-beta distribution with three parameters (Kim and Marioni, 2013; Tang et al., 2018; 2023). The mRNA count distribution of the two-state model follows a mixed distribution as follows in Equation 6:
The random variable is the mRNA count observed in the gene of the cell, following the Poisson distribution; its parameter , is the original mRNA count in the cell, that is, the original count follows the distribution, and is the effective transcription rate acting on the original mRNA count. The observed mRNA count follows a Poisson-beta distribution. Although this distribution provides good results for the estimation of RNA-seq data, it has a high computational cost because of its large number of parameters.
2.3.1.4 Poisson-gamma distribution
The mRNA count distribution has been modeled based on the two-state model of gene expression. Some studies suggest that the observed count of gene expression levels in cells under steady-state conditions follows a conditional probability distribution that adheres to a Poisson distribution, and the promoter switching dynamics obey a gamma distribution. When all aspects of biological variation and technical noise are factored, the mRNA counts of the two-state model are follow a mixed distribution: the Poisson-gamma distribution like Equation 7 (Amrhein et al., 2019).
2.3.2 Biochemical reaction network perspective
The complexity of the gene expression process implies that it involves numerous biochemical reactions, which reduce the process to a set of biochemical reaction networks (including reaction rates) after coarse-grained processing of molecular details (T, 2019) seeing Equation 8.where and are stoichiometric, that is, the amount of change in the number of molecules of species with reference to the th reaction and is the reaction rate, such as the transfer network between the promoter states. The CME is not only the basis for establishing a gene expression model but also contributes to the dynamic change of the biochemical system state. The differential equation describing the probability density function of the change in the number of species molecules with time in a biochemical reaction (T, 2019) is written as follows Equation 9:where represents the identity operator, and its inverse are translation operators, and is the reaction tendency function. Our aim is to construct meaningful and interpretable CMEs, especially selecting the right solution tools, which are the key to studying gene expression models, and finally obtain a steady-state solution and determine the statistical significance of the distribution that the variables follow.
Currently, methods based on simulation, matrices, and analysis are the three most common methods used to solve the main equations of chemistry. Simulation-based methods, such as the well-known Gillespie stochastic simulation algorithm (Gillespie, 1976; 1977), are used to solve difficult to find analytical solutions to the CME. The Gillespie algorithm makes many computable sample statistics that asymptotically approach the statistics of the underlying processes at different speeds. Limited to small-scale biochemical reaction systems with relatively single molecular species, such as transcription systems, Gillespie is easy to operate and can be parallelized. However, it is unable to provide a joint probability distribution of the variables concerned. Matrix-based methods, such as the finite state projection algorithm (FSP) and multifinite buffers (Munsky and Khammash, 2006), which reduce the state space to calculate the precise steady-state solution and variable network probability landscape (Cao et al., 2016), either rely on matrix exponentiation or eigenvalue computation to solve the truncation problem of infinite dimensional CME systems. Therefore, it is effective for large-scale biochemical reaction systems. Convenient symmetry and faster runtimes relative to the simulation methods require feature runtimes, generally , where n is the state-space size. The analysis-based method is a general method for solving the main equation and can directly solve basic ordinary differential equations. For example, the steady-state solution can be reconstructed using the relationship between the generating function and the probability density function in the main equation (Gardiner, 1985), or the convolution structured method used for the basic system can easily obtain multiple properties of the solution (Jahnke and Huisinga, 2006), and its running time is generally .
Through the relevant Markov jump process, numerical simulation technology to achieve an approximate solution of the CME or an effective method to solve the CME directly is still widely open for research, and methods that have the running time, application dimension, solution accuracy, and special properties of the obtained solution are still being explored. In addition to the use of CMEs, the queuing theory has been proposed to model and solve complex biochemical reaction systems for RNA production and degradation. Recently, various stochastic models describing gene burst expression have been mapped onto several specific queuing systems (Bressloff, 2017; Fralix et al., 2023; Szavits-Nossan and Grima, 2023). Solving stochastic gene expression models using queuing theory (Szavits-Nossan and Grima, 2024) provides different viewpoints to building solutions for more complex gene expression models than those currently considered.
2.4 Definition of key indicators of transcriptional burst
RNA imaging technology has been used to directly visualize the dynamics of transcriptional bursts in cells (Larson et al., 2011). Burst measurements can help capture dynamic processes overlooked in standard population-averaged measurements of gene product expression, reflecting the underlying mechanisms of transcriptional regulation. Transcriptional burst models of gene expression can be characterized by several random variables, namely, burst size, burst frequency, dwell time, cycle time, and average travel ratio, and several studies have focused on the regulation of these parameters (Ochiai et al., 2020). Our mathematical analysis focused on building expressions for parameters based on explicable biological principles, the calculation of which is closely related to the rate of state switching, and then calculating the probability density function (PDF) or the probability mass function (PMF) of these random variables and their statistics. Basic information regarding these outbreak parameters is summarized in Table 5 and Figure 4.
TABLE 5
| Parameters | Definition | Formula | Function | Ref. |
|---|---|---|---|---|
| Burst size (BS) | The number of copies transferred by a transcription burst | The randomness of gene expression is mainly determined by the explosive nature of transcription | Luo et al. (2022b), Wang et al. (2024) | |
| Burst frequency (BF) | The number of transcriptional bursts that occur in a fixed cycle | Understanding the temporal dynamics of gene expression and how cells quickly adapt to environmental changes | Friedman et al. (2006), Kim and Marioni (2013), Luo et al. (2022b) | |
| Dwell time (DT) | The sum of dwell times in total states in a single burst | Understand the dynamic nature of gene regulation | Zopf et al. (2013), Wang et al. (2024) | |
| Cycle time (CT) | The duration of the RNA polymerase remaining on the gene for transcription | Reveal the efficiency of transcription processes and the overall dynamics of gene expression | Zopf et al. (2013), Donovan et al. (2018), Wang et al. (2024) | |
| Average travel ratio (MTR) | Pol II density between genosome and promoter approximation | Reveal the balance between transcriptional initiation and elongation | Wang et al. (2024) |
The molecular regulatory mechanisms affecting transcriptional bursts in higher eukaryotic genes correspond to those described in Figure 4.
FIGURE 4

Key indicators of transcriptional burst (A) The burst size and the length of time the gene waits in the state are directly proportional to mRNA production (B) Burst frequency is the total number of gene switches to state per unit time (C) Dwell time is the length of time a gene waits in a or states. The cycle period of a gene is the total length of time the gene waits in a continuous and states.
FIGURE 5
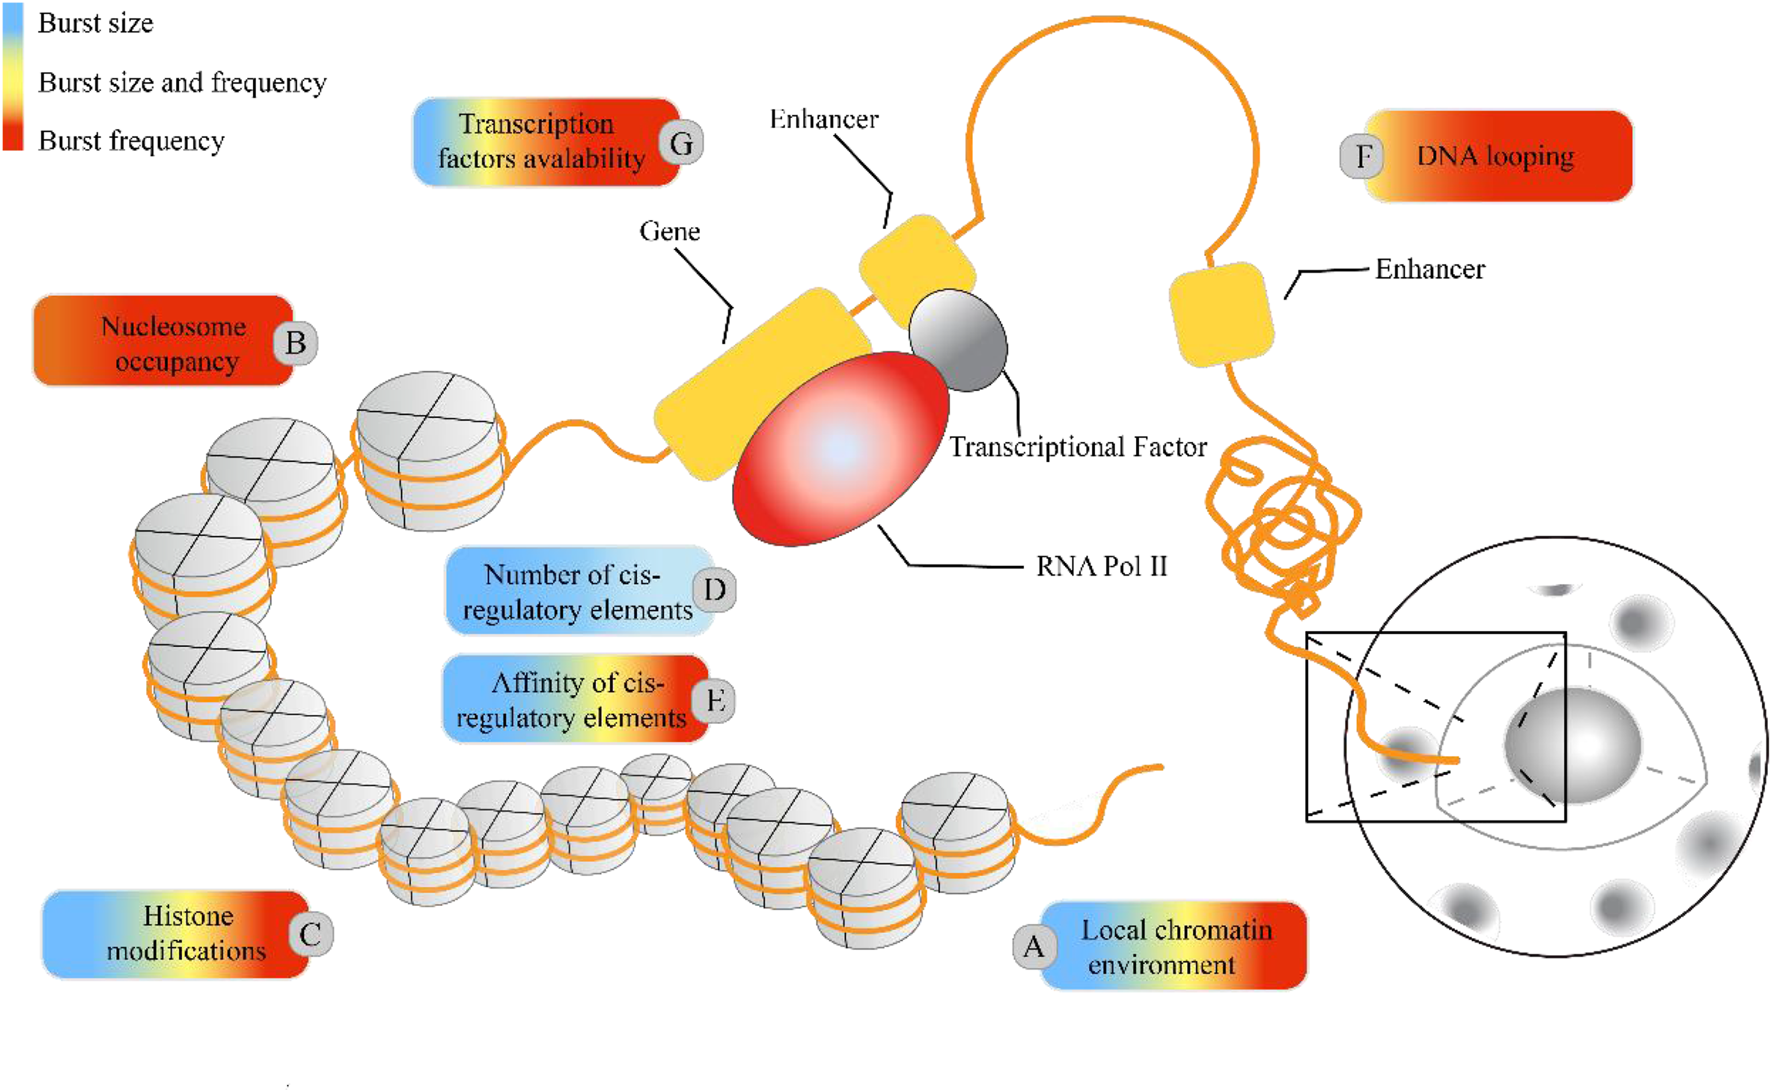
Regulatory molecular mechanisms underlying the transcriptional burst mechanism. In higher eukaryotic systems, the local chromatin environment, nuclear occupancy, histone modifications, and the number and affinity of cis-regulatory elements influence transcriptional bursting, adding to the regulatory complexity. The colored boxes highlight specific molecular mechanisms for their regulatory impact on burst size and frequency: blue represents regulation of burst size, red indicates regulation of burst frequency, and yellow indicates control over both burst size and frequency. The proportion of colors corresponds to the frequency of citations in Table 4.
2.4.1 Burst size
In our characterization of transcriptional burst dynamics, burst size and burst frequency were the two most critical parameters. Transcriptome-wide data reveal that burst frequency is primarily determined by enhancers, and burst size is primarily determined by core promoters (Wang et al., 2024). Constrained by the biocentric rule (Jia et al., 2019), gene expression includes three stages: transcription, translation, and promoter switching between the active and inactive states. Based on the two-state model, mRNA synthesis occurs in random bursts and exhibits a geometric distribution. The average number of transcripts produced by a gene at each burst is called the burst size (see Figure 4A).
2.4.2 Burst frequency
Based on the above model, there are two common descriptions of burst frequency. One is defined as the average number of bursts occurring per unit time (Luo et al., 2022b), that is, the reciprocal of the average cycle time, which can also be understood as the number of transcriptional bursts occurring in a fixed cycle (Friedman et al., 2006), where is the waiting time of the promoter in the OFF state, is the waiting time of the promoter in the ON state, and is the average waiting time. Another definition is based on the rate at which the promoter state switches (Figure 4B) (Kim and Marioni, 2013).
2.4.3 Cycle time
The cycle time of a gene transcriptional burst consists of two processes (Zopf et al., 2013): (i) residence time from the inactive state to the activated state and (ii) dwell time from the active state to the inactive state. For different gene expression models, the cycle period is a random variable equal to the sum of the residence times of all states in an outbreak process (see Figure 4C) (Wang et al., 2024).
2.4.4 Dwell time
Based on the four-state model of gene expression (Wang et al., 2024), dwell time is a random variable of the waiting time of a single state of a gene during the transcriptional burst cycle (Figure 4C). We temporarily ignored the dwell time in the state and calculated it in the state (Zopf et al., 2013). Subsequently, the residence time in the state can be calculated separately (Donovan et al., 2018; Wang et al., 2024). Let be the survival probability of mRNAs generated in a burst (i.e., .) at time t (i.e., ) and state (i.e., ). According to the concept of burst size, the marginal probability of the survival time iswhere denotes the exit time from the state in Equation 10. For the detailed solution process in (Wang et al., 2024), the average ON-state dwell time can be expressed as Equation 11where is the transfer rate of the burst process and represents each state in the model. is the dwell time of the ON state and is the total transition probability density function of the dwell time of the ON state. The first term on the right side of the equation is the average dwell time of the fundraising state of Pol II, and the second term is the average dwell time of the fundraising state of Pol II in the ON state. Similarly, the average dwell time in the OFF state is calculated as follows in Equation 12:
2.4.5 Average travel ratio
Based on an important characteristic parameter mentioned in the four-state model, the average travel ratio (MTR) is defined as the ratio of the Pol II concentration in the gene body (i.e., the DNA sequence of the entire region of the gene, except for the regulatory region, from the transcription of the gene start site to the polyadenylation signal) to the Pol II concentration at the proximal promoter seeing Equation 13.where is a fixed extension time interval of mRNA and is the proportion of the total extension time of Pol II to the total circulation time in the genome. is the Pol II concentration near the promoter, which can be viewed as the proportion of the residence time of the (Pol II suspended release state) state throughout the transcriptional burst; is the effective rate of Pol II pause release (Wang et al., 2024).
2.5 Parameter inference methods
In a single cell, highly variable patterns of gene expression often make the production of gene expression products (mRNA and proteins) explosive. Therefore, several methods have emerged to infer the parameters of transcriptional burst dynamics from single-cell data. According to the given real gene expression data (See it in section 2.6), we first need to carry out outlier processing and normalization of the data. Secondly, we defined the transcription parameters and the master equation to solve the steady state distribution of mRNA according to the selected model (See it in section 2.1; section 2.3; section 2.4). Thirdly, we construct the state transition matrix according to the requirement of the likelihood function and select the parameter inference method. one is based on likelihood and moment; the other is the simulation-based approach (See it in section 2.5). Fourthly, you implement parameter inference and optimize the inferred parameter set. Finally, we perform parameter validation and model evaluation, including checking the simulation results with inferred parameters and fitting to real data, and evaluating the uncertainty of parameters. The relatively mature estimation methods of transcriptional burst characteristic parameters can be mainly divided into two categories: one is based on likelihood and moment and the other is a simulation-based approach.
For estimation methods based on likelihood and moment, parameters can be estimated by either explicitly calculating the likelihood of the observed data for given parameters or by comparing the moments (mean, variance, skewness, etc.) of the distribution of gene expression products (mRNA and proteins) with those predicted by the model. Typical methods include maximum likelihood estimation (MLE) and the method of moments estimation (MME), such as the general method of moments and binomial moment estimation. Daigle et al. used an iterative, simulation-based Monte Carlo expectation-maximization algorithm (modified cross-entropy Monte Carlo expectation maximization, ) to compute the likelihood function for parameter estimation (Daigle et al., 2015). The advantage of this method lies in its effective estimation of parameters for stochastic biochemical systems from given incomplete data and in inferring promoter state numbers and structures. This method can be used to infer the burst size follows the geometric distribution. The MLE method maximizes the probability of observing the gene expression data given the parameters, making it a universal parameter estimation method. However, the consistency and efficiency of MLE estimates depend on large sample sizes, which make parameter optimization challenging. Moreover, MLE does not provide a natural measure of parameter uncertainty.
The hierarchical Bayesian method, which integrates prior knowledge based on Bayesian principles, is a promising parameter estimation approach. Kim et al. were the first to study the dynamics of stochastic gene expression using scRNA-seq data (Kim and Marioni, 2013). They constructed a beta-Poisson model based on a stochastic telegraph model of gene expression. The hierarchical Bayesian method assumes a gamma distribution for each gene-specific parameter in the beta-Poisson model (normalized by the degradation rate). The gamma distribution is advantageous in that it is strictly positive, possesses a simple functional form, and allows independent adjustments of its mean and variance. Finally, the hierarchical Bayesian method is combined with collapsed Gibbs sampling for parameter estimation. More importantly, it necessitates a clear computational form of the likelihood function. Sensitivity to outliers in the data can lead to numerical instability in the MLE, which is highly sensitive to model assumptions. As an alternative to the MLE method, the MME is based on the first three moments of raw gene expression counts and can more directly reflect the characteristics of the data. Larsson et al. were among the first to propose an MME method suitable for estimating the parameters of the telegraph model based on single-cell transcriptomic data (Waterborg, 1993; Ezer et al., 2016). This method utilizes the first three moments from each gene. With the advancement of single-cell sequencing technology, the exponential moments for estimation combined with scRNA-seq data are represented as follows in Equation 14:
The parameters for each gene are estimated separately according to the continuous ratio of the exponential moments as Equation 15:
The estimated kinetic parameters are like Equation 16
Although the MME overcomes the limitations of the sample size, the relationship between moments and parameters is not always consistent, which may lead to biased estimates. Furthermore, the MME is sensitive to the data distribution, particularly the behavior of the tails (e.g., heavy-tailed data distributions). Skewed distributions or outliers can affect the sample moments, ultimately affecting the estimation results.
For simulation-based estimation methods, the parameters can be estimated by minimizing the distance between the model distribution and the observed data. Typical approaches include those based on the Bayesian theory, such as approximate Bayesian computations (ABC) and neural network techniques. These methods do not rely directly on the computation of the likelihood function but instead approximate or infer the posterior distribution of key parameters for transcriptional bursts through extensive simulations. Toni et al. applied ABC methods based on sequential Monte Carlo (SMC) for parameter estimation and model selection in dynamic models (Toni et al., 2008). For simulation-based estimation methods, parameters can be estimated by minimizing the distance between the model distribution and the observed data. Typical approaches include those based on the Bayesian theory, such as ABC and neural network techniques.
Machine learning and deep learning methods have developed rapidly in recent years. Jiang et al. developed an artificial neural network (ANN) with a universal function approximator to study the non-Markov models of gene expression and transcriptional feedback (Jiang et al., 2021). The principle involves approximating non-Markov models with simpler stochastic models using ANNs. They utilized ANNs in conjunction with the maximum likelihood approach to infer sets of transcriptional dynamic parameters (including gene activation and inactivation rates, transcription rates, burst frequencies, and burst sizes) from the synthetic data. The ANN method of must be solved using a finite state projection algorithm (FSP). For multispecies interaction systems in scRNA-seq data, a universal closed-form solution for the CME has not yet been developed, and challenges remain in computing biophysical parameters. Recently, within a CME system encompassing transcriptional bursts, splicing, and degradation, Gorin et al. proposed a kernel-weighted regression (KWR) method that requires learning with neural networks (Gorin et al., 2022). This method represents a multidimensional solution of the CME for simulating transcriptional dynamics, specifically, the steady-state joint distribution solutions of the two models that approximate the RNA lifecycle. The authors integrated both KWR and Parameter Scaling KWR (psKWR) neural approximation strategies into a maximum likelihood estimation framework to infer sets of gene expression parameters in mouse brain cells.
In the future, time-resolved single-cell data with spatial information will become the primary focus for constructing mathematical models to study the dynamics of transcriptional bursting. The challenge of combining more flexible statistical methods to minimize the impact of noise and thereby infer parameters related to transcriptional bursting remains to be addressed (Luo et al., 2022a).
2.6 Approaches to studying data-driven dynamics of transcriptional burst
The data-driven construction of single-cell gene expression dynamics has been the preferred approach in several studies (Jovic et al., 2022). The rapid advancement of single-cell sequencing technologies in recent years has provided extensive data for individual analyses and multiomics studies to elucidate gene expression features and regulatory mechanisms at the single-cell level. The results obtained from single-cell sequencing data enable not only transcriptomic-level analyses but also the exploration of genomic and epigenomic heterogeneity fluctuations within cell populations (Kashima et al., 2020). As the demand for broader applications and increased precision in omics feature analysis of single-cell sequencing data has grown within the field, the concept and technology for integrating multilevel single-cell sequencing data have gradually taken shape and developed. However, the lack of spatial information remains a limitation of single-cell sequencing technology. Spatial transcriptomics, which has recently been widely discussed, can identify differential expression patterns according to local environmental conditions within tissues (Kumar and Manning, 2022). Integrating temporal and spatial information to deeply dissect omics features at various levels within each cell and comparing results from integrated data and imaging techniques with tissue pathology provide new insights into the mechanisms of transcriptional bursting in gene expression (Kashima et al., 2020).
2.6.1 Studies using only single-cell transcriptome sequencing data
To probe cell identity, status, function, and response, scRNA-seq is an alternative method for analyzing gene expression activity in cells. ScRNA-seq is a whole-genome sequencing method that extracts dynamic behavior from static measurement distributions. It allows single-cell-level transcriptomes of millions of cells to be analyzed in a single experiment to classify, characterize, and distinguish individual cells, thereby identifying populations of cells that are few in number but are significantly functional (Jovic et al., 2022). Therefore, scRNA-seq can uncover low-abundance but critical features of rare cells that are often masked by vast dominant expression signals, thereby enhancing the utility of single-cell transcriptomic sequencing data (Tang et al., 2009; Armingol et al., 2020). In 2009, Tang et al. reported a more mature scRNA-seq technology for generating high-throughput transcriptomic data (Tang et al., 2009; Rodriguez and Larson, 2020). When analyzing the burst characteristics and regulatory mechanisms of gene expression implicit in scRNA-seq, it is necessary to make appropriate assumptions about gene expression mechanisms when building mathematical models. These assumptions, such as the limiting rate and step of promoter state switching, are necessary even if they affect the model’s accuracy. Although scRNA-seq is widely used in high-throughput sequencing assays, it usually only measures mature RNA abundance, which is determined by both RNA synthesis and degradation (Blumberg et al., 2021). Therefore, a more direct approach to understanding transcriptional dynamics is to leverage nascent RNA sequencing techniques (NRS), which can directly capture active RNA polymerases in the nuclei, such as PRO-seq (Mahat et al., 2016). Recently, Zhao et al. developed a statistical model to estimate transcription rates for NRS data; however, estimating parameters for transcription bursts is challenging if the data are not at the single-cell level (Zhao et al., 2023). Fortunately, single-cell NRS recently has been developed (Mahat et al., 2024), allowing direct estimation of burst size and frequency. Therefore, descriptive results from data-driven and phenomenological analyses alone are insufficient to explain this biomechanism. Only by combining single-cell data with a statistical physical model can we accurately, robustly, and flexibly infer burst dynamics and reveal the biophysical mechanisms of gene regulation.
2.6.2 Studies using integrated data
Although scRNA-seq data have been widely used in multiple fields such as immunology, developmental biology, and oncology, multidimensional data generated by single-cell sequencing are sparse and do not provide complete information about protein levels or post-translational modifications. Therefore, the selection of appropriate tools for computational analysis according to the research context and datasets is necessary. The study of spatial omics data and the integrated use of multiple-omics data will push single-cell technology into a wider range of scientific and translational research, expanding the scope for health monitoring, disease diagnosis, and in-depth analysis of genomic, epigenomic, and transcriptomic data characteristics (Tunnacliffe and Chubb, 2020).
The mechanisms of gene expression regulation have been studied using sequencing. To investigate the role of epigenomic data in transcription dynamics (Kashima et al., 2020; Ma et al., 2022), protein-DNA interactions can be directly detected using single-cell chromatin immunoprecipitation and sequencing (scChIPseq) from the perspective of the local chromatin environment, nucleosome occupancy, histone modification, and number and affinity of regulatory elements (transcription factors). This, in turn, helps identify protein-binding sites for genes of interest, such as transcription factor-binding sites and chromatin tissue heterogeneity. ScATAC-seq, which studies open chromatin from the perspective of the local chromatin environment and assists in accessing genome-wide chromatin, can help determine cell types at a single-cell resolution, analyze intercellular heterogeneity, and identify many different modes of gene regulation (Kashima et al., 2020; Wu et al., 2021). From the perspective of the DNA dissociation rate, transcription is a discontinuous process in eukaryotes, and mRNA is produced explosively after transcription factors bind to regulatory elements in the genome (Mazzocca et al., 2021). To investigate the role of genomic data in transcriptional dynamics, it is essential to understand the influence of transcription factors on the frequency, duration, and size of transcriptional bursts. ScSLAM-seq can visualize and explain differences in transcriptional activity at the single-cell level, describing “ON/OFF” switching in gene expression and transcriptional burst dynamics (Erhard et al., 2019). In living organisms, the structure of genetic information determines the basic properties, which in turn determine the function and use of cells. From the perspective of nuclear structure (including DNA cycling, promoter-enhancer contact, and nuclear regionalization), we can extract two main features of enhancer-promoter communication through extensive genome-wide studies (4C, 5C, and Hi-C): (1) communication between enhancers and promoters may be mediated by chromatin loops and (2) the genome is organized into topologically associating domains (TADs) that may delineate local gene activity. In addition, enhancer–promoter communication mainly regulates burst frequency rather than burst size (Daigle et al., 2015; Wang et al., 2024). In fixed cells, the application of the standard smFISH technique for single RNA imaging generated a distribution of nascent and mature mRNA counts in single cells and provided a new dataset for large-scale single-molecule studies. Conventional single-cell sequencing techniques often lack spatial information regarding cells; however, high-throughput and multiplexed datasets compensate for this limitation (Wang et al., 2018). The development of transcription-regulated live-cell imaging techniques has greatly facilitated the search for molecular mechanisms underlying precise spatiotemporal gene expression programs (Daigle et al., 2015).
Single-cell sequencing data can effectively characterize the omics of genomic, epigenomic, and transcriptomic data. Therefore, many studies have attempted to overcome these barriers of information disability by integrating single-cell sequencing data from different omics layers. On the one hand, the activity and integrity of a cell are destroyed in the process of sequencing a single omics layer for a cell, preventing the simultaneous analysis of different levels of omics information from the same cell. On the other hand, the abundance of single-cell sequencing data can improve the accuracy of cell characterization. The model of transcriptional burst dynamics using integrated data can ensure the high fidelity of accurate transcriptional regulation. Additionally, the diversity of data sources can fully characterize the randomness of biochemical reactions and reveal cellular heterogeneity (Wang et al., 2016; 2018; Kashima et al., 2020). Correlation analysis of gene features, such as burst parameters and promoter structure at the single-cell level, will help analyze the regulatory mechanism of gene expression dynamics. The development of single-cell techniques has gradually enriched the information contained in the data, allowing us to understand multiple transcription factors, their interactions, and their effects on the transcriptional output of specific target genes in the same living cell, thus providing opportunities to further understand the mechanisms of transcriptional bursts in the future.
Currently, the study of transcription and transcriptional bursts using single-cell transcriptome data is extensive. The single-cell transcriptome data discussed in the previous section and the single-cell genome sequencing data and epigenome data discussed in this section are at the same level and are independent. Therefore, an effective computing strategy is needed to determine the relationship between different levels of omics data and integrate them to approximate the multilayer sequencing results of the same cell. By obtaining prior information on different levels of omics of the same cell, insights will be more comprehensive. This approach presents an opportunity to move from descriptive “snapshot” conclusions to a deeper revelation of the mechanisms underlying cellular transcriptional bursts.
3 Prospect
The stochastic nature of transcriptional bursting dynamics during gene expression is an important source of phenotypic heterogeneity. Bursts and periods of silence occur alternately during the mRNA synthesis, corroborating that genes are predominantly inactive during the transcriptional bursting cycle and that the bursts are brief. The multi-state model of gene expression is based on this unique biological mechanism. Specifically, judicious selection of multi-state models of gene expression is important for the accurate analysis of real single-cell transcriptomic sequencing data. The stochastic telegraph model is a fundamental choice in gene regulation studies. However, there is a lack of comprehensive research demonstrating that models with more transcriptional states better fit the actual data. In contrast, simpler models with two, three, or four states can often predict gene expression with a lower theoretical bias.
In this study, we critically examined conventional gene expression models, explained the temporal scales and regulatory factors implicated in transcriptional bursting, and assessed the methodologies employed in gene expression research from the perspectives of biostatistical and biochemical network analysis. To uncover the regulatory underpinnings of stochastic gene expression, we focused on key factors, including burst size, frequency, cycle period, residency time, and travel ratio, to elucidate the mechanisms underlying bursting dynamics. We also categorized the foundational concepts and enumerated methods for parameter inference within a bursting dynamics framework. Finally, we explored the current landscape and identify challenges in the evolving field of transcriptional bursting dynamics propelled by advancements in single-cell sequencing data. Although the study of transcriptional bursting dynamics has advanced over the last decade, analysis of scRNA-seq and other omics data, along with cutting-edge technologies, continues to evolve. These ongoing developments promise to contribute substantially to the progress of systems biology and bioinformatics.
Spatial transcriptomics technology fills the gap in spatial distribution information that scRNA-seq sequencing technology lacks. By facilitating precise comparisons between gene expression patterns and histopathological information, it enables the identification of differential expression patterns within the local tissue microenvironment, as well as, provides insights into cell-to-cell interactions and signal transduction. One significant challenge with the advent of spatial transcriptomics is the absence of a standardized analysis workflow. Developing spatial dynamic models of cell communication or models that reflect gene regulation by integrating spatial transcriptomic data with other omics datasets remains a crucial task for gaining more comprehensive insights into computational systems biology. In the future, we should focus on the dynamics of key transcription factors and enhancers, as well as on phase separation methods, for the quantitative study of the dynamic parameters influencing bursting. Progress in single-molecule techniques will enhance these analyses, allowing imaging of multiple transcription factors, their interactions, and their impact on the transcriptional output of specific target genes within the same living cell. In the future, the development of a unified analytical workflow that combines in vivo imaging, single-cell sequencing, and mathematical modeling will permit systematic analysis of bursting behavior across multiple genomic loci.
Statements
Author contributions
QZ: Methodology, Writing–original draft, Writing–review and editing, Conceptualization, Visualization. WC: Writing–original draft, Methodology, Project administration. JW: Conceptualization, Writing–review and editing. YY: Investigation, Writing–review and editing. RS: Resources, Writing–review and editing. ZT: Resources, Writing–review and editing. YH: Visualization, Writing–review and editing. YT: Validation, Writing–review and editing. B-GZ: Project administration, Writing–review and editing.
Funding
The author(s) declare that financial support was received for the research, authorship, and/or publication of this article. This work was supported by the National Natural Science Foundation of China (NSFC) [grant numbers No. 11971367,12371500,1220522]
Conflict of interest
The authors declare that the research was conducted in the absence of any commercial or financial relationships that could be construed as a potential conflict of interest.
Publisher’s note
All claims expressed in this article are solely those of the authors and do not necessarily represent those of their affiliated organizations, or those of the publisher, the editors and the reviewers. Any product that may be evaluated in this article, or claim that may be made by its manufacturer, is not guaranteed or endorsed by the publisher.
References
1
Alexander J. M. Guan J. Huang B. Lomvardas S. Weiner O. D. (2018). Live-cell imaging reveals enhancer-dependent sox2 transcription in the absence of enhancer proximity. elife. 10.1101/409672
2
Amrhein L. Harsha K. Fuchs C. (2019). A mechanistic model for the negative binomial distribution of single-cell mRNA counts. bioRxiv. 10.1101/657619
3
AntoloviÄ V. Miermont A. Corrigan A. M. Chubb J. R. (2017). Generation of single-cell transcript variability by repression. Curr. Biol.27, 1811–1817.e3. 10.1016/j.cub.2017.05.028
4
Armingol E. Officer A. Harismendy O. Lewis N. E. (2020). Deciphering cell–cell interactions and communication from gene expression. Nat. Rev. Genet.22, 71–88. 10.1038/s41576-020-00292-x
5
Bahar Halpern K. Tanami S. Landen S. Chapal M. Szlak L. Hutzler A. et al (2015). Bursty gene expression in the intact mammalian liver. Mol. Cell58, 147–156. 10.1016/j.molcel.2015.01.027
6
Bartman C. R. Hsu S. C. Hsiung C. C.-S. Raj A. Blobel G. A. (2016). Enhancer regulation of transcriptional bursting parameters revealed by forced chromatin looping. Mol. Cell62, 237–247. 10.1016/j.molcel.2016.03.007
7
Battich N. Stoeger T. Pelkmans L. (2013). Image-based transcriptomics in thousands of single human cells at single-molecule resolution. Nat. Methods10, 1127–1133. 10.1038/nmeth.2657
8
Berrocal A. Lammers N. C. Garcia H. G. Eisen M. B. (2020). Author response: kinetic sculpting of the seven stripes of the Drosophila even-skipped gene. 10.7554/elife.61635.sa2
9
Bertrand E. Chartrand P. Schaefer M. Shenoy S. M. Singer R. H. Long R. M. (1998). Localization of ASH1 mRNA particles in living yeast. Mol. Cell2, 437–445. 10.1016/s1097-2765(00)80143-4
10
Bintu L. (2016). Dynamics of epigenetic regulation at the single-cell level. Biophysical J.110, 317a–318a. 10.1016/j.bpj.2015.11.1704
11
Blumberg A. Zhao Y. Huang Y.-F. Dukler N. Rice E. J. Chivu A. G. et al (2021). Characterizing RNA stability genome-wide through combined analysis of PRO-seq and RNA-seq data. BMC Biol.19, 30. 10.1186/s12915-021-00949-x
12
Bothma J. P. Garcia H. G. Esposito E. Schlissel G. Gregor T. Levine M. (2014). Dynamic regulation of eve stripe 2 expression reveals transcriptional bursts in living Drosophila embryos. Proc. Natl. Acad. Sci.111, 10598–10603. 10.1073/pnas.1410022111
13
Braun S. M. G. Kirkland J. G. Chory E. J. Husmann D. Calarco J. P. Crabtree G. R. (2017). Rapid and reversible epigenome editing by endogenous chromatin regulators. Nat. Commun.8, 560. 10.1038/s41467-017-00644-y
14
Bressloff P. C. (2017). Stochastic switching in biology: from genotype to phenotype. J. Phys. A Math. Theor.50, 133001. 10.1088/1751-8121/aa5db4
15
Brouwer I. Lenstra T. L. (2019). Visualizing transcription: key to understanding gene expression dynamics. Curr. Opin. Chem. Biol.51, 122–129. 10.1016/j.cbpa.2019.05.031
16
Cao Y. Terebus A. Liang J. (2016). Accurate chemical master equation solution using multi-finite buffers. Multiscale Model. and Simul.14, 923–963. 10.1137/15m1034180
17
Chen C. Zhang Z. Tang P. Liu X. Huang B. (2024). Edge-relational window-attentional graph neural network for gene expression prediction in spatial transcriptomics analysis. Comput. Biol. Med.174, 108449. 10.1016/j.compbiomed.2024.108449
18
Chen F. X. Xie P. Collings C. K. Cao K. Aoi Y. Marshall S. A. et al (2017). PAF1 regulation of promoter-proximal pause release via enhancer activation. Science357, 1294–1298. 10.1126/science.aan3269
19
Chen H. Levo M. Barinov L. Fujioka M. Jaynes J. B. Gregor T. (2018). Dynamic interplay between enhancer–promoter topology and gene activity. Nat. Genet.50, 1296–1303. 10.1038/s41588-018-0175-z
20
Chen L. Zhu C. Jiao F. (2022). A generalized moment-based method for estimating parameters of stochastic gene transcription. Math. Biosci.345, 108780. 10.1016/j.mbs.2022.108780
21
Chestier A. Yaniv M. (1979). Rapid turnover of acetyl groups in the four core histones of simian virus 40 minichromosomes. Proc. Natl. Acad. Sci.76, 46–50. 10.1073/pnas.76.1.46
22
Chong S. Chen C. Ge H. Xie X. S. (2014). Mechanism of transcriptional bursting in bacteria. Cell158, 314–326. 10.1016/j.cell.2014.05.038
23
Chubb J. R. Trcek T. Shenoy S. M. Singer R. H. (2006). Transcriptional pulsing of a developmental gene. Curr. Biol.16, 1018–1025. 10.1016/j.cub.2006.03.092
24
Corrigan A. M. Tunnacliffe E. Cannon D. Chubb J. R. (2016). Author response: a continuum model of transcriptional bursting. 10.7554/elife.13051.024
25
Daigle B. J. Soltani M. Petzold L. R. Singh A. (2015). Inferring single-cell gene expression mechanisms using stochastic simulation. Bioinformatics31, 1428–1435. 10.1093/bioinformatics/btv007
26
Dar R. D. Razooky B. S. Singh A. Trimeloni T. V. McCollum J. M. Cox C. D. et al (2012). Transcriptional burst frequency and burst size are equally modulated across the human genome. Proc. Natl. Acad. Sci.109, 17454–17459. 10.1073/pnas.1213530109
27
Dar R. D. Shaffer S. M. Singh A. Razooky B. S. Simpson M. L. Raj A. et al (2016). Transcriptional bursting explains the noise–versus–mean relationship in mRNA and protein levels. PLOS ONE11, e0158298. 10.1371/journal.pone.0158298
28
Deal R. B. Henikoff J. G. Henikoff S. (2010). Genome-wide kinetics of nucleosome turnover determined by metabolic labeling of histones. Science328, 1161–1164. 10.1126/science.1186777
29
Desponds J. Tran H. Ferraro T. Lucas T. Perez Romero C. Guillou A. et al (2016). Precision of readout at the hunchback gene: analyzing short transcription time traces in living fly embryos. PLOS Comput. Biol.12, e1005256. 10.1371/journal.pcbi.1005256
30
Dey S. S. Foley J. E. Limsirichai P. Schaffer D. V. Arkin A. P. (2015). Orthogonal control of expression mean and variance by epigenetic features at different genomic loci. Mol. Syst. Biol.11, 806. 10.15252/msb.20145704
31
Dion M. F. Kaplan T. Kim M. Buratowski S. Friedman N. Rando O. J. (2007). Dynamics of replication-independent histone turnover in budding yeast. Science315, 1405–1408. 10.1126/science.1134053
32
Donovan B. T. Huynh A. Ball D. A. Poirier M. G. Larson D. R. Ferguson M. L. et al (2018). Single-molecule imaging reveals the interplay between transcription factors, nucleosomes, and transcriptional bursting. BioRxiv. 10.1101/404681
33
Durrieu L. Bush A. Grande A. Johansson R. Janzén D. Katz A. et al (2023). Characterization of cell-to-cell variation in nuclear transport rates and identification of its sources. iScience26, 105906. 10.1016/j.isci.2022.105906
34
Elgart V. Jia T. Fenley A. T. Kulkarni R. (2011). Connecting protein and mRNA burst distributions for stochastic models of gene expression. Phys. Biol.8, 046001. 10.1088/1478-3975/8/4/046001
35
Erhard F. Baptista M. A. P. Krammer T. Hennig T. Lange M. Arampatzi P. et al (2019). scSLAM-seq reveals core features of transcription dynamics in single cells. Nature571, 419–423. 10.1038/s41586-019-1369-y
36
Ezer D. Moignard V. Gã¶ttgens B. Adryan B. (2016). Determining physical mechanisms of gene expression regulation from single cell gene expression data. PLOS Comput. Biol.12, e1005072. 10.1371/journal.pcbi.1005072
37
Fallacaro S. Mukherjee A. Mir M. (2024). Differential transcription factor hub properties dictate gene-specific occupancy and transcriptional activity. Biophysical J.123, 358a. 10.1016/j.bpj.2023.11.2178
38
Falo-Sanjuan J. Lammers N. C. Garcia H. G. Bray S. (2018). Enhancer priming enables fast and sustained transcriptional responses to Notch signaling. Dev. Cell50, 411–425. 10.1016/j.devcel.2019.07.002
39
Featherstone K. Hey K. Momiji H. McNamara A. V. Patist A. L. Woodburn J. et al (2015). Author response: spatially coordinated dynamic gene transcription in living pituitary tissue. 10.7554/elife.08494.026
40
Femino A. M. Fay F. S. Fogarty K. Singer R. H. (1998). Visualization of single RNA transcripts in situ. Science280, 585–590. 10.1126/science.280.5363.585
41
Fralix B. Holmes M. Löpker A. (2023). A Markovian arrival stream approach to stochastic gene expression in cells. J. Math. Biol.86, 79. 10.1007/s00285-023-01913-9
42
Friedman N. Cai L. Xie X. S. (2006). Linking stochastic dynamics to population distribution: an analytical framework of gene expression. Phys. Rev. Lett.97, 168302. 10.1103/physrevlett.97.168302
43
Fritzsch C. Baumgärtner S. Kuban M. Steinshorn D. Reid G. Legewie S. (2018). Estrogen‐dependent control and cell‐to‐cell variability of transcriptional bursting. Mol. Syst. Biol.14, e7678. 10.15252/msb.20177678
44
Fuda N. J. Ardehali M. B. Lis J. T. (2009). Defining mechanisms that regulate RNA polymerase II transcription in vivo. Nature461, 186–192. 10.1038/nature08449
45
Fukaya T. Lim B. Levine M. (2016). Enhancer control of transcriptional bursting. Cell166, 358–368. 10.1016/j.cell.2016.05.025
46
Gardiner C. W. (1985). Handbook of stochastic methods for physics, chemistry and the natural sciences. Springer Berlin Heidelberg. 10.1007/978-3-662-02452-2
47
Ge H. Qian H. Xie X. S. (2015). Stochastic phenotype transition of a single cell in an intermediate region of gene state switching. Phys. Rev. Lett.114, 078101. 10.1103/PhysRevLett.114.078101
48
Ge H. Wu P. Qian H. Xie X. S. (2018). Relatively slow stochastic gene-state switching in the presence of positive feedback significantly broadens the region of bimodality through stabilizing the uninduced phenotypic state. PLoS Comput. Biol.14, e1006051. 10.1371/journal.pcbi.1006051
49
Gillespie D. T. (1976). A general method for numerically simulating the stochastic time evolution of coupled chemical reactions. J. Comput. Phys.22, 403–434. 10.1016/0021-9991(76)90041-3
50
Gillespie D. T. (1977). Exact stochastic simulation of coupled chemical reactions. J. Phys. Chem.81, 2340–2361. 10.1021/j100540a008
51
Golding I. Paulsson J. Zawilski S. M. Cox E. C. (2005). Real-time kinetics of gene activity in individual bacteria. Cell123, 1025–1036. 10.1016/j.cell.2005.09.031
52
Gorin G. Carilli M. Chari T. Pachter L. (2022). Spectral neural approximations for models of transcriptional dynamics. Biophysical J.10.1101/2022.06.16.496448
53
Gorin G. Pachter L. (2020). Special function methods for bursty models of transcription. Phys. Rev. E102, 022409. 10.1103/physreve.102.022409
54
Gorin G. Vastola J. J. Fang M. Pachter L. (2021). Interpretable and tractable models of transcriptional noise for the rational design of single-molecule quantification experiments. Nat. Commun.10.1101/2021.09.06.459173
55
Grima R. Esmenjaud P.-M. (2024). Quantifying and correcting bias in transcriptional parameter inference from single-cell data. Biophysical J.123, 4–30. 10.1016/j.bpj.2023.10.021
56
Harper C. V. Finkenstädt B. Woodcock D. J. Friedrichsen S. Semprini S. Ashall L. et al (2011). Dynamic analysis of stochastic transcription cycles. PLoS Biol.9, e1000607. 10.1371/journal.pbio.1000607
57
Hathaway N. A. Bell O. Hodges C. Miller E. L. Neel D. S. Crabtree G. R. (2012). Dynamics and memory of heterochromatin in living cells. Cell149, 1447–1460. 10.1016/j.cell.2012.03.052
58
Herbach U. (2019). Stochastic gene expression with a multistate promoter: breaking down exact distributions. SIAM J. Appl. Math.79, 1007–1029. 10.1137/18m1181006
59
Herbach U. Bonnaffoux A. Espinasse T. Gandrillon O. (2017). Inferring gene regulatory networks from single-cell data: a mechanistic approach. BMC Syst. Biol.11, 105. 10.1186/s12918-017-0487-0
60
Jahnke T. Huisinga W. (2006). Solving the chemical master equation for monomolecular reaction systems analytically. J. Math. Biol.54, 1–26. 10.1007/s00285-006-0034-x
61
Jia C. (2020). Kinetic foundation of the zero-inflated negative binomial model for single-cell RNA sequencing data. SIAM J. Appl. Math.80, 1336–1355. 10.1137/19m1253198
62
Jia C. Grima R. (2023). Coupling gene expression dynamics to cell size dynamics and cell cycle events: exact and approximate solutions of the extended telegraph model. iScience26, 105746. 10.1016/j.isci.2022.105746
63
Jia C. Li Y. (2023). Analytical time-dependent distributions for gene expression models with complex promoter switching mechanisms. SIAM J. Appl. Math.83, 1572–1602. 10.1137/22m147219x
64
Jia C. Wang L. Y. Yin G. G. Zhang M. Q. (2019). Single-cell stochastic gene expression kinetics with coupled positive-plus-negative feedback. Phys. Rev. E100, 052406. 10.1103/physreve.100.052406
65
Jiang Q. Fu X. Yan S. Li R. Du W. Cao Z. et al (2021). Neural network aided approximation and parameter inference of non-Markovian models of gene expression. Nat. Commun.12, 2618. 10.1038/s41467-021-22919-1
66
Jiang Y. Zhang N. R. Li M. (2017). SCALE: modeling allele-specific gene expression by single-cell RNA sequencing. Genome Biol.18, 74. 10.1186/s13059-017-1200-8
67
Jovic D. Liang X. Zeng H. Lin L. Xu F. Luo Y. (2022). Single-cell RNA sequencing technologies and applications: a brief overview. Clin. Transl. Med.12, e694. 10.1002/ctm2.694
68
Kafri P. Hasenson S. E. Kanter I. Sheinberger J. Kinor N. Yunger S. et al (2016). Author response: quantifying Î2-catenin subcellular dynamics and cyclin D1 mRNA transcription during Wnt signaling in single living cells. 10.7554/elife.16748.036
69
Kalo A. Kanter I. Shraga A. Sheinberger J. Tzemach H. Kinor N. et al (2015). Cellular levels of signaling factors are sensed by β-actin alleles to modulate transcriptional pulse intensity. Cell Rep.11, 419–432. 10.1016/j.celrep.2015.03.039
70
Kashima Y. Sakamoto Y. Kaneko K. Seki M. Suzuki Y. Suzuki A. (2020). Single-cell sequencing techniques from individual to multiomics analyses. Exp. and Mol. Med.52, 1419–1427. 10.1038/s12276-020-00499-2
71
Kassabov S. R. Zhang B. Persinger J. Bartholomew B. (2003). SWI/SNF unwraps, slides, and rewraps the nucleosome. Mol. Cell11, 391–403. 10.1016/s1097-2765(03)00039-x
72
Katan-Khaykovich Y. Struhl K. (2002). Dynamics of global histone acetylation and deacetylation in vivo: rapid restoration of normal histone acetylation status upon removal of activators and repressors. Genes and Dev.16, 743–752. 10.1101/gad.967302
73
Kim J. Marioni J. C. (2013). Inferring the kinetics of stochastic gene expression from single-cell RNA-sequencing data. Genome Biol.14, R7. 10.1186/gb-2013-14-1-r7
74
Kimura H. Cook P. R. (2001). Kinetics of core histones in living human cells. J. Cell Biol.153, 1341–1354. 10.1083/jcb.153.7.1341
75
Klindziuk A. Kolomeisky A. B. (2018). Theoretical investigation of transcriptional bursting: a multistate approach. J. Phys. Chem. B122, 11969–11977. 10.1021/acs.jpcb.8b09676
76
Kumar S. Manning J. (2022). Faculty Opinions recommendation of Spatiotemporal transcriptomic atlas of mouse organogenesis using DNA nanoball-patterned arrays. 10.3410/f.742107472.793593483
77
Lammers N. C. Galstyan V. Reimer A. Medin S. A. Wiggins C. H. Garcia H. G. (2018) “Multimodal transcriptional control of pattern formation in embryonic development,” in Proceedings of the national academy of sciences. 10.1101/335919
78
Lammers N. C. Kim Y. J. Zhao J. Garcia H. G. (2020). A matter of time: using dynamics and theory to uncover mechanisms of transcriptional bursting. Curr. Opin. Cell Biol.67, 147–157. 10.1016/j.ceb.2020.08.001
79
Larson D. R. Fritzsch C. Sun L. Meng X. Lawrence D. S. Singer R. H. (2013). Author response: direct observation of frequency modulated transcription in single cells using light activation. 10.7554/elife.00750.024
80
Larson D. R. Zenklusen D. Wu B. Chao J. A. Singer R. H. (2011). Real-time observation of transcription initiation and elongation on an endogenous yeast gene. Science332, 475–478. 10.1126/science.1202142
81
Larsson A. J. M. Johnsson P. Hagemann-Jensen M. Hartmanis L. Faridani O. R. Reinius B. et al (2019). Genomic encoding of transcriptional burst kinetics. Nature565, 251–254. 10.1038/s41586-018-0836-1
82
Lee C. Shin H. Kimble J. (2019). Dynamics of notch-dependent transcriptional bursting in its native context. Dev. Cell50, 426–435. 10.1016/j.devcel.2019.07.001
83
Lenstra T. L. Rodriguez J. Chen H. Larson D. R. (2016). Transcription dynamics in living cells. Annu. Rev. Biophysics45, 25–47. 10.1146/annurev-biophys-062215-010838
84
Li G. Levitus M. Bustamante C. Widom J. (2004). Rapid spontaneous accessibility of nucleosomal DNA. Nat. Struct. and Mol. Biol.12, 46–53. 10.1038/nsmb869
85
Livingston N. M. Kwon J. Valera O. Saba J. A. Sinha N. K. Reddy P. et al (2023). Bursting translation on single mRNAs in live cells. Mol. Cell83, 2276–2289.e11. 10.1016/j.molcel.2023.05.019
86
Luo S. Wang Z. Zhang Z. Zhou T. Zhang J. (2022a). Genome-wide inference reveals that feedback regulations constrain promoter-dependent transcriptional burst kinetics. Nucleic Acids Res.10.1101/2022.04.08.487618
87
Luo S. Zhang Z. Wang Z. Yang X. Chen X. Zhou T. et al (2022b). Inferring transcriptional bursting kinetics from single-cell snapshot data using a generalized telegraph model. R. Soc. Open Sci.10.1101/2022.07.17.500373
88
Ma R.-Y. Black A. Qian B.-Z. (2022). Macrophage diversity in cancer revisited in the era of single-cell omics. Trends Immunol.43, 546–563. 10.1016/j.it.2022.04.008
89
Mahat D. B. Kwak H. Booth G. T. Jonkers I. H. Danko C. G. Patel R. K. et al (2016). Base-pair-resolution genome-wide mapping of active RNA polymerases using precision nuclear run-on (PRO-seq). Nat. Protoc.11, 1455–1476. 10.1038/nprot.2016.086
90
Mahat D. B. Tippens N. D. Martin-Rufino J. D. Waterton S. K. Fu J. Blatt S. E. et al (2024). Single-cell nascent RNA sequencing unveils coordinated global transcription. Nature631, 216–223. 10.1038/s41586-024-07517-7
91
Mayer A. Li J. McLaughlin G. Gladfelter A. Roper M. (2024). Mitigating transcription noise via protein sharing in syncytial cells. Biophysical J.123, 968–978. 10.1016/j.bpj.2024.03.009
92
Mazzocca M. Colombo E. Callegari A. Mazza D. (2021). Transcription factor binding kinetics and transcriptional bursting: what do we really know?Curr. Opin. Struct. Biol.71, 239–248. 10.1016/j.sbi.2021.08.002
93
Miller O. L. McKnight S. L. (1979). Post-replicative nonribosomal transcription units in D. melanogaster embryos. Cell17, 551–563. 10.1016/0092-8674(79)90263-0
94
Mines R. C. Lipniacki T. Shen X. (2022). Slow nucleosome dynamics set the transcriptional speed limit and induce RNA polymerase II traffic jams and bursts. PLOS Comput. Biol.18, e1009811. 10.1371/journal.pcbi.1009811
95
Minnoye L. Marinov G. K. Krausgruber T. Pan L. Marand A. P. Secchia S. et al (2021). Chromatin accessibility profiling methods. Nat. Rev. Methods Prim.1, 10. 10.1038/s43586-020-00008-9
96
Misteli T. Gunjan A. Hock R. Bustin M. Brown D. T. (2000). Dynamic binding of histone H1 to chromatin in living cells. Nature408, 877–881. 10.1038/35048610
97
Molina N. Suter D. M. Cannavo R. Zoller B. Gotic I. Naef F. (2013). Stimulus-induced modulation of transcriptional bursting in a single mammalian gene. Proc. Natl. Acad. Sci.110, 20563–20568. 10.1073/pnas.1312310110
98
Munsky B. Khammash M. (2006). The finite state projection algorithm for the solution of the chemical master equation. J. Chem. Phys.124, 044104. 10.1063/1.2145882
99
Muramoto T. Müller I. Thomas G. Melvin A. Chubb J. R. (2010). Methylation of H3K4 is required for inheritance of active transcriptional states. Curr. Biol.20, 397–406. 10.1016/j.cub.2010.01.017
100
Neuert G. Munsky B. Tan R. Z. Teytelman L. Khammash M. van Oudenaarden A. (2013). Systematic identification of signal-activated stochastic gene regulation. Science339, 584–587. 10.1126/science.1231456
101
Nicolas D. Phillips N. E. Naef F. (2017). What shapes eukaryotic transcriptional bursting?Mol. Biosyst.13, 1280–1290. 10.1039/c7mb00154a
102
Ochiai H. Hayashi T. Umeda M. Yoshimura M. Harada A. Shimizu Y. et al (2020). Genome-wide kinetic properties of transcriptional bursting in mouse embryonic stem cells. Sci. Adv.6, eaaz6699. 10.1126/sciadv.aaz6699
103
Ochiai H. Sugawara T. Sakuma T. Yamamoto T. (2014). Stochastic promoter activation affects Nanog expression variability in mouse embryonic stem cells. Sci. Rep.4, 7125. 10.1038/srep07125
104
Paulsson J. (2005). Models of stochastic gene expression. Phys. Life Rev.2, 157–175. 10.1016/j.plrev.2005.03.003
105
Paulsson J. Ehrenberg M. (2000). Random signal fluctuations can reduce random fluctuations in regulated components of chemical regulatory networks. Phys. Rev. Lett.84, 5447–5450. 10.1103/physrevlett.84.5447
106
Peccoud J. Ycart B. (1995). Markovian modeling of gene-product synthesis. Theor. Popul. Biol.48, 222–234. 10.1006/tpbi.1995.1027
107
Pichon X. Lagha M. Mueller F. Bertrand E. (2018). A growing toolbox to image gene expression in single cells: sensitive approaches for demanding challenges. Mol. Cell71, 468–480. 10.1016/j.molcel.2018.07.022
108
Pimmett V. L. Dejean M. Fernandez C. Trullo A. Bertrand E. Radulescu O. et al (2021). Quantitative imaging of transcription in living Drosophila embryos reveals the impact of core promoter motifs on promoter state dynamics. Nat. Commun.12, 4504. 10.1038/s41467-021-24461-6
109
Raj A. Peskin C. S. Tranchina D. Vargas D. Y. Tyagi S. (2006). Stochastic mRNA synthesis in mammalian cells. PLoS Biol.4, e309. 10.1371/journal.pbio.0040309
110
Rodriguez J. Larson D. R. (2020). Transcription in living cells: molecular mechanisms of bursting. Annu. Rev. Biochem.89, 189–212. 10.1146/annurev-biochem-011520-105250
111
Rodriguez J. Ren G. Day C. R. Zhao K. Chow C. C. Larson D. R. (2019). Intrinsic dynamics of a human gene reveal the basis of expression heterogeneity. Cell176, 213–226. 10.1016/j.cell.2018.11.026
112
Rullan M. Benzinger D. Schmidt G. W. Milias-Argeitis A. Khammash M. (2018). An optogenetic platform for real-time, single-cell interrogation of stochastic transcriptional regulation. Mol. Cell70, 745–756. 10.1016/j.molcel.2018.04.012
113
Schwabe A. Rybakova K. N. Bruggeman F. J. (2012). Transcription stochasticity of complex gene regulation models. Biophysical J.103, 1152–1161. 10.1016/j.bpj.2012.07.011
114
Senecal A. Munsky B. Proux F. Ly N. Braye F. E. Zimmer C. et al (2014). Transcription factors modulate c-Fos transcriptional bursts. Cell Rep.8, 75–83. 10.1016/j.celrep.2014.05.053
115
Sepúlveda L. A. Xu H. Zhang J. Wang M. Golding I. (2016). Measurement of gene regulation in individual cells reveals rapid switching between promoter states. Science351, 1218–1222. 10.1126/science.aad0635
116
Singer Z. S. Yong J. Tischler J. Hackett J. A. Altinok A. Surani M. A. et al (2014). Dynamic heterogeneity and DNA methylation in embryonic stem cells. Mol. Cell55, 319–331. 10.1016/j.molcel.2014.06.029
117
Singh A. Razooky B. Cox C. D. Simpson M. L. Weinberger L. S. (2010). Transcriptional bursting from the HIV-1 promoter is a significant source of stochastic noise in HIV-1 gene expression. Biophysical J.98, L32–L34. 10.1016/j.bpj.2010.03.001
118
Skupsky R. Burnett J. C. Foley J. E. Schaffer D. V. Arkin A. P. (2010). HIV promoter integration site primarily modulates transcriptional burst size rather than frequency. PLoS Comput. Biol.6, e1000952. 10.1371/journal.pcbi.1000952
119
Suter D. M. Molina N. Gatfield D. Schneider K. Schibler U. Naef F. (2011a). Mammalian genes are transcribed with widely different bursting kinetics. Science332, 472–474. 10.1126/science.1198817
120
Suter D. M. Molina N. Naef F. Schibler U. (2011b). Origins and consequences of transcriptional discontinuity. Curr. Opin. Cell Biol.23, 657–662. 10.1016/j.ceb.2011.09.004
121
Szavits-Nossan J. Grima R. (2023). Steady-state distributions of nascent RNA for general initiation mechanisms. Phys. Rev. Res.5, 013064. 10.1103/PhysRevResearch.5.013064
122
Szavits-Nossan J. Grima R. (2024). Solving stochastic gene expression models using queueing theory: a tutorial review. Biophys. J.123, 1034–1057. 10.1016/j.bpj.2024.04.004
123
Tang F. Barbacioru C. Wang Y. Nordman E. Lee C. Xu N. et al (2009). mRNA-Seq whole-transcriptome analysis of a single cell. Nat. Methods6, 377–382. 10.1038/nmeth.1315
124
Tang W. Bertaux F. Thomas P. Stefanelli C. Saint M. Marguerat S. et al (2018). bayNorm: Bayesian gene expression recovery, imputation and normalization for single-cell RNA-sequencing data. Bioinformatics36, 1174–1181. 10.1093/bioinformatics/btz726
125
Tang W. Jørgensen A. C. S. Marguerat S. Thomas P. Shahrezaei V. (2023). Modelling capture efficiency of single cell RNA-sequencing data improves inference of transcriptome-wide burst kinetics. Bioinformatics39, btad395. 10.1093/bioinformatics/btad395
126
Taniguchi Y. Choi P. J. Li G.-W. Chen H. Babu M. Hearn J. et al (2010). Quantifying E. coli proteome and transcriptome with single-molecule sensitivity in single cells. Science329, 533–538. 10.1126/science.1188308
127
Tantale K. Mueller F. Kozulic-Pirher A. Lesne A. Victor J.-M. Robert M.-C. et al (2016). A single-molecule view of transcription reveals convoys of RNA polymerases and multi-scale bursting. Nat. Commun.7, 12248. 10.1038/ncomms12248
128
Thomas P. Shahrezaei V. (2021). Coordination of gene expression noise with cell size: analytical results for agent-based models of growing cell populations. J. R. Soc. Interface.18, 20210274. 10.1098/rsif.2021.0274
129
Tomschik M. Zheng H. van Holde K. Zlatanova J. Leuba S. H. (2005). Fast, long-range, reversible conformational fluctuations in nucleosomes revealed by single-pair fluorescence resonance energy transfer. Proc. Natl. Acad. Sci.102, 3278–3283. 10.1073/pnas.0500189102
130
Toni T. Welch D. Strelkowa N. Ipsen A. Stumpf M. P. H. (2008). Approximate Bayesian computation scheme for parameter inference and model selection in dynamical systems. J. R. Soc. Interface6, 187–202. 10.1098/rsif.2008.0172
131
Tunnacliffe E. Chubb J. R. (2020). What is a transcriptional burst?Trends Genet.36, 288–297. 10.1016/j.tig.2020.01.003
132
Tunnacliffe E. Corrigan A. M. Chubb J. R. (2018). Promoter-mediated diversification of transcriptional bursting dynamics following gene duplication. Proc. Natl. Acad. Sci.115, 8364–8369. 10.1073/pnas.1800943115
133
T Z. Dong G. (2019). Quantitative analysis of gene expression regulation system. 2nd Edn.China: science press.
134
Viñuelas J. Kaneko G. Coulon A. Vallin E. Morin V. Mejia-Pous C. et al (2013). Quantifying the contribution of chromatin dynamics to stochastic gene expression reveals long, locus-dependent periods between transcriptional bursts. BMC Biol.11, 15. 10.1186/1741-7007-11-15
135
Vu T. N. Wills Q. F. Kalari K. R. Niu N. Wang L. Rantalainen M. et al (2016). Beta-Poisson model for single-cell RNA-seq data analyses. Bioinformatics32, 2128–2135. 10.1093/bioinformatics/btw202
136
Wang D. C. Wang X. (2021). Clinical significance of spatiotemporal transcriptional bursting and control. Clin. Transl. Med.11, e518. 10.1002/ctm2.518
137
Wang X. Li Y. Jia C. (2023). Poisson representation: a bridge between discrete and continuous models of stochastic gene regulatory networks. J. R. Soc. Interface20, 20230467. 10.1098/rsif.2023.0467
138
Wang Y. Liu F. Wang W. (2016). Kinetics of transcription initiation directed by multiplecis-regulatory elements on theglnAp2promoter. Nucleic Acids Res.44, 10530–10538. 10.1093/nar/gkw1150
139
Wang Y. Ni T. Wang W. Liu F. (2018). Gene transcription in bursting: a unified mode for realizing accuracy and stochasticity. Biol. Rev.94, 248–258. 10.1111/brv.12452
140
Wang Y. Yu Z. Grima R. Cao Z. (n.d.). Exact solution of a three-stage model of stochastic gene expression including cell-cycle dynamics.
141
Wang Z. Zhang Z. Luo S. Zhou T. Zhang J. (2024). Power-law behavior of transcriptional bursting regulated by enhancer–promoter communication. Genome Res.34, 106–118. 10.1101/gr.278631.123
142
Waterborg J. H. (1993). Histone synthesis and turnover in alfalfa. Fast loss of highly acetylated replacement histone variant H3.2. J. Biol. Chem.268, 4912–4917. 10.1016/s0021-9258(18)53482-7
143
Wu X. Lu M. Yun D. Gao S. Chen S. Hu L. et al (2021). Single-cell ATAC-Seq reveals cell type-specific transcriptional regulation and unique chromatin accessibility in human spermatogenesis. Hum. Mol. Genet.31, 321–333. 10.1093/hmg/ddab006
144
Xu H. Sepúlveda L. A. Figard L. Sokac A. M. Golding I. (2015). Combining protein and mRNA quantification to decipher transcriptional regulation. Nat. Methods12, 739–742. 10.1038/nmeth.3446
145
Zee B. M. Levin R. S. Xu B. LeRoy G. Wingreen N. S. Garcia B. A. (2010). In vivo residue-specific histone methylation dynamics. J. Biol. Chem.285, 3341–3350. 10.1074/jbc.m109.063784
146
Zhang J. Chen L. Zhou T. (2012). Analytical distribution and tunability of noise in a model of promoter progress. Biophysical J.102, 1247–1257. 10.1016/j.bpj.2012.02.001
147
Zhang J. Zhou T. (2014). Promoter-mediated transcriptional dynamics. Biophysical J.106, 479–488. 10.1016/j.bpj.2013.12.011
148
Zhang J. Zhou T. (2019). Markovian approaches to modeling intracellular reaction processes with molecular memory. Proc. Natl. Acad. Sci. U.S.A.116, 23542–23550. 10.1073/pnas.1913926116
149
Zhao Y. Liu L. Hassett R. Siepel A. (2023). Model-based characterization of the equilibrium dynamics of transcription initiation and promoter-proximal pausing in human cells. Nucleic Acids Res.51, e106. 10.1093/nar/gkad843
150
Zoller B. Little S. C. Gregor T. (2018). Diverse spatial expression patterns emerge from unified kinetics of transcriptional bursting. Cell175, 835–847. 10.1016/j.cell.2018.09.056
151
Zoller B. Nicolas D. Molina N. Naef F. (2015). Structure of silent transcription intervals and noise characteristics of mammalian genes. Mol. Syst. Biol.11, 823. 10.15252/msb.20156257
152
Zopf C. J. Quinn K. Zeidman J. Maheshri N. (2013). Cell-cycle dependence of transcription dominates noise in gene expression. PLoS Comput. Biol.9, e1003161. 10.1371/journal.pcbi.1003161
Summary
Keywords
transcriptional bursting, single-cell sequencing data, data integration, gene expression model, parameter inference
Citation
Zhang Q, Cao W, Wang J, Yin Y, Sun R, Tian Z, Hu Y, Tan Y and Zhang B-g (2024) Transcriptional bursting dynamics in gene expression. Front. Genet. 15:1451461. doi: 10.3389/fgene.2024.1451461
Received
19 June 2024
Accepted
30 August 2024
Published
13 September 2024
Volume
15 - 2024
Edited by
Laura Veschetti, San Raffaele Scientific Institute (IRCCS), Italy
Reviewed by
Yixin Zhao, Cold Spring Harbor Laboratory, United States
Hao Ge, Peking University, China
Updates
Copyright
© 2024 Zhang, Cao, Wang, Yin, Sun, Tian, Hu, Tan and Zhang.
This is an open-access article distributed under the terms of the Creative Commons Attribution License (CC BY). The use, distribution or reproduction in other forums is permitted, provided the original author(s) and the copyright owner(s) are credited and that the original publication in this journal is cited, in accordance with accepted academic practice. No use, distribution or reproduction is permitted which does not comply with these terms.
*Correspondence: Ben-gong Zhang, bgzhang@wtu.edu.cn; Yalan Tan, yltan@wtu.edu.cn
Disclaimer
All claims expressed in this article are solely those of the authors and do not necessarily represent those of their affiliated organizations, or those of the publisher, the editors and the reviewers. Any product that may be evaluated in this article or claim that may be made by its manufacturer is not guaranteed or endorsed by the publisher.