 Ting Yang1,2
 Xiaolu Lin3†
 Rui Chen1Ruiqi Wang1Tong Li1Fulong Shen3Xiaowei Zhang3Lianghua Lai3Bing Lu3Jiliang Wei3
 Xiaofang Xie1,2*
- 1College of Life Sciences, Fujian Agriculture and Forestry University, Fuzhou, China
- 2Fujian Key Laboratory of Crop Breeding by Design, Fujian Agriculture and Forestry University, Fuzhou, China
- 3Institute of Tobacco Science, Longyan Tobacco Company, Longyan, China
Optimizing fermentation duration is critical for producing high-quality cigar tobacco leaves This study examines changes in microorganisms and metabolites during CTL fermentation at four time points: 0 days (T0), 25 days (T1), 50 days (T2), and 75 days (T3). We observed a decreasing trend in total soluble sugars, starch, total nitrogen, and nicotine levels as fermentation progressed. Notably, chemical components stabilized after T2 stages. The microbial community showed dynamic fluctuations, with alpha diversity indices (Shannon, ACE, Pielou’s evenness, and Chao-2) reaching equilibrium at T2 and maintaining stability thereafter. Dominant genera such as Staphylococcus, Aspergillus, Sphingomonas, and Penicillium persisted throughout the fermentation process. A total of 1801 metabolites were identified, with 584 showing differential expression across the fermentation periods. Notably, comparisons between T0 and T1, T2, and T3 revealed 218, 377, and 419 differentially expressed metabolites, respectively. KEGG enrichment analysis identified 28 co-existing metabolic pathways, seven of which are linked to cigar quality formation. Furthermore, 29 out of 47 differential metabolites significantly correlated with the eight dominant microbial genera. These findings indicate that the T2 stage achieves optimal balance between microbial activity and metabolite stabilization, providing a scientific basis for industrial process optimization.
1 Introduction
Cigars are a special product made from fermented CTLs. In comparison to traditional cigarettes, cigars are manufactured with uniform colors, unique flavors, low tar content, and pleasant aromas. These distinctive features have made them highly favored by consumers (Zheng et al., 2022a). However, as sales in the Chinese and international markets continue to increase, the shortage of high-quality cigar raw materials has become more prominent.
By optimizing the fermentation duration, not only can we ensure high-quality raw materials for cigar products, but also achieve cost savings. Generally, CTLs are recommended to undergo fermentation for a period of 4–7 weeks (Jie et al., 2014). For instance, Li et al. (2020) conducted a study and determined that the ideal fermentation duration for Shiyan, Hubei Province cigar No. 1 was 6 weeks. However, due to variations in origin, year, variety, grade and maturity of tobacco, the optimal fermentation time may vary (Zhou et al., 2016).
When determining the appropriate duration for CTLs fermentation, it is crucial to analyze the dynamic changes of essential substances throughout the entire process. This is because the fermentation process involves complex transformations of chemical substances, microorganisms, and metabolic products (Wang et al., 2007). Research has shown that the surfaces of CTLs harbor a significant number of bacteria and molds. The main bacterial species identified include Bacillus, Pseudomonas and Sphingomonas, while molds such as Aspergillus and Penicillium are predominantly present (Zhong et al., 2010; Zhou et al., 2020; Wang et al., 2023). During fermentation, Bacillus plays a crucial role in decomposing large molecules such as lignin and carotene through the secretion of specific enzymes. This enzymatic activity leads to the production of small aromatic substances (Dai et al., 2020), Additionally, Pseudomonas effectively degrades nicotine, contributing to improving the appearance, aroma, and resolving other defects in CTLs. Furthermore, metabolites including flavonoids, organic acids, alkaloids and amino acids play a vital role in determining the quality of cigar (Zhang et al., 2011). Among them all amino acids are closely related to cigar quality. Throughout fermentation duration as well as industrial processing and smoking stages both enzyme-catalyzed and non-enzyme-catalyzed reactions occur between amino acids and reduced sugars resulting in the formation of pyrrole heterocyclic compounds like pyrazine and furan. These compounds significantly impact the flavor profile of cigar. Moreover phenylalanine is capable of directly decomposing into flavor compounds such as benzyl alcohol or phenylethano (Hecht et al., 1977).
The advancement of microbial sequencing technologies (Diehl et al., 2013; Arsenic et al., 2015) and broadly targeted metabolomics (Raamsdonk et al., 2001) offer effective solutions for uncovering and analyzing the intricate microbial communities and metabolite profiles in various environments, including those relevant to the fermentation process of CTLs. For instance, Wang et al. (2018) utilized metagenome sequencing technology to investigate bacterial diversity on the surface of aged flue-cured tobacco. They discovered that the dominant bacterial community exhibited diverse functional characteristics involved in flavor substance synthesis and harmful compound degradation such as nicotine and nitrite. Furthermore, Zhang et al. (2013) and Zhao et al. (2013) employed Gas Chromatography-Mass Spectrometry (GC-MS) technology to determinate the metabolic profile of fresh tobacco leaves from different regions, identifying 20 distinct metabolites contributing to the differentiation of tobacco leaves from Yunnan, Guizhou, and Henan regions. Xia et al. (2014) conducted a comprehensive study on the metabolic profiles of tobacco leaves from various geographical sources by screening for several important metabolites associated with growing regions and climatic factors. These findings indicate that both microbial sequencing technology and metabolomic techniques can effectively analyze microorganism composition as well as to assess variations in microorganisms abundance across different ecological environments. However, contemporary research on CTL fermentation mainly relies on single omics methods. These methods failed to systematically analyze the relationship between microbial dynamic changes and substance transformation. In contrast, the multi omics comprehensive analysis method has significant advantages and helps to gain a more comprehensive understanding of the CTL fermentation process.
This study utilized continuous flow analysis technology, metagenomic sequencing, and widely targeted metabolomics to comprehensively analyze the dynamic changes in relevant chemical substances, microbial communities, and metabolic products during the fermentation process of CTLs. Furthermore, by employing KEGG functional enrichment and correlation analysis, we investigated the evolving patterns of major microbial communities and metabolites throughout the fermentation process. The objective of this research is to establish a solid theoretical foundation for determining the optimal fermentation time for CTLs.
2 Materials and methods
2.1 Plant materials and sampling
The study utilized the cigar variety of FX-01, which was cultivated in Longyan District of Fujian Province. Middle leaves (MLs) at positions 8 to 10 (numbered sequentially from the plant base upward) were selected for analysis. CTLs with a moisture content ranging from 21% to 24% were stacked in a fermentation chamber maintained at 38 °C. Samples were collected at specific time points during the fermentation process, including day 0 (T0), day 25 (T1), day 50 (T2), and day 75 (T3). The T0 samples served as the control group for comparison. At each fermentation stage, 18 leaves were carefully collected from six bundles of cigar tobacco leaves stacked in the middle of the fermentation chamber—three leaves from each bundle, with each bundle containing 30 cigar tobacco leaves. These leaves were pooled into three biological replicates, with each replicate consisting of six leaves from six distinct bundles. The leaf surface was wiped with sterilized cotton swabs at least thirty times. Two tobacco leaves were wiped with each cotton swab, repeated three times (three cotton swabs for six leaves). The used cotton swabs were placed into tubes and stored in liquid nitrogen for metagenome sequencing purposes. Each biological sample’s leaves were divided along the main vein into two parts: one-half was immediately frozen at −20 °C for chemical composition analysis, while the other half was quickly stored in liquid nitrogen for future metabolome detection.
2.2 Chemical composition analysis
Total soluble sugar, starch, total nitrogen, and nicotin content were assessed using a continuous flow method following the Chinese tobacco industry standard (YC/T 161-2002, YC/T 160-2002, YC/T 216-2007, and YC/T 159-2002). The measurement methods for all chemical compositions were in accordance with the description provided by the Chinese tobacco industry standard method (Grant et al., 2002).
2.3 Metagenome sequencing and data analysis
Microbial genome extraction, PCR amplification, library construction, sequencing, and routine data analysis were conducted by Biomarker Technologies (http://www.biomarker.com.cn/). Metagenome sequencing was performed on the Illumina Hiseq2500 platform following standard protocols utilizing the shotgun sequencing method. This approach enables the identification of both known and unknown microbes in a sample with high discriminatory power. The raw tags were filtered using Fastp software (Chen et al., 2018) to obtain clean tags. MEGAHIT software (Jiang et al., 2020) was used for metagenomic assembly with a filter for contig sequences shorter than 300 bp. The assembly results were evaluated using QUAST software (Alexey et al., 2013). MetaGeneMark software (Wenhan et al., 2010) (http://exon.gatech.edu/meta_gmhmmp.cgi, Version 3.26) was employed to identify coding regions with a minimum open reading frame (ORF) length of 100 bp and log-likelihood score >50. MMseqs2 software (Steinegger and Söding, 2017) (https://github.com/soedinglab/mmseqs2, Version 12-113e3) was used to remove redundancy based on a similarity threshold of 95% and coverage threshold of 90%. A BLAST comparison was then conducted between the protein sequences of non-redundant genes and those deposited in the Amino acid sequence of nonredundant protein (NR) and KEGG database, using an e-value cutoff of 1e-5 to search for similar sequences. Negative controls (sterile swabs without sample contact) were processed in parallel, and any taxa detected in controls were excluded from experimental samples using Decontam R package (v1.18.0) with prevalence-based threshold (threshold = 0.1).
The QIIME software (https://qiime2.org) was used for conducting alpha diversity and beta diversity analyses. To evaluate sequencing depth, dilution curves were plotted using R software (version 2.15.3). Python was employed to generate stacked bar graphs of species distribution at different taxonomic levels. Analysis of similarities (Anosim) based on Jaccard and Bray-Curtis distances with the GUniFrac package in R was conducted to compare microbial communities. Linear Discriminant Analysis Effect Size (LEfSe) analysis was performed using the LEfSe v20171228 tool in a Python 2 environment to identify potential biomarkers across different fermentation durations. All analyses were carried out on the BMK Cloud platform (www.biocloud.net).
2.4 Widely targeted metabolomics analysis
The biological samples were free-dried using a vacuum lyophilizer (Scientz-100F, China) and ground into fine powder (30 Hz, 1.5 min) with a grinder (MM 400, Retsch, Germany). Then, 50 mg of the powder was accurately weighed (MS105DU, Mettler Toledo, Swizerland) and dissolve in 1200 μL of 70% methanol extraction solution. The mixture was vortexed vigorously for 30s and centrifuged at 12,000 rpm for 10 min at 4 °C. The supernatant was carefully transferred to a new microcentrifuge tubes and filtered through a 0.22 μm microporous polytetrafluoroethlene (PTFE) membrane. The filtrate was stored in injection vials for subsequent metabolite analysis.
Metabolites profiling was performed using ultra-high performance liquid chromatography-tandem mass spectrometry (UPLC-MS/MS) on a UPLC system (ExionLC™ AD, Sciex) coupled with a triple quadrupole mass spectrometer (6500 QTRAP, Applied Biosystems). The mass spectrometer was operated in both positive and negative electrospray ionization (ESI) modes under the following parameters: ion spray voltage, ±5500 V; source temperature 550 °C; curtain gas 35 psi; collision energy, 10-50 eV(optimized per metabolite). Chromatographic separation was achieved on an Agilent SB-C18 column (1.8 μm, 2.1 mm × 10 mm) with a gradient elution program consisting of 0.1% formic acid in water (mobile phase A) and 0.1% formic acid in acetonitrile (mobile phase B) as follows: 0-1 min, 5% B; 1-8 min, 5%-95% B; 8-9 min, 95% B; 9-10 min, 5% B for column reequilibration. The flow rate was 0.35 ml/min and the injection volume was 2 uL. All solvents used were of chromatographic grade (methanol, formic acid, and acetonitrile; Sigma-Aldrich, United States). Metabolite detection and quantification were performed by Wuhan Metware Biotechnology Co., Ltd. (www.metware.cn).
Raw data were processed using MetWare’s proprietary software based on the MWDB database. Peak alignment, extraction, and integration were performed followed by minimum value imputation and normalization. Metabolites were identified by matching with standard mass spectra and retention times. For statistical analysis, hierarchical cluster analysis (HCA), principal component analysis (PCA), and orthogonal partial least squares-discriminant analysis (OPLS-DA) were conducted using R Software (v4.2.1) and GraphPad Prism (v9.1.0). Differential metabolites were screened based on variable importance in projection (VIP) ≥1 from the OPLS-DA model and absolute log2 fold change (FC) ≥1. A Venn diagram was used to illustrate the overlapping relationships among different comparison groups. Identified metabolites were annotated using the KEGG Compound database (https://www.kegg.jp/kegg/compound/) and mapped to pathways in the KEGG Pathway database (https://www.kegg.jp/kegg/pathway.html). Pathways containing significantly regulated metabolites underwent metabolite set enrichment analysis (MSEA), with significance assessed using p-values from hypergeometric tests.
2.5 Integrative analysis of metagenomics and metabolomics
To investigate the relationship between microbiota and metabolites, we conducted an integrated analysis. We prioritized common pathways identified in both metagenomics and metabolomics based on the results of KEGG pathways analysis. Subsequently, we highlighted the metabolic pathways that are closely related to CTLs quality within this shared set of metabolic pathways. Additionally, we analyzed the correlation between the differential metabolites within the key metabolic pathways and the microbial abundance of the Top10 using R version’s ggcor 0.9.8.1 package.
3 Results
3.1 Appearance and physiological indexes of CTLs undergo dynamic changes during different stages of fermentation
During the fermentation process, cigar tobacco leaves undergo significant changes in appearance. As depicted in Figure 1A, there is a gradual decrease in the surface oil content of the leaves, resulting in creasing of the leaf surface. Moreover, the color of tobacco leaves progressively transforms from golden yellow at the beginning of fermentation (T0) to gray brown (T1), and eventually to a dark brown hue at T2 and T3. It is worth mentioning that slight cracking of the tobacco leaf surface begins from stage T1 onwards.
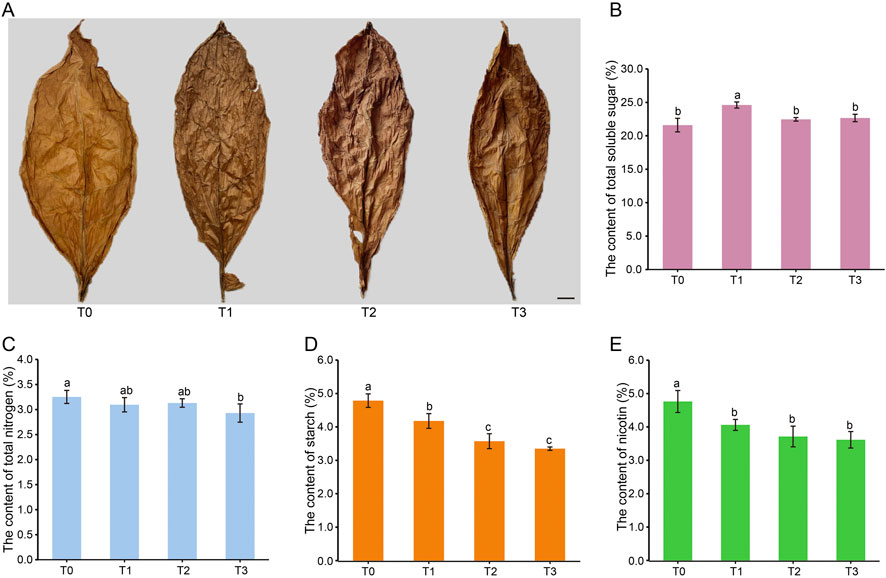
Figure 1. Appearance character (A) and chemical components (B–E) of CTLs at different fermentation periods. Note: T0 - T3 represents the fermentation of CTLs at the day 0, day 25, day 50 and day 75, respectively. Bar = 1 cm. Different lowercase letters after the same column of data indicate significant difference (P < 0.05).
In order to study the dynamic changes in chemical composition related to cigar quality, this study measured the levels of starch, total soluble sugar, total nitrogen, and nicotine (Figures 1B–E). As fermentation progressed, the total soluble sugar content initially increased from 21.60% (T0) to 24.60% (T1), then gradually decreased to 22.66% (T3). Starch content showed a continuous decline from 4.79% (T0) to 3.35% (T3), while nicotine decreased from 4.76% (T0) to 3.62% (T3). In contrast, total nitrogen exhibited minimal variation, decreasing slightly from 3.25% (T0) to 2.93%. It is worth noting that there were no significant differences in the levels of these four chemical substances during the T2 and T3 stages. These results indicate that overall fermentation reduces macro-molecular chemical substances, with this reduction reaching a plateau during the T2 and T3 periods.
3.2 Overview of microbial community
To assess the dynamic change patterns of CTLs microbial communities at different fermentation stages, a total of 12 samples were analyzed using metagenomic sequencing technology (PRJNA1190085). After quality control, we obtained a total of 508,766,922 clean reads with each sample’s data exceeding 6.0 Gb. Following sequence assembly, we obtained 7,734,288 contigs with more than 40,000 contigs in each sample and Q30 greater than 93%. The assembly results demonstrated good assembly quality as indicated by N50 values exceeding 711 bp and a maximum value of 1321 bp (Supplementary Table S1). The gene prediction analysis revealed a range of 318,856 to 621,394 identified genes in each sample. Additionally, the average length of individual genes varied from 355 to 415 base pairs across the samples. The dilution curve showed a flat trend (Figure 2A), indicating comprehensive OTU coverage provided by deep sequencing.
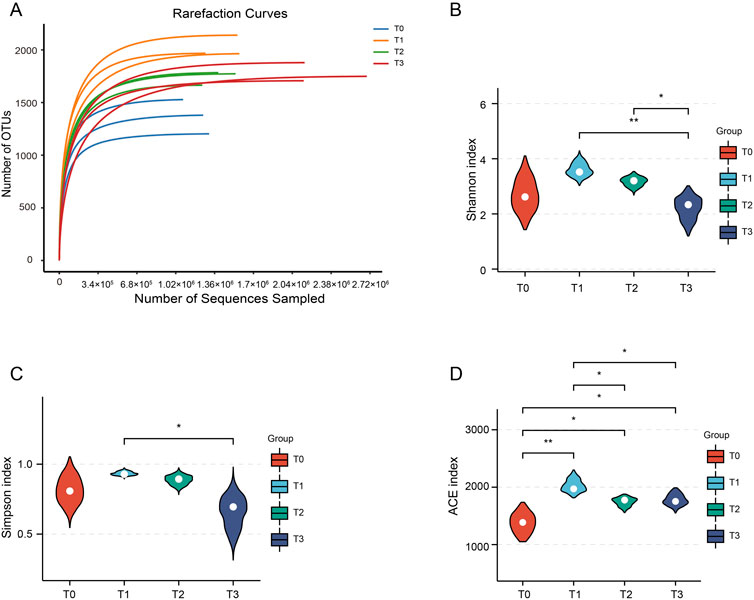
Figure 2. Dilution curves and alpha diversity of the CTLs. (A) Dilution curves for the four fermentation stages. (B–D) The alpha diversity of the CTLs microbiota is based on the Shannon, Simpson and ACE index, respectively. *P < 0.05, **P < 0.01.
Analysis of beta diversity in the samples revealed significant differences in community structure between different fermentation time points (Supplementary Figure S1). To assess the alpha diversity of the surface microbial community in CTLs, we examined the Shannon, Simpson, ACE, pielous_evenness and Chao-2 indices (Figures 2B–D; Supplementary Figure S2). The findings revealed that throughout the extended fermentation process, there was an initial increase in microbial diversity on CTLs’ surface followed by a gradual decrease. In T2 and T3 stages, apart from Shannon index, other indices demonstrated similar levels of microbial diversity as observed in the T1 stage where no significant difference was detected.
3.3 Taxonomic diversity and LEfSe difference of CTLs microbiota
During the fermentation process, the main microbiota at the phylum level were Proteobacteria, Firmicutes, and Ascomycota. Among them, the population of Proteobacteria initially increased from 38.16% (T0) to 57.78% (T2), then sharply declined to 25.31% (T3). Conversely, Firmicutes exhibited a sustained rise from 2.47% (T0) to 62.85% (T3) while Ascomycota dramatically decreased from 50.69% (T0) to 4.77% (T3). At the genus level, Staphylococcus, Asperigullus, Sphingomonas and Penicillium were the dominant microbiota. Staphylococcus exhibited explosive growth from 0.21% (T0) to 56.55% (T3), while Aspergillus declined sharply from 31.46% (T0) to 2.58% (T3). Sphingomonas showed a transient dominance at T2 (18.18%), and Penicillium fluctuated with peaks at T0 (19.32%) and T2 (17.58%) (Figures 3A,B).
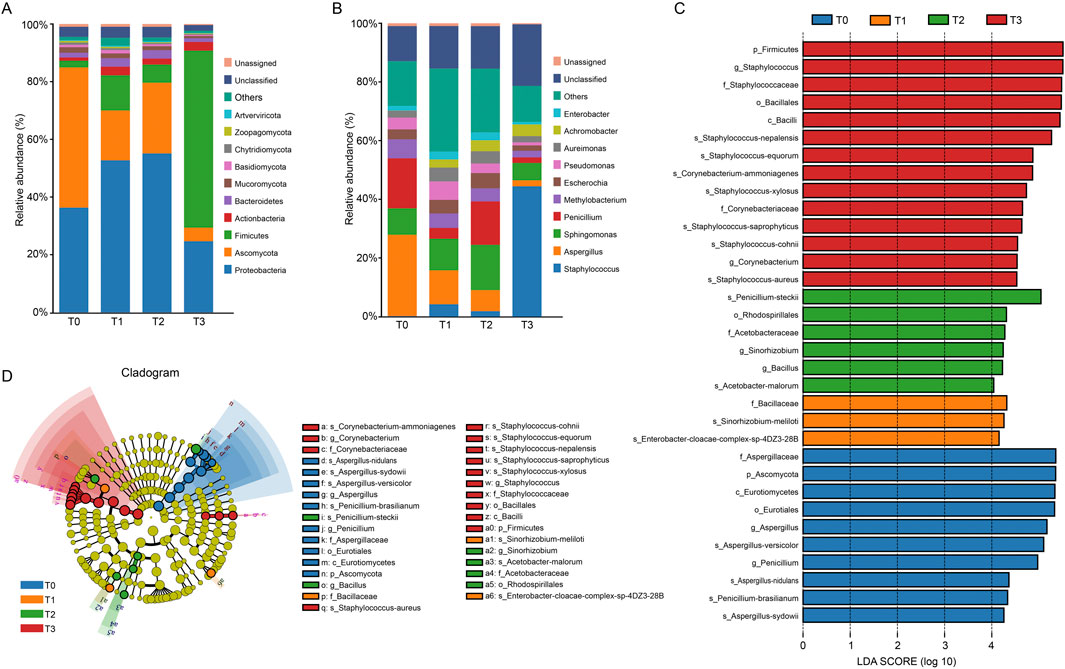
Figure 3. Taxonomic diversity and LEfSe different analysis of CTLs microbiota. Dominant microbial community composition at the phylum level (A) and the genus level (B) of the top 10. Unassigned refers to species that have not been annotated in the species annotation database; Unclassified refers to species that have been annotated by the species annotation database, but lack relevant information at this taxonomic level; others includes the sum of all the rest phyla (relative abundance, 0.01% each) generated by metagenomic data. (C,D) Evolutionary branching diagram based on LEfSe analysis (LDA score >4, P < 0.05). The circles from inner to outer represent taxonomic levels: phylum → class → order → family → genus. Colored nodes indicate taxa significantly enriched in T0 (blue), T1 (orange), T2 (green), or T3 (red).
To explore the microbial biomarkers of CTLs across fermentation duration, LEfSe analysis was performed with a linear discriminant analysis (LDA) threshold of 4 LDA and statistical significance (P < 0.05). The evolutionary branching diagram (Figures 3C,D) illustrates taxonomic relationships from phylum to genus levels (inner to outer circles), with colored nodes indicating taxa significantly enriched in specific stages (T0 - T3). A total of 33 microbial biomarkers were identified spanning 4 phyla, 5 classes, 6 orders, 7 families and 8 genera, with stage-specific counts as follows: T0 (10), T1 (3), T2 (6), and T3 (14). This U-shaped trend in biomarker abundance suggests initial community homogenization followed by divergence in later fermentation stages.
3.4 Metabolic profiling
To investigate the impact of different fermentation times on metabolites, a comprehensive metabolic profiling was conducted on samples T0, T1, T2, and T3 using UPLC-MS/MS, and a total of 1801 metabolites were identified, including alkaloids (15.99%), terpenoids (13.27%), amino acid and its derivatives (12.1%), flavonoids (9.88%), lipids (9.49%), phenolic acids (9.38%), organic acid (8.11%), nucleotide and its derivatives (3.83%), lignans and coumarins (3.22%), quinones (1.17%), steroids (0.28%), tannins (0.06%), and others (13.21%) (Figure 4A).
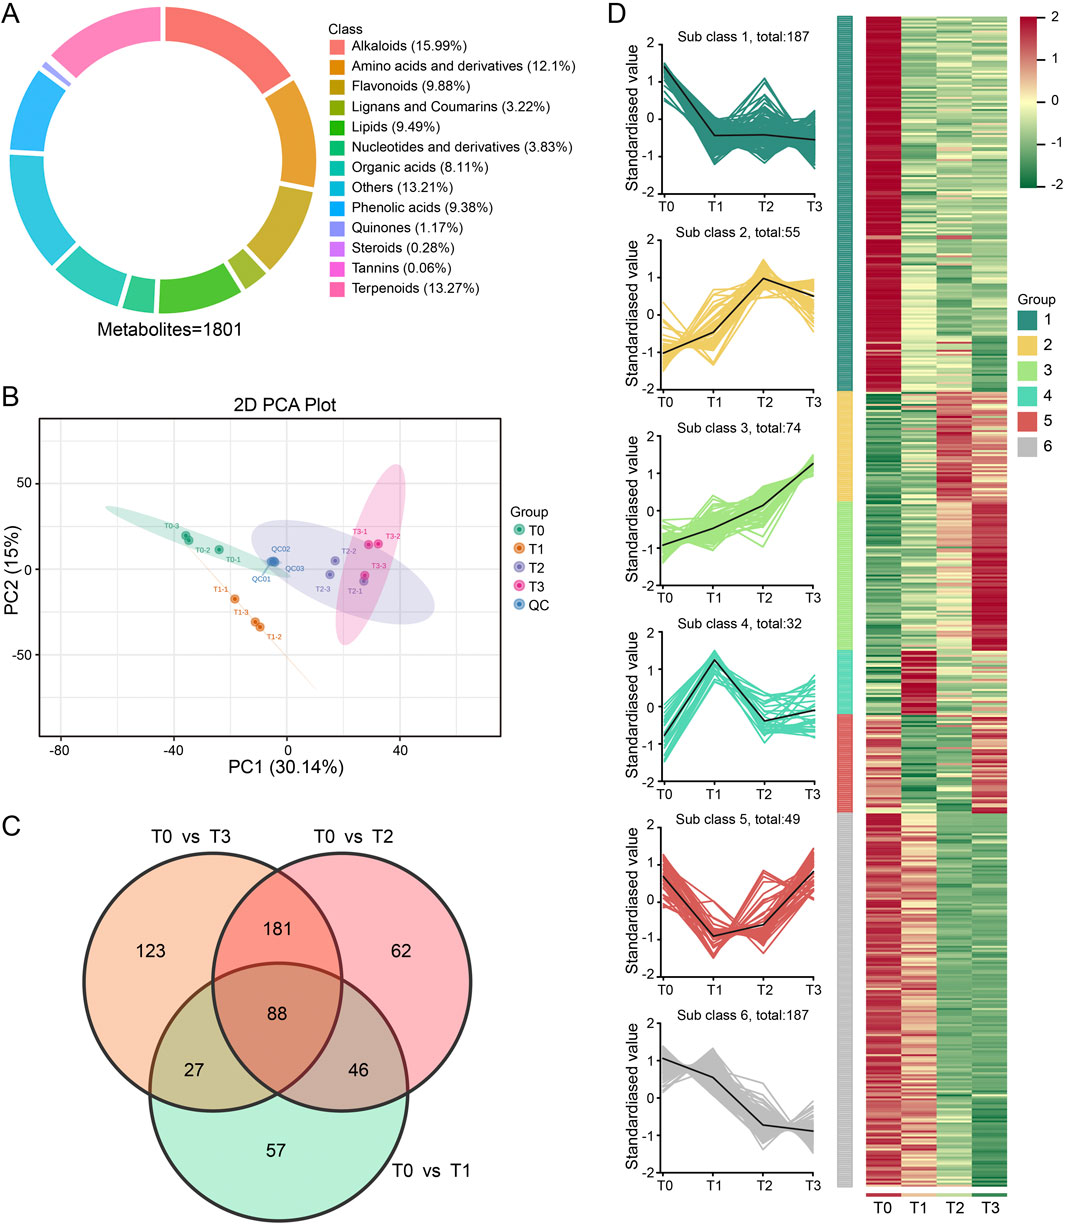
Figure 4. Analysis of CTLs metabolic profiles at 4 fermentation stages. (A) Classification of the 1801 metabolites of CTLs samples. (B) Score scatter plot for principal component analysis (PCA) model. (C) Venn diagram showing the numbers of common and specific differential metabolites among the different comparisons. (D) Line charts plot of K-means clustering of differential metabolites and visualization of clustering heatmap.
Principal component analysis (PCA) was used to assess the reliability of the identification results and to examine the overall variations in compound composition among the 12 samples. The first and second principal components accounted for 30.14% and 15.00% of the total variation, respectively (Figure 4B). The PCA plot clearly demonstrated distinct clustering patterns among the samples corresponding to different fermentation stages. Additionally, the samples were primarily segregated based on three biological replicates, with the exception of T2 and T3 samples, which exhibited a slight tendency to aggregate. This result was consistent with the result of the hierarchical cluster analysis (HCA) (Supplementary Figure S3), indicating that there is substantial variation in metabolite levels across various fermentation periods.
The Orthogonal Partial Least Squares-Discriminant Analysis (OPLS-DA) model (Supplementary Figure S4) was used to identify differential metabolites among the three comparison groups. A total of 584 differential metabolites were detected, which were unevenly distributed across the three comparisons, namely, T0 vs. T1 (218), T0 vs. T2 (377) and T0 vs. T3 (419). Among them, 88 metabolites were found to be overlapping across multiple comparisons metabolites (Figure 4C; Supplementary Table S3). Further K-means cluster analysis showed that these 584 differential metabolites were grouped into 6 profiles (Figure 4D). The relative content of metabolites within each profile exhibited similarities in their clustering. Notable, profile 1 and 6 contained the largest sets of metabolites, each comprising 187 metabolites, followed by profile 3 (74 metabolites) and profile 2 (55 metabolites), respectively. In addition, the metabolites content included in profile 1 and 6 displayed a downward trend during CTLs fermentation. In contrast, 74 metabolites included in profile 3 showed continuously upregulated.
3.5 Combination analysis of metabolomic and metagenomic
To explore the metabolic relationship between functional microbial communities and the production of fermentation products that are relevant to the taste and biochemical transformation of CTLs. The combined analysis of metagenomic and metabolomic was performed to analyze the changes in microbial community structure and metabolites during the fermentation process of CTLs. According to the KEGG enrichment analysis, a total of 174 and 38 metabolic pathways were identified in metagenome and metabolome, respectively. Notably, 28 metabolic pathways were co-enriched by both the metabolome and the macro group (Figure 5A). The relative abundance of these co-enriched metabolic pathways was shown in the bar chart (Figures 5B,C).
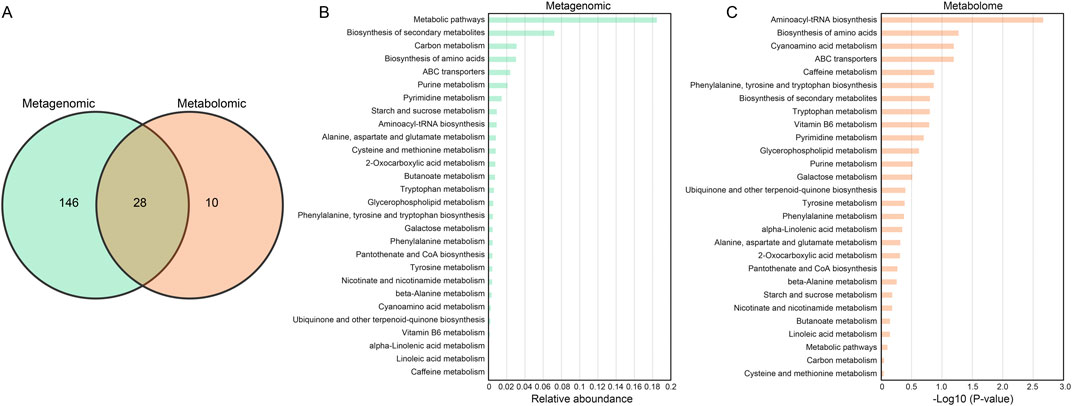
Figure 5. Integrated analysis of pathways enriched by microorganisms and differential metabolites. (A) Venn diagram illustrating the overlapping and specific metabolic pathway of microorganisms and metabolites. Relative abundance map of 28 overlapping KEGG pathways in (B) metagenome and (C) metabolome.
Among these co-enriched pathways, a total of seven metabolic pathways are closely related to the formation of cigar quality, including amino acid biosynthesis, aromatic amino acid metabolic (tryptophan, tyrosine and phenylalanine), starch and sugar metabolic, carbon metabolic, and nicotinate and nicotinamide metabolism. Figure 6 illustrates the 7 metabolic pathways along with the 47 related metabolites involved in these pathways and their correlations. Notably, three overlapping metabolites across all comparison groups - L-Asparagine (amino acid biosynthesis), Shikimic acid (amino acid biosynthesis), and 3-Hydroxyanthranilic acid (tryptophan metabolism) - showed consistent downregulation (T0 vs. T1/T2/T3, Supplementary Table S3). Their decline aligns with the reduction of total nitrogen (4.76% to 3.62%) and nicotine (3.25% to 2.93%) in Figures 1D,E, suggesting microbial catabolism of amino acid precursors into volatile aroma compounds (e.g., phenylacetaldehyde).
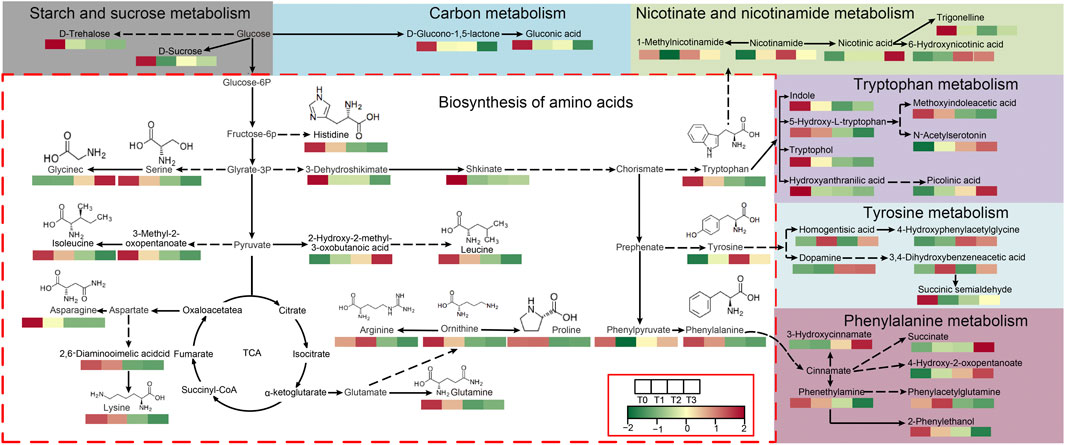
Figure 6. Map of 7 KEGG pathways associated with CTLs quality. Note: The proposed metabolic pathways were constructed based on experimental data analysis, with references to the KEGG PATHWAY Database and relevant literature.
Intra-group correlation analysis was performed within the 47 differential metabolites associated with the 7 metabolic pathways, and further inter-group correlation analysis was performed between these 47 differential metabolites and the top 10 microorganisms (Figure 7). In the intra-group correlation, significant correlations were found among the majority metabolites except four metabolites, namely, 3, 4-dihydroxybenzeneacetic acid, homogentisic acid, 1-Methylnicotinamide, and phenylpyruvic acid. Inter-group analysis showed that 8 dominant microbial genera, namely, Staphylococcus, Aspergillus, Penicillium, Methylobacterium, Escherichia, Aureimonas, Achromobacter and Enterobacter, were significantly associated with 29 metabolites. This result implies that these bacteria genera may serve as the functional bacteria involved in the metabolism of these metabolites.
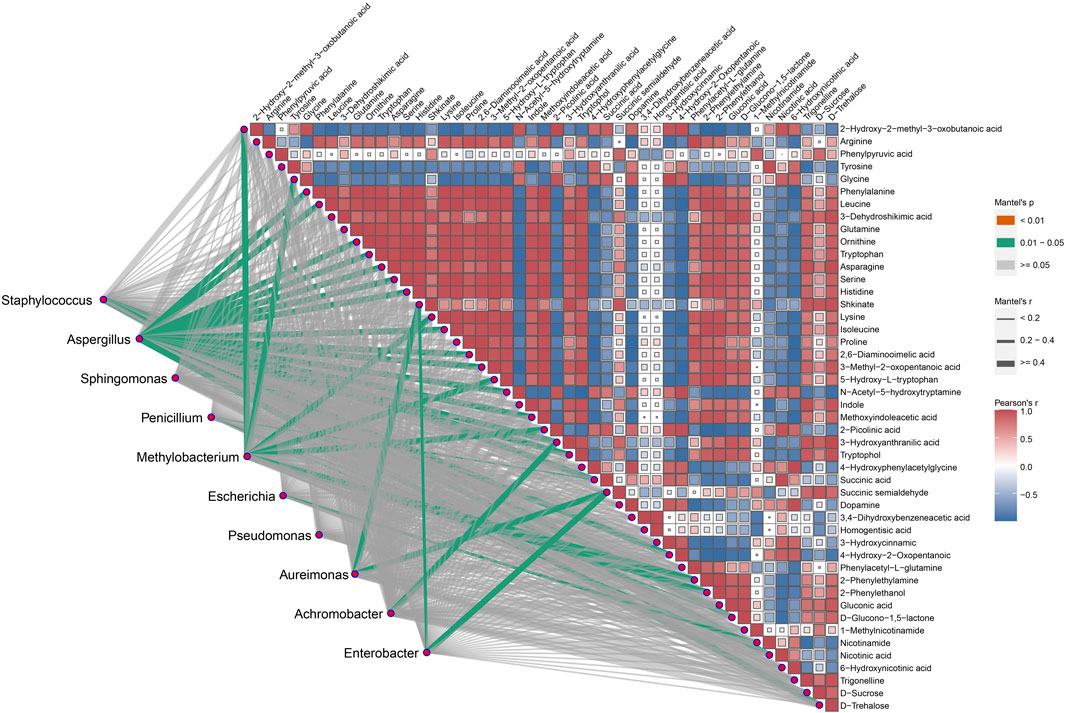
Figure 7. The correlation between the top 10 microbial community and the primary differential metabolites. The green line represents a significant correlation between the two omics, with the strength of the correlation increasing as the line thickness grows. The squares represent the different metabolites involved in the seven metabolic pathways, with the red squares depicting positive correlations, blue squares showing negative correlations, and uncolored boxes represent no relevant correlations.
4 Discussion
The color of CTLs is an important indicator for assessing cigar quality, as it reflects the internal quality of the cigars. In this study, CTLs exhibited a golden hue during the unfermented period (T0), but as fermentation time progressed, their color gradually deepened and eventually became a dark shade in the T2 and T3 periods (Figure 1A). This change in color is thought to be related to non-enzymatic reactions of monosaccharides such as Maillard reaction, as suggested by previous research (Liu et al., 2021). In our study, we observed variations in the levels of total soluble sugar, which can be broken down into monosaccharides. Notably, metabolites including D-Sucrose, D-Trehalose, Gluconic acid, and D-Glucono-1,5-lactone, which are produced through Starch and Sucrose metabolism and Carbon metabolism, were identified and their dynamics may contribute to these color-changing reactions.
The taste and aroma of CTLs are notable indicators for evaluating the quality of cigars, as they are associated with alkaloids, carbohydrates, and proteins (Arihara et al., 2016; Liu et al., 2021; Rivera and Tyx, 2021). This study examined the changes in starch, total soluble sugars, total nitrogen, and nicotine at four fermentation time points, which are closely related to the formation of alkaloids, carbohydrates, and proteins (Figures 1B–E). The results indicated that, compared to the control group at T0, there was a noteworthy increase in total soluble sugars at T1 during fermentation. However, a decrease in starch content and varying degrees of reduction in total nitrogen and nicotine were observed at T2 and T3. These findings are in line with Liu et al., 's 2015 study (2015), which suggested that microorganisms gradually degrade total nitrogen and nicotine into smaller molecules such as amino acids, organic acids, and volatile ammonia during the fermentation process, leading to a decrease in their content. Contrasting with Liu et al. (2015), who identified Bacillus as the primary starch degrader in Shiyan cigars, our study highlights Staphylococcus dominance—a divergence likely tied to Fujian’s distinct climate (higher humidity) (Philippot et al., 2024). Furthermore, most of the metabolites (14/22) produced from nicotinate and nicotinamide metabolism, tryptophan metabolism, tyrosine metabolism, and phenylalanine metabolism (Figure 6) showed an increasing trend in content during late-stage fermentation (T2, T3), further aligning with Liu et al. (2015) study conclusion.
The aroma components of CTLs mainly steam from the tobacco leaf and the fermentation process. Fermentation can contribute to the formation of tobacco aroma (Fan et al., 2023). In this study, a total of 18 metabolites were enriched in three aromatic amino acid metabolic pathways: phenylalanine, tryptophan, and tyrosine (Figure 6). Significant changes were observed in metabolites derived from these pathways during the fermentation process, such as phenylacetaldehyde, benzyl alcohol, and benzyl carbinol, which are known to play a role in cigar aroma formation. Additionally, metabolites, including 1-Methylnicotinamide, nicotinamide, nicotinic acid, and trigonelline, which are produced through nicotinamide metabolism, tryptophan metabolism, tyrosine metabolism, and phenylalanine metabolism, are thought to be linked to the sensory attributes of CTLs, particularly affecting the taste and flavor.
During the late stages of CTLs fermentation (T2 to T3), most quality-related indicators remained stable, suggesting that the fermentation process had largely plateaued. Visual characteristics such as color (Figure 1A) and key biochemical parameters—including starch, total soluble sugars, total nitrogen, and nicotine—showed minimal variation, indicating a state of equilibrium in chemical composition. Metabolomic analysis further supported this trend: the number of significantly different metabolites between time points decreased progressively, reflecting a diminishing influence of fermentation on metabolic profiles (Supplementary Figure S5). Notably, compounds associated with starch and sucrose metabolism, carbon metabolism, and amino acid biosynthesis—such as D-sucrose, D-trehalose, gluconic acid, D-glucono-1,5-lactone, proline, tyrosine, and phenylalanine—exhibited comparable levels at T2 and T3. However, extending fermentation to T3 may pose a risk of over-degradation of desirable flavor compounds. Although nicotine levels did not differ significantly between T2 and T3 (Figure 1E), a slight downward trend was observed. This subtle reduction could attenuate the characteristic pungency of tobacco, an essential sensory attribute that shapes the overall flavor profile and consumer acceptability. A parallel can be drawn with tea processing, where prolonged microbial fermentation leads to excessive degradation of polyphenols (Liu et al., 2018). These bioactive compounds are crucial for tea’s flavor, antioxidant capacity, and health benefits. Thus, just as in tea, over-fermentation in tobacco may compromise product quality and sensory attributes. These findings indicate that prolonging fermentation provides minimal additional benefits while potentially compromising critical quality attributes.
The activity of microorganisms during the fermentation process of CTLs is closely associated with changes in various metabolites, which directly influence cigar quality. Microbial communities in fermented CTLs vary depending on factors such as region, variety, and fermentation method. However, consistently dominant genera include Staphylococcus, Aspergillus, and Pseudomonas (Zheng et al., 2022b), finding that align with this study (Figure 3B). Specifically, Staphylococcus and Aspergillus exhibit significant positive correlations with carbohydrate metabolites D-Glucono-1,5-lactone and D-Trehalose, respectively (Figure 7). This indicates that Aspergillus and Staphylococcus drive carbon metabolic and starch and sugar metabolic through enzymes like α-amylase and glucoamylase, facilitating starch degradation and promoting the formation D-Glucono-1,5-lactone and D-Trehalose (Lakshmi et al., 2013; Yun et al., 2020). Moreover, Aspergillus shows a strong correlation with amino acids such as phenylalanine, leucine and ornithine, suggesting its involvement in amino acid metabolic pathways that contribute to aroma development in CTLs.
While this study has made initial strides in identifying key microbial taxa and their correlations with metabolite dynamics through multi-omics approaches, it further generates a novel testable hypothesis: that the dynamic co-occurrence of Staphylococcus, Ascomycota and Penicillium between T1 and T2 stages establishes a synergistic metabolic network crucial for the degradation of macromolecules (e.g., starch, nicotine) and the concurrent synthesis of key aroma compounds. However, the functional roles of these microorganisms and the underlying enzymatic mechanisms have not been experimentally validated. Future research should focus on constructing synthetic microbial consortia based on these dominant genera to verify their contributions to flavor and quality development. Additionally, targeted inoculation experiments and mechanistic studies—particularly those measuring specific enzyme activities (e.g., amylases, proteases, and nicotine-degrading enzymes) and quantifying the resulting metabolic products—are essential to elucidate the causal relationships and biochemical pathways involved. Such efforts would not only validate the proposed hypothesis but could also significantly enhance the fermentation process of cigar tobacco leaves and ultimately improve their overall quality.
5 Conclusion
This study demonstrate that the T2 stage achieves an optimal balance between microbial equilibrium and metabolite stabilization, providing a scientific foundation for refining industrial fermentation processes. More importantly, it proposes a novel mechanistic hypothesis: the microbial equilibrium observed at the T2 stage signifies not just taxonomic stability but also functional convergence, driving the optimal transformation of metabolites essential for cigar quality. This hypothesis provides a foundation for developing synthetic microbial communities specifically tailored to improve product quality.
Data availability statement
The datasets presented in this study can be found in online repositories. The raw reads were submitted to NCBI SRA (Sequence Read Archive, http://www.ncbi.nlm.nih.gov/sra/) under the accession number PRJNA1190085, while the generated datasets is provided within the manuscript or supplementary information files.
Author contributions
TY: Writing – original draft. XL: Writing – review and editing. RC: Data curation, Writing – original draft. RW: Writing – original draft, Data curation. TL: Investigation, Writing – original draft. FS: Investigation, Writing – original draft. XZ: Writing – review and editing. LL: Writing – review and editing. BL: Writing – original draft, Resources. JW: Resources, Writing – original draft. XX: Investigation, Writing – review and editing.
Funding
The author(s) declare that financial support was received for the research and/or publication of this article. This research was financially supported by Fujian Tobacco Company (LK-2022Y02; LK-2022Y06) and China Tobacco Company (110202201028 (LS-12)). The funders had no role in the study design, data collection and analysis, decision to publish, or preparation of the manuscript.
Conflict of interest
Authors XL, FS, XZ, LL, BL, and JW were employed by Institute of Tobacco Science, Longyan Tobacco Company.
The remaining authors declare that the research was conducted in the absence of any commercial or financial relationships that could be construed as a potential conflict of interest.
Generative AI statement
The author(s) declare that no Generative AI was used in the creation of this manuscript.
Any alternative text (alt text) provided alongside figures in this article has been generated by Frontiers with the support of artificial intelligence and reasonable efforts have been made to ensure accuracy, including review by the authors wherever possible. If you identify any issues, please contact us.
Publisher’s note
All claims expressed in this article are solely those of the authors and do not necessarily represent those of their affiliated organizations, or those of the publisher, the editors and the reviewers. Any product that may be evaluated in this article, or claim that may be made by its manufacturer, is not guaranteed or endorsed by the publisher.
Supplementary material
The Supplementary Material for this article can be found online at: https://www.frontiersin.org/articles/10.3389/fgene.2025.1662815/full#supplementary-material
SUPPLEMENTARY FIGURE S1 | The beta diversity of the CTLs microbiota is based on the binary jaccarad distance and bray curtis distance.
SUPPLEMENTARY FIGURE S2 | The alpha diversity of the CTLs microbiota is based on the Chao-2 and pielou_evenness index, respectively. * P < 0.05, ** P < 0.01.
SUPPLEMENTARY FIGURE S3 | The HCA of the 1801 metabolites of CTLs samples.
SUPPLEMENTARY FIGURE S4 | The score charts of the OPLS-DA model for three comparisons.
SUPPLEMENTARY FIGURE S5 | Bar chart showing the number of differentially expressed metabolites (DEMs) in three comparison groups.
References
Alexey, G., Vladislav, S., Nikolay, V., and Glenn, T. (2013). QUAST: quality assessment tool for genome assemblies. Bioinformatics 29, 1072–1075. doi:10.1093/bioinformatics/btt086
Arihara, K., Zhou, L., and Ohata, M. (2016). Bioactive properties of maillard reaction products generated from food protein-derived peptides. Adv. Food Nutr. Res. 81, 161–185. doi:10.1016/bs.afnr.2016.11.005
Arsenic, R., Treue, D., Lehmann, A., Hummel, M., Dietel, M., Denkert, C., et al. (2015). Comparison of targeted next-generation sequencing and sanger sequencing for the detection of PIK3CA mutations in breast cancer. BMC Clin. Pathol. 15, 20–29. doi:10.1186/s12907-015-0020-6
Chen, S., Zhou, Y., Chen, Y., and Gu, J. (2018). Fastp: an ultra-fast all-in-one FASTQ preprocessor. Bioinformatics 34, i884–i890. doi:10.1093/bioinformatics/bty560
Dai, J., Dong, A., Xiong, G., Liu, Y., Qiu, D., Liu, S., et al. (2020). Production of highly active extracellular amylase and cellulase from Bacillus subtilis ZIM3 and a recombinant strain with a potential application in tobacco fermentation. Front. Microbiol. 11, 1539. doi:10.3389/fmicb.2020.01539
Diehl, G. E., Longman, R. S., Zhang, J. X., Breart, B., Galan, C., Cuesta, A., et al. (2013). Microbiota restricts trafficking of bacteria to mesenteric lymph nodes by CX(3)CR1(hi) cells. Nature 494, 116–120. doi:10.1038/nature11809
Fan, J., Kong, G., Yao, H., Wu, Y., Zhao, G., Li, F., et al. (2023). Widely targeted metabolomic analysis reveals that volatile metabolites in cigar tobacco leaves dynamically change during fermentation. Biochem. Biophys. Rep. 35, 101532. doi:10.1016/j.bbrep.2023.101532
Grant, L. A., Ostenson, A. M., and Rayas-Duarte, P. (2002). Determination of amylose and amylopectin of wheat starch using high performance size-exclusion chromatography (HPSEC). Cereal Chem. 79, 771–773. doi:10.1094/cchem.2002.79.6.771
Hecht, S. S., Schmeltz, I., and Hoffmann, D. (1977). Nitrogenous compounds in cigarette smoke and their possible precursors. Recent Adv. Tob. Sci. 3, 59–83.
Jiang, L. Q., An, D. F., Zhang, K., Li, G. D., Jiang, Y., Lang, L., et al. (2020). Nakamurella albus sp. Nov.: a novel actinobacterium isolated from a lichen sample. Curr. Microbiol. 77 (08), 1896–1901. doi:10.1007/s00284-020-01928-1
Jie, W., Dai-Long, Z., Lei, F. U., Chun-Gang, Z., and Xiang-Dong, S. (2014). Research progress of air-cured tobacco fermentation. J. Henan Agric. Sci. 43, 1–4.
Lakshmi, H. P., Prasad, U. V., Yeswanth, S., Swarupa, V., Prasad, O. H., Narasu, M. L., et al. (2013). Molecular characterization of α-amylase from Staphylococcus aureus. Bioinformation 9, 281–285. doi:10.6026/97320630009281
Li, J., Zhao, Y., Qin, Y., and Shi, H. (2020). Influence of microbiota and metabolites on the quality of tobacco during fermentation. BMC Microbiol. 20, 356. doi:10.1186/s12866-020-02035-8
Liu, J., Ma, G., Chen, T., Hou, Y., Yang, S., Zhang, K. Q., et al. (2015). Nicotine-degrading microorganisms and their potential applications. Appl. Microbiol. and Biotechnol. 99, 3775–3785. doi:10.1007/s00253-015-6525-1
Liu, P. P., Yin, J. F., Chen, G. S., Wang, F., and Xu, Y. Q. (2018). Flavor characteristics and chemical compositions of oolong tea processed using different semi-fermentation times. J. Food Sci. Technol. 55, 1185–1195. doi:10.1007/s13197-018-3034-0
Liu, F., Wu, Z., Zhang, X., Xi, G., Zhao, Z., Lai, M., et al. (2021). Microbial community and metabolic function analysis of cigar tobacco leaves during fermentation. MicrobiologyOpen 10, e1171. doi:10.1002/mbo3.1171
Philippot, L., Chenu, C., Kappler, A., Rillig, M. C., and Fierer, N. (2024). The interplay between microbial communities and soil properties. Nat. Rev. Microbiol. 22, 226–239. doi:10.1038/s41579-023-00980-5
Raamsdonk, L. M., Teusink, B., Broadhurst, D., Zhang, N., Hayes, A., Walsh, M. C., et al. (2001). A functional genomics strategy that uses metabolome data to reveal the phenotype of silent mutations. Nat. Biotechnol. 19, 45–50. doi:10.1038/83496
Rivera, A. J., and Tyx, R. E. (2021). Microbiology of the American smokeless tobacco. Appl. Microbiol. and Biotechnol. 105, 4843–4853. doi:10.1007/s00253-021-11382-z
Steinegger, M., and Söding, J. (2017). MMseqs2 enables sensitive protein sequence searching for the analysis of massive data sets. Nat. Biotechnol. 35, 1026–1028. doi:10.1038/nbt.3988
Wang, S. N., Liu, Z., Tang, H. Z., Meng, J., and Xu, P. (2007). Characterization of environmentally friendly nicotine degradation by Pseudomonas putida biotype A strain S16. Microbiology 153, 1556–1565. doi:10.1099/mic.0.2006/005223-0
Wang, F., Zhao, H., Xiang, H., Wu, L., Men, X., Qi, C., et al. (2018). Species diversity and functional prediction of surface bacterial communities on aging flue-cured tobaccos. Curr. Microbiol. An Int. J. 75, 1306–1315. doi:10.1007/s00284-018-1525-x
Wang, Y., Luo, X., Chu, P., Shi, H., Wang, R., Li, J., et al. (2023). Cultivation and application of nicotine-degrading bacteria and environmental functioning in tobacco planting soil. Bioresour. Bioprocess. 10, 10–11. doi:10.1186/s40643-023-00630-x
Wenhan, Z., Alexandre, L., and Mark, B. (2010). Ab initio gene identification in metagenomic sequences. Nucleic Acids Res. 38, e132. doi:10.1093/nar/gkq275
Xia, B., Feng, M., Xu, G., Xu, J., Li, S., Chen, X., et al. (2014). Investigation of the chemical compositions in tobacco of different origins and maturities at harvest by GC-MS and HPLC-PDA-QTOFMS. J. Agric. Food Chem. 62, 4979–4987. doi:10.1021/jf5009204
Yun, J., Cheng-Tuo, N., Zhen-Ming, L., Xiao-Juan, Z., Li-Juan, C., Jin-Song, S., et al. (2020). A Bottom-Up approach to develop a synthetic microbial community model: application for efficient reduced-salt broad bean paste fermentation. Appl. Environ. Microbiol. 86 (12), e00306–e00320. doi:10.1128/AEM.00306-20
Zhang, J., Yy, C., and Sy, T.Hr (2011). Dynamic metabonomic responses of tobacco (Nicotiana tabacum) plants to salt stress. J. PROTEOME Res. 10, 1904–1914. doi:10.1021/pr101140n
Zhang, L., Wang, X., Guo, J., Xia, Q., Xie, F., Zhou, H., et al. (2013). Metabolic profiling of Chinese tobacco leaf of different geographical origins by GC-MS. J. Agric. and Food Chem. 61, 2597–2605. doi:10.1021/jf400428t
Zhao, Y., Zhao, C., Lu, X., Zhou, H., Li, Y., Zhou, J., et al. (2013). Investigation of the relationship between the metabolic profile of tobacco leaves in different planting regions and climate factors using a pseudotargeted method based on gas chromatography/mass spectrometry. J. Proteome Res. 12, 5072–5083. doi:10.1021/pr400799a
Zheng, T., Zhang, Q., Li, P., Wu, X., Liu, Y., Yang, Z., et al. (2022a). Analysis of microbial community, volatile flavor compounds, and flavor of cigar tobacco leaves from different regions. Front. Microbiol. 13, 907270. doi:10.3389/fmicb.2022.907270
Zheng, T., Zhang, Q., Wu, Q., Li, D., Wu, X., Li, P., et al. (2022b). Effects of inoculation with acinetobacter on fermentation of cigar tobacco leaves. Front. Microbiol. 13, 911791. doi:10.3389/fmicb.2022.911791
Zhong, W., Zhu, C., Shu, M., Sun, K., Zhao, L., Wang, C., et al. (2010). Degradation of nicotine in tobacco waste extract by newly isolated pseudomonas sp. ZUTSKD. Bioresour. Technol. 101, 6935–6941. doi:10.1016/j.biortech.2010.03.142
Zhou, W., Liu, Y., Zeng, D., Yang, J., and Hu, X. (2016). The study and application of cigar filler stacking fermentation technology. Hans J. Agric. Sci. 06, 63–70. doi:10.12677/hjas.2016.63010
Keywords: cigar tobacco leaves (CTLs), multi-omics, fermentation, microbial community, metabolites
Citation: Yang T, Lin X, Chen R, Wang R, Li T, Shen F, Zhang X, Lai L, Lu B, Wei J and Xie X (2025) Integrated metagenomics and metabolomics analysis reveals dynamic changes of microbiota and metabolic profile during fermentation of cigar tobacco (Nicotiana tabacum L.) leaves. Front. Genet. 16:1662815. doi: 10.3389/fgene.2025.1662815
Received: 09 July 2025; Accepted: 16 October 2025;
Published: 10 November 2025.
Edited by:
Louis Pergaud Sandjo, Federal University of Santa Catarina, BrazilReviewed by:
Arvind H. Hirani, Kemin Industries, Inc., United StatesMihasan Marius, Alexandru Ioan Cuza University, Romania
Copyright © 2025 Yang, Lin, Chen, Wang, Li, Shen, Zhang, Lai, Lu, Wei and Xie. This is an open-access article distributed under the terms of the Creative Commons Attribution License (CC BY). The use, distribution or reproduction in other forums is permitted, provided the original author(s) and the copyright owner(s) are credited and that the original publication in this journal is cited, in accordance with accepted academic practice. No use, distribution or reproduction is permitted which does not comply with these terms.
*Correspondence: Xiaofang Xie, eHhmMzE3QGZhZnUuZWR1LmNu
†These authors share first authorship