 Shuran Wang
 Lilian Zhang1,2,3
- 1College of Big Data, Yunnan Agricultural University, Kunming, China
- 2Yunnan Engineering Technology Research Center of Agricultural Big Data, Kunming, China
- 3Yunnan Engineering Research Center for Big Data Intelligent Information Processing of Green Agricultural Products, Kunming, China
Gene regulatory network (GRN) inference is a central task in systems biology. However, due to the noisy nature of gene expression data and the diversity of regulatory structures, accurate GRN inference remains challenging. We hypothesize that integrating multi-source features and leveraging an attention mechanism that explicitly captures graph structure can enhance GRN inference performance. Based on this, we propose GTAT-GRN, a deep graph neural network model with a graph topological attention mechanism that fuses multi-source features. GTAT-GRN includes a feature fusion module to jointly model temporal expression patterns, baseline expression levels, and structural topological attributes, improving node representation. In addition, we introduce the Graph Topology-Aware Attention Network (GTAT), which combines graph structure information with multi-head attention to capture potential gene regulatory dependencies. We conducted comprehensive evaluations of GTAT-GRN on multiple benchmark datasets and compared it with several state-of-the-art inference methods, including GENIE3 and GreyNet. The experimental results show that GTAT-GRN consistently achieves higher inference accuracy and improved robustness across datasets. These findings indicate that integrating graph topological attention with multi-source feature fusion can effectively enhance GRN reconstruction.
1 Introduction
Genes are the fundamental carriers of genetic information in cells. By encoding proteins, they drive and regulate a wide range of cellular processes. Gene function extends beyond protein coding. Through complex gene regulatory network (GRN), genes precisely modulate cellular behavior and functional states. A GRN is an intricate system that controls gene expression inside the cell (Kaler et al., 2009). Reconstructing this network is essential to modern biology. By mapping gene-gene interactions, a GRN exposes the dynamic control of gene expression across environmental conditions and developmental stages (Davidson, 2010). GRN reconstruction not only clarifies basic principles of life (Jie et al., 2020) but also underpins studies of disease mechanisms and the discovery of drug targets (Morgan et al., 2020). In cancer research, GRN analysis reveals transcription factors such as p53 (Kurup et al., 2023) and MYC that drive tumorigenesis, along with their downstream networks. These insights inform the design of personalized therapies. In developmental biology, GRN dissection uncovers core modules (Bedois et al., 2021), such as the HOX gene cluster, that govern organ formation and advance regenerative medicine research.
However, conventional GRN inference methods still confront several challenges. Chief among these is their high computational complexity. As genomic datasets grow, traditional algorithms, such as those based on mutual information (Zhang et al., 2015) or regression (Adabor and Acquaah-Mensah, 2019), scale poorly and slow dramatically on large inputs. Data sparsity is another barrier to accurate GRN reconstruction. Because techniques like ChIP-seq validate only a subset of interactions, many gene-gene links remain unconfirmed, yielding incomplete networks (McCalla et al., 2023). Moreover, conventional methods (e.g., Pearson correlation (Butte and Kohane, 1999) and linear regression (Lèbre et al., 2010)) assume linear dependencies, so they miss nonlinear regulatory relationships and further degrade inference accuracy.
In recent years, GNN has demonstrated considerable potential for inferring GRN owing to its strong capacity to learn from graph structures (Paul et al., 2024). GRGNN (Wang et al., 2020) was the first framework to cast GRN inference as a graph-classification problem, thereby introducing GNN to GRN research. Because GNN operates natively on graphs, it is well suited to model the complex regulatory relationships among genes. Moreover, its strong capacity to generalize enables GNN to extract latent regulatory patterns from limited experimental data, conferring greater robustness and scalability on GRN inference (Paul et al., 2024). Nonetheless, current GNN-based approaches typically rely on predefined graph structures or shallow attention mechanisms and therefore fail to capture the full spectrum of latent topological information among genes (Liu et al., 2023).
Inspired by the limitations of existing approaches, this study proposes a novel GRN inference model, termed GTAT-GRN, which is based on the Graph Topology-Aware Attention Network (GTAT) (Shen et al., 2025). Unlike conventional methods that rely on predefined graph structures or shallow attention mechanisms, GTAT-GRN integrates multi-source feature fusion with topology-aware modeling to enhance the ability to capture complex regulatory relationships. Specifically, the model incorporates a multi-feature fusion module that jointly encodes temporal expression patterns, baseline expression levels, and potential topological attributes of genes, thereby achieving heterogeneous feature integration (Yu et al., 2024b) and enriching node representations with multidimensional expressiveness. Meanwhile, the introduced GTAT dynamically captures high-order dependencies and asymmetric topological relationships among genes during graph learning, thereby uncovering latent regulatory patterns more effectively.
Accordingly, the central hypothesis of this work is that by systematically integrating multi-source biological features and employing a topology-aware attention mechanism to explicitly model topological dependencies among genes, it is possible to substantially improve the characterization of true GRN structures and the accuracy of network inference.
The main contributions of this paper are as follows.
1. We propose GTAT-GRN, a graph-topology-attention model that accurately infers gene regulatory networks by learning inter-gene topological relationships.
2. By fusing topological cues with complementary temporal and static features, GTAT-GRN integrates multidimensional information to decode gene regulation.
3. The model was systematically evaluated on the DREAM4 and DREAM5 standard datasets. Experimental results indicate that GTAT-GRN outperforms existing methods across overall metrics, including AUC and AUPR. Moreover, it demonstrates high-confidence predictive performance on Top-k metrics (Precision@k, Recall@k, F1@k), confirming its validity, robustness, and capacity to capture key regulatory relationships across different datasets.
2 Materials and methods
The proposed GTAT-GRN method is a novel GRN inference approach based on GTAT (Shen et al., 2025). The architecture of GTAT-GRN is shown in Figure 1, consisting of four modules: (A) multi-source feature fusion framework, (B) Graph Topology Attention Network (GTAT), (C) feedforward network and residual connections, and (D) GRN prediction output layer.
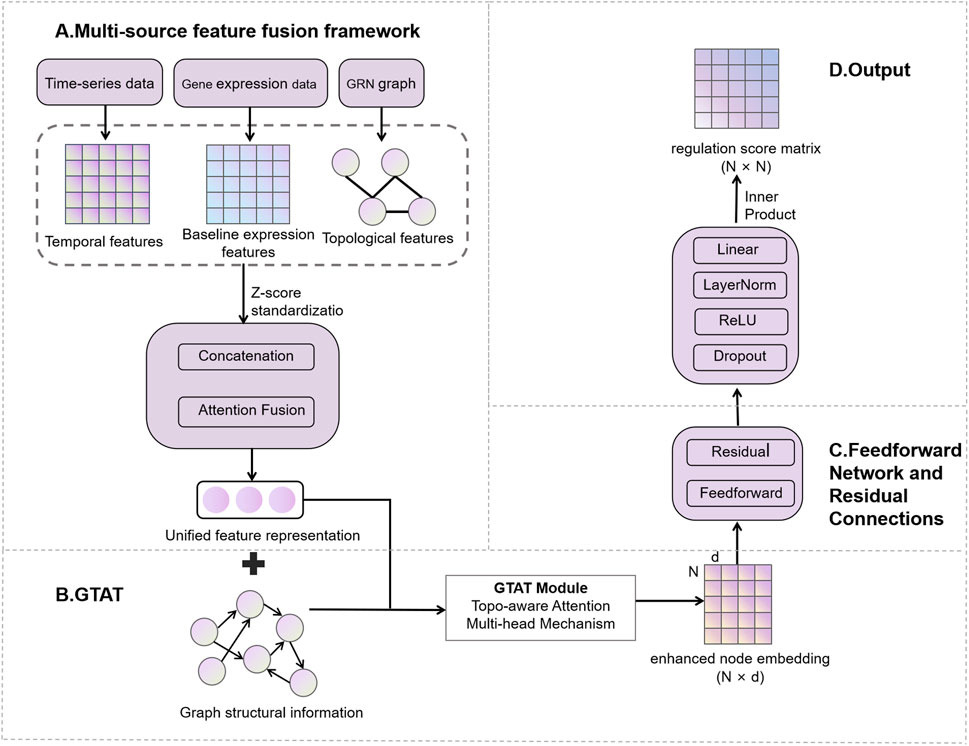
Figure 1. Overview of the GTAT-GRN framework.
2.1 Multi-source feature fusion framework
To improve GRN inference, we design a multi-source feature-fusion module (Wu et al., 2023) that jointly models three information streams: temporal dynamics of gene expression (Rubiolo et al., 2015), baseline expression patterns (Yuan and Bar-Joseph, 2021), and network topology (Liu et al., 2023). The types, sources, treatment methods and biological functions of the features are detailed in Table 1.
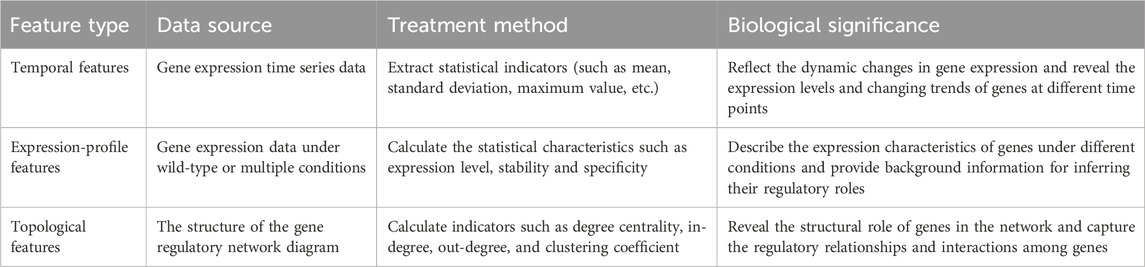
Table 1. Feature types and their related information.
2.1.1 Feature description
2.1.1.1 Temporal features
Temporal features characterize gene-expression levels at discrete time points and the trajectories of their changes over time (Huynh-Thu and Geurts, 2018). These descriptors capture dynamic expression patterns and furnish critical cues for inferring gene-regulatory relationships. Key metrics extracted are as follows.
2.1.1.2 Expression-profile features
Expression-profile features summarize gene-expression levels and their variation across basal and diverse experimental conditions (Yuan and Bar-Joseph, 2021). They facilitate analyses of gene-expression stability, context specificity, and potential functional pathways, thereby supplying essential context for inferring regulatory roles. Key metrics derived from baseline-expression features include.
2.1.1.3 Topological features
Topological features are derived from the structural properties of nodes in a GRN (Gene Regulatory Network) graph; they characterize each gene’s position, importance, and interactions with other genes (Pham et al., 2024). In a GRN, genes are represented as nodes and regulatory relationships as edges. Computing these topological descriptors allows us to elucidate gene functions within the network, trace how regulatory signals propagate, and pinpoint key hub genes. Key metrics include.
Together, these topological measures expose the structural roles of genes in a GRN and facilitate the discovery of regulatory interactions.
2.1.2 Feature extraction and preprocessing
2.1.2.1 Temporal features extraction
Temporal features are extracted from gene expression time-series data
where
2.1.2.2 Baseline expression feature extraction
Baseline expression features are extracted from wild-type expression data, typically including mean, standard deviation, and other statistical measures. These features are computed to form an expression feature vector for each gene
2.1.2.3 Topological features extraction
Topological features are extracted from the GRN, reflecting each gene’s structural position and importance within the network. These features include degree centrality, in-degree, out-degree, and other metrics that reveal each gene’s role and influence in the regulatory network. Topological features are
2.1.2.4 Feature alignment and normalization
To ensure that the three feature types are within the same numerical range, we apply Z-score standardization to eliminate scale differences across features (Zhu et al., 2021). Additionally, we handle missing values and standardize the sample dimensions to ensure that features can be fused across the same sample set.
2.1.3 Feature fusion
After feature extraction and preprocessing, the feature fusion phase begins.
1. Primary fusion (concatenation): The three types of features are concatenated along the feature dimension to form a unified feature representation (Ko et al., 2025):
Here,
2. Attention mechanism fusion: To learn the importance of each feature modality, an attention mechanism is applied to compute weights
Equation 3 adaptively learns attention weights for each feature type, allowing the model to focus on the most informative aspects.
3. Weighted feature fusion: Based on the learned attention scores, the final fused feature representation is computed via weighted summation:
As shown in Equation 4, the fusion process combines all features proportionally according to their attention scores.
4. Feature transformation: The fused features are then passed through a ReLU-activated linear transformation to enhance non-linear representation capability:
Equation 5 enables the network to capture complex relationships between fused features.
5. Gating mechanism: To control information flow, a gating mechanism is introduced to selectively filter the transformed features:
In Equation 6, the sigmoid function
6. Dimensionality reduction and residual connection: Finally, the output is computed by applying dimensionality reduction and adding a residual connection to preserve original information (Akhtar et al., 2025):
As shown in Equation 7, the residual connection ensures that the original fused features are preserved alongside the transformed output, improving model stability.
2.2 Graph Topology Attention Network (GTAT)
The GTAT (Shen et al., 2025) is a variant of GNN that integrates structural information of the graph with attention mechanisms. It is designed to more effectively capture complex dependencies between nodes and enhance both the expressiveness and robustness of graph representation learning. The core idea of GTAT lies in leveraging not only node feature representations but also explicitly incorporating topological attributes of the graph, such as node degree, shortest path length, and adjacency relationships, into a topology-aware attention mechanism (Huang et al., 2022). This integration enhances the model’s capacity to represent and generalize over complex graph structures.
Traditional graph neural networks primarily rely on neighborhood aggregation strategies, performing well in modeling local structures, but they tend to suffer from issues such as over-smoothing, overfitting to noisy edges, and poor robustness to connection patterns when handling higher-order topological relationships and complex regulatory structures (Zhang et al., 2024). To address these issues, GTAT introduces topological priors and combines multi-head attention mechanisms, achieving a better balance between modeling graph structure and integrating feature information (Wang et al., 2025).
1. Topological Feature Modeling: We explicitly extract topological features such as node degree, common neighbors, and shortest path length, which are input as topological features directly involved in attention weight calculation (Zhao et al., 2022). Unlike traditional attention mechanisms that rely solely on node features, this mechanism encodes structural information into the weight allocation process, effectively enhancing the attention mechanism’s sensitivity to structural differences (Xiong et al., 2025). These topological features are consistent with those extracted in the earlier feature fusion module, ensuring the reuse and consistency of structural information across different stages, thereby enhancing the model’s expressive efficiency.
2. Topology-Aware Attention Mechanism: The model incorporates topological features during attention computation to assist in determining the strength of node relationships (Matinyan et al., 2024). Compared to standard Graph Attention Networks (GAT), which may misclassify nodes with similar features but unrelated structures, GTAT, through its topology-aware attention mechanism, demonstrates superior discriminative power and noise resilience in sparsely connected regions.
3. Directed Graph Modeling: EnhancedGCA uses the edge_index parameter to explicitly represent the directed graph structure, a tuple
4. Efficient Structure-Aware Aggregation: During attention allocation, by jointly considering node features and their structural context, the model focuses more on structurally similar or biologically meaningful regulatory pathways, effectively mitigating the influence of noisy or irrelevant connections (Cheng et al., 2025).
It is worth noting that the core mechanism of GTAT relies on the structural connections of the graph to assign attention weights, while the inclusion of topological features as auxiliary input is optional. In this study, we adopt a strategy that integrates both graph structure and topological information in the full model to maximize the representational capacity of the graph. The architecture of the proposed model is illustrated in Figure 2.
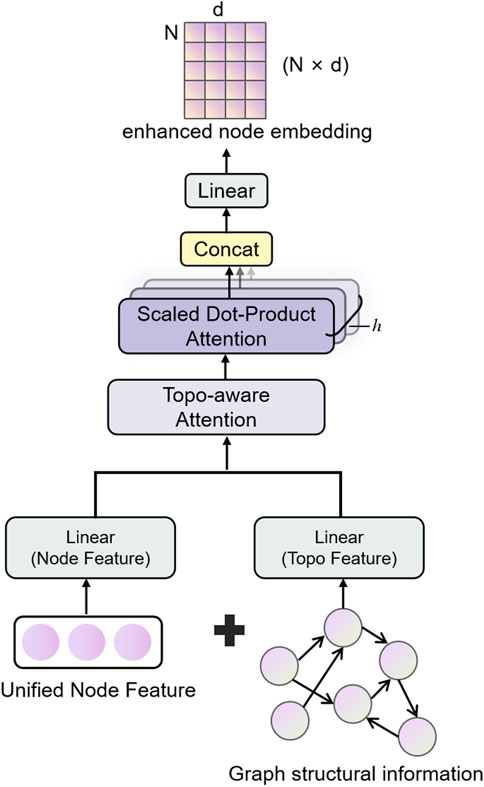
Figure 2. Schematic diagram of the structure of the Graph Topological Attention (GATA) module. Integrate node features and topological structure information, and enhance the graph structure modeling and feature expression capabilities through the topology-aware attention mechanism.
2.3 Feedforward network and residual connections
Feedforward networks (FFN) and residual connections (RC) are common structural components in deep neural networks. In this model, FFN and residual connections together form a critical part of the neural network, facilitating effective gradient flow, mitigating the vanishing gradient problem, and accelerating convergence (Shefa et al., 2024), as shown in Figure 3. Particularly in GNNs, the design of FFNs and residual connections is crucial for handling complex graph-structured data.
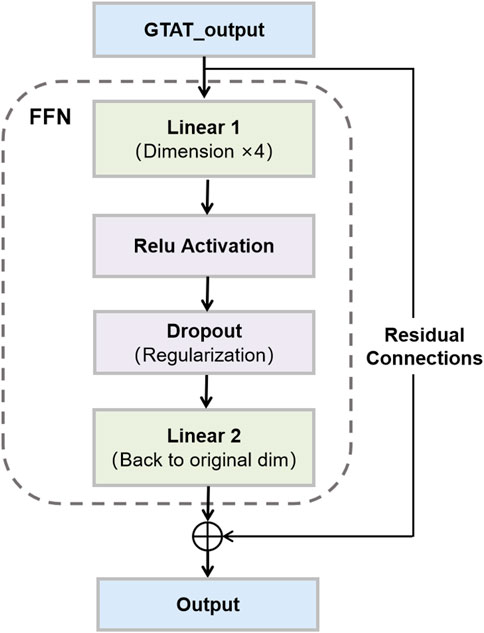
Figure 3. Feedforward Network and Residual Connections. This figure illustrates the structure of a feedforward network with skip connections, as used in our model.
2.3.1 Feedforward network
In graph neural networks, feedforward networks (FFNs) are commonly employed to transform node features through non-linear mappings. In this study, we adopt a straightforward FFN architecture composed of two linear layers and a ReLU activation function. This structure enables the network to model complex, non-linear relationships among nodes, thereby enhancing representational capacity (Zhu et al., 2019). Specifically, each node’s input feature vector
Here,
This structure enables the model to learn richer semantic representations from local node features, thereby enhancing its expressive power. Particularly when processing graph data, it can more flexibly adapt to varying node feature changes.
2.3.2 Residual connections
In deep neural networks, increasing model depth often leads to issues such as vanishing or exploding gradients, which hinder effective training. To address this, residual connections (RCs) are widely adopted as a robust architectural enhancement (Guo and Sun, 2025). By introducing skip connections between layers, RCs allow input features to bypass nonlinear transformations and be directly added to the output, thereby improving gradient flow and facilitating model convergence. In our model, residual connections are applied after each feedforward network (FFN). Specifically, the input feature vector
Here,
As shown in Equation 9, residual connections help preserve the original feature context while enabling deeper representations, thereby enhancing model stability and training efficiency (Wang et al., 2024).
2.3.3 Synergy between feedforward networks and residual connections
The combination of feedforward networks and residual connections significantly enhances the network’s expressive power and training efficiency. Feedforward networks transform node features through two fully connected layers, enhancing feature representation ability. However, without residual connections, deep networks may cause excessive information transformation, leading to instability during training. Introducing residual connections ensures the continuity of information at each layer, helping stabilize gradient flow, prevent vanishing gradients, and accelerate convergence during training. The specific advantages are as follows.
1. Mitigating the Vanishing Gradient Problem: As the network depth increases, gradients in deep neural networks may gradually vanish, impacting training performance. Residual connections, through skip connections, allow information to propagate across multiple layers, maintaining gradient flow and mitigating the vanishing gradient issue, thus enhancing network stability (Zhou et al., 2024).
2. Accelerating Convergence: Residual connections enable direct input-output relationships at each layer, speeding up gradient updates and improving convergence speed (Nie et al., 2019), especially in deep networks.
3. Enhancing Model Expressiveness: Feedforward networks enhance node feature representation through non-linear transformations, enabling the network to capture more complex feature relationships. Residual connections ensure effective information flow, preventing inter-layer information loss, further enhancing the model’s learning capacity (Belhaouari and Kraidia, 2025).
4. Improving Robustness: The combination of feedforward networks and residual connections enhances the model’s adaptability to noise and complex graph structures. Residual connections ensure that information is not excessively distorted after multiple layer stacks, enhancing the model’s robustness and noise resistance (Pan et al., 2025).
2.4 Output layer
In this model, the output layer (Figure 4) maps node representations processed by graph convolution, feature fusion, and the feedforward network to regulatory probability scores between genes. This layer first reduces the dimensionality of fused node features via a linear transformation, then applies layer normalization, ReLU activation and Dropout regularization in sequence to enhance the model’s expressiveness and generalization (Reddy et al., 2024). During training we use Focal Loss as the objective function to mitigate class imbalance and improve the model’s ability to detect rare regulatory interactions. The raw output is a real-valued score, where values above zero indicate a predicted regulatory interaction and values at or below zero indicate no interaction. The magnitude of this score reflects the model’s confidence. During inference the raw score is passed through a Sigmoid function to map it into the [0, 1] interval and yield a probability for regulatory interaction.
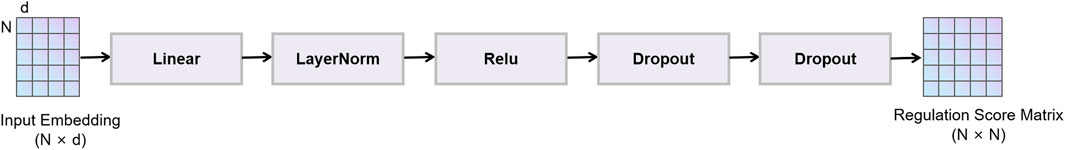
Figure 4. Output layer.
2.5 Dataset
To evaluate the effectiveness of the proposed GTAT-GRN method for GRN inference, we employed both simulated benchmark datasets and real biological expression data. The simulated dataset is DREAM4 InSilico_Size100 (Marbach et al., 2010), generated by the GeneNetWeaver (GNW) tool (Schaffter et al., 2011), which accurately simulates transcriptional regulatory mechanisms and provides a known gold standard network. This dataset is widely recognized as a standard benchmark in GRN inference research (Marbach et al., 2012). It contains five independent sub-networks of 100 genes each, covering diverse experimental conditions such as time-series perturbations and homeostasis interventions (Marbach et al., 2009). The time-series data include 21 equally spaced sampling points with intervals of 50 time units. For feature extraction, we used a sliding window with size 3 and step size 1. The real dataset is DREAM5 Escherichia coli (Escherichia coli) expression data (Lim et al., 2013), derived from experiments that include time-series measurements and gene knockouts. It also provides an official gold standard network, enabling performance evaluation under real biological conditions. This dataset contains 4,511 genes, of which 1,371 exhibit time-series characteristics. We selected these genes for experiments and applied a sliding window with size 5 and step size 1 during feature extraction.
Through systematic experiments on these datasets, we comprehensively evaluate the ability of GTAT-GRN to uncover potential regulatory relationships under limited-sample conditions, and verify its adaptability and robustness in reconstructing complex network structures. Detailed dataset information is provided in Table 2.
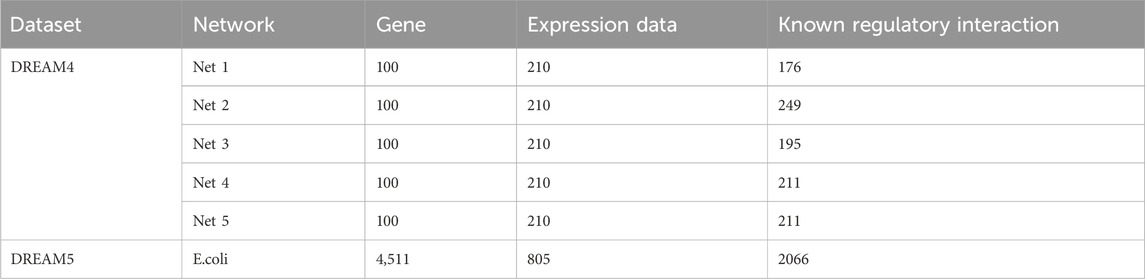
Table 2. Dataset.
3 Results
3.1 Performance metrics
To evaluate the performance of the proposed method in GRN reconstruction, we adopt two widely used metrics as the primary evaluation indicators (Aalto et al., 2020): the area under the receiver operating characteristic curve (AUC) and the area under the precision–recall curve (AUPR). AUC is computed as the area under the ROC curve, which depicts the trade-off between the true positive rate (TPR) and the false positive rate (FPR). AUPR measures the area under the precision–recall (PR) curve, which illustrates the balance between precision and recall.
The relevant metrics are defined as follows:
In Equations 10–14, TP (true positives) denotes the number of correctly identified regulatory links, TN (true negatives) denotes correctly identified non-links, FP (false positives) represents incorrectly predicted links, and FN (false negatives) corresponds to missed regulatory interactions. These metrics collectively reflect the model’s capability in both identifying true regulatory edges and avoiding false predictions.
3.2 Experimental results
To evaluate the overall performance of the proposed GTAT-GRN model in gene regulatory network (GRN) inference, we conducted comprehensive training and testing procedures on five independent subnetworks provided by the DREAM4 InSilico Size100 dataset. The performance of the model was measured by multiple indicators such as AUC, AUPR, Precision@k, Recall@k and F1-score@k.
Figure 5 illustrates the original experimental results of GTAT-GRN on the five subnetworks of DREAM4. As shown, GTAT-GRN consistently achieved stable and outstanding performance on all datasets, demonstrating its adaptability and robustness under diverse regulatory scenarios. The model performed particularly well on E. coli Network 1, achieving an AUC of 0.9697 and an AUPR of 0.8132, indicating its strong capability in capturing complex regulatory structures. In contrast, performance on S. cerevisiae Network 5 was relatively weaker. This discrepancy can be attributed to notable differences in the topological structures and sample distributions of the two networks. Specifically, E. coli Network 1 contains more edges and exhibits higher structural density, which facilitates effective information propagation and feature integration through graph neural networks. Moreover, its relatively balanced label distribution enables the model to learn distinctions between different classes more effectively during training, thereby enhancing generalization. On the other hand, S. cerevisiae Network 5 has fewer edges and more sparse structural information, limiting the propagation of topological features. Its severely imbalanced label distribution also increases the risk of overfitting and weakens the model’s ability to infer regulatory relationships, ultimately compromising AUC and AUPR performance.
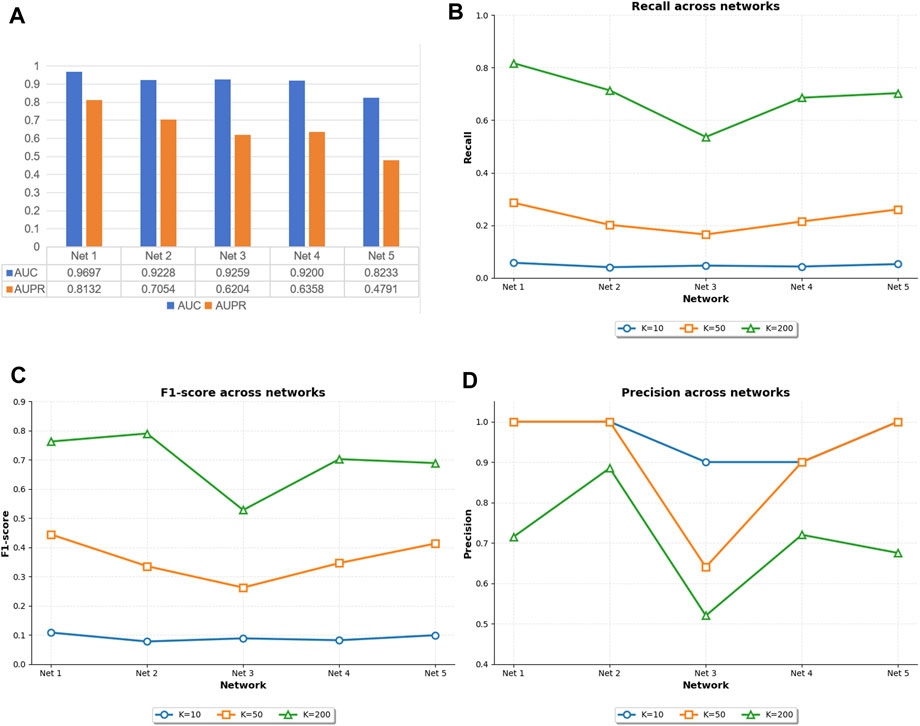
Figure 5. The performance of GTAT-GRN on five datasets of DREAM4. (A) AUC and AUPR performance of GTAT-GRN on DREAM4 (B) Recall@k of GTAT-GRN on DREAM4 (C) F1@k of GTAT-GRN on DREAM4 (D) GTAT-GRN at Precision@k in DREAM4.
Figure 6 presents the experimental results of GTAT-GRN on the DREAM5 E. coli dataset, demonstrating its strong performance in gene regulatory network inference. The model achieved an AUC of 0.7596 and an AUPR of 0.6075, indicating robust overall performance. Notably, for high-confidence predictions, Precision@10 reached 0.9000 and F1@10 was 0.6923, suggesting that the model can accurately identify the most reliable regulatory relationships. Meanwhile, the Recall value demonstrates the model’s excellent coverage ability. These results verified the validity and practicability of GTAT-GRN on real biological data. These results confirm the validity and practical applicability of GTAT-GRN on real biological data.
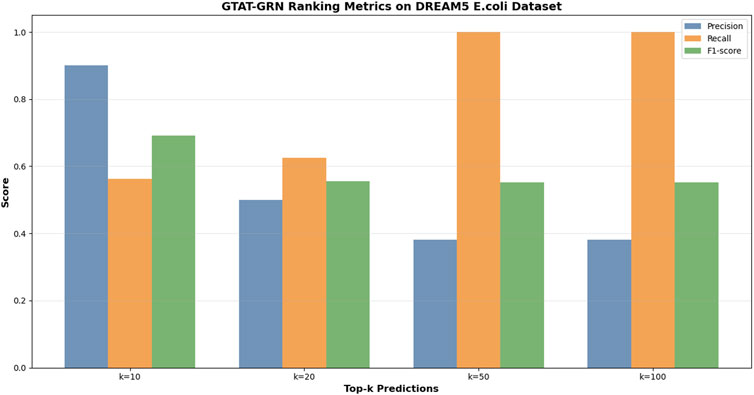
Figure 6. The performance of GTAT-GRN on E. coli datasets of DREAM5.
In summary, the experimental results further confirm the critical roles of graph structural density and label balance in GRN inference, indicating the performance advantages and practical application potential of GTAT-GRN in modeling structural dependencies and adapting to diverse data distributions.
3.3 Model performance comparison
To comprehensively evaluate the performance of the proposed model in gene regulatory network inference, we selected eight representative baseline methods on DREAM4 InSilico_Size100: traditional statistical approaches (e.g., PCA-CMI (Zhao et al., 2016)), information-theoretic algorithms (GENIE3 and dynGENIE3 (Huynh-Thu and Geurts, 2018)), dynamic modeling techniques (NSRGRN (Liu et al., 2023)), and recent graph neural network–based methods (NIMEFI (Ruyssinck et al., 2014), MMFGRN (He et al., 2021), and GreyNet (Chen and Liu, 2022), DGCGRN (Wei et al., 2024)). We conducted a systematic comparative analysis on DREAM4’s five benchmark networks (Net1–Net5), using AUC, AUPR, Precision@k, Recall@k and F1-score@k as evaluation metrics to assess and contrast each method’s ability to reconstruct regulatory interactions.
As shown in Table 3, the proposed GTAT-GRN model achieved overall superior AUC and AUPR performance across the five standard datasets, fully demonstrating its comprehensive performance advantages in the task of gene regulatory relationship identification. Experimental results indicate that the introduction of the graph topology attention mechanism, combined with the multi-source feature fusion strategy, enables the model to more comprehensively characterize the complex regulatory relationships between genes, thereby significantly improving the accuracy and stability of network structure inference. Particularly, compared with traditional methods and existing GNN models, GTAT-GRN exhibits stronger representation capability in modeling long-range regulatory paths and capturing dynamic expression features. To provide a more detailed assessment of high-confidence predictions, we evaluated Precision@k, Recall@k, and F1-score@k for K = 10, 50, and 100. In the main text, we present the results for K = 100 as a representative value, which balances high-confidence prediction and overall coverage. Results for other K values are provided in the Supplementary Figures S1–S6. The results for K = 100 in Figure 7 indicate that GATA-GRN achieves superior coverage and accuracy, further validating its robustness and potential for real-world applications.
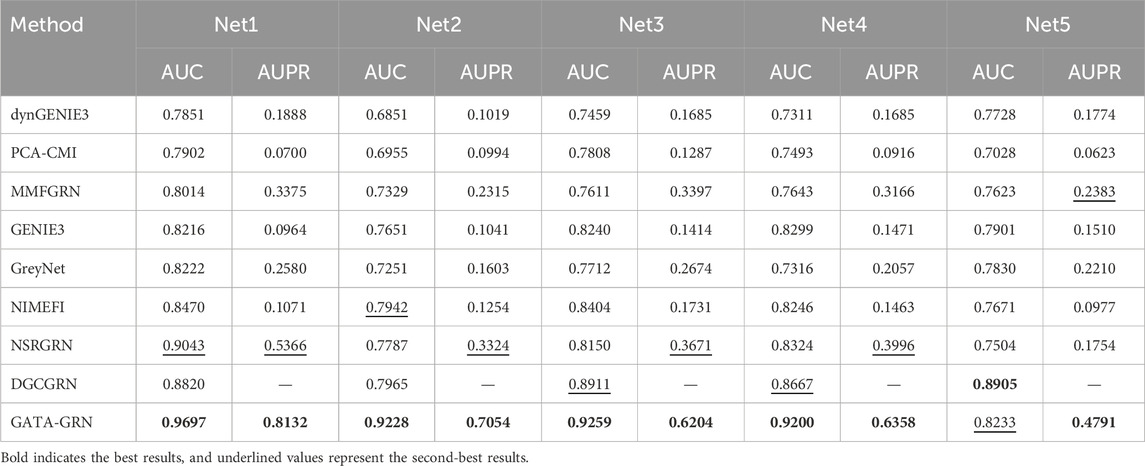
Table 3. Performance comparison (AUC and AUPR) of various methods on five networks (Net1–Net5).
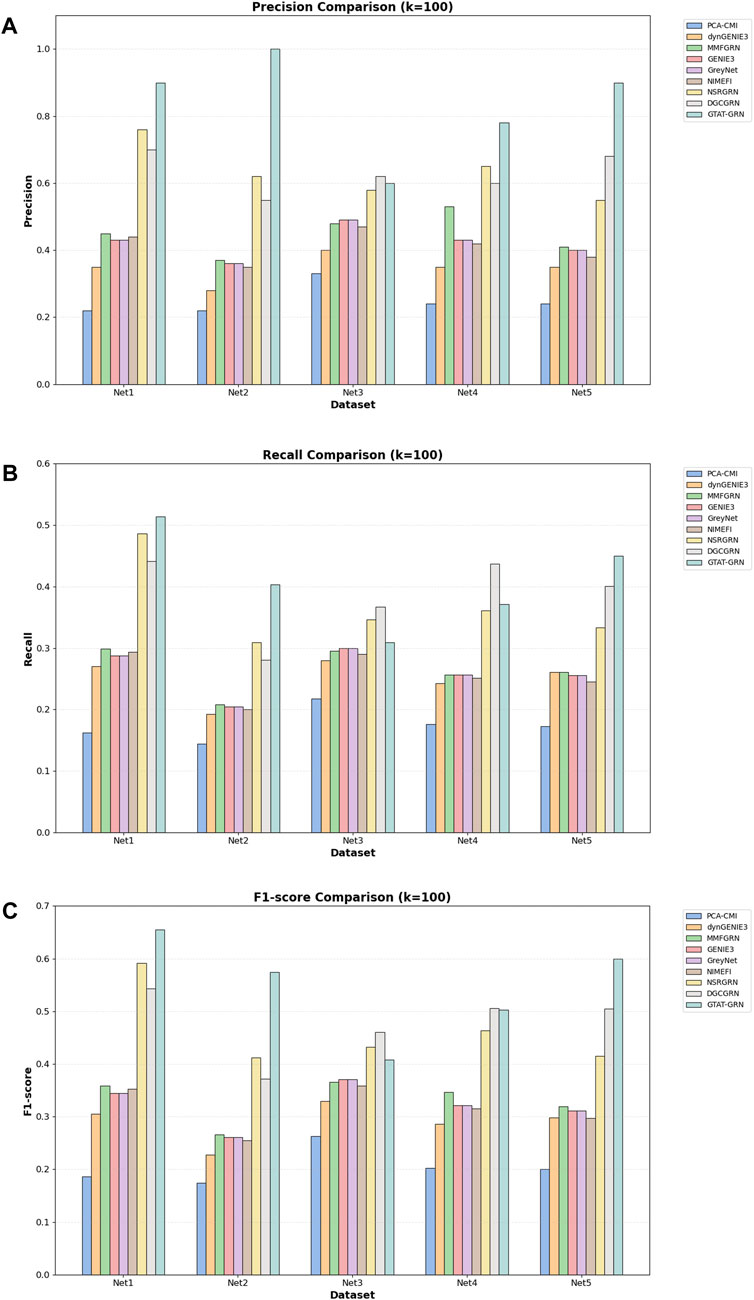
Figure 7. Comparison of different methods on the DREAM4 dataset (A) comparison of models on Precision@100 (B) comparison of models on Recall@100 (C) comparison of models on F1-score@100.
However, on the Net5 dataset (i.e., S. cerevisiae Network 5), the AUC value of DGCGRN exceeded that of the proposed method. This result may be attributed to the significant class imbalance in the dataset, where certain regulatory relationship samples are relatively scarce, leading the model to be biased towards the majority class during training. In such scenarios, the conditional variational autoencoder (CVAE) enhancement mechanism introduced in DGCGRN Wei et al. (2024) can effectively model the potential distribution of adjacent nodes conditioned on the central node features, thereby enhancing the representation capability for low-degree nodes. Additionally, DGCGRN integrates sequential features extracted via Bi-GRU and statistical features, strengthening its modeling capacity for regulatory dependency structures, which contributes to its superior performance on Net5.
Nevertheless, on the remaining four datasets, GTAT-GRN still demonstrates stronger adaptability and robustness. Benefiting from the synergistic effect of the graph topology attention mechanism and multi-source information fusion strategy, the proposed method can effectively capture complex regulatory structures and latent expression patterns without relying on specific enhancement mechanisms, showing broader applicability and higher stability.
To further assess the applicability of GATA-GRN in real biological gene regulatory scenarios, we performed comparative experiments on the DREAM5 E. coli gene expression dataset, which originates from actual E. coli experiments. We selected several representative baseline methods, including dynGENIE3 Huynh-Thu and Geurts (2018) (a random forest-based temporal regulation inference method), GreyNet Chen and Liu (2022) (a graph neural network-based inference framework), and MMFGRN Wei et al. (2024) (a multimodal feature fusion method). These methods represent three typical strategies: traditional machine learning, graph deep learning, and multimodal fusion.
As shown in Figure 8, GATA-GRN outperformed existing methods in AUC and AUPR on the E. coli dataset, particularly excelling at capturing dynamic gene dependencies and long-range regulatory interactions. Moreover, GATA-GRN exhibited notable improvements in key metrics, including Precision@k, Recall@k, and F1-score@k, further validating the robustness and practical potential of the proposed method in real-world scenarios.
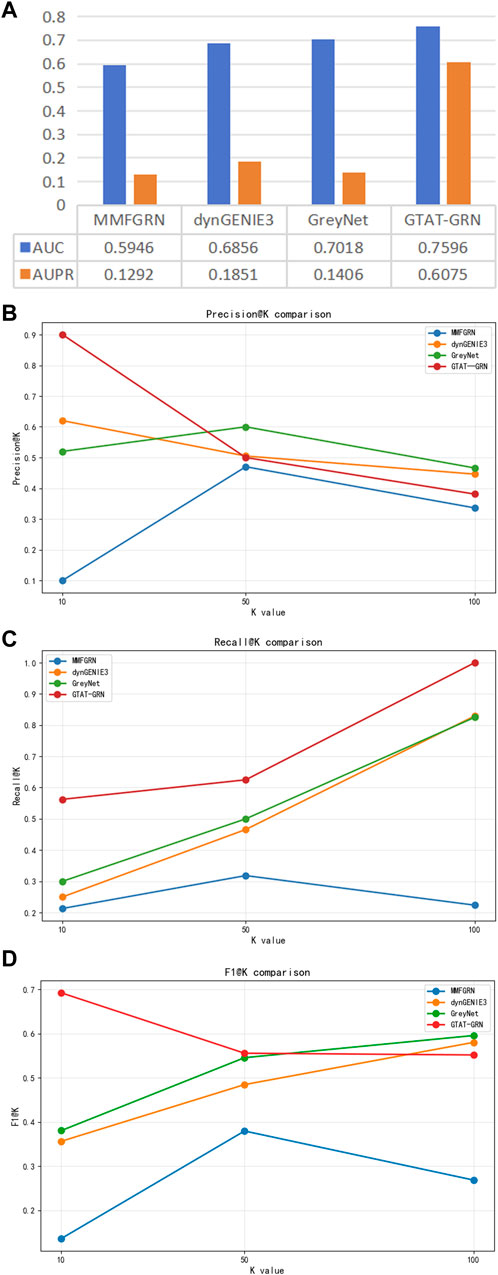
Figure 8. Comparison of different methods on the DREAM5 E.coli dataset. (A) Comparison of AUC and AUPR of the model in E.coli (B) comparison of Precision@k of the model in E.coli (C) comparison of Recall@k of the model in E.coli (D) Comparison of the model in E.coli at F1-score@k.
3.4 Ablation experiment
In our ablation experiments, we use the E. coli1 dataset and adopt a simplified model consisting solely of the Graph Convolutional Network (GCN) backbone as the baseline. To systematically assess the individual and combined contributions of each component to inference performance, we incrementally introduce the FFN and Residual, GTAT, and Topo modules, recording the AUC, AUPR, Precision@k, Recall@k and F1-score@k performance of the model at each step. As shown in Table 4, each architectural component contributes positively to model performance. Starting from the simplified GCN backbone, the introduction of the FFN and residual connections significantly enhances feature representation and training stability, yielding steady improvements in both AUC and AP. Adding the GTAT module further boosts performance by effectively modeling directional regulation and long-range dependencies. Notably, GTAT—relying solely on the graph’s structural connectivity edge_index for attention weighting—remains highly effective even without explicit topological features. Finally, incorporating explicit topological features as structural priors achieves the highest performance, demonstrating that the topology-aware attention mechanism and topological information complement each other in capturing gene regulatory dependencies.
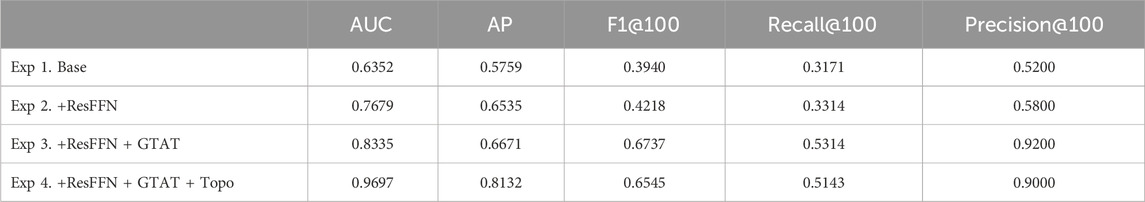
Table 4. Ablation study results on the E.coli1 dataset.
3.5 Cross-validation experiment
To further evaluate the validity and robustness of the GTAT-GRN model under varying network structures and sample distributions, we conducted five-fold cross-validation experiments on three representative subsets from the DREAM4 InSilico dataset: E. coli Network 1, E. coli Network 2, and S. cerevisiae Network 5. Given the significant differences among these datasets in terms of class imbalance, edge density, and graph complexity, we did not adopt a unified data split ratio. Instead, we tailored the proportions of training, validation, and testing sets for each subset based on their specific characteristics. For instance, in E. coli Network 1, which contains relatively fewer positive samples, we increased the proportion of training data to enhance the model’s ability to learn from rare examples. In contrast, for E. coli Network 2 and S. cerevisiae Network 5, which exhibit more pronounced class imbalance, a more balanced partitioning strategy was employed to ensure representative coverage of each class during model training and to guarantee fair and valid evaluation.
In addition, to ensure consistency in sample distribution across folds, we applied stratified sampling during the splitting process and fixed the random seed (set to 42) to enhance reproducibility. Specifically, positive and negative samples were split and shuffled separately before being combined into fold-specific datasets, thereby ensuring fairness and representativeness in the cross-validation procedure.
The cross-validation results (Tables 5–7) show that GTAT-GRN consistently achieves high performance across multiple folds, demonstrating both stability and structural adaptability. Specifically, E. coli1 achieved an average AUC of 0.9344
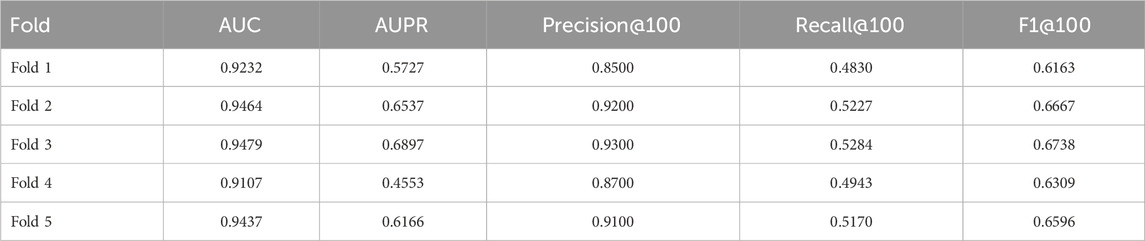
Table 5. E.coli1 cross-validation results.
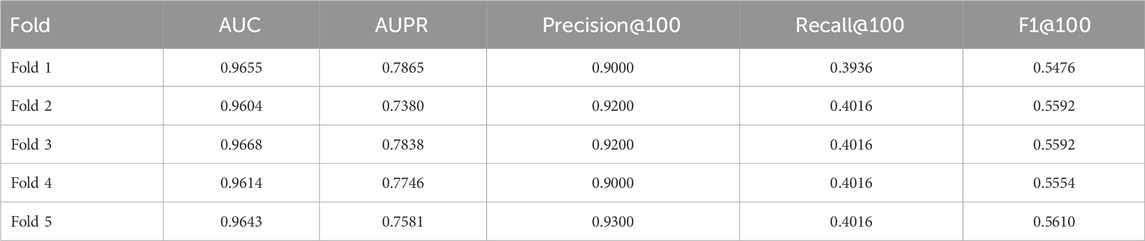
Table 6. E.coli2 cross-validation results.

Table 7. S.cerevisiae5 Cross-Validation results.
Overall, these cross-validation findings confirm GTAT-GRN’s robustness and ability to generalize under varying sample distributions, laying a solid foundation for its application to diverse biological network modeling tasks.
4 Discussion and conclusion
This study presents GTAT-GRN, a deep graph neural network that incorporates a graph topological attention mechanism and integrates multi-source features. Experimental results indicate that GTAT-GRN effectively captures complex regulatory dependencies and exhibits robust and stable performance across benchmark datasets, including DREAM4 and DREAM5. Compared to traditional graph neural networks (e.g., GCN and GAT), GTAT-GRN’s main advantage is its explicit modeling of topological structures. Classical GAT primarily considers symmetrical attention distribution among node features, whereas regulatory relationships in GRNs are inherently directional and asymmetric (Ali et al., 2020). The GTAT module, with its unique structural design, better captures this biological property, which may explain its improved performance.
Comparison with contemporary advanced methods (e.g., DGCGRN) highlights the interaction between model properties and data structure. For example, on the Nte5 dataset of DREAM4, DGCGRN slightly outperforms GTAT-GRN, likely due to the CVAE mechanism’s advantage in processing low-connectivity nodes (Wei et al., 2024). Nevertheless, across most datasets, GTAT-GRN shows superior and more stable performance, suggesting that its multi-source feature fusion strategy enhances generalization and is less affected by dataset-specific structural biases.
Compared with tree-based and information-theory methods (e.g., GENIE3, dynGENIE3 (Huynh-Thu and Geurts, 2018), PCA-CMI (Zhao et al., 2016)), GTAT-GRN excels in representation learning. While GENIE3 and its variants can capture nonlinear relationships effectively, they rely on feature importance rankings and cannot explicitly model topological gene dependencies. PCA-CMI may suffer from insufficient statistical power when analyzing high-dimensional data. In contrast, GTAT-GRN generates context-rich node representations and directly infers regulatory relationships. GreyNet also infers GRNs from time-series expression data, but its performance is constrained by underlying assumptions.
Despite demonstrating effectiveness in reconstructing complex gene regulatory structures on benchmark datasets, GTAT-GRN has several areas for further improvement. First, the model does not yet fully differentiate regulatory relationship types, such as activation and inhibition. Future work could incorporate symbolic information or positive/negative regulatory labels. Second, the model still depends on predefined topological features. Future studies may develop structurally adaptive GNN mechanisms to enable automatic feature learning and reduce reliance on manual feature engineering.
Moreover, applying the model to single-cell RNA-seq (scRNA-seq) or spatial transcriptomics (ST) data requires addressing inherent challenges: scRNA-seq data exhibit high sparsity, dropout events, significant cellular heterogeneity, and batch effects (Wang et al., 2023); ST data additionally show spatial autocorrelation and resolution limitations (Zhao et al., 2024). GTAT-GRN’s core advantage is its graph topological attention mechanism with multi-source feature integration, offering a novel approach for analyzing such data. For example, single cells or spatial locations can be represented as graph nodes to capture complex interactions. This framework inherently supports joint modeling of gene expression, cell type annotation, spatial coordinates, and multi-omics data, enabling comprehensive characterization of complex regulatory patterns.
Compared with methods for inferring gene co-expression or co-relationships (e.g., COTAN (Galfrè et al., 2021), scGeneClust (Deng et al., 2023), CS-Core (Su et al., 2023), LEGEND (Deng et al., 2025)), GTAT-GRN theoretically benefits from jointly leveraging topological structures and multi-source contextual features. This approach is more capable of uncovering complex regulatory pathways across cell types or spatial domains. In particular, in ST scenarios, studies such as STANDS (Xu et al., 2024) have demonstrated spatial expression heterogeneity of tumor-associated genes across anatomical regions. Future extensions of GTAT-GRN could compare GRN structural differences between normal and tumor regions within the same tissue section, offering novel computational perspectives and biological insights into tumor microenvironment regulatory disruptions.
In summary, GTAT-GRN offers a novel, structurally-informed framework for inferring gene regulatory networks. Experimental results confirm its strong performance and broad applicability in inferring complex regulatory structures. Future studies could explore multi-omics data integration, real-world validation, and enhanced model interpretability to further advance GTAT-GRN’s application in precision medicine and systems biology.
Data availability statement
The original contributions presented in the study are included in the article/Supplementary Material, further inquiries can be directed to the corresponding author.
Author contributions
SW: Investigation, Conceptualization, Validation, Methodology, Writing – original draft, Project administration. LZ: Writing – review and editing, Funding acquisition. LG: Writing – original draft. YR: Writing – review and editing. JC: Writing – review and editing. LY: Writing – review and editing.
Funding
The author(s) declare that financial support was received for the research and/or publication of this article. This study was supported by Yunnan Provincial Science and Technology Major Project (No. 202202AE090008) tited “Application and Demonstration of Digital Rural Governance Based on Big Data and Artificial Intelligence”.
Acknowledgments
We appreciate the computational resources provided by the Yunnan Agricultural Big Data Center.
Conflict of interest
The authors declare that the research was conducted in the absence of any commercial or financial relationships that could be construed as a potential conflict of interest.
Generative AI statement
The author(s) declare that Generative AI was used in the creation of this manuscript. We used the Large Language Model—ChatGPT—in the drafting of this paper for grammar and language refinement.
Any alternative text (alt text) provided alongside figures in this article has been generated by Frontiers with the support of artificial intelligence and reasonable efforts have been made to ensure accuracy, including review by the authors wherever possible. If you identify any issues, please contact us.
Publisher’s note
All claims expressed in this article are solely those of the authors and do not necessarily represent those of their affiliated organizations, or those of the publisher, the editors and the reviewers. Any product that may be evaluated in this article, or claim that may be made by its manufacturer, is not guaranteed or endorsed by the publisher.
Supplementary material
The Supplementary Material for this article can be found online at: https://www.frontiersin.org/articles/10.3389/fgene.2025.1668773/full#supplementary-material
Supplementary Figure S1 | Recall@50 of GTAT-GRN on DREAM4.
Supplementary Figure S2 | Precision@50 of GTAT-GRN on DREAM4.
Supplementary Figure S3 | F1@50 of GTAT-GRN on DREAM4.
Supplementary Figure S4 | Recall@10 of GTAT-GRN on DREAM4.
Supplementary Figure S5 | Precision@10 of GTAT-GRN on DREAM4.
Supplementary Figure S6 | F1@10 of GTAT-GRN on DREAM4.
References
Aalto, A., Viitasaari, L., Ilmonen, P., Mombaerts, L., and Gonçalves, J. (2020). Gene regulatory network inference from sparsely sampled noisy data. Nat. Commun. 11, 3493. doi:10.1038/s41467-020-17217-1
Adabor, E., and Acquaah-Mensah, G. (2019). Restricted-derestricted dynamic bayesian network inference of transcriptional regulatory relationships among genes in cancer. Comput. Biol. Chem. 79, 155–164. doi:10.1016/j.compbiolchem.2019.02.006
Akhtar, S., Aftab, S., Ali, O., Ahmad, M., Khan, M., Abbas, S., et al. (2025). A deep learning based model for diabetic retinopathy grading. Sci. Rep. 15, 3763. doi:10.1038/s41598-025-87171-9
Ali, M. Z., Parisutham, V., Choubey, S., and Brewster, R. C. (2020). Inherent regulatory asymmetry emanating from network architecture in a prevalent autoregulatory motif. eLife 9, e56517. doi:10.7554/eLife.56517
Bedois, A., Parker, H., and Krumlauf, R. (2021). Retinoic acid signaling in vertebrate hindbrain segmentation: evolution and diversification. Diversity 13, 398. doi:10.3390/d13080398
Belhaouari, S., and Kraidia, I. (2025). Efficient self-attention with smart pruning for sustainable large language models. Sci. Rep. 15, 10171. doi:10.1038/s41598-025-92586-5
Butte, A., and Kohane, I. (1999). Mutual information relevance networks: functional genomic clustering using pairwise entropy measurements. In: R. Altman, A. Dunker, and L. Hunter, editors. Biocomputing 2000. Singapore: World Scientific. p. 418–429.
Chen, G., and Liu, Z. (2022). Inferring causal gene regulatory network via greynet: from dynamic grey association to causation. Front. Bioeng. Biotechnol. 10, 954610. doi:10.3389/fbioe.2022.954610
Cheng, J., Liu, W., Wang, Z., Ren, Z., and Li, X. (2025). Joint event extraction model based on dynamic attention matching and graph attention networks. Sci. Rep. 15, 6900. doi:10.1038/s41598-025-91501-2
Choi, S., and Lee, M. (2023). Transformer architecture and attention mechanisms in genome data analysis: a comprehensive review. Biology 12, 1033. doi:10.3390/biology12071033
Davidson, E. (2010). Emerging properties of animal gene regulatory networks. Nature 468, 911–920. doi:10.1038/nature09645
Deng, T., Chen, S., Zhang, Y., Xu, Y., Feng, D., Wu, H., et al. (2023). A cofunctional grouping-based approach for non-redundant feature gene selection in unannotated single-cell rna-seq analysis. Briefings Bioinforma. 24, bbad042. doi:10.1093/bib/bbad042
Deng, T., Huang, M., Xu, K., Lu, Y., Xu, Y., Chen, S., et al. (2025). Legend: identifying co-expressed genes in multimodal transcriptomic sequencing data. Genomics Proteomics Bioinformatics, qzaf056. doi:10.1093/gpbjnl/qzaf056
Galfrè, S. G., Morandin, F., Pietrosanto, M., Cremisi, F., and Helmer-Citterich, M. (2021). Cotan: scrna-seq data analysis based on gene co-expression. NAR Genomics Bioinforma. 3, lqab072. doi:10.1093/nargab/lqab072
Guo, X., and Sun, L. (2025). Evaluation of stroke sequelae and rehabilitation effect on brain tumor by neuroimaging technique: a comparative study. PLoS One 20, e0317193. doi:10.1371/journal.pone.0317193
He, W., Tang, J., Zou, Q., and Guo, F. (2021). Mmfgrn: a multi-source multi-model fusion method for gene regulatory network reconstruction. Briefings Bioinforma. 22, bbab166. doi:10.1093/bib/bbab166
Huang, R., Chen, Z., He, J., and Chu, X. (2022). Dynamic heterogeneous user generated contents-driven relation assessment via graph representation learning. Sensors 22, 1402. doi:10.3390/s22041402
Huynh-Thu, V., and Geurts, P. (2018). dyngenie3: dynamical genie3 for the inference of gene networks from time series expression data. Sci. Rep. 8, 3384. doi:10.1038/s41598-018-21715-0
Jie, H., Yuan, M., Zhu, G., and Hong, W. (2020). State regulation for complex biological networks based on dynamic optimization algorithms. Sheng Wu Yi Xue Gong Cheng Xue Za Zhi 37, 19–26. doi:10.7507/1001-5515.201810008
Kaler, P., Godasi, B., Augenlicht, L., and Klampfer, L. (2009). The nf-κ b/akt-dependent induction of wnt signaling in Colon cancer cells by macrophages and il-1β. Cancer Microenviron. 2, 69–80. doi:10.1007/s12307-009-0030-y
Ko, J., Kim, S., Sul, J., and Kim, S. (2025). Data reconstruction methods in multi-feature fusion cnn model for enhanced human activity recognition. Sensors 25, 1184. doi:10.3390/s25041184
Kurup, J., Kim, S., and Kidder, B. (2023). Identifying cancer type-specific transcriptional programs through network analysis. Cancers 15, 4167. doi:10.3390/cancers15164167
Lèbre, S., Becq, J., Devaux, F., Stumpf, M. P. H., and Lelandais, G. (2010). Statistical inference of the time-varying structure of gene-regulation networks. BMC Syst. Biol. 4, 130. doi:10.1186/1752-0509-4-130
Lim, N., Senbabaoglu, Y., Michailidis, G., and d’Alché Buc, F. (2013). Okvar-boost: a novel boosting algorithm to infer nonlinear dynamics and interactions in gene regulatory networks. Bioinformatics 29, 1416–1423. doi:10.1093/bioinformatics/btt167
Liu, W., Yang, Y., Lu, X., Fu, X., Sun, R., Yang, L., et al. (2023). Nsrgrn: a network structure refinement method for gene regulatory network inference. Briefings Bioinforma. 24, bbad129. doi:10.1093/bib/bbad129
Marbach, D., Schaffter, T., Mattiussi, C., and Floreano, D. (2009). Generating realistic in silico gene networks for performance assessment of reverse engineering methods. J. Comput. Biol. 16, 229–239. doi:10.1089/cmb.2008.09TT
Marbach, D., Prill, R., Schaffter, T., Mattiussi, C., Floreano, D., and Stolovitzky, G. (2010). Revealing strengths and weaknesses of methods for gene network inference. Proc. Natl. Acad. Sci. U. S. A. 107, 6286–6291. doi:10.1073/pnas.0913357107
Marbach, D., Costello, J., Küffner, R., Vega, N., Prill, R., Camacho, D., et al. (2012). Wisdom of crowds for robust gene network inference. Nat. Methods 9, 796–804. doi:10.1038/nmeth.2016
Mare, D., Moreira, F., and Rossi, R. (2017). Nonstationary z-score measures. Eur. J. Operational Res. 260, 348–358. doi:10.1016/j.ejor.2016.12.001
Matinyan, S., Filipcik, P., and Abrahams, J. (2024). Deep learning applications in protein crystallography. Acta Crystallogr. Sect. A Found. Adv. 80, 1–17. doi:10.1107/S2053273323009300
McCalla, S., Fotuhi Siahpirani, A., Li, J., Pyne, S., Stone, M., Periyasamy, V., et al. (2023). Identifying strengths and weaknesses of methods for computational network inference from single-cell rna-seq data. G3 Genes| Genomes| Genet. 13, jkad004. doi:10.1093/g3journal/jkad004
Morgan, D., Studham, M., Tjärnberg, A., Weishaupt, H., Swartling, F. J., Nordling, T. E. M., et al. (2020). Perturbation-based gene regulatory network inference to unravel oncogenic mechanisms. Sci. Rep. 10, 14149. doi:10.1038/s41598-020-70941-y
Naldi, A., Hernandez, C., Levy, N., Stoll, G., Monteiro, P., Chaouiya, C., et al. (2018). The colomoto interactive notebook: accessible and reproducible computational analyses for qualitative biological networks. Front. Physiology 9, 680. doi:10.3389/fphys.2018.00680
Nie, D., Wang, L., Gao, Y., Lian, J., and Shen, D. (2019). Strainet: spatially varying stochastic residual adversarial networks for mri pelvic organ segmentation. IEEE Trans. Neural Netw. Learn. Syst. 30, 1552–1564. doi:10.1109/TNNLS.2018.2870182
Pan, S., Wang, H., Zhang, H., Tang, Z., Xu, L., Yan, Z., et al. (2025). Utr-insight: integrating deep learning for efficient 5 utr discovery and design. BMC Genomics 26, 107. doi:10.1186/s12864-025-11269-7
Paul, M., Jereesh, A., and Santhosh Kumar, G. (2024). Reconstruction of gene regulatory networks using graph neural networks. Appl. Soft Comput. 163, 111899. doi:10.1016/j.asoc.2024.111899
Pham, P., Bui, Q.-T., Nguyen, N., Kozma, R., Yu, P., and Vo, B. (2024). Topological data analysis in graph neural networks: surveys and perspectives. In: IEEE Transactions on Neural Networks and Learning Systems: IEEE. doi:10.1109/TNNLS.2024.3520147
Reddy, C., Reddy, P., Janapati, H., Assiri, B., Shuaib, M., Alam, S., et al. (2024). A fine-tuned vision transformer based enhanced multi-class brain tumor classification using mri scan imagery. Front. Oncol. 14, 1400341. doi:10.3389/fonc.2024.1400341
Rubiolo, M., Milone, D., and Stegmayer, G. (2015). Mining gene regulatory networks by neural modeling of expression time-series. IEEE/ACM Trans. Comput. Biol. Bioinforma. 12, 1365–1373. doi:10.1109/TCBB.2015.2420551
Ruyssinck, J., Huynh-Thu, V., Geurts, P., Dhaene, T., Demeester, P., and Saeys, Y. (2014). Nimefi: gene regulatory network inference using multiple ensemble feature importance algorithms. PLoS ONE 9, e92709. doi:10.1371/journal.pone.0092709
Schaffter, T., Marbach, D., and Floreano, D. (2011). Genenetweaver: in silico benchmark generation and performance profiling of network inference methods. Bioinformatics 27, 2263–2270. doi:10.1093/bioinformatics/btr373
Shefa, F., Sifat, F., Uddin, J., Ahmad, Z., Kim, J., and Kibria, M. (2024). Deep learning and iot-based ankle-foot orthosis for enhanced gait optimization. Healthcare 12, 2273. doi:10.3390/healthcare12222273
Shen, J., Ain, Q., Liu, Y., Liang, B., Qiang, X., and Kou, Z. (2025). Gtat: empowering graph neural networks with cross attention. Sci. Rep. 15, 4760. doi:10.1038/s41598-025-88993-3
Su, C., Xu, Z., Shan, X., Cai, B., Zhao, H., and Zhang, J. (2023). Cell-type-specific co-expression inference from single cell rna-sequencing data. Nat. Commun. 14, 4846. doi:10.1038/s41467-023-40503-7
Wang, J., Ma, A., Ma, Q., Xu, D., and Joshi, T. (2020). Inductive inference of gene regulatory network using supervised and semi-supervised graph neural networks. Comput. Struct. Biotechnol. J. 18, 3335–3343. doi:10.1016/j.csbj.2020.10.022
Wang, Y., Sun, Y., Wang, B., Wu, Z., He, X., and Zhao, Y. (2023). Transfer learning for clustering single-cell rna-seq data crossing-species and batch, case on uterine fibroids. Briefings Bioinforma. 25, bbad426. doi:10.1093/bib/bbad426
Wang, Y., Sun, H., Sheng, N., He, K., Hou, W., Zhao, Z., et al. (2024). Esmsec: prediction of secreted proteins in human body fluids using protein language models and attention. Int. J. Mol. Sci. 25, 6371. doi:10.3390/ijms25126371
Wang, J., Li, J., Liu, C., Peng, Y., and Li, X. (2025). Fusing temporal and structural information via subgraph sampling and multi-head attention for information Cascade prediction. Sci. Rep. 15, 6801. doi:10.1038/s41598-025-91752-z
Wei, P., Guo, Z., Gao, Z., Ding, Z., Cao, R., Su, Y., et al. (2024). Inference of gene regulatory networks based on directed graph convolutional networks. Briefings Bioinforma. 25, bbae309. doi:10.1093/bib/bbae309
Wu, Y., Qian, B., Wang, A., Dong, H., Zhu, E., and Ma, B. (2023). Ilsgrn: inference of large-scale gene regulatory networks based on multi-model fusion. Bioinformatics 39, btad619. doi:10.1093/bioinformatics/btad619
Xiong, Q., Chen, Q., Tang, S., and Li, Y. (2025). An efficient and lightweight detection method for stranded elastic needle defects in complex industrial environments using vee-yolo. Sci. Rep. 15, 2879. doi:10.1038/s41598-025-85721-9
Xu, K., Lu, Y., Hou, S., Liu, K., Du, Y., Huang, M., et al. (2024). Detecting anomalous anatomic regions in spatial transcriptomics with stands. Nat. Commun. 15, 8223. doi:10.1038/s41467-024-52445-9
Yu, L., Liu, W., Wu, D., Xie, D., Cai, C., Qu, Z., et al. (2024a). Spatial-temporal combination and multi-head flow-attention network for traffic flow prediction. Sci. Rep. 14, 9604. doi:10.1038/s41598-024-60337-7
Yu, Z., Zhang, C., Wang, X., Chao, D., Liu, Y., and Yu, Z. (2024b). Dynamic graph topology generating mechanism: framework for feature-level multimodal information fusion applied to lower-limb activity recognition. Eng. Appl. Artif. Intell. 137, 109172. doi:10.1016/j.engappai.2024.109172
Yuan, Y., and Bar-Joseph, Z. (2021). Deep learning of gene relationships from single cell time-course expression data. Briefings Bioinforma. 22, bbab142. doi:10.1093/bib/bbab142
Zhang, X., Zhao, J., Hao, J., Zhao, X., and Chen, L. (2015). Conditional mutual inclusive information enables accurate quantification of associations in gene regulatory networks. Nucleic Acids Res. 43, e31. doi:10.1093/nar/gku1315
Zhang, Y., Li, J., Lin, S., Zhao, J., Xiong, Y., and Wei, D. (2024). An end-to-end method for predicting compound-protein interactions based on simplified homogeneous graph convolutional network and pre-trained language model. J. Cheminformatics 16, 67. doi:10.1186/s13321-024-00862-9
Zhao, J., Zhou, Y., Zhang, X., and Chen, L. (2016). Part mutual information for quantifying direct associations in networks. Proc. Natl. Acad. Sci. U. S. A. 113, 5130–5135. doi:10.1073/pnas.1522586113
Zhao, F., Li, N., Pan, H., Chen, X., Li, Y., Zhang, H., et al. (2022). Multi-view feature enhancement based on self-attention mechanism graph convolutional network for autism spectrum disorder diagnosis. Front. Hum. Neurosci. 16, 918969. doi:10.3389/fnhum.2022.918969
Zhao, Y., Long, C., Shang, W., Si, Z., Liu, Z., Feng, Z., et al. (2024). A composite scaling network of efficientnet for improving spatial domain identification performance. Commun. Biol. 7, 1567. doi:10.1038/s42003-024-07286-z
Zhou, S., Wang, W., Zhu, L., Qiao, Q., and Kang, Y. (2024). Deep-learning architecture for pm2.5 concentration prediction: a review. Environ. Sci. Ecotechnology 21, 100400. doi:10.1016/j.ese.2024.100400
Zhu, Q., Jiang, X., Zhu, Q., Pan, M., and He, T. (2019). Graph embedding deep learning guides microbial biomarkers’ identification. Front. Genet. 10, 1182. doi:10.3389/fgene.2019.01182
Keywords: gene regulatory network, graph neural network, topology-aware attention mechanism, feature fusion, network inference
Citation: Wang S, Zhang L, Gao L, Rao Y, Cui J and Yang L (2025) GTAT-GRN: a graph topology-aware attention method with multi-source feature fusion for gene regulatory network inference. Front. Genet. 16:1668773. doi: 10.3389/fgene.2025.1668773
Received: 18 July 2025; Accepted: 24 September 2025;
Published: 08 October 2025.
Edited by:
Miha Moškon, University of Ljubljana, SloveniaReviewed by:
Muhammad Sajjad, Zhejiang Agriculture and Forestry University, ChinaXiaobo Sun, Zhongnan University of Economics and Law, China
Copyright © 2025 Wang, Zhang, Gao, Rao, Cui and Yang. This is an open-access article distributed under the terms of the Creative Commons Attribution License (CC BY). The use, distribution or reproduction in other forums is permitted, provided the original author(s) and the copyright owner(s) are credited and that the original publication in this journal is cited, in accordance with accepted academic practice. No use, distribution or reproduction is permitted which does not comply with these terms.
*Correspondence: Linnan Yang, MTk4NTAwOEB5bmF1LmVkdS5jbg==