 Jie Lin1‡
 Xuemei Lei1‡
 Yanhong Li1
 Xin Jiang2,3
 Fengle Jiang2,3Aihua Guo1Xintong Cai4
 Xingming Ye5Yang Sun1,5*†
- 1Department of Gynecology, Clinical Oncology School of Fujian Medical University, Fujian Cancer Hospital, Fuzhou, Fujian Province, China
- 2Innovation Center for Cancer Research, Clinical Oncology School of Fujian Medical University, Fujian Cancer Hospital, Fuzhou, China
- 3Fujian Key Laboratory of Advanced Technology for Cancer Screening and Early Diagnosis, Fuzhou, China
- 4Department of Gynecology and Obstetrics, First Affiliated Hospital of Zhengzhou University, Zhengzhou, Henan, China
- 5Fujian Provincial Key Laboratory of Tumor Biotherapy, Clinical Oncology School of Fujian Medical University, Fujian Cancer Hospital, Fuzhou, Fujian Province, China
Background: Senescence-related lncRNAs (srlncRNA) mediate carcinogenesis in various malignancies. However, its roles in endometrial cancer (EC) remain unknown. Our research aims to construct a predictive srlncRNA model with prognostic and therapeutic significance in EC.
Methods: We first downloaded the gene expression and medical information from the TCGA, as well as senescence-related lncRNAs (srlncRNAs) from the CellAge databases. Then, a co-expression network of cell senescence-related mRNA−lncRNA was explored with R. Subsequently, we performed Cox and Lasso regression and machine learning analysis to identify srlncRNAs related to the prognosis of EC and built a predictive model. Continually, we drew a nomogram to improve its ability to predict prognosis. Further, GSEA was used to explore potential mechanisms. Differences in TME, immune infiltrating cells, and checkpoints of the two risk groups were compared using GSEA and CIBERSORT. Finally, the drug sensitivity of patient-derived tumor organoids (PDOs) was investigated.
Results: We first built a prognostic model based on seven srlncRNAs (AL121906.2, AP002761.4, BX322234.1, LINC00662, LINC00908, VIM-AS1, and ZNF236-DT). The model, which was screened by machine learning, functioned well in three sets with good stability and accuracy. Furthermore, the nomogram based on age, grade, and risk scores could precisely predict the prognosis of EC patients. The AUC of risk scores was highest compared to other clinical parameters (AUC risk score = 0.769, AUC age = 0.615, and AUC grade = 0.681). This srlncRNAs were enriched in the cell cycle, certain malignant tumors, and cancer-associated regulatory pathways. Afterward, low-risk EC patients had more immune-infiltrating cells and may benefit from anti-PD-1 and anti-CTLA4 treatment. Paclitaxel, gemcitabine, and cisplatin (all p < 0.05) may be more useful in EC patients with high expression of targeted srlncRNAs in the GDSC database. The levels of targeted srlncRNAs and drug sensitivity varied significantly among different EC PDOs. The EC-18 PDO was more resistant to three drugs, which aligned with clinical observation.
Conclusion: The srlncRNA signature (AL121906.2, AP002761.4, BX322234.1, LINC00662, LINC00908, VIM-AS1, and ZNF236-DT) could guide prognosis prediction and treatment choices for EC patients.
Introduction
Endometrial cancer (EC) is currently the most lethal gynecologic malignancy, with its incidence rising globally (Lin et al., 2024; Corr et al., 2025). According to the 2022 Global Cancer Observatory (GLOBOCAN), new cases of EC were estimated to reach 420,242, with mortality figures at 97,704 (Bray et al., 2024). It is projected that by 2050, more than 676,296 individuals worldwide will still be diagnosed with EC, resulting in nearly 183,083 fatalities (https://gco.iarc.who.int/tomorrow/en). The standard treatment for EC, according to NCCN guidelines, is a total hysterectomy along with bilateral salpingo-oophorectomy. Adjuvant therapies, such as radiation and/or chemotherapy, are considered based on the tumor’s histology and its stage (Abu-Rustum et al., 2025). Recently, molecular classification has brought immunotherapy, such as anti-PD-1, anti-PD-L1, or anti-CTLA-4 treatments, to the forefront (Abu-Rustum et al., 2025). While most EC patients present with early-stage disease and have favorable prognoses, patients with stage III and IV disease have 5-year survival rates of 48% and 15%, respectively (Crosbie et al., 2022). Specifically, approximately 20%–30% of ECs are considered high risk and are associated with recurrence rates of up to 30% at diagnosis (Gordhandas et al., 2023). Therefore, it is essential to focus on developing precise therapeutic strategies and effective prognostic biomarkers for patients with EC who are at high risk of recurrence.
Cellular senescence is a stress response that inhibits the growth of aged, damaged, or abnormal cells (McHugh et al., 2025). It can have both beneficial and detrimental effects in various physiological and pathological contexts, including cancer regulation (Schmitt et al., 2022; Chen et al., 2023; Deng et al., 2024; Zingoni et al., 2024; Colucci et al., 2025). A key molecular process involved in senescence is the progressive shortening of telomeres, the protective structures at the ends of chromosomes. This process ultimately leads to cellular senescence and can be influenced by senescence-related long non-coding RNAs (srlncRNAs) (Rossi and Gorospe, 2020). SrlncRNAs are typically over 200 nucleotides long. Although they do not code for proteins, they play important roles in immune remodeling and cancer regulation across various types of cancer (Santos-Sousa et al., 2025), including melanoma (Lin et al., 2023), head and neck squamous cell carcinoma (Chen et al., 2024), and glioma (Liu et al., 2023). To date, there has been limited research focused on the roles of srlncRNAs in EC.
To fill this gap, we construct a predictive srlncRNAs RNA signature based on the Cancer Genome Atlas (TCGA) database and the CellAge database by using machine learning analysis. Then, we investigate its predictive abilities in prognosis, potential biological functions and mechanisms, and immune status. Finally, the drug sensitivity of patient-derived tumor organoids (PDOs) was investigated as external validation.
Materials and methods
Data source
Gene expression and clinical medical information for EC patients were retrieved from the TCGA-UCEC database (https://cancergenome.nih.gov/). The raw data were normalized using R (version 3.6.3). Initially, 552 patients were selected for analysis. However, after excluding samples with incomplete or duplicated clinical features—such as age, stage, TNM classification, and overall survival—a total of 503 samples were included in our study. Detailed clinical features can be found in Supplementary Table S1. Additionally, we extracted 279 senescence-related mRNAs from the CellAge database (https://genomics.senescence.info/cells/cellAge.zip) for further analysis. The data were downloaded on 1 May 2022.
Construction of predictive signature
A senescence-related lncRNA-mRNA co-expression gene expression network was established with absolute Pearson correlation coefficient values |Coef| of >0.3 and P < 0.001 as the thresholds. To visualize the lncRNA-mRNA co-expression network, a Sankey diagram was created using the R package (version 3.6.3). A total of 974 senescence-related lncRNAs were identified. After filtering out srlncRNAs related to the prognosis, we created a prognostic model by performing Kaplan–Meier and univariate and multivariate Cox regression analyses and Lasso analysis using machine learning analysis. Finally, a receiver operating characteristic curve (ROC) was drawn to evaluate the model’s predictive ability. We also identified whether the signature was an independent risk factor by Cox analyses.
The risk score was calculated by the following formula (Lin et al., 2025): Risk score = ∑i β1 (lncRNA1) × EXP (lncRNA1) + β2 (lncRNA2) × EXP (lncRNA2) +……+ β n (lncRNAn) × EXP (lncRNAn), EXP represents the expression level of srIncRNAs in our model, β represents the coefficient of srIncRNAs in the multivariate Cox regression analysis. According to the median risk score, EC patients were divided into the high- and low-risk groups.
Signature validation and nomogram assessment
We developed an optimal predictive model using machine learning techniques, including GBM (Gradient Boosting Machine), Random Survival Forest (RSF), CoxBoost, SurvivalSVM, and Lasso regression. We randomly divided 503 EC patients into a training set (n = 251) and a test set (n = 252) to evaluate the model’s reliability and accuracy. We compared the risk score distributions, ROC curves, and overall survival (OS) between the two groups across three sets. Additionally, we created a nomogram that incorporates risk scores, age, and tumor grade. The calibration curves for 1-, 3-, and 5-year survival demonstrated the predictive capability of the nomogram.
GSEA analysis and immune status investigation
We conducted Gene Ontology (GO) (Nucleic Acids Res 43, 2015) and Kyoto Encyclopedia of Genes and Genomes (KEGG) analyses (Kanehisa and Goto, 2000), as well as GSEA (https://www.broadinstitute.org/gsea/index.jsp) to explore the potential mechanisms and pathways between the two groups. To evaluate the immunotherapy response of the two risk groups, we analyzed and compared the differences in the tumor microenvironment (TME), immune cells, and immune checkpoints. The TME (stromal, immune, and ESTIMATE scores) of each sample in the two risk groups was assessed using ESTIMATE (Yoshihara et al., 2013). We then used a single-sample gene set enrichment analysis (ssGSEA) (Hänzelmann et al., 2013) and the CIBERSORT(Newman et al., 2019) algorithm to investigate the tumor-infiltrating immune cells between the two groups. Moreover, the immune checkpoints between groups were also compared.
PDOs culture
The fresh tumor tissues were obtained from EC patients who were undergoing surgical treatment. Their clinical information is provided in Supplementary Table S2. The procedure for PDO culture is described in our previous experiments (Cai et al., 2023). Fresh tumor tissue was cut into 1 mm3 and transferred to a 6 cm dish containing 4 mL Tumor Tissue Digestion Solution (Mogengel Bio; Cat: MB-0818L05). The mixture was digested on a shaker at 80 rpm at 37 °C for 30 min to 1 h until no granular tissue was evident. Digestion was stopped by the addition of DPBS. The solution was filtered through a 100 μm cell filter to remove debris, then centrifuged at 300 g for 3 min at 4 °C, and the supernatant was discarded. Pellets were resuspended in Human Endometrial Cancer Organoid Kit (Mogengel bio; Cat: MA-0807T007), then mixed with 1:1 Matrigel (Mogengel bio; Cat:082703), and 50 μL of each drop was inoculated into preheated 6-well plates. Incubate at 37 °Cand 5% CO2 for 15–30 min to polymerize the matrix. After polymerization, 2 mL of organoid medium was added to each well for continuous culture. The morphology of PDOs was observed every 2 days by the microscope (Nikon, TS2). Organoids were dissociated at 37 °C for 5 min when they grew to 150–200 µm using organoid dissociation solution TrypLE™ Express (Gibco; Cat:12605028). Then we passed them to the first (P1) and second generations (P2).
RT-qPCR validation
We extracted total RNA from the PDOs following the instructions provided with the RNAeasy™ Animal RNA Extraction Kit (Beyotime; Cat: R0026). cDNA was synthesized through reverse transcription using the NovoScript® Plus All-in-one 1st Strand cDNA Synthesis SuperMix (gDNA Purge) (Novoprotein; Cat: E047). GAPDH served as the internal reference. The amplification process comprised 40 cycles, starting with an initial denaturation step at 95 °C for 5 minutes. This was followed by 10 s at 95 °C and then 30 s at 60 °C. The mRNA expression levels were normalized to GAPDH using the ChamQ Blue Universal SYBR qPCR Master Mix (Vazyme; Cat: Q312) (Ji et al., 2023). The primers utilized are listed in Supplementary Table S3.
Immunohistochemistry (IHC) validation
The IHC of tumor tissues and organoids was performed to validate their origin consistency with specific biomarkers associated with EC, including Estrogen Receptor (ER), Progesterone Receptor (PR), and Vimentin. Additionally, Ki-67 was assessed to identify tumor malignant behaviors. The antibodies used in this study are listed below: ER (Proteintech; Cat: 21244-1-AP; 1:500), PR (Proteintech; Cat: 25871-1-AP; 1:500), Vimentin (Servicebio; Cat: GB121308; 1:1000), and Ki-67 (Servicebio; Cat: GB111499; 1:1000).
Immunohistochemical staining for each slide was evaluated blindly by two pathologists using a semi-quantitative method. For each sample, three random fields of view at ×100 magnification were selected for scoring. Staining intensity was scored based on the degree of positive staining: intense (3 points), moderate (2 points), weak (1 point), and negative (0 points). The proportion of stained cells was categorized into four groups: 76%–100% (4 points), 51%–75% (3 points), 26%–50% (2 points), and 0%–25% (1 point). The immunohistochemical H-score for each sample was calculated by multiplying the intensity score by the percentage of positively stained cells.
Samples were classified into four groups based on their immunoreactive scores: 0 (negative, −), 1–4 (weakly positive, +), 5–8 (positive, ++), and 9–12 (strongly positive, +++). The concordance of immunohistochemical staining between tumor tissue and PDOs was assessed using the Pearson correlation coefficient (r = 0.8651, p < 0.05). The agreement between the two pathologists’ assessments was evaluated using the Kappa test (κ = 0.869, p < 0.05), which indicates good agreement.
Drug sensitivity in PDOs
First, we retrieved drug information, including paclitaxel, gemcitabine, and cisplatin, from the Genomics of Drug Sensitivity in Cancer (GDSC) database (https://www.cancerrxgene.org). Half maximal inhibitory concentration (IC50) was used to predetermine drug sensitivity for EC patients. Then, the PDOs from different EC patients were cultured and exposed to various concentrations of Paclitaxel (GLPBIO; Cat: GC12511), Gemcitabine (GLPBIO; Cat: GC14447), and Cisplatin (MCE; Cat: HY-17394) at concentrations of 100, 10, 1, 0.1, and 0.01 μg/mL for 120 h, respectively. The 0.1% DMSO was used as the control group. The drug sensitivity of organoids was measured by ATP using CellTiter-Lumi™ Luminescence 3D Cell Viability Detection Kit (Beyotime; Cat: C0061).
Statistical analysis
R (version 3.6.3) was utilized for data analysis. The Kaplan-Meier plots and Cox regression analysis were conducted using the “survival” and “survminer” packages. GBM machine learning analysis was performed using the “GBM” package, while RSF machine learning analysis was conducted using the “randomForestSRC” package. The CoxBoost machine learning analysis utilized the “CoxBoost” package, and the SurvivalSVM analysis was conducted using the “survivalsvm” package. GraphPad Prism (version 10.1.2) was employed for statistical analyses of the experiments. All experiments were performed in triplicate, and a significance level of p < 0.05 was considered statistically significant.
Results
The construction and validation of srlncRNA signature
The workflow is demonstrated in Figure 1. Nine hundred forty-seven srlncRNAs were initially identified. Sixty-three out of these identified srlncRNAs were significantly associated with the prognosis of EC (p < 0.01). Among sixty-three srlncRNAs, thirty-one were linked to low risk (hazard ratio (HR) < 1), and thirty-two were related to high risk (HR > 1). Subsequently, we anchored seven srlncRNAs to create a predictive model by performing Lasso regression and Cox regression analysis (Figure 2). Those genes were LINC00908, VIM-AS1, and ZNF236-DT, AL121906.2, AP002761.4, BX322234.1, and LINC00662. Among these seven srlncRNAs, three srlncRNAs (LINC00908, VIM-AS1, and ZNF236-DT) were beneficial for prognosis, whereas the other four srlncRNAs (AL121906.2, AP002761.4, BX322234.1, and LINC00662) were detrimental to prognosis (Figure 3; Supplementary Table S4). By machine learning, the Lasso model with seven srlncRNAs was identified to be optimal (Supplementary Table S5). A prognostic visual co-expression network of srlncRNAs–mRNAs was exhibited (Figure 4).
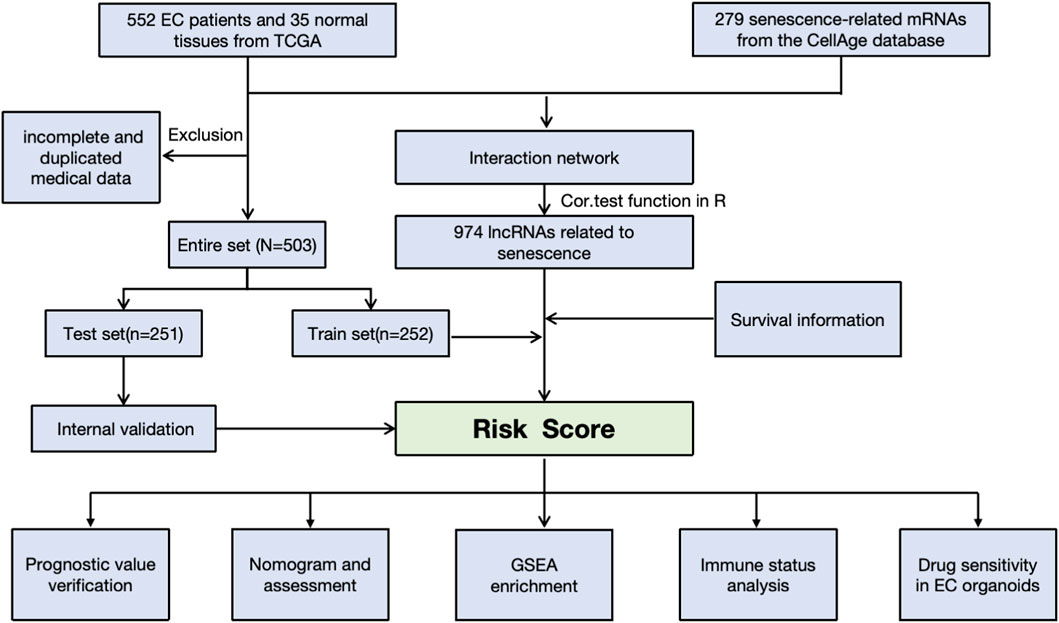
Figure 1. Flow diagram of the study.
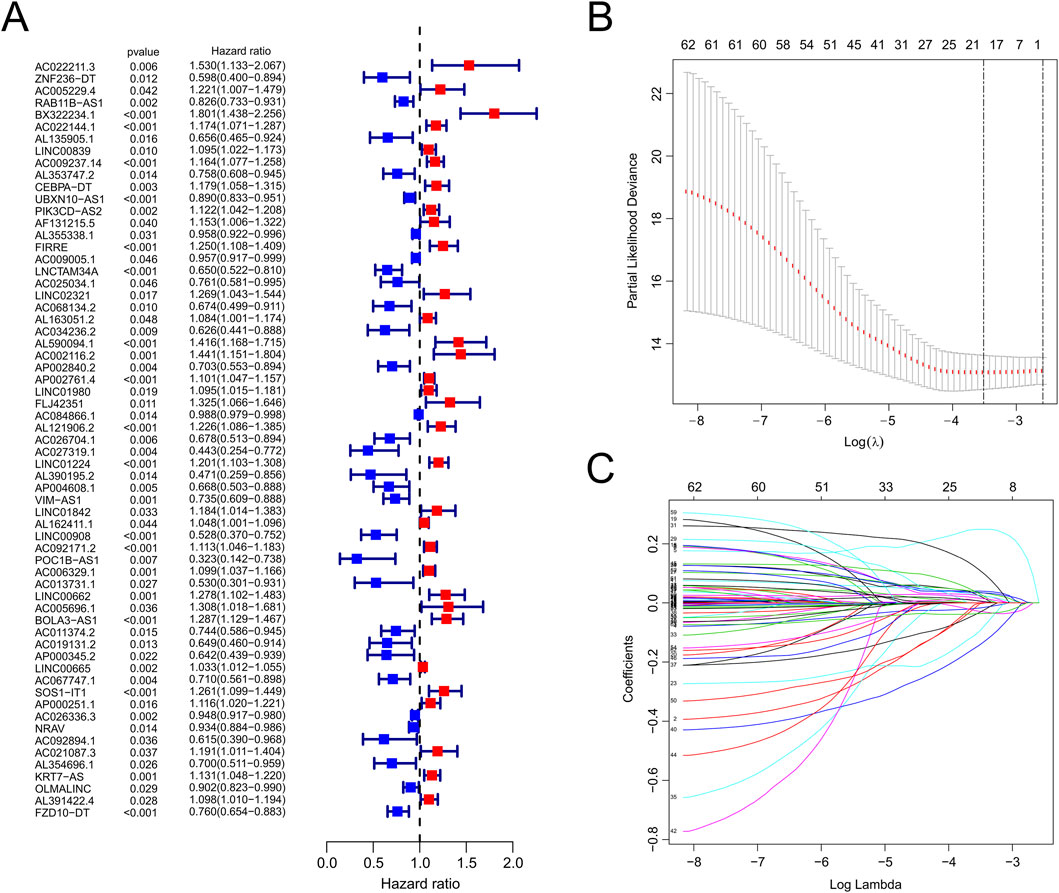
Figure 2. Identification of srlncRNAs with significant prognostic value in EC. (A) The forest showed the HR (95%CI) and p-value of selected lncRNAs by univariate Cox proportional-hazards analysis. (B,C) Lasso regression.
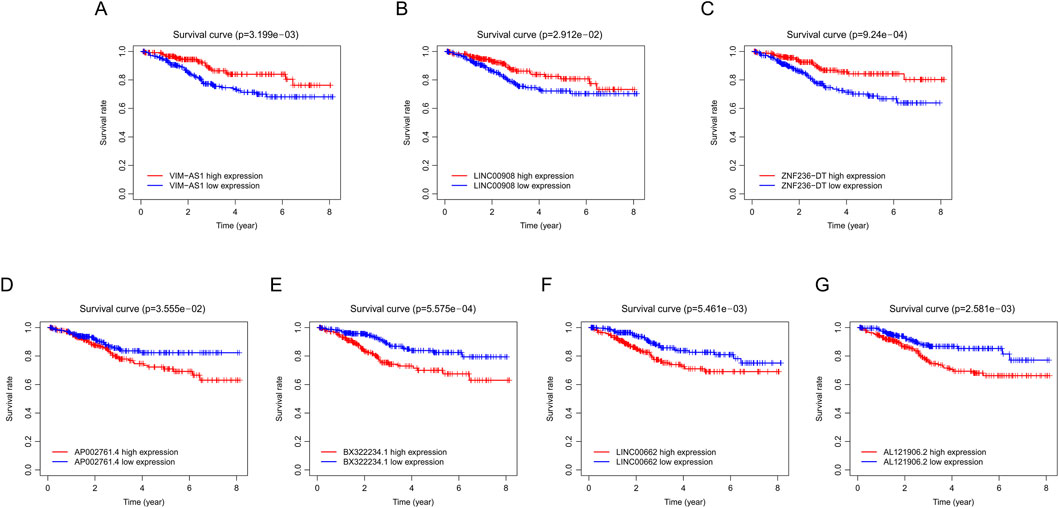
Figure 3. Survival curve of EC patients in different groups. (A) Comparison of survival rates between high and low VIM-ASI levels in EC patients using Kaplan-Meier analysis. (B) Comparison of survival rates between high and low LINC00908 levels in EC patients using Kaplan-Meier analysis. (C) Comparison of survival rates between high and low ZNF236-DT levels in EC patients using Kaplan-Meier analysis. (D) Comparison of survival rates between high and low AP002761.4 levels in EC patients using Kaplan-Meier analysis. (E) Comparison of survival rates between high and low BX322234.1 levels in EC patients using Kaplan-Meier analysis. (F) Comparison of survival rates between high and low LINC00662 levels in EC patients using Kaplan-Meier analysis. (G) Comparison of survival rates between high and low AL121906.2 levels in EC patients using Kaplan-Meier analysis. EC, endometrial cancer.
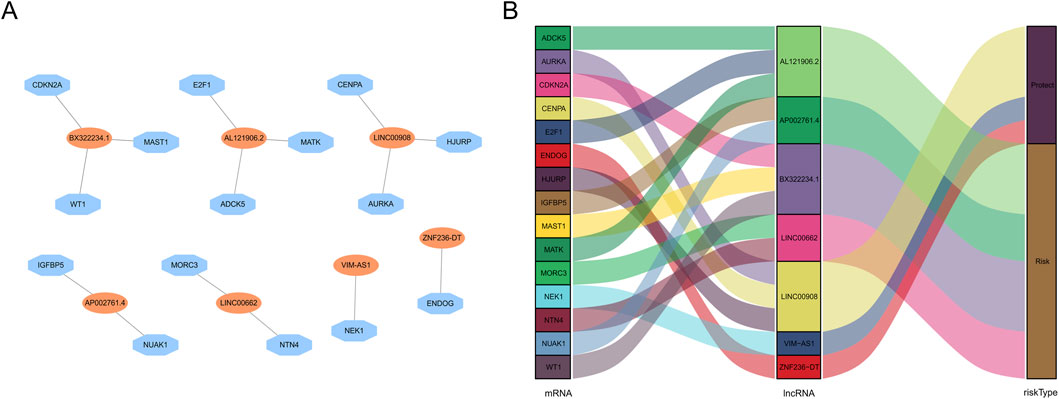
Figure 4. Screening of prognostic srlncRNA in EC. (A) A co-expression network of srlncRNAs and mRNAs. (B) The Sankey diagram of the relationship between lncRNA and mRNA.
We contrasted the distribution of risk scores, the survival status, the ROC curve, and the survival outcomes in three sets, respectively (Figure 5; Supplementary Figure S1). The risk curves and scatter plots implied that mortality was positively associated with the risk score in three sets (Figures 5A,B). We also found that the patients in the high-risk group had lower OS rates than patients with lower risk scores in three sets (all p < 0.05, Figure 5C). Moreover, ROC curves of the entire set (ROC1-year = 0.762, ROC3-year = 0.76, ROC5-year = 0.773), train set (ROC1-year = 0.762, ROC3-year = 0.76, ROC5-year = 0.773), and test set (ROC1-year = 0.714, ROC3-year = 0.751, ROC5-year = 0.730) all demonstrated our prognostic model was stable and reliable (Figure 5D).
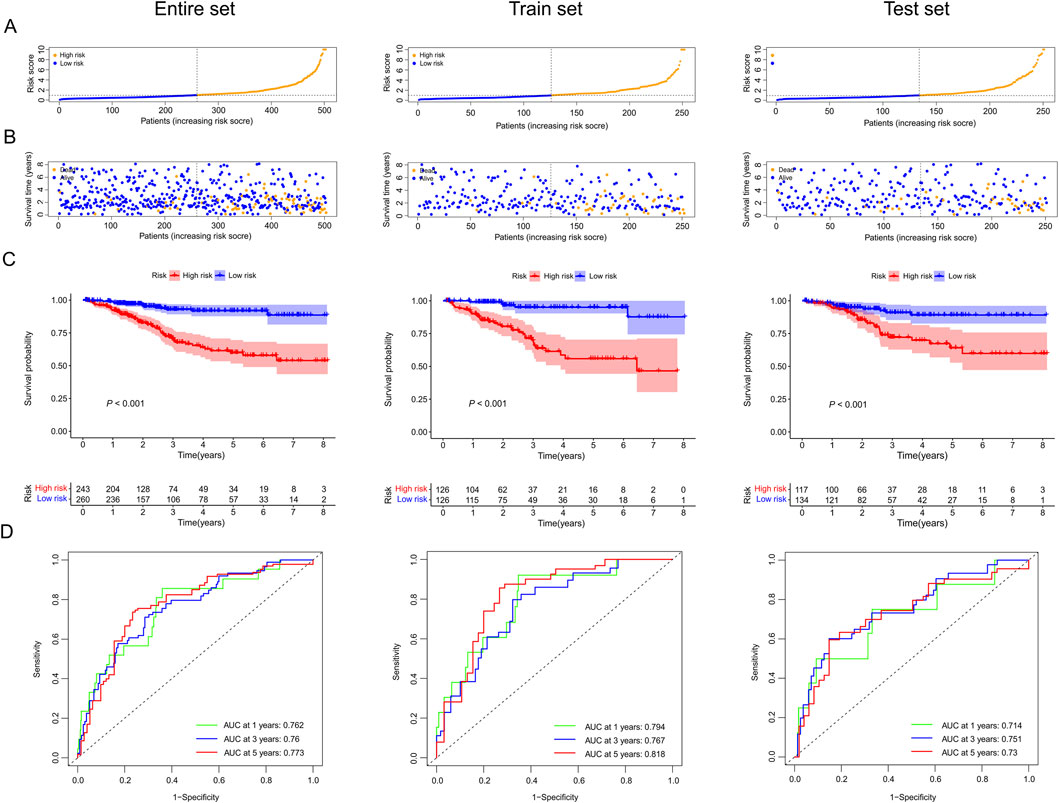
Figure 5. The prognostic value of our predictive model in the entire, train, and test sets. (A) Exhibition of risk scores of the low and high-risk groups in three sets. (B) Survival time and survival status of EC patients in low and high-risk groups of three sets. (C) Kaplan-Meier survival curves for EC patients in low- and high-risk groups across three sets. (D) Time-dependent ROC curves between low and high-risk groups in three sets.
Prognosis value and nomogram assessment
Based on the results of univariate and multivariate Cox regression analyses, we found the HR of risk score was 1.106 (Figure 6A) and 1.081 (Figure 6B), respectively (all p values <0.001). These results indicated that our predictive model was an independent prognostic factor for EC patients. The AUC value was 0.769, higher than age and grade (Figure 6D), suggesting that our model could more precisely predict the survival outcomes of EC patients. Afterward, the nomogram we created was easy to master and could precisely predict the 1-, 3-, and 5-year survival probability (Figure 6C). Calibration curves validated our model’s predictive ability (Figures 6E–G).
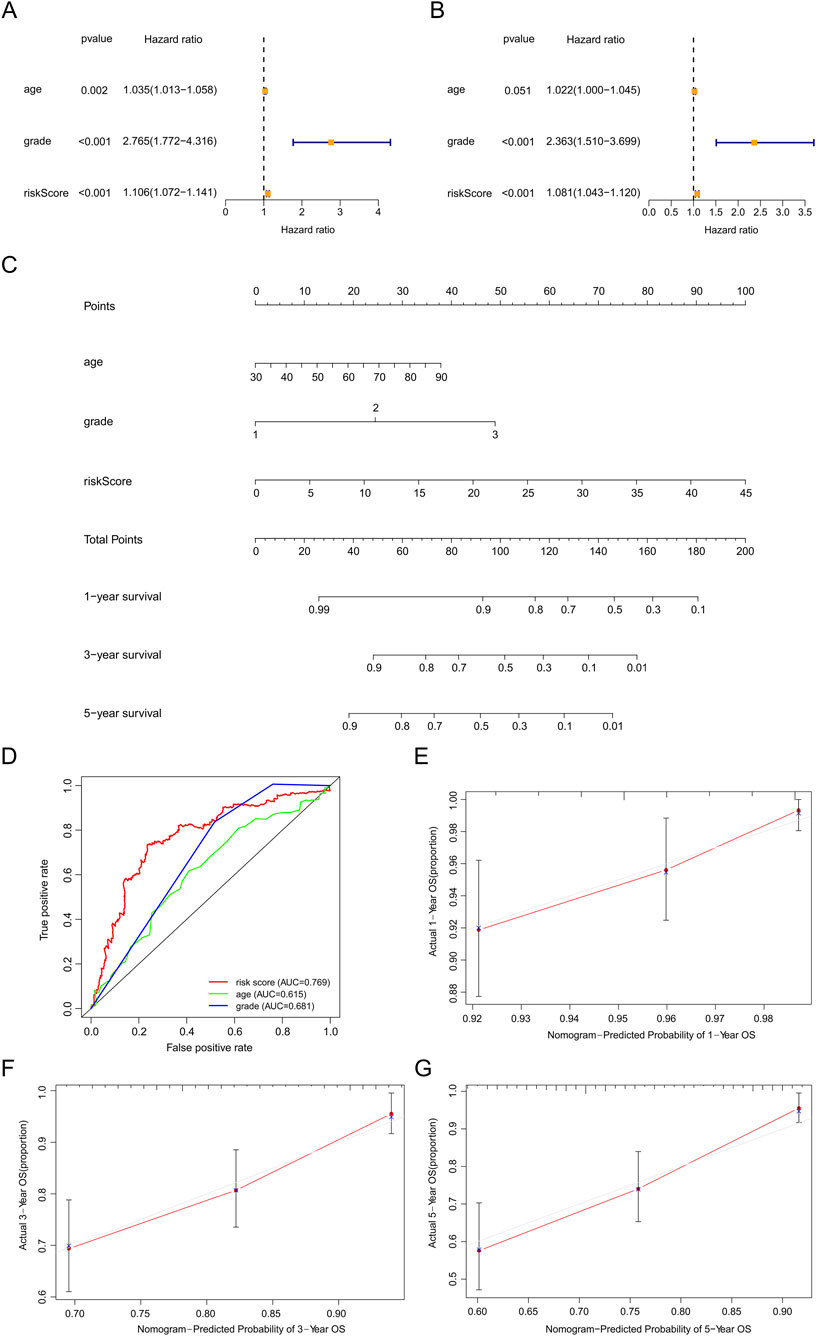
Figure 6. Assessment of the prognostic survival model based on seven srlncRNAs. (A,B) Univariate and Multivariate Cox regression analysis of risk score and clinical factors. (C) The nomogram of risk score and clinical factors. Clinical factors: age and grade. (D) The AUC for risk model score, age, and grade. Clinical factors: age and grade. (E) The 1-year OS calibration curve. (F) The 3-year OS calibration curve. (G) The 5-year OS calibration curve.
We examined the correlation between model genes, risk score, age, fustat, and grade. High levels of three favorable lncRNAs (ZNF236-DT, VIM-AS1, and LINC00908) were negatively correlated with risk scores, grade, age, and mortality rates. In contrast, high levels of the other four harmful lncRNAs (BX322234.1, LINC00662, AP002761.4, and AL121906.2) were positively correlated with them (Figure 7A). Furthermore, we found that patients in the high-risk group had lower OS, compared to those in the low-risk group, based on different subgroups (age ≤65 years or >65 years and grade 1 or grades 2–3) (Figure 7B). These results indicated that the risk score was efficient in predicting the prognosis of EC patients.
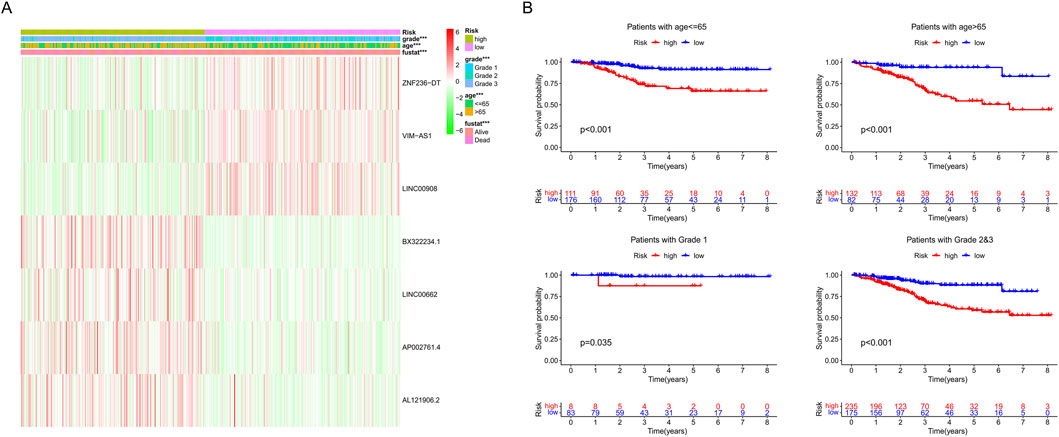
Figure 7. (A) Heat map of seven srlncRNAs’ expression. (B) Survival analysis of the high-risk and low-risk groups in patients under different subgroups (age ≤ 65, age >65, grades 1, and grades 2–3).
We investigated the prognostic value and immune response of the srlncRNA signature across different TCGA molecular subtypes. Our findings indicate that EC patients with the CNH subtype have a higher risk score. In contrast, patients with the POLE, MSI, and CNL subtypes show lower risk scores, reflecting a similar trend in prognostic prediction and immune response with TCGA molecular subtypes. Specifically, patients with high-risk scores tend to have worse survival outcomes compared to those with low-risk scores, particularly in the MSI subtype (p < 0.0001) and the POLE subtype (p = 0.035). Therefore, our scoring system may be valuable for predicting prognostic significance and immune response when combined with TCGA subtypes (Supplementary Table S6; Supplementary Figure S2).
GSEA analysis
GO analysis revealed that nuclear chromosome segregation and extracellular transport were the primary biological functions of our identified srlncRNAs (Figure 8A). At the same time, KEGG analysis revealed srlncRNAs with high-risk scores were enriched in cell cycle, tumor regulations, and classical tumor-related pathways, such as the Erbb signaling pathway. In contrast, srlncRNAs with low-risk scores were concentrated in immune rejection (Figure 8B).
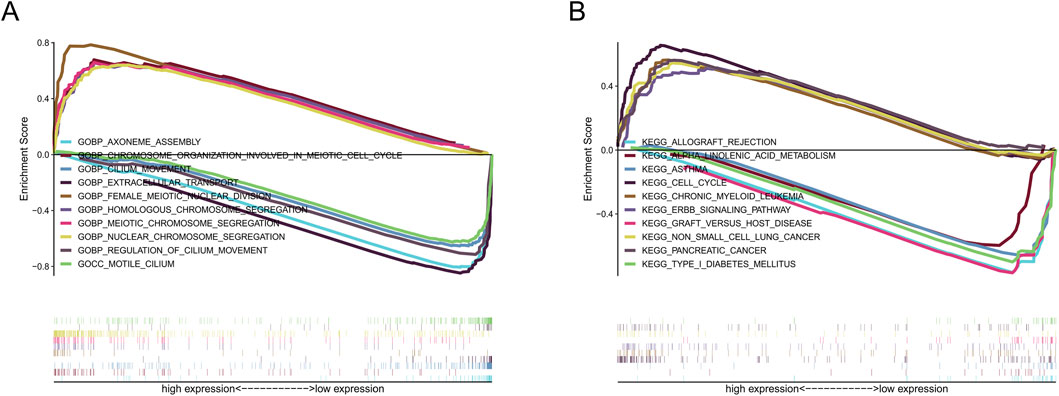
Figure 8. The results of functional analysis based on seven srlncRNAs model by GSEA. (A) GO enrichment analysis. (B) KEGG enrichment analysis.
Immune landscape investigation
The tumor immune microenvironment of EC was investigated using ESTIMATE. The TME scores (ESTIMATE, immune, and stromal scores) were lower in the high-risk group than in the low-risk group (all p < 0.050), indicating that the immune system was more vigorous in patients with lower-risk scores (Figures 9A–C). Furthermore, we used ssGSEA to assess immune-infiltrating cells and immune functions between the two risk groups (Figures 9D,E). The abundance of B cells (p < 0.05), CD8+ T cells (p < 0.001), iDCs (p < 0.001), neutrophils (p < 0.001), NK cells (p < 0.01), pDCs (p < 0.01), T helper cells (p < 0.01), Th1 cells (p < 0.001), Th2 cells (p < 0.001), TILs (p < 0.001) and Tregs (p < 0.01) were observed in low-risk patients. In contrast, the aDCs were higher in patients with high-risk scores (p < 0.001). In the low-risk group, a total of 25 checkpoints were upregulated, such as CD28, CD86, CTLA4, TIGIT, CD44, and CD27 (p < 0.05), whereas in the high-risk group, four therapy sites (ICOSLG, IDO2, CD40, and BTNL2) were upregulated (p < 0.05) (Figure 9F).
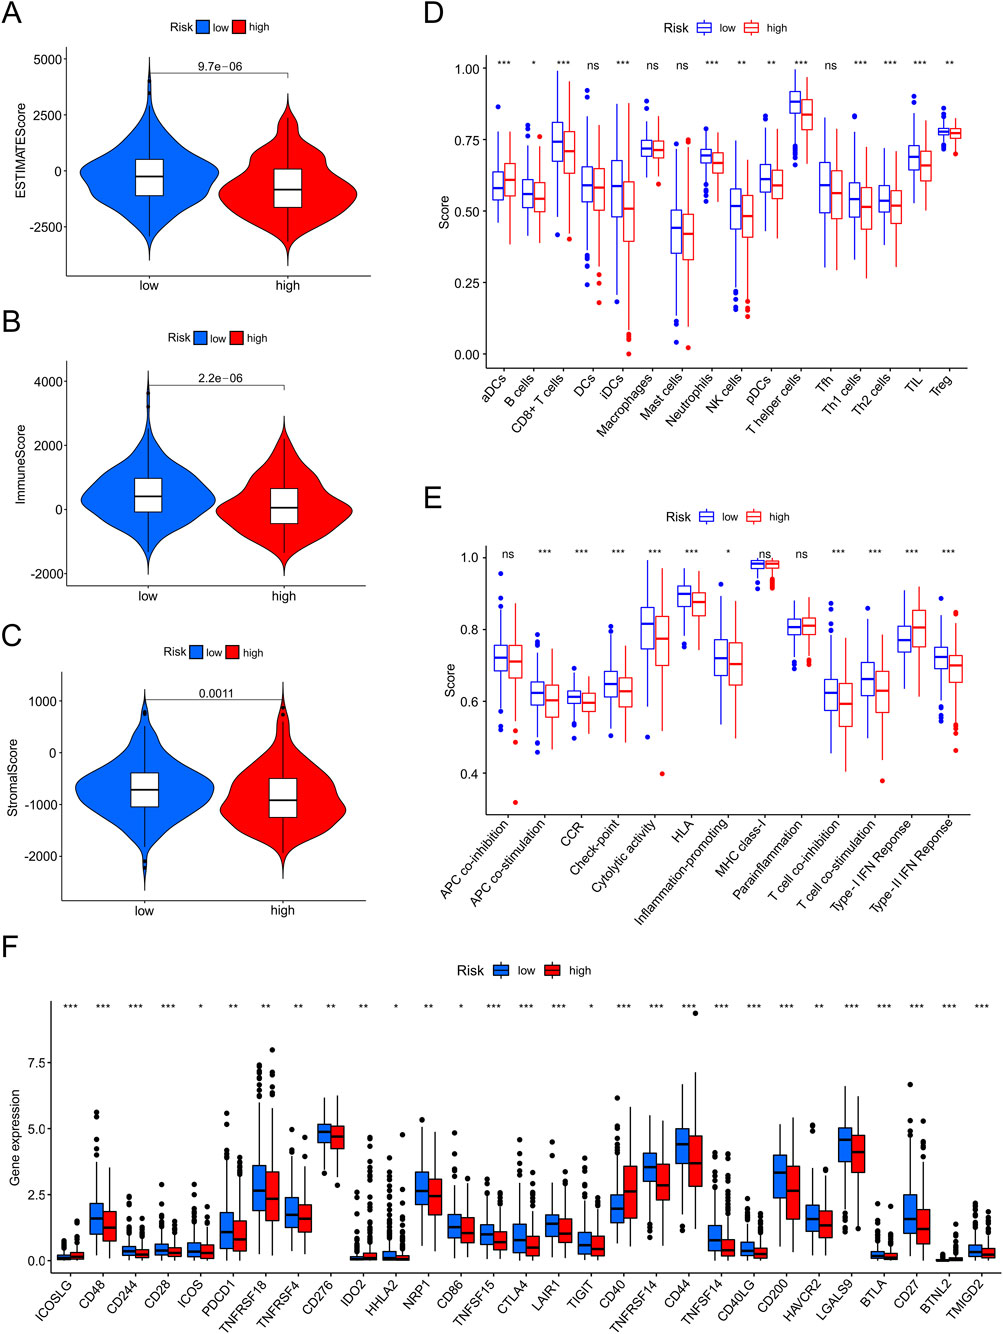
Figure 9. The investigation of tumor immune factors and immunotherapy. (A–C) Estimate score, immune score, and stromal score in high-and low-risk groups. (D,E) The varied proportions of immune cells and immune functions in high-and low-risk groups by ssGSEA. (F) The 29 immune checkpoint inhibitor (ICI) levels in high-and low-risk groups.
Drug sensitivity in PDOs
We cultured the PDOs of EC patients for drug sensitivity analysis. The morphology of EC organoids confirmed that EC organoids were successfully cultured and passaged from P0 to P2 (Figure 10A). IHC results further confirmed that the EC organoids maintained the same homological origin as their corresponding tissue (Figure 10B). Then, we calculated the relative expression of targeted srlncRNAs in tumor tissues from four EC patients. The expression levels varied significantly among different patients (Figure 11A). Subsequently, paclitaxel, gemcitabine, and cisplatin showed increased sensitivity in patients with high-risk scores (all p < 0.05), as indicated by the GDSC database (Figure 11B). Continually, we assessed the drug sensitivity of paclitaxel, gemcitabine, and cisplatin in EC organoids. The dose-response curves are shown in Figure 11C. The EC-18 PDO was more resistant to three drugs, which aligns with clinical observations. Our findings on drug sensitivity may help optimize individualized treatment strategies.
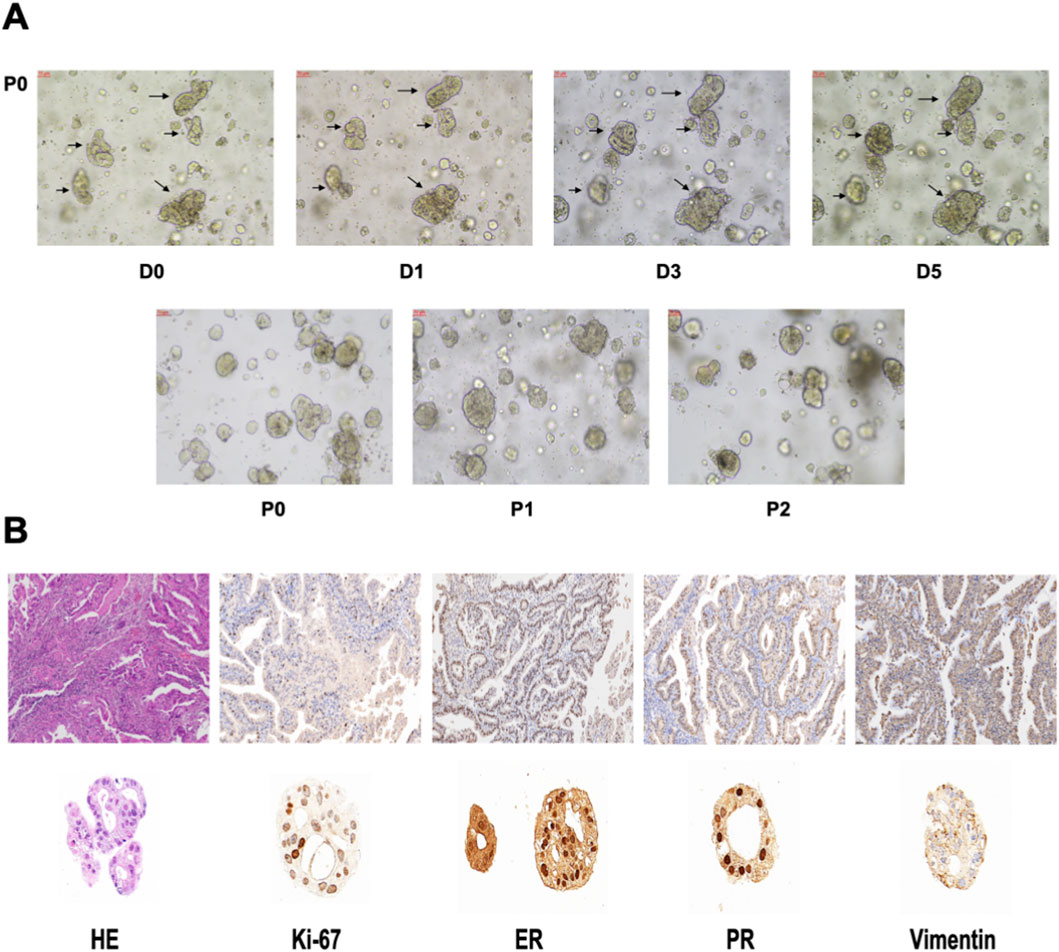
Figure 10. (A) The organoid morphology of P0, P1, and P2. (B) Comparison of HE and IHC between organoids and EC tissues. HE, Hematoxylin-eosin staining. IHC, Immunohistochemistry.
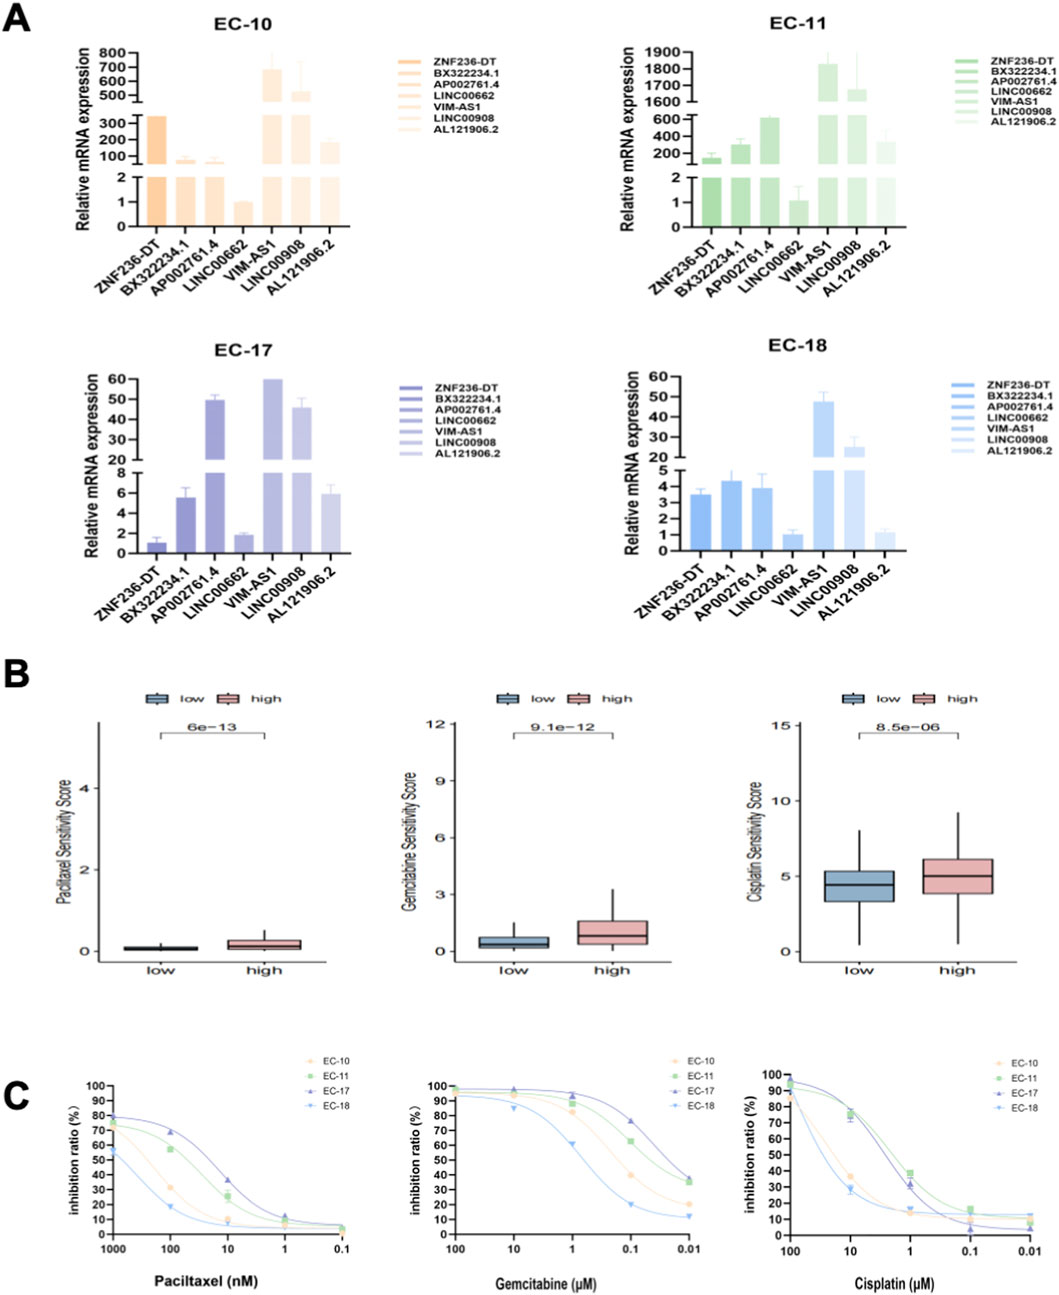
Figure 11. (A) Relative mRNA levels of targeted genes from four organoids; (B) Drug sensitivity analysis, including paclitaxel, gemcitabine, and cisplatin, based on the GDSC database; (C) The inhibition ratio plot of organoids treated with various concentrations of paclitaxel, gemcitabine, and cisplatin. GDSC, Drug Sensitivity in Cancer.
Discussion
Cellular senescence is an almost universal property of biological organisms. Over the past decade, research has indicated a strong association between cellular senescence and cancers (Colucci et al., 2025). While cellular senescence is primarily viewed as an antitumor mechanism, it can also promote tumor development through interactions with the immune system (Herranz and Gil, 2018; Kowald et al., 2020; Wang et al., 2021). Recent studies have increasingly emphasized the important roles of lncRNAs in cellular senescence (Schmitt et al., 2022), the immune system (Barczak et al., 2023; Han, 2023), and the prediction of prognosis (Feng et al., 2022; Huo et al., 2022) across various cancers. However, the role of srlncRNAs in EC remains unclear. In this study, we developed a novel srlncRNA signature using machine learning analysis, which can predict survival outcomes and treatment responses for patients with EC.
Using TCGA data mining, we developed a predictive model based on seven srlncRNAs, which include AL121906.2, AP002761.4, BX322234.1, LINC00662, LINC00908, VIM-AS1, and ZNF236-DT. Among these srlncRNAs, AL121906.2 influences the prognosis of EC through glycolysis metabolism (Jiang et al., 2021). Additionally, BX322234.1 is also a prognostic biomarker for EC patients by the way of autophagy (Huo et al., 2022). Furthermore, LINC00662 has been shown to promote tumor progression in various cancers, including gallbladder cancer (Pérez-Moreno et al., 2024), osteosarcoma (Zhang et al., 2023), and melanoma (Luo et al., 2024). Similarly, LINC00908 promotes the progression of prostate cancer (Guan et al., 2025) and gastric cancer (Zhang et al., 2024). VIM-AS1 is implicated in the development of liver cancer (Han et al., 2024) and bladder cancer (Xiong et al., 2021). Lastly, AP002761.4 and ZNF236-DT appear to affect the immune microenvironment and tumor growth in acute myeloid leukemia (AML) (Zhao et al., 2024) and pancreatic adenocarcinoma (Huang et al., 2023), respectively.
In this study, ROC curves demonstrated that the predictive signature and tumor grade had better abilities in predicting survival outcomes compared to age. The tumor grade has been fully confirmed as related to the prognosis of EC patients (Tanaka et al., 2017). While our novel predictive model was the first to be established as an independent prognostic factor for EC patients. The advantage of the risk score was that it calculated each patient’s status and scored them separately, which made patient-oriented therapy possible. Moreover, it was closely related to TME and could predict the response to immunotherapy. Research indicates that patients with POLE mutations and those with mismatch-repair-deficient (dMMR) tumors tend to respond well to immunotherapy (Jamieson and McAlpine, 2023). The response rates for PD-1 inhibitors can range from 27% to 57% in advanced cases (Green et al., 2020). However, clinical observations have shown that strong responses to immunotherapy can occasionally occur in other molecular types, highlighting the necessity for more precise biomarkers to identify patients who are likely to benefit from immunotherapy. Given that the srlncRNA signature was closely related to immune infiltration in EC, we speculated that these lncRNAs could be promising targets for immune checkpoint blockade therapy.
To further validate the predictive power of our risk model in forecasting the sensitivity to commonly used chemotherapeutic drugs such as paclitaxel, gemcitabine, and cisplatin, we cultured PDOs for validation. Organoids are innovative three-dimensional, self-organizing cell cultures representing various tissues and can be used to study diverse biological systems. They provide a patient-specific model to investigate known diseases and predict treatment responses (Verstegen et al., 2025). The EC-18 PDO showed resistance to paclitaxel, gemcitabine, and cisplatin, even at high drug concentrations. This finding aligns with clinical observations, as EC patient 18 experienced disease progression quickly after chemotherapy. Therefore, we recommend that clinicians pay close attention to strategies that target the srlincRNAs identified in our model during oncology treatments. Targeting these srlncRNAs in combination with immune checkpoint inhibitors may represent a promising new approach in cancer therapy.
This study provides new insights into predicting prognosis and therapy response in EC based on a signature of srlncRNAs. Our nomogram has the potential to aid clinicians in making informed medical decisions and developing individualized treatment plans. However, our study has some limitations. First, certain factors that could influence prognosis, such as obesity, pathological types, and molecular types, were not included in the nomogram due to a lack of available data in public databases. Second, due to the lack of relevant data in the GEO and other databases, which posed challenges for external validation. We then used four organoid samples for validation. However, more samples are needed for further investigation. Lastly, functional and basic experiments are necessary to better understand the underlying mechanisms of srlncRNAs in EC.
Conclusion
In summary, we identified a novel srlncRNA signature with prognostic predictive value. The srlncRNAs, including AL121906.2, AP002761.4, BX322234.1, LINC00662, LINC00908, VIM-AS1, and ZNF236-DT, are promising prognostic markers and potential therapeutic targets for EC patients.
Data availability statement
The data included in the current study are available in the TCGA-UCEC (https://cancergenome.nih.gov/) and the CellAge database (https://genomics.senescence.info/cells/cellAge.zip). The accession numbers are provided in Supplementary Table S7. The experiment data will be shared at a reasonable request by the corresponding author.
Ethics statement
The studies involving humans were approved by Fujian Cancer Hospital Ethics Committee (K2023-332-01). The studies were conducted in accordance with the local legislation and institutional requirements. The participants provided their written informed consent to participate in this study.
Author contributions
JL: Data curation, Methodology, Funding acquisition, Investigation, Writing – review and editing, Software, Writing – original draft. XL: Data curation, Writing – original draft, Validation. YL: Investigation, Writing – original draft. XJ: Formal Analysis, Writing – original draft, Data curation, Methodology. FJ: Writing – original draft, Visualization, Formal Analysis. AG: Writing – original draft, Investigation. XC: Resources, Writing – original draft, Visualization, Supervision, Validation. XY: Writing – original draft, Investigation. YS: Software, Writing – original draft, Investigation, Funding acquisition, Writing – review and editing, Resources, Visualization, Methodology, Validation, Project administration, Conceptualization, Supervision.
Funding
The authors declare that financial support was received for the research and/or publication of this article. This work was supported by the Clinical Research Center for Precision Treatment of Gynecological Malignancies of Fujian Province, China (Grant number:2022Y2015); The Natural Science Foundation of Fujian Province (Grant number: 2024J011098); and the Joint Funds for the Innovation of Science and Technology, Fujian Province (Grant number 2023Y9404).
Acknowledgements
The authors thank the participants and staff of Fujian Cancer Hospital for their contributions.
Conflict of interest
The authors declare that the research was conducted in the absence of any commercial or financial relationships that could be construed as a potential conflict of interest.
Generative AI statement
The authors declare that no Generative AI was used in the creation of this manuscript.
Any alternative text (alt text) provided alongside figures in this article has been generated by Frontiers with the support of artificial intelligence and reasonable efforts have been made to ensure accuracy, including review by the authors wherever possible. If you identify any issues, please contact us.
Publisher’s note
All claims expressed in this article are solely those of the authors and do not necessarily represent those of their affiliated organizations, or those of the publisher, the editors and the reviewers. Any product that may be evaluated in this article, or claim that may be made by its manufacturer, is not guaranteed or endorsed by the publisher.
Supplementary material
The Supplementary Material for this article can be found online at: https://www.frontiersin.org/articles/10.3389/fgene.2025.1687922/full#supplementary-material
Abbreviations
srlncRNA, Senescence-related lncRNAs; EC, Endometrial cancer; PDOs, Patient-derived tumor organoids; GLOBOCAN, Global Cancer Observatory; TCGA, The Cancer Genome Atlas; GBM, Boosting Machine; RSF, Survival Forest; OS, Overall survival; ROC, Receiver operating characteristic curve; GO, Gene Ontology; KEGG, Kyoto Encyclopedia of Genes and Genomes; TME, Tumor microenvironment; ssGSEA, Single-sample gene set enrichment analysis; IHC, Immunohistochemistry; GDSC, Drug Sensitivity in Cancer; IC50, Half maximal inhibitory concentration; dMMR, Mismatch-repair deficient (dMMR) tumors; AML, Acute myeloid leukemia.
References
Abu-Rustum, N. R., Campos, S. M., Amarnath, S., Arend, R., Barber, E., Bradley, K., et al. (2025). NCCN guidelines® insights: uterine neoplasms, version 3.2025. J. Natl. Compr. Canc Netw. 23, 284–291. doi:10.6004/jnccn.2025.0038
Barczak, W., Carr, S. M., Liu, G., Munro, S., Nicastri, A., Lee, L. N., et al. (2023). Long non-coding RNA-derived peptides are immunogenic and drive a potent anti-tumour response. Nat. Commun. 14, 1078. doi:10.1038/s41467-023-36826-0
Bray, F., Laversanne, M., Sung, H., Ferlay, J., Siegel, R. L., Soerjomataram, I., et al. (2024). Global cancer statistics 2022: GLOBOCAN estimates of incidence and mortality worldwide for 36 cancers in 185 countries. CA Cancer J. Clin. 74, 229–263. doi:10.3322/caac.21834
Cai, X., Li, Y., Zheng, J., Liu, L., Jiao, Z., Lin, J., et al. (2023). Modeling of senescence-related chemoresistance in ovarian cancer using data analysis and patient-derived organoids. Front. Oncol. 13, 1291559. doi:10.3389/fonc.2023.1291559
Chen, H.-A., Ho, Y.-J., Mezzadra, R., Adrover, J. M., Smolkin, R., Zhu, C., et al. (2023). Senescence rewires microenvironment sensing to facilitate Antitumor immunity. Cancer Discov. 13, 432–453. doi:10.1158/2159-8290.CD-22-0528
Chen, L., Lin, J., Wen, Y., Lan, B., Xiong, J., Fu, Y., et al. (2024). A senescence-related lncRNA signature predicts prognosis and reflects immune landscape in HNSCC. Oral Oncol. 149, 106659. doi:10.1016/j.oraloncology.2023.106659
Colucci, M., Sarill, M., Maddalena, M., Valdata, A., Troiani, M., Massarotti, M., et al. (2025). Senescence in cancer. Cancer Cell 43, 1204–1226. doi:10.1016/j.ccell.2025.05.015
Corr, B. R., Erickson, B. K., Barber, E. L., Fisher, C. M., and Slomovitz, B. (2025). Advances in the management of endometrial cancer. BMJ 388, e080978. doi:10.1136/bmj-2024-080978
Crosbie, E. J., Kitson, S. J., McAlpine, J. N., Mukhopadhyay, A., Powell, M. E., and Singh, N. (2022). Endometrial cancer. Lancet 399, 1412–1428. doi:10.1016/S0140-6736(22)00323-3
Deng, Y., Chen, Q., Yang, X., Sun, Y., Zhang, B., Wei, W., et al. (2024). Tumor cell senescence-induced macrophage CD73 expression is a critical metabolic immune checkpoint in the aging tumor microenvironment. Theranostics 14, 1224–1240. doi:10.7150/thno.91119
Feng, Z.-H., Liang, Y.-P., Cen, J.-J., Yao, H.-H., Lin, H.-S., Li, J.-Y., et al. (2022). m6A-immune-related lncRNA prognostic signature for predicting immune landscape and prognosis of bladder cancer. J. Transl. Med. 20, 492. doi:10.1186/s12967-022-03711-1
Gordhandas, S., Zammarrelli, W. A., Rios-Doria, E. V., Green, A. K., and Makker, V. (2023). Current evidence-based systemic therapy for advanced and recurrent endometrial cancer. J. Natl. Compr. Canc Netw. 21, 217–226. doi:10.6004/jnccn.2022.7254
Green, A. K., Feinberg, J., and Makker, V. (2020). A review of immune checkpoint blockade therapy in endometrial cancer. Am. Soc. Clin. Oncol. Educ. Book 40, 1–7. doi:10.1200/EDBK_280503
Guan, H., Hu, Q., Wan, L., Wang, C., Xue, Y., Feng, N., et al. (2025). LINC00908 inactivates Wnt/β-Catenin signaling pathway to inhibit prostate cancer cell stemness via upregulating GSK3B and FBXW2. Cancer Med. 14, e70887. doi:10.1002/cam4.70887
Han, J.-D. J. (2023). LncRNAs: the missing link to senescence nuclear architecture. Trends Biochem. Sci. 48, 618–628. doi:10.1016/j.tibs.2023.03.007
Han, S.-H., Ko, J. Y., Jung, S., Oh, S., Kim, D. Y., Kang, E., et al. (2024). VIM-AS1, which is regulated by CpG methylation, cooperates with IGF2BP1 to inhibit tumor aggressiveness via EPHA3 degradation in hepatocellular carcinoma. Exp. Mol. Med. 56, 2617–2630. doi:10.1038/s12276-024-01352-6
Hänzelmann, S., Castelo, R., and Guinney, J. (2013). GSVA: gene set variation analysis for microarray and RNA-seq data. BMC Bioinforma. 14, 7. doi:10.1186/1471-2105-14-7
Herranz, N., and Gil, J. (2018). Mechanisms and functions of cellular senescence. J. Clin. Invest 128, 1238–1246. doi:10.1172/JCI95148
Huang, Y., Gong, P., Su, L., and Zhang, M. (2023). Cuproptosis-related lncRNA scoring system to predict the clinical outcome and immune landscape in pancreatic adenocarcinoma. Sci. Rep. 13, 20870. doi:10.1038/s41598-023-47223-4
Huo, X.-L., Wang, S.-F., Yang, Q., Yu, X.-L., Gu, T., Hua, H.-X., et al. (2022). Diagnostic and prognostic value of genomic instability-derived long non-coding RNA signature of endometrial cancer. Taiwan J. Obstet. Gynecol. 61, 96–101. doi:10.1016/j.tjog.2021.11.018
Jamieson, A., and McAlpine, J. N. (2023). Molecular profiling of endometrial cancer from TCGA to clinical practice. J. Natl. Compr. Canc Netw. 21, 210–216. doi:10.6004/jnccn.2022.7096
Ji, H. Z., Chen, L., Ren, M., Li, S., Liu, T. Y., Chen, H. J., et al. (2023). CXCL8 promotes endothelial-to-mesenchymal transition of endothelial cells and protects cells from erastin-induced ferroptosis via CXCR2-Mediated activation of the NF-κB signaling pathway. Pharm. (Basel) 2023 (9), 1210. doi:10.3390/ph16091210
Jiang, Y., Chen, J., Ling, J., Zhu, X., Jiang, P., Tang, X., et al. (2021). Construction of a Glycolysis-related long noncoding RNA signature for predicting survival in endometrial cancer. J. Cancer 12, 1431–1444. doi:10.7150/jca.50413
Kanehisa, M., and Goto, S. (2000). KEGG: kyoto encyclopedia of genes and genomes. Nucleic Acids Res. 28, 27–30. doi:10.1093/nar/28.1.27
Kowald, A., Passos, J. F., and Kirkwood, T. B. L. (2020). On the evolution of cellular senescence. Aging Cell 19, e13270. doi:10.1111/acel.13270
Lin, K., Zhou, Y., Lin, Y., Feng, Y., Chen, Y., and Cai, L. (2023). Senescence-related lncRNA signature predicts prognosis, response to immunotherapy and chemotherapy in skin cutaneous melanoma. Biomolecules 13, 661. doi:10.3390/biom13040661
Lin, X., Zheng, J., Cai, X., Liu, L., Jiang, S., Liu, Q., et al. (2024). Glycometabolism and lipid metabolism related genes predict the prognosis of endometrial carcinoma and their effects on tumor cells. BMC Cancer 24, 571. doi:10.1186/s12885-024-12327-1
Lin, J., Cai, X., Liu, L., Li, A., Huang, H., Fu, Y., et al. (2025). A novel platinum-resistance-related gene signature in ovarian cancer: identification and patient-derived organoids verification. Curr. Cancer Drug Targets 26, 64–84. doi:10.2174/0115680096326784241009113454
Liu, Q., Bao, H., Zhang, S., Song, T., Li, C., Sun, G., et al. (2023). Identification of a cellular senescence-related-lncRNA (SRlncRNA) signature to predict the overall survival of glioma patients and the tumor immune microenvironment. Front. Genet. 14, 1096792. doi:10.3389/fgene.2023.1096792
Luo, M., Lei, R., Zhao, Q., Shen, Y., He, Z., and Xu, J. (2024). LINC00662 promotes melanoma progression by competitively binding miR-107 and activating the β-catenin signaling pathway. Int. J. Med. Sci. 21, 265–276. doi:10.7150/ijms.84072
McHugh, D., Durán, I., and Gil, J. (2025). Senescence as a therapeutic target in cancer and age-related diseases. Nat. Rev. Drug Discov. 24, 57–71. doi:10.1038/s41573-024-01074-4
Newman, A. M., Steen, C. B., Liu, C. L., Gentles, A. J., Chaudhuri, A. A., Scherer, F., et al. (2019). Determining cell type abundance and expression from bulk tissues with digital cytometry. Nat. Biotechnol. 37, 773–782. doi:10.1038/s41587-019-0114-2
Nucleic Acids Res 43 (2015). Gene ontology consortium: going forward. Gene Ontol. Consort. going Forw. 43, D1049–D1056. doi:10.1093/nar/gku1179
Pérez-Moreno, P., Riquelme, I., Bizama, C., Vergara-Gómez, L., Tapia, J. C., Brebi, P., et al. (2024). LINC00662 promotes aggressive traits by modulating OCT4 expression through miR-335-5p in gallbladder cancer cells. Int. J. Mol. Sci. 25, 6740. doi:10.3390/ijms25126740
Rossi, M., and Gorospe, M. (2020). Noncoding RNAs controlling telomere homeostasis in senescence and aging. Trends Mol. Med. 26, 422–433. doi:10.1016/j.molmed.2020.01.010
Santos-Sousa, D. C., Da Rosa, S., and Filippi-Chiela, E. (2025). Molecular signatures of cellular senescence in cancer: a critical review of prognostic implications and therapeutic opportunities. Mech. Ageing Dev. 225, 112052. doi:10.1016/j.mad.2025.112052
Schmitt, C. A., Wang, B., and Demaria, M. (2022). Senescence and cancer - role and therapeutic opportunities. Nat. Rev. Clin. Oncol. 19, 619–636. doi:10.1038/s41571-022-00668-4
Tanaka, K., Kobayashi, Y., Sugiyama, J., Yamazaki, T., Dozono, K., Watanabe, M., et al. (2017). Histologic grade and peritoneal cytology as prognostic factors in type 1 endometrial cancer. Int. J. Clin. Oncol. 22, 533–540. doi:10.1007/s10147-016-1079-5
Verstegen, M. M. A., Coppes, R. P., Beghin, A., Coppi, P. de, Gerli, M. F. M., Graeff, N. de, et al. (2025). Clinical applications of human organoids. Nat. Med. 31, 409–421. doi:10.1038/s41591-024-03489-3
Wang, N., Zhang, J., Fan, X., Ma, J., He, J., Kang, S., et al. (2021). Identification of risk factors for the prognosis of Chinese patients with endometrial carcinoma. Med. Baltim. 100, e27305. doi:10.1097/MD.0000000000027305
Xiong, Y., Zu, X., Wang, L., Li, Y., Chen, M., He, W., et al. (2021). The VIM-AS1/miR-655/ZEB1 axis modulates bladder cancer cell metastasis by regulating epithelial-mesenchymal transition. Cancer Cell Int. 21, 233. doi:10.1186/s12935-021-01841-y
Yoshihara, K., Shahmoradgoli, M., Martínez, E., Vegesna, R., Kim, H., Torres-Garcia, W., et al. (2013). Inferring tumour purity and stromal and immune cell admixture from expression data. Nat. Commun. 4, 2612. doi:10.1038/ncomms3612
Zhang, Y., Chen, Y., Chen, C., Guo, H., Zhou, C., Wang, H., et al. (2023). PITX1 suppresses osteosarcoma metastasis through exosomal LINC00662-mediated M2 macrophage polarization. Clin. Exp. Metastasis 40, 79–93. doi:10.1007/s10585-022-10192-5
Zhang, C., Zhang, Y., and Wang, Y. (2024). Downregulated lncRNA LINC00908 correlates with a poor prognosis and increasing malignancy of gastric cancer. Pol. J. Pathol. 75, 157–165. doi:10.5114/pjp.2024.141283
Zhao, Y., Cheng, H.-E., Wang, J., Zang, Y., Liu, Z., Sun, Y., et al. (2024). Disulfidptosis-related lncRNA signature to assess the immune microenvironment and drug sensitivity in acute myeloid leukemia. Sci. Rep. 14, 32015. doi:10.1038/s41598-024-83560-8
Keywords: endometrial cancer, cell senescence, signature, immunotherapy, prognosis, TCGA, patient-derived tumor organoids
Citation: Lin J, Lei X, Li Y, Jiang X, Jiang F, Guo A, Cai X, Ye X and Sun Y (2025) Development of a senescence-related lncRNA signature in endometrial cancer based on multiple machine learning models. Front. Genet. 16:1687922. doi: 10.3389/fgene.2025.1687922
Received: 18 August 2025; Accepted: 11 November 2025;
Published: 27 November 2025.
Edited by:
Domenico Mallardo, G. Pascale National Cancer Institute Foundation (IRCCS), ItalyReviewed by:
Hongrong Wu, First Affiliated Hospital of Shantou University Medical College, ChinaYanna Zhang, University of Electronic Science and Technology of China, China
Copyright © 2025 Lin, Lei, Li, Jiang, Jiang, Guo, Cai, Ye and Sun. This is an open-access article distributed under the terms of the Creative Commons Attribution License (CC BY). The use, distribution or reproduction in other forums is permitted, provided the original author(s) and the copyright owner(s) are credited and that the original publication in this journal is cited, in accordance with accepted academic practice. No use, distribution or reproduction is permitted which does not comply with these terms.
*Correspondence: Yang Sun, c3VueWFuZ0Bmam11LmVkdS5jbg==
†ORCID: Yang Sun, orcid.org/0000-0002-1587-9797
‡These authors have contributed equally to this work