 Phumudzo C. Tharaga
 Weldemichael A. Tesfuhuney
 Gesine M. Coetzer1
- 1Department of Soil Crop and Climate, University of the Free State, Bloemfontein, South Africa
- 2School of Agriculture, University of Kwa Zulu Natal, Pietermaritzburg, South Africa
It is imperative to possess a comprehensive understanding of the water consumption patterns of sweet cherry trees under rainfed conditions. This study investigates the water use of sweet cherry using the heat pulse velocity sap flow method. Tree response to drying soil conditions over two consecutive measurement periods (September 2017 to December 2018) in the eastern Free State, South Africa, is also evaluated. During the post-harvest period (December), there was a continuous increase in daily water consumption by trees, in conjunction with an increase in canopy cover, even though the crop load was reduced. Measured sap flow was positively correlated to net radiation, air temperature, and water vapour pressure deficit. The transpiration rates ranged from 1.2 to 3.5 L d-1 during the flowering stage (day of year, DOY, 244 – 270) and showed an increasing trend as the days progressed. During the ripening stage (DOY 271 – 292), transpiration rates decreased from 4.5 to 1.1 L d-1 over the 2018 season. This decreasing trend from the previous growth stage was due to soil drying and scorching weather conditions that led to trees experiencing water stress. Sap flow measurements, however, showed typical characteristics of the diurnal trend during selected days during varying weather conditions. The fraction of transpirable soil water (FTSW) threshold varied for different fruit growth stages and approached 1.0 for different stress levels. FTSW exceeded 0.4 when sweet cherry trees utilised stored soil water, while the transpiration rates declined during prolonged hot days. Moreover, the stress coefficient factor ranged between 0.45 – 0.65 for different growth stages. The daily soil water content varied, and soil evaporation was expected to increase during hot and dry days. In the early stage of a dry spell, soil water content did not directly affect the transpiration rate. Sweet cherry trees are susceptible to soil water deficit at different stages of fruit development. More research is required to understand transpiration as an irrigation management and planning indicator.
Introduction
Accurate estimates of mature tree water use at different phenological growth stages are essential for researchers, irrigation managers, and growers. There are several methods which have been developed to measure Sap flow or Transpiration in trees, such as the Heat ratio method, Compensation heat Pulse and Thermal dissipation method. The heat pulse velocity (HPV) method relies on thermal conductance and convection theory, suggesting that direct estimation of transpiration from sensor measurements is possible without calibration (Green et al., 2003). Fuchs et al. (2017) reported that sap flow measurements are crucial for determining orchard water use. Green et al. (2003) indicated that using a heat-pulse tracer for sap flow velocity is commonly used for determining individual tree transpiration rates. The heat ratio method is based on the temperature difference between two measurement points within the xylem. Several aspects need to be considered when using the heat pulse velocity method, such as the amount of heat applied to measure accurately (Fernández, 2017). The amount of applied heat should also not damage the plant’s stem.
Water consumption limitation is defined by the stress coefficient Ks (when Ks=1, there is no stress, when Ks > 1, no soil water deficits exist, and when Ks< 1, water stress exists) (Allen et al., 1998; Allen, 2008). The soil water content (SWC) determines a dimensionless Ks coefficient. Measuring sap flow to understand the relationship between a plant and its environment is possible. Measuring transpiration rates using sap flow methods and the scaling up from individual tree to stand level (Burgess et al., 2001; Burgess and Dawson, 2008) has been used for various trees in different ecosystems. Water availability in plants regulates the transpiration rate and impacts the conductance of the stomata. Researchers have used various methods to measure plant water status, while crop physiologists used leaf stomatal conductance to measure water status indirectly (Poças et al., 2014).
Heat pulse sap flow can be used and determined using a continuous measurement system for data collection, enabling researchers to follow the time course of transpiration. The most reliable methods for measuring sap flow are the heat pulse method and heat ratio techniques widely adopted worldwide (Green et al., 2003; Zuñiga et al., 2014). Various methods have been used for measuring the transpiration rate of different species, including apples (Braun et al., 2000), citrus (Ortuño et al., 2006), cherries (Juhász et al., 2013b), kiwis (Edwards and Warwick, 1984), olives (Fernández et al., 2001) and pears (Fernández et al., 2007). The HPV method has been used in several studies in South Africa on various species such as apples (Dzikiti et al., 2017; Mobe et al., 2020), citrus (Dzikiti et al., 2010), pine plantations (Mapeto et al., 2018), indigenous trees (Tfwala et al., 2018). In general, the water use of plants depends on the phenological development of the tree and physical statures such as canopy size and leaf area (Ouyang et al., 2013). The depletion of available soil water can also influence the water use by plants, which leads to water stress. The water available for growth is the fraction of the transpirable soil water (FTSW) (Sinclair et al., 2005). FTSW is defined as the ratio between available soil water (ASW) at a given date and total transpirable soil water (TTSW) relating to a given crop grown in a given soil (Ramos and Martinez-Casasnovas, 2014). Sweet cherries are sensitive to rapid soil moisture depletion and tend to initiate the stomata closure at a high SWC, contributing to conserving soil moisture (Molina et al., 2019).
In terms of water use, tree-specific characteristics and the timing of the highest water consumption are important considerations for achieving high annual yields. The timing of irrigation is also an important consideration so that the water stress of trees can be avoided. This would require investigating the impact of low SWC on trees and the evaporative demand rate of trees. The coefficient Ks is a dimensionless transpiration reduction factor that depends on available soil water content. Soil texture plays a role in estimating Ks by retaining evapotranspiration and soil moisture content. Hence, the deficit in ETc due to available soil water is numerically expressed by Ks values (Allen et al., 1998). Under high VPD and soil drying, the stomatal conductance becomes more sensitive, thus improving soil water conservation and transpiration. (Pérez-Jiménez et al., 2017). This study aimed to determine sweet cherry water use (transpiration) under rainfed conditions in eastern Free State, South Africa, by measuring sap flow dynamics using the HPV method and evaluating tree response to soil water stress conditions under rainfed conditions.
Materials and methods
Study site
The study to determine the transpiration rate was carried out on IONIA sweet cherry farm (28°47’32.1”S+28°01’14.4” E, 1628 m asl) 15 km from Ficksburg, in the eastern Free State province, South Africa. The area falls within the warm temperate climate region (Cfb) according to the Köppen climate classification (Conradie, 2012). Ficksburg is in a summer rainfall area with dry and cold winters and night temperatures below 0°C. During May, June and July, an average of 1600 chill units (calculated from the daily positive Utah chill units’ model) accumulate or at least 900 h of air temperatures below 7°C are experienced. The daily air temperature ranges between 22°C and a minimum of 7°C, and the average air temperature is 14°C. The sunshine time per day is about 8.5 h, while the average annual rainfall is 756 mm per year, with 80% during summer (November to March).
Meteorological measurements
Meteorological data were from an automatic weather station (AWS) installed in the open space near the experimental orchard (Figure 1A). The AWS comprised a CS215-L-Digital Air Temperature and Relative Humidity Sensors (Campbell Scientific Inc., Logan, Utah, USA); the Rain-O-Matic Rain Gauge (PRONAMIC, Rindumgaards, Denmark); SP Lite2 Pyranometer (Kipp and Zonen, Delft, Netherlands); DS-2 (2-D) Sonic Anemometer (Pacific Data Systems Australia Pty Ltd, Brisbane, Queensland, Australia), for wind speed (m s-1) and (compass) wind direction. The datalogger used for programming and data storage was the DSG S300E (Dacom Farm Intelligence, Emmen, Netherlands).
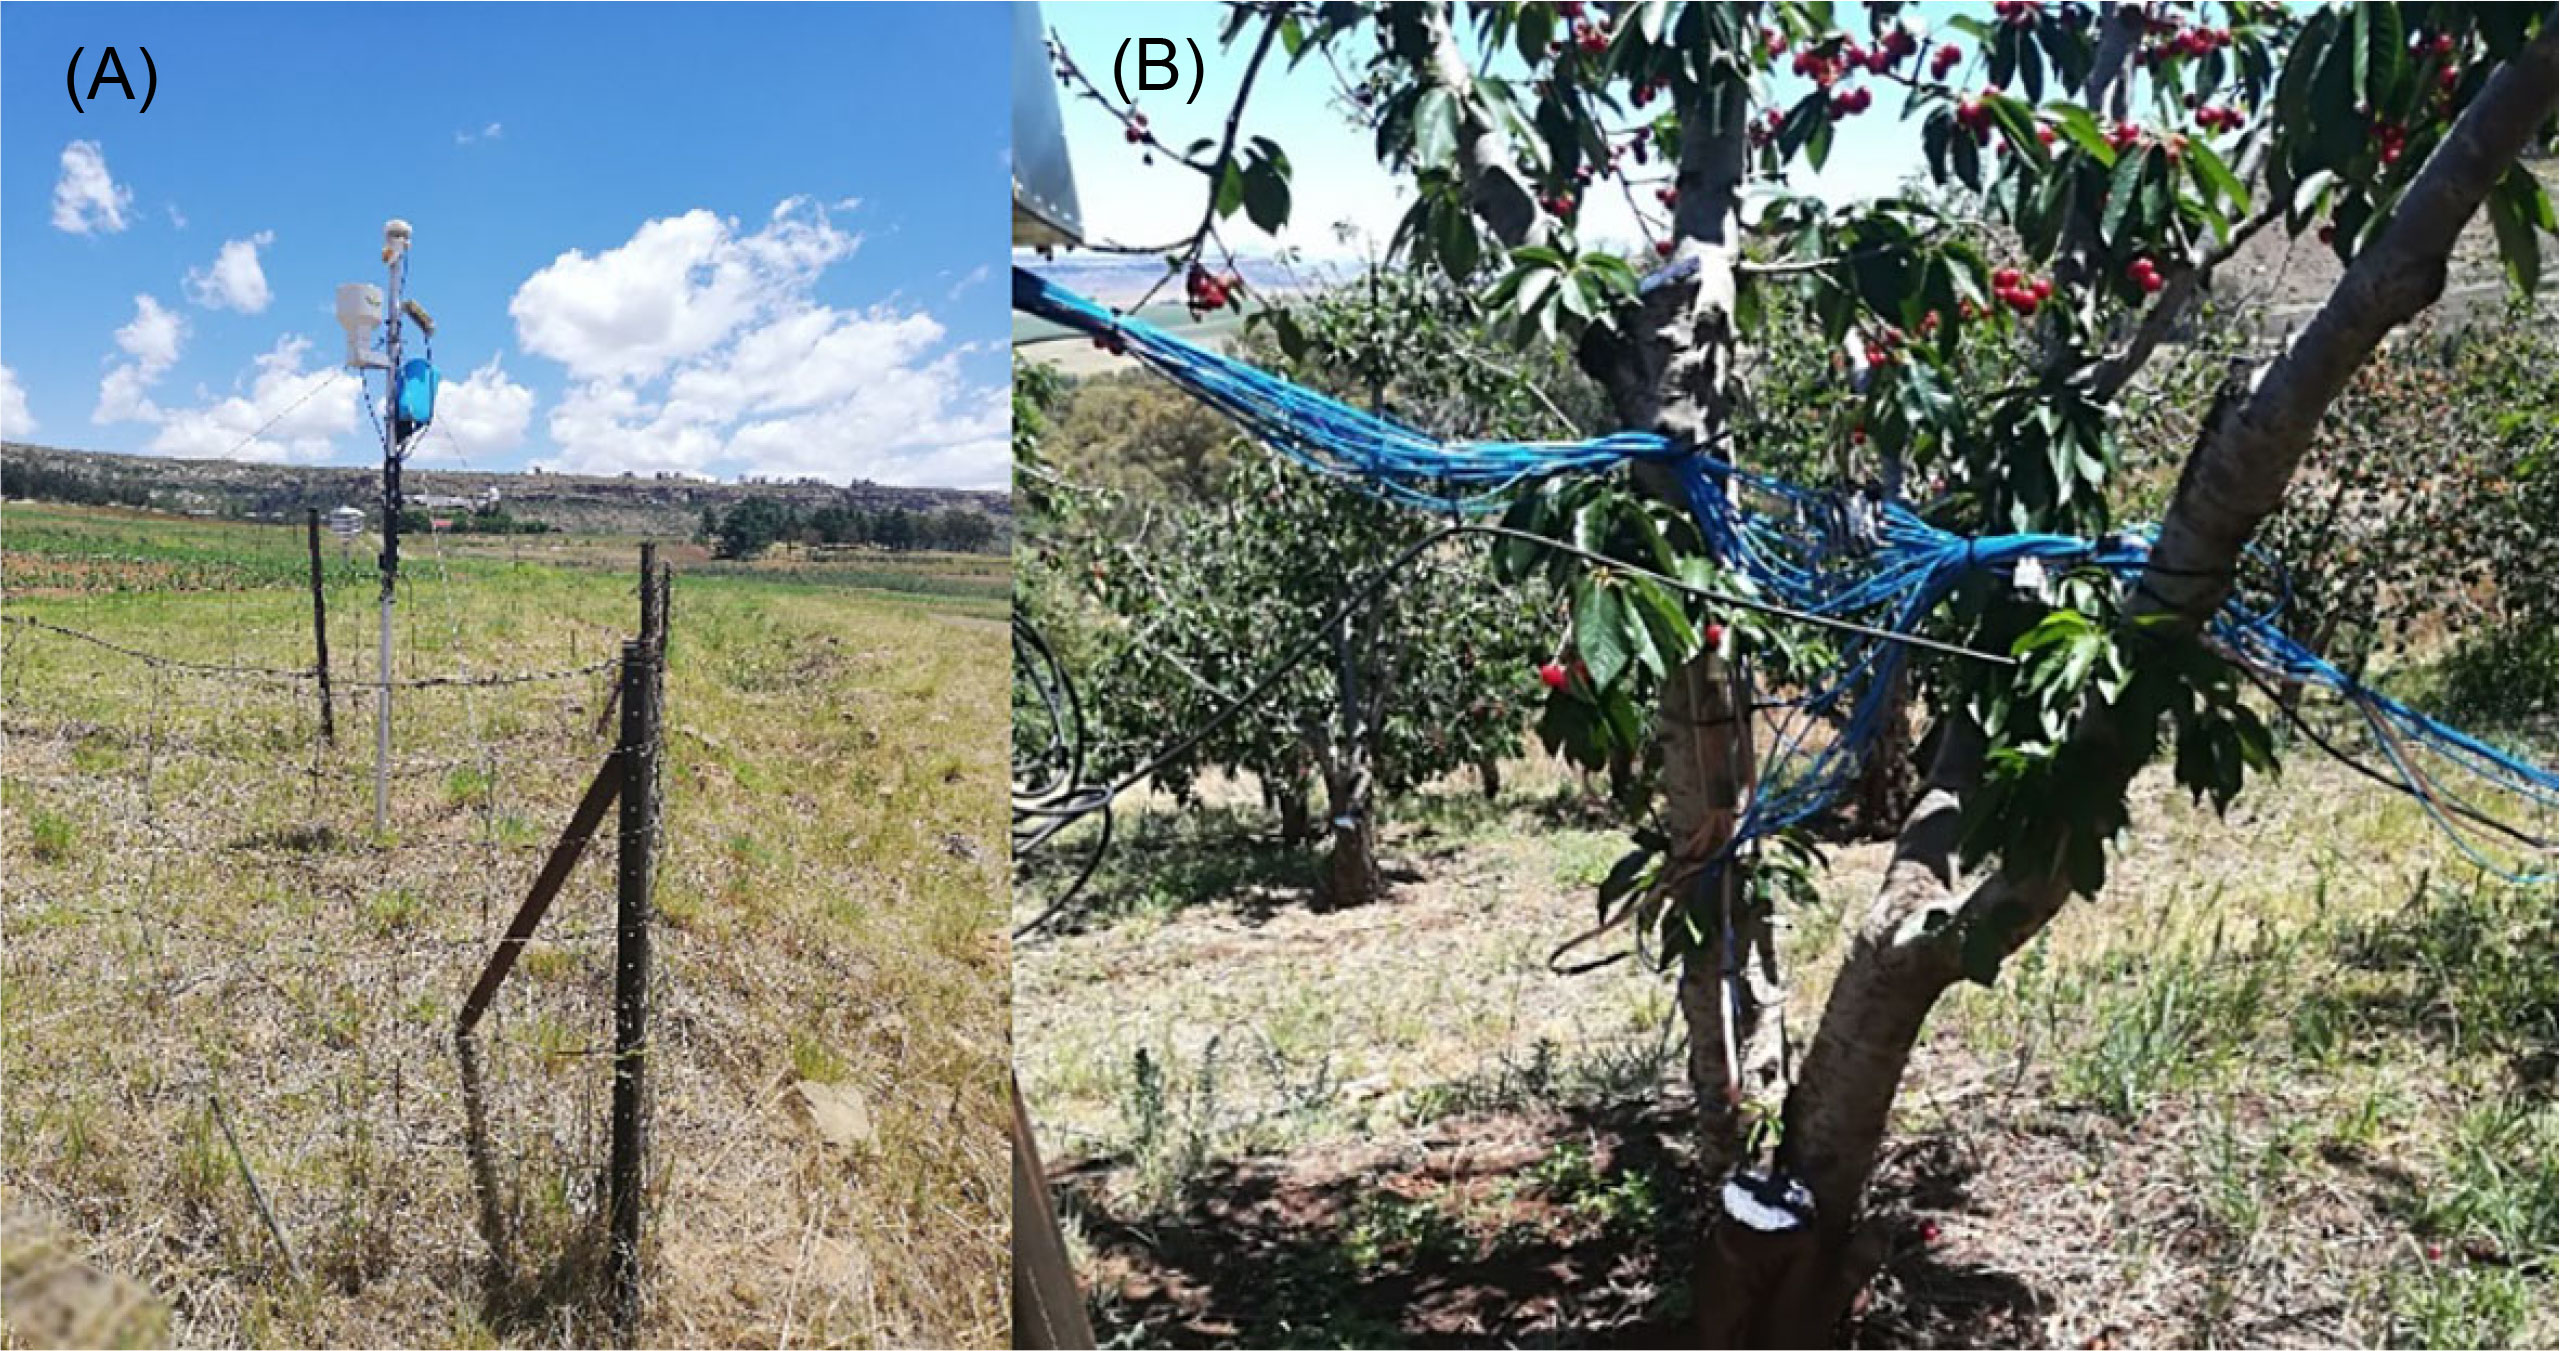
Figure 1 The AWS installed in the open space near the orchard (A) and an HPV system installed on a sweet cherry tree at the study orchard (B).
Soil water content measurements
Hourly soil water content (SWC) was measured using the Campbell CS616 soil water content reflectometer (Campbell Scientific Inc., Logan, Utah, USA), placed horizontally at 300- and 400-mm depths. The soil water content reflectometers were placed on the root zone and another between the trees at the equidistant 1.5 m. Two Sensors were installed for each location and for each depth.
Sap-flow measurements
The HPV method is one of the most-used methods for measuring transpiration in woody plants and has been widely used in South Africa (Dye et al., 1996; Jarmain et al., 2009; Dzikiti et al., 2010; Gush, 2011; Mapeto et al., 2018). The HPV method was selected based on its ability to measure low sap flow rates, often characteristic of plants growing under semi-arid conditions typically experienced in South Africa’s temperate climate areas. This study used the heat ratio method (HRM) of the HPV technique (Burgess et al., 2001) to measure tree transpiration rates. Calibrating the HPV method for the trees used is deemed necessary because of the sensitivity of outputs to stem wounding that occurs when inserting the sensors used. The HPV method was calibrated using the cut stem experiment (Steppe et al., 2010; Steppe et al., 2015). Thus, the selected trees were instrumented with the HPV technique to measure the transpiration rate (Figure 1B). To monitor and store HPV temperatures, Campbell CR1000 loggers, AM16/32B multiplexers, and relay control modules had to be used. Batteries for power and a strongbox were used for power storage. This study used three sweet cherry trees in the same orchard to measure the transpiration rate, corresponding to the number of HPV sensors available. The selection of the trees for the transpiration measurements was conducted by survey of stem diameter differences of approximately 80 trees along the row’s length. The three selected trees denoted as Tree 1 (T1), Tree 2 (T2), and Tree 3 (T3), which were all in row four from the orchard, represented the small, medium, and large stem-sized classes respectively (Table 1).
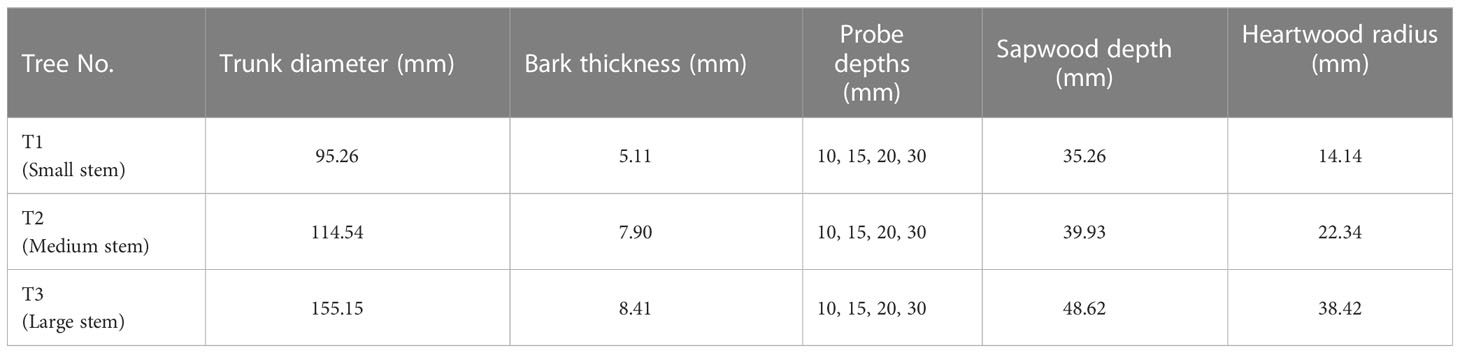
Table 1 Details of the sweet cherry trees (Bing Cultivar) selected for HPV sap flow measurements represent Tree 1 (T1), Tree 2 (T2) and Tree 3 (T3).
The HPV measurements were from the 25th of August 2017 to the 11th of December 2018. Sap flow sensors were installed on the three representative stems selected, about 100 – 150 mm above the graft union away from the disturbed xylem. The HPV system (Aquamet, Pietermaritzburg, KZN, RSA) uses type-T thermocouple pairs inserted and heater probes inserted to different depths within the xylem sapwood to determine radial variations in sap flow. Probes were inserted horizontally into trees with single stems at heights of 0.5 and 1.4 m above ground and below branches.
The wounding depth was measured around the inserted thermocouples (Marshall, 1958). Due to the destructive sampling required, the sapwood measurements were usually collected at the end of the experiment. Wood cores of trees used for HPV measurement were taken to confirm bark thickness, sapwood depth, sapwood moisture content and wood density at the end of the 2018 measurement period after the sensors were removed.
Data analysis
After the collection of the sap flow data, it was analysed based on the steps which followed the methods from different studies (Burgess et al., 2001; Fernández et al., 2007; Burgess and Dawson, 2008; Girardi et al., 2010; Van den Bilcke et al., 2013; Burgess et al., 2014; Steppe et al., 2015; Burgess, 2017; Ntshidi et al., 2018).
Sap velocity calculations
Sapwood moisture content as described by Marshall (1958), was used for calculating heat pulse velocities (Vh) (cm s-1); the calculation from Equation 1 is based on the Marshall (1958) idealise ‘d’ theory which assumes that the HPV probes do not affect the measured heat flow. Thermal diffusivity (k) is allocated at a minimal rate of 2.5 x10⁻³ cm2 s–1 (Marshall, 1958), and this value is used once sapwood properties are obtained:
where Vh (cm S-1) is the heat pulse velocity, k is the thermal diffusivity, x is the distance (cm) between probes, and v1 and v2 are temperature differences at equidistant points downstream and upstream, respectively. The probe distance from the heater used with the heat ratio method was 0.6 cm.
Wound corrections
During long-term measurements, the tree stem wood is wounded due to probe insertion. Therefore, wound corrections to the raw heat pulse velocity measurements are necessary for the probe-induced wounding effects. The deadwood surrounding the thermocouples was accounted for using wound correction coefficients developed by Swanson and Whitfield (1981) (cited by Green, 1998; Gush, 2008 and Steppe et al., 2010). Burgess et al. (2001) developed a new numerical model to supply appropriate wound correction coefficients. To correct heat pulse velocity measured with the HRM, three coefficients, b, c and d (Table 2), are used in Equation 2:
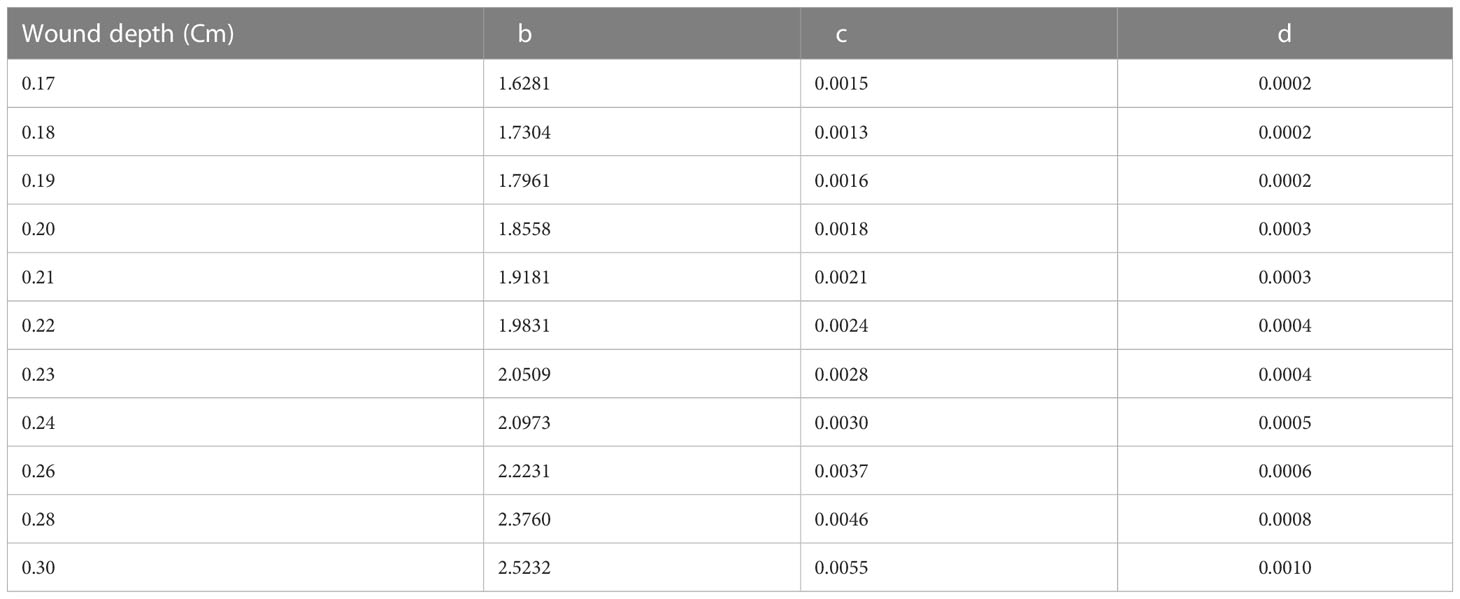
Table 2 Wound correction coefficients for Equation 3 with probe spacing of 0.5 cm (Burgess et al., 2001).
Where Vc (m s-1) is the corrected heat-pulse velocity, and Vh is the raw heat-pulse velocity obtained from Equation 1.
Converting heat pulse velocity to sap flow
After correcting the measured heat-pulse velocity to the corrected value Vc, it needs to be converted to the actual sap flow. In a conducting sapwood cross-section, the velocity of sap (Vs) and the cross-sectional area of the sapwood are readily derived as volumetric flow. The under-bark radius is used to calculate the cross-sectional area of the wood (Burgess et al., 2001). Heartwood areas are typically discounted due to their dark colour. Since sap velocity can be estimated at several intervals, the sapwood area can be divided into concentric annuli defined by the midpoint between measurements. Point estimates of sap velocity in an annulus are weighted according to the amount of conducting sapwood they sample.
Estimating fraction transpirable soil water (FTSW)
Sinclair et al. (2005), described the method for determining a fraction of transpirable soil water (FTSW) as the ratio of available soil water content (ASW) to total transpirable soil water (TTSW). Only downhole soil moisture sensors have been developed because FTSW is highly sensitive to changes in soil moisture content in the rooting domain. ASW is always calculated based on the difference between the soil water content for that day and the location-specific lower limit, which is calculated based on the equation from a study conducted by Lacape et al. (1998):
Where SWCfc is the soil water content at field capacity, SWCmin is the minimum, and SWCd is the actual soil water content. Soil water content at a field capacity (SWCfc), as well as the lower limit (SWCmin), was directly obtained by examining the temporal dynamics of SWC along with the soil profile, following the assumptions of (Polak and Wallach, 2001). Immediately after a rainfall event of more than 10 mm, a sharp decrease in SWC occurs, mainly due to the free drainage in which the root water uptake can be neglected. After that, the reductions in SWC are due to the combination of free drainage and root water uptake. This takes place until a period in which free drainage ceases and SWC reaches its minimum (SWCmin). Below this value, the roots cannot extract more water from the soil.
The concentration of transpirable soil water (FTSW) and the normalised transpiration ratio (NTR) were calculated as soil water stress indicators. The variable required for an accurate calculation of the FTSW is the determination of total transpirable soil water (TTSW) (Lacape et al., 1998). The TTSW was calculated as the soil water content between the upper and lower limit from the soil surface to 300 to 400 mm rooting depth. Field capacity for determining the upper limit of TTSW was measured two days after heavy rainfall (an accumulated amount of at least 25mm). The FTSW was determined in September – December 2017 and 2018, respectively, by considering the flowering, fruit development and ripening stages.
The FTSW, as a soil water stress indicator and the NTR, was calculated from the SWC data and the weather data of the study site. First, the transpiration ratio (TR) was calculated by dividing each sap flow value by the mean value of the sap flow rate. An additional normalisation, denoted by NTR, was employed to correct for variations in individual tree sizes by dividing TR values by the TR obtained before water stress occurred. Therefore, NTR values were ≤ 1.0 during the rainy days before the soil water deficit occurred, with NTR then decreasing as the soil water deficit increased. The change of NTR was plotted against the FTSW. Two-segment linear regression lines were applied to fit the data plotted as NTR against FTSW, where the slope and FTSW threshold values were compared for the two seasons at different growth stages. This study used two-segmented linear regression lines for FTSW ≥ 0.40 and FTSW< 0.40.
Estimation of soil water stress
The RAW was calculated as a fraction of available depletion of Total available water (TAW), and the depletion of soil water was determined by the volume of water lost via evapotranspiration (Allen et al., 1998). TAW (mm) and RAW (mm) was calculated using the following Equations 5 and 6 respectively:
where (mm) is the soil water content at field capacity in the root zone obtained after heavy rain, (mm) is the seasonally minimum of soil water content observed in the orchard, (mm) is the threshold value where water stress occurs, and Zr (m) is the adequate rooting depth, estimated to be about 400 mm based on actual observations in orchards where profile pits were excavated.
If the soil water content is insufficient and cannot meet the evaporation demand of the cherry trees, they are exposed to water stress. Tree water uptake or consumption limitation is defined by the stress coefficient (Ks). The Ks values range between 0 and 1: for Ks > 0, there is no stress, and for Ks ≤ 1, the trees suffer from soil water limitation at different levels. In this study, a simple and widely used method, proposed by Allen et al. (1998), was adopted where Ks is a dimensionless stress coefficient that depends on the available soil water content. Ks was estimated using the FAO-56 method using the weather station data near the experimental farm of the sweet cherry orchard to calculate ETo (Scalisi et al., 2019). The Ks coefficient was estimated as follows:
Thus, where Dr (mm) is defined as the root zone depletion below the threshold value (θ*), at which water stress occurs.
Results and discussion
Weather conditions
The atmospheric conditions for the investigation periods from September until December 2017 and September to December 2018 included daily averages of solar radiation (Rn), wind speed (WS), mean air temperature (Tmean), maximum air temperature (Tmax), minimum air temperature (Tmin), relative humidity (RH), water vapour pressure deficit (VPD), grass reference evapotranspiration (ETo) and total rainfall (RF) for each month (Table 3). The 2017 measurement period was regarded as a recovery season from the drought experienced in the previous three years (2014 to 2016) in the study area. The average daily ETo was lower for the 2017 season than for the 2018 season. The total ETo for 2017 was 1513 mm and for 2018 was 1504 mm. This may be due to the reduced solar radiation in 2018 due to more days with overcast conditions.
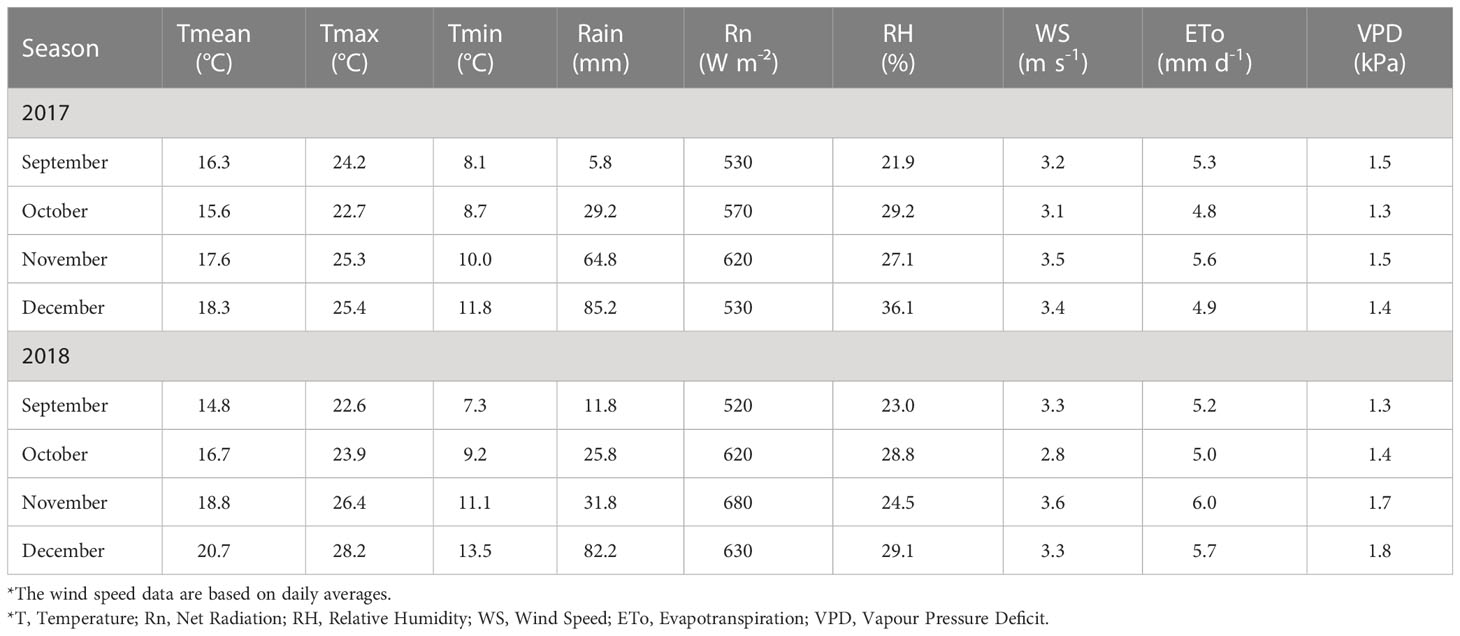
Table 3 Monthly averages (September – December) of weather variables and total rainfall for the experimental site (IONIA farm) during the 2017 and 2018 measurement periods.
The mean air temperature increased as the measurement progressed from September (spring) to December (summer). As the VPD for December 2017 was higher than September and November 2018’s, ETo did not increase the same air temperature (Table 3). Another noticeable difference between 2017 and 2018 was the average wind speed in all the months. The total rainfall for August – December 2017 was higher (185 mm) than for the corresponding period in 2018 (151 mm), with the most rain occurring in December.
Soil water content
Several factors affected soil evaporation, including SWC and environmental conditions. The SWC data from DOY 244 and 270 for 2017 and 2018 are presented in Figures 2A, B. During this time, changes in SWC are more likely to reflect variations in rainfall received in the orchard. The SWC values during the 2017 season showed a constant decline, with rapid changes only experienced during rain events. During DOY 245, 261, 283 and 289 in 2017, the SWC increased after a rainy day. However, the steady increase in SWC was more noticeable from DOY 305 to 332 due to the rainfall events being much more frequent. Occasionally, higher amplitude in SWC oscillations was observed, especially at the end of October, the ripening stage until the post-harvest stage in December (DOY 324 to 332), and the early post-harvest stage in 2018. Both sensors at 300- and 400-mm depths followed the same trend from the flowering to the post-harvest stage (Figures 2A, B). However, the SWC for 400-mm depth showed a high variation during fruit development growth stage between the two seasons, which is a result of high rainfall received the beginning of the stage.
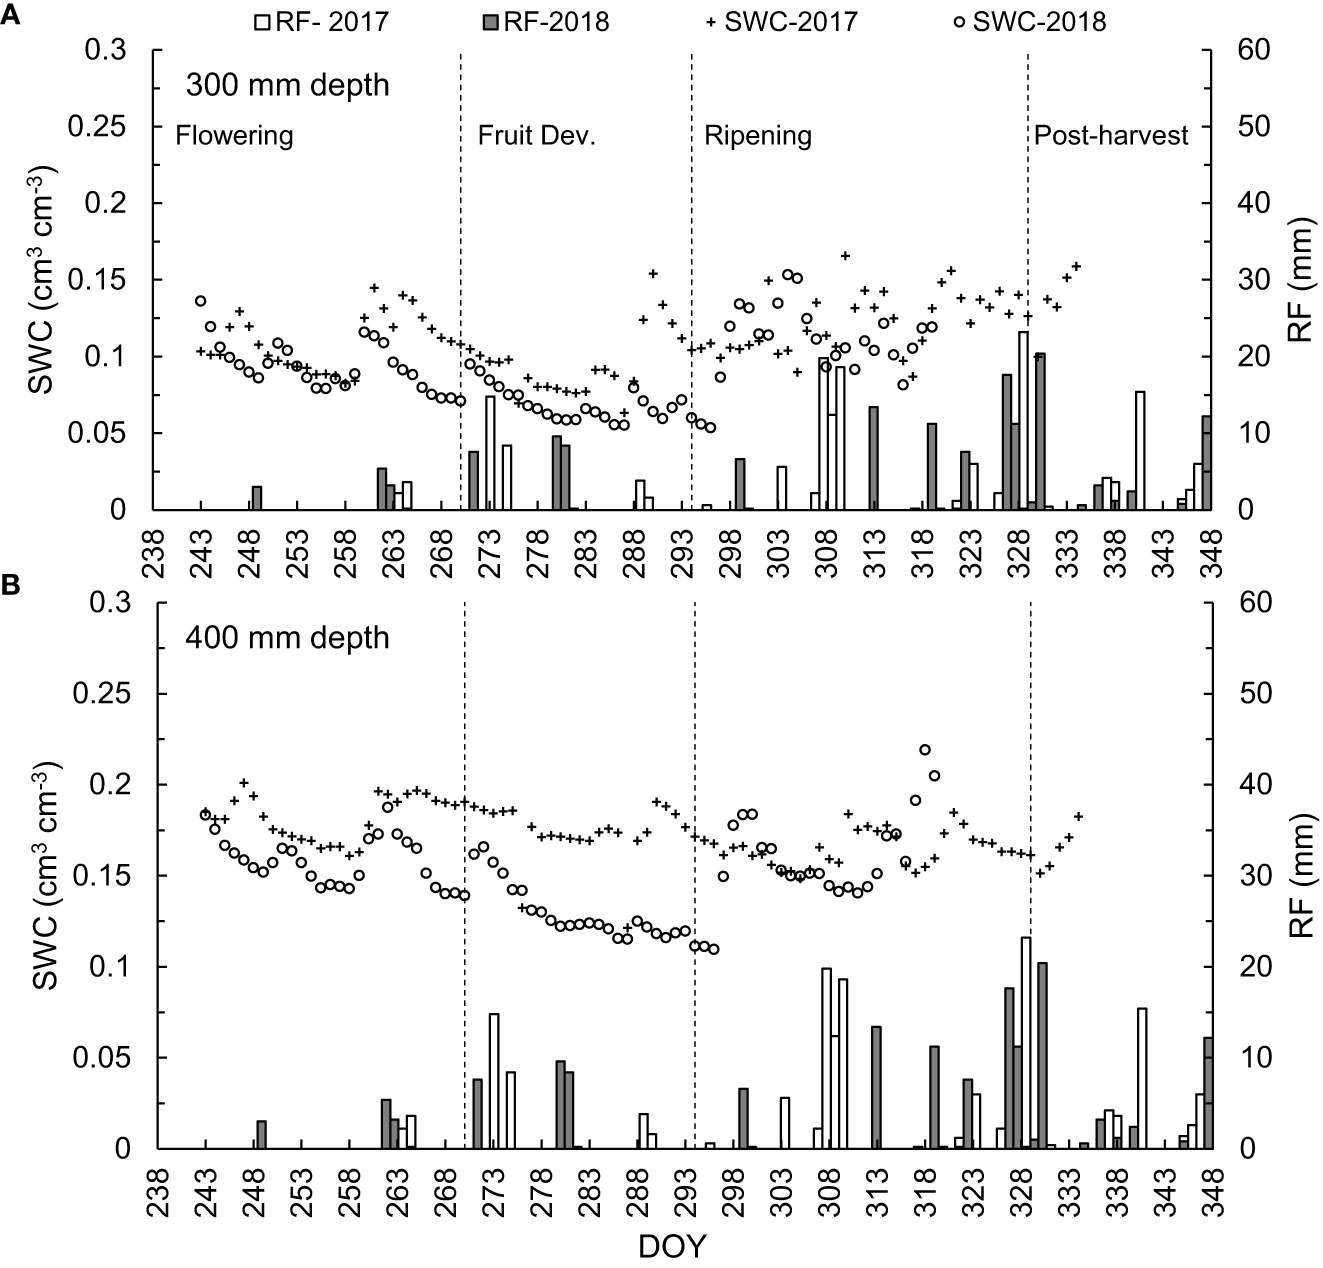
Figure 2 Temporal variation in daily soil water content (SWC cm3 cm3) measured from September to December for 2017 and 2018 during the fruit development stages at (A) 300-mm and (B) 400-mm depths (left-hand y axis) and the daily rainfall RF (mm) (right-hand y axis).
Daily SWC varied from one fruit development stage to another. This was anticipated due to the periodic rainfall events, resulting in a slight soil water deficit at the 300-mm depth during the ripening stage of the sweet cherry trees with a maxim water stress level reached during the 229 DOY. The SWC at the 400-mm depth was lower during the fruit development stage in 2018 than in 2017. When the fruit reached ripening and maturity in 2017 and 2018, the SWC values were nearly identical for the 300- and 400-mm. The SWC in 2017 increased on DOY 250, 261, 273, 289 and 294, which have rainfall of more than 5 mm. The SWC in 2018 remains higher than in 2017 for a more extended period when the consecutive days of summer rainfall are from DOY 299 to 317. During the post-harvest stage (from DOY 328, 2018), SWC increased from 0.15 to 0.20 m3 m3 after more than 20 mm (Figures 2A, B).
Daily tree water uptake
Tree transpiration rate for the three trees used for measurements varied between seasons primarily due to moisture availability, solar radiation and differences in growth. During October and November for both 2017 and 2018, corresponding to the peak of the harvesting season, an increase in water uptake from 5 to 8 L d-1 was observed. During the post-harvest period, from the end of November to December, there was a continuous increase in daily water consumption and canopy cover, even though the fruit was already harvested (data not shown). The sap flow trend obtained in this study is closely related to those obtained from other studies conducted on sweet cherries by (Juhász and Hrotkó, 2014), other stone fruits (Nadezhdina, 1999; Santos, 2018), other deciduous fruit trees such as pear orchards (Yamane et al., 2011; Ouyang et al., 2013), apple orchards investigated in Germany (Backes and Blanke, 2007) and South Africa (Dzikiti et al., 2018), and sweet cherry orchards studied in the temperate zone of Turkey (Yazgan et al., 2006; Candogan and Yazgan, 2010). However, in this study, the water uptake measurement of different tree sizes showed differences between 2017 and 2018. Sap flow from Tree 1 (T1) is inconsistent with Tree 2 (T2) and Tree 3 (T3) and was therefore analysed separately. Due to the data from T1 being unreliable, no further analysis and conclusion can be made as it is not responding to any changes in the growth stages.
Sap flow for Trees 2 and 3 (T2 and T3)
The sap flow for Trees 2 and 3 (T2 and T3) shows an increasing trend from flowering to fruit ripening in 2017 (September – December). The T2 sap flow trend in 2018 was the same as in 2017 during the flowering and fruit development stages. During the fruit ripening stage in 2017, transpiration increased. It continuously increased until the post-harvest stage. In 2018 transpiration rate was constant from the ripening to the post-harvest stage with only a slight increase (Figure 3A). The transpiration rates for T2 ranged from 1 to 3 L d-1 from September to December 2017 (Figure 3A). Water use increased rapidly during the ripening period from DOY 294 to 329. Low sweet cherry tree water use was observed in September and October. Weather conditions played a major role on the daily transpiration rates of sweet cherry trees as it was the same on the study conducted on Apples by Dzikiti et al. (2017). During the 2017 measurement period, T3 transpiration rates gradually increased from flowering, fruit development, ripening and maturity to post-harvest (Figure 3B). During DOY 244 to 270, transpiration rates ranged from 1 to 3 L d-1. It increased from DOY 271 to 292 for T3 during 2017, while there was no significant change during the 2018 season. In 2018, the T3 transpiration rates were slightly lower during DOY 244 to 270 than in 2017 for T3 (Figure 3B).
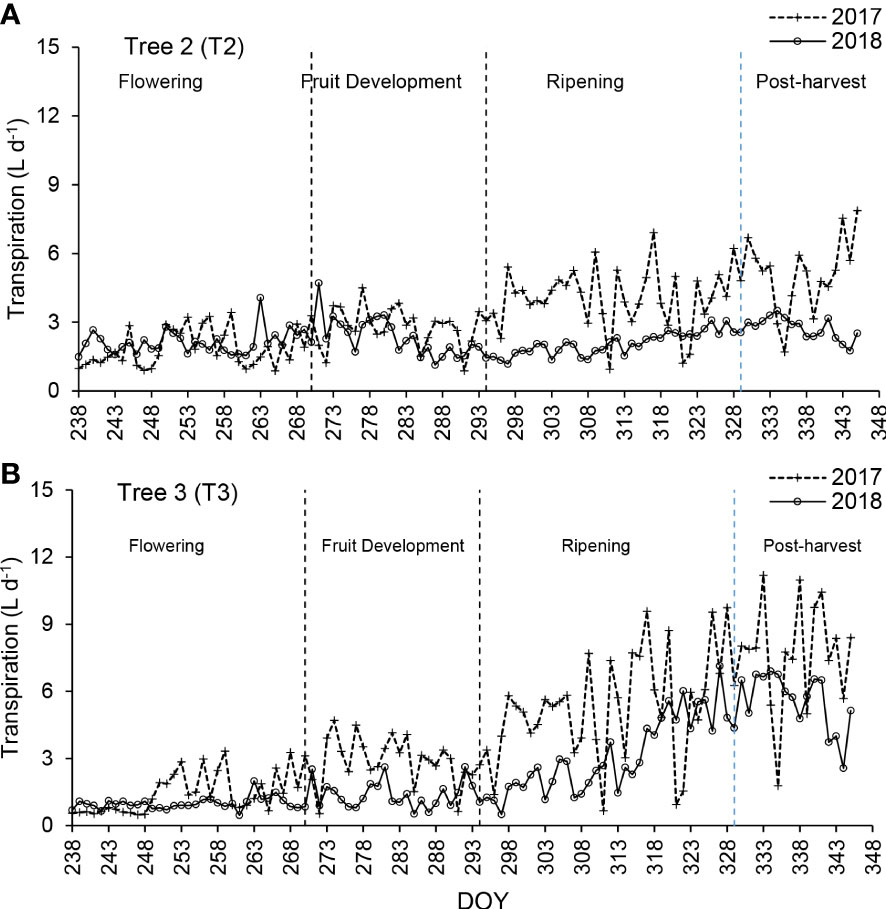
Figure 3 Daily transpiration rates volumes (L d-1) for Tree 2 (A) and Tree 3 (B) from September to December 2017 and 2018 during the fruit development stages.
The accumulated transpiration in litres per day shows an increasing linear trend for T2 in 2017. During DOY 287, 314 and 323, the water use was low due to overcast and heavy rain conditions. The water uptake varied significantly between months (September – December), corresponding to the phenological growth stages of sweet cherry trees. The orchard tends to experience water stress occasionally due to rainfall distribution which varies in frequency. The most essential sweet cherry tree water uses during the reproductive period for both 2017 and 2018 was in November and December, amounting to an average of 5.91 L d-1 and 7.60 L d-1, respectively (Table 4).
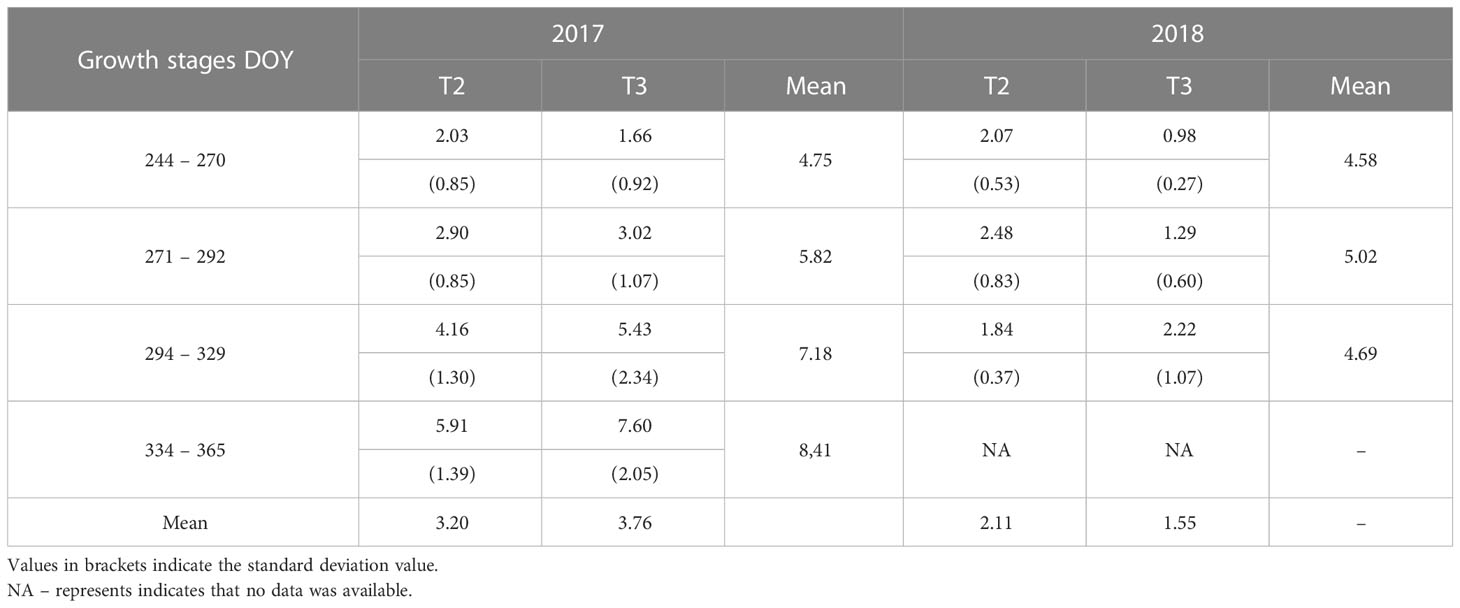
Table 4 Transpiration rates (L d-1) for Trees 2 and 3 (T2 and T3) for the fruit development and ripening stages (September – December) of the sweet cherry trees for 2017 and 2018.
Transpiration rates of T3 showed a gradual increase for both the 2017 and 2018 measurement periods (Figure 3B). Transpiration rates increased from the flowering stage to the post-harvest stage (Figure 3B). Transpiration rates ranged from 1.2 to 3.5 L d-1 between DOY 244 to 270, which indicates an increasing trend from one day to another. During DOY 271 to 292, transpiration rates ranged from 4.5 to 1.1 L d-1, with a declining trend from the previous growth stage, and this may be due to low soil moisture during hot conditions leading to trees experiencing water stress. The transpiration rates recovered and increased following the rain received during DOY 303 to 321 in the 2017 season. Both the 2017 and 2018 measurement periods showed an increasing trend in the transpiration rate. The transpiration rate increased from 3 L d-1 during the fruit development stage to 9 L d-1 during the ripening stage for T1 (DOY 294 to 329) (Figure 3B). During the 2017 and 2018 seasons, the average sap flow rates varied for the different fruit growth stages (Table 4). This variation indicates that a lack of rainfall at the beginning of the season significantly impacts the transpiration rate. The transition from one fruit development stage to another and the variation in weather conditions lead to changes in the water uptake of the trees.
Relationship between tree transpiration and the environment
The SWC measurements for the 300- and 400-mm depths were weakly correlated to transpiration rate (Table 5). This may be due to low transpiration rates during rainy and cloudy days, weakening the relationship. For the 2017 season (Table 5), a positive correlation was noted between the weather variables and the transpiration rates (R2 values ranging from 0.17 to 0.40). However, for the 2018 season, the main weather variables such as air temperature (Tair), solar radiation (Rs) and the water vapour pressure deficit (VPD) showed a significant positive correlation with transpiration rates for Tree 2 and Tree 3 with R2 values of 0.60 and 0.66 (Tair), 0.61 and 0.64 (Rs), and 0.55 and 0.59 (VPD), respectively (Table 5). On the other hand, a negative correlation was observed between the relative humidity (RH) and transpiration rate for both seasons as the VPD decreased under high humid conditions. The transpiration rates between T2 and T3 revealed a positive relationship with R2 values of 0.35 and 0.66 for the 2017 and 2018 measurement periods. In this study, weather variables effect on transpiration agreed with other studies - for instance, Juhász et al. (2013b1) and Doronila and Forster (2015). This is expected since VPD and solar radiation are the major driving forces for the transpiration rate.
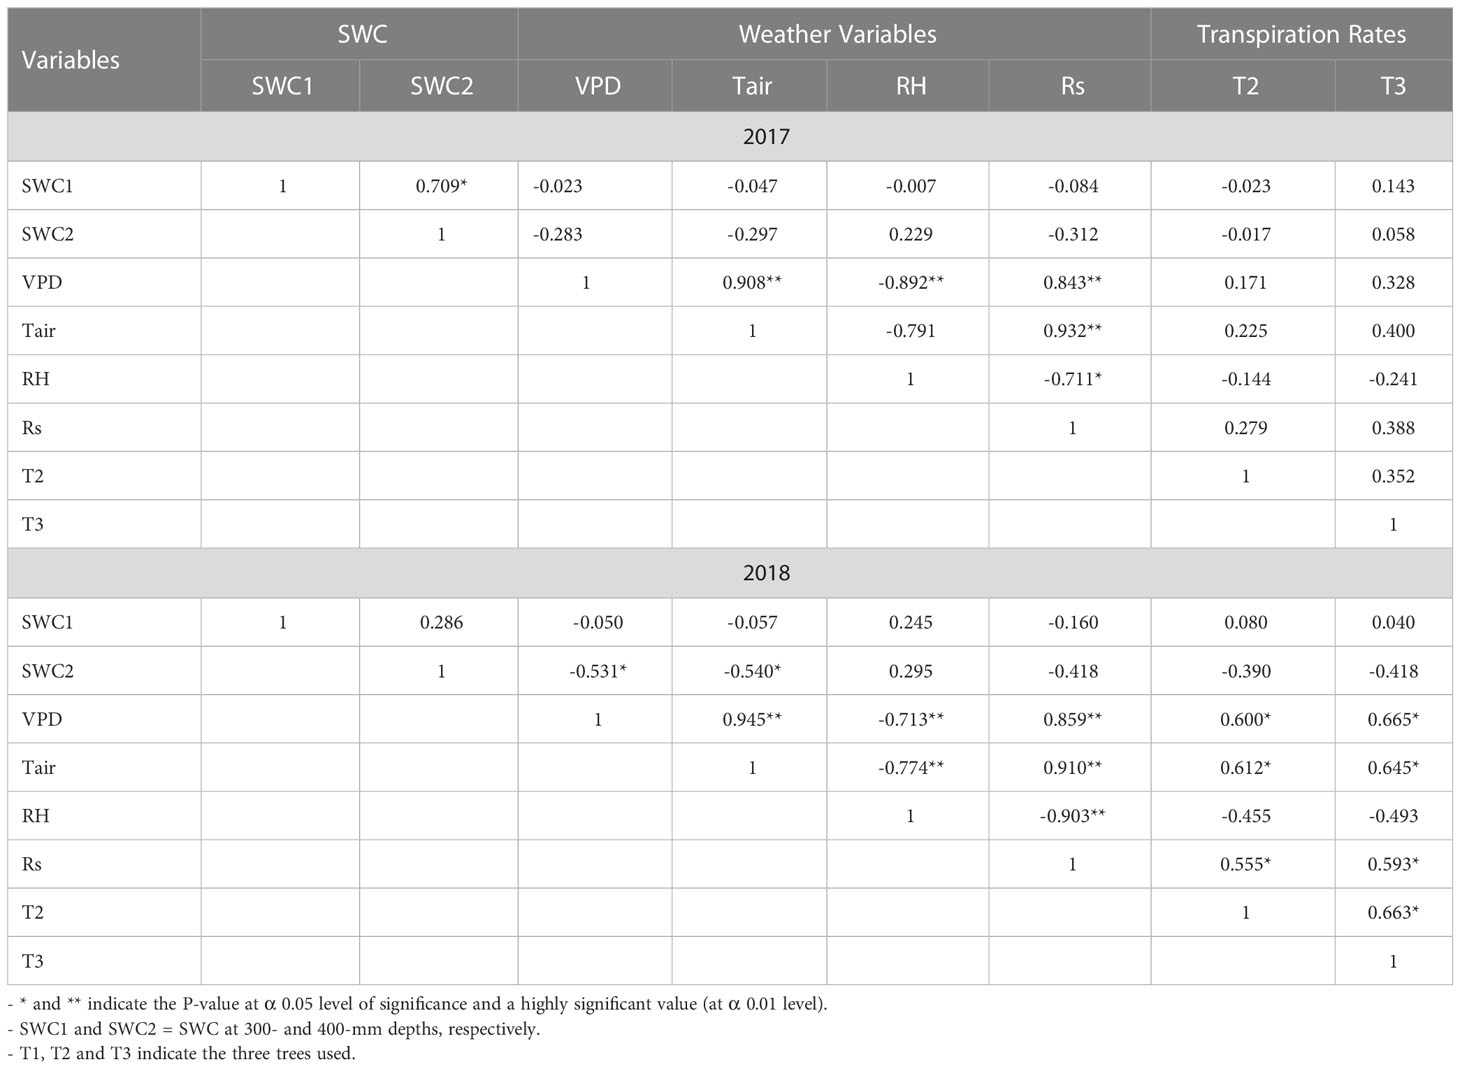
Table 5 Pearson correlation matrix relationships for weather variables/soil water content and tree transpiration rate.
Transpiration response to SWC
The relationship between daily NTR and FTSW during fruit development stages is presented in Figures 4A–C respectively. The two linear segments with a plateau region at FTSW of less than 0.4 where NTR peaked close to 1.0 are used in the graphs. The threshold values for the 2018 season were higher during the flowering stage than for the 2017 season, while both fruit development and ripening stages showed higher threshold values in 2017. Due to these differences in FTSW thresholds for sweet cherry with different growth stages, the transpiration rate decreases during progressive soil drying in relatively drier soil as the trees are experiencing different conditions of stress. A decline in FTSW was due to low rainfall variations during the different seasons and the measurement period of sweet cherry trees. When the FTSW decreased to 0.4, the trees used stored soil water, and transpiration rates were like those during a good rain. However, for an FTSW< 0.4, the transpiration rate declined sharply during prolonged dry spell periods such as during intense El Niño episodes. Unlike most studies conducted on annual crop species (Scalisi et al., 2019; Egan et al., 2021), the linear decline did not continue until FTSW approached 1. Instead, for all fruit growth stages, the endpoint for the linear decline in normalised transpiration rate occurred at values that ranged between 0.20 and 0.25 (Figures 4A–C). During the severe reduction in soil water availability, the tree’s net mass loss may have negatively impacted the transpiration rate. The NTR depends on water stored in plant tissues (Egan et al., 2021), and the new endpoint was assumed to include the linear portion of the transpiration rate declining to nearly zero.
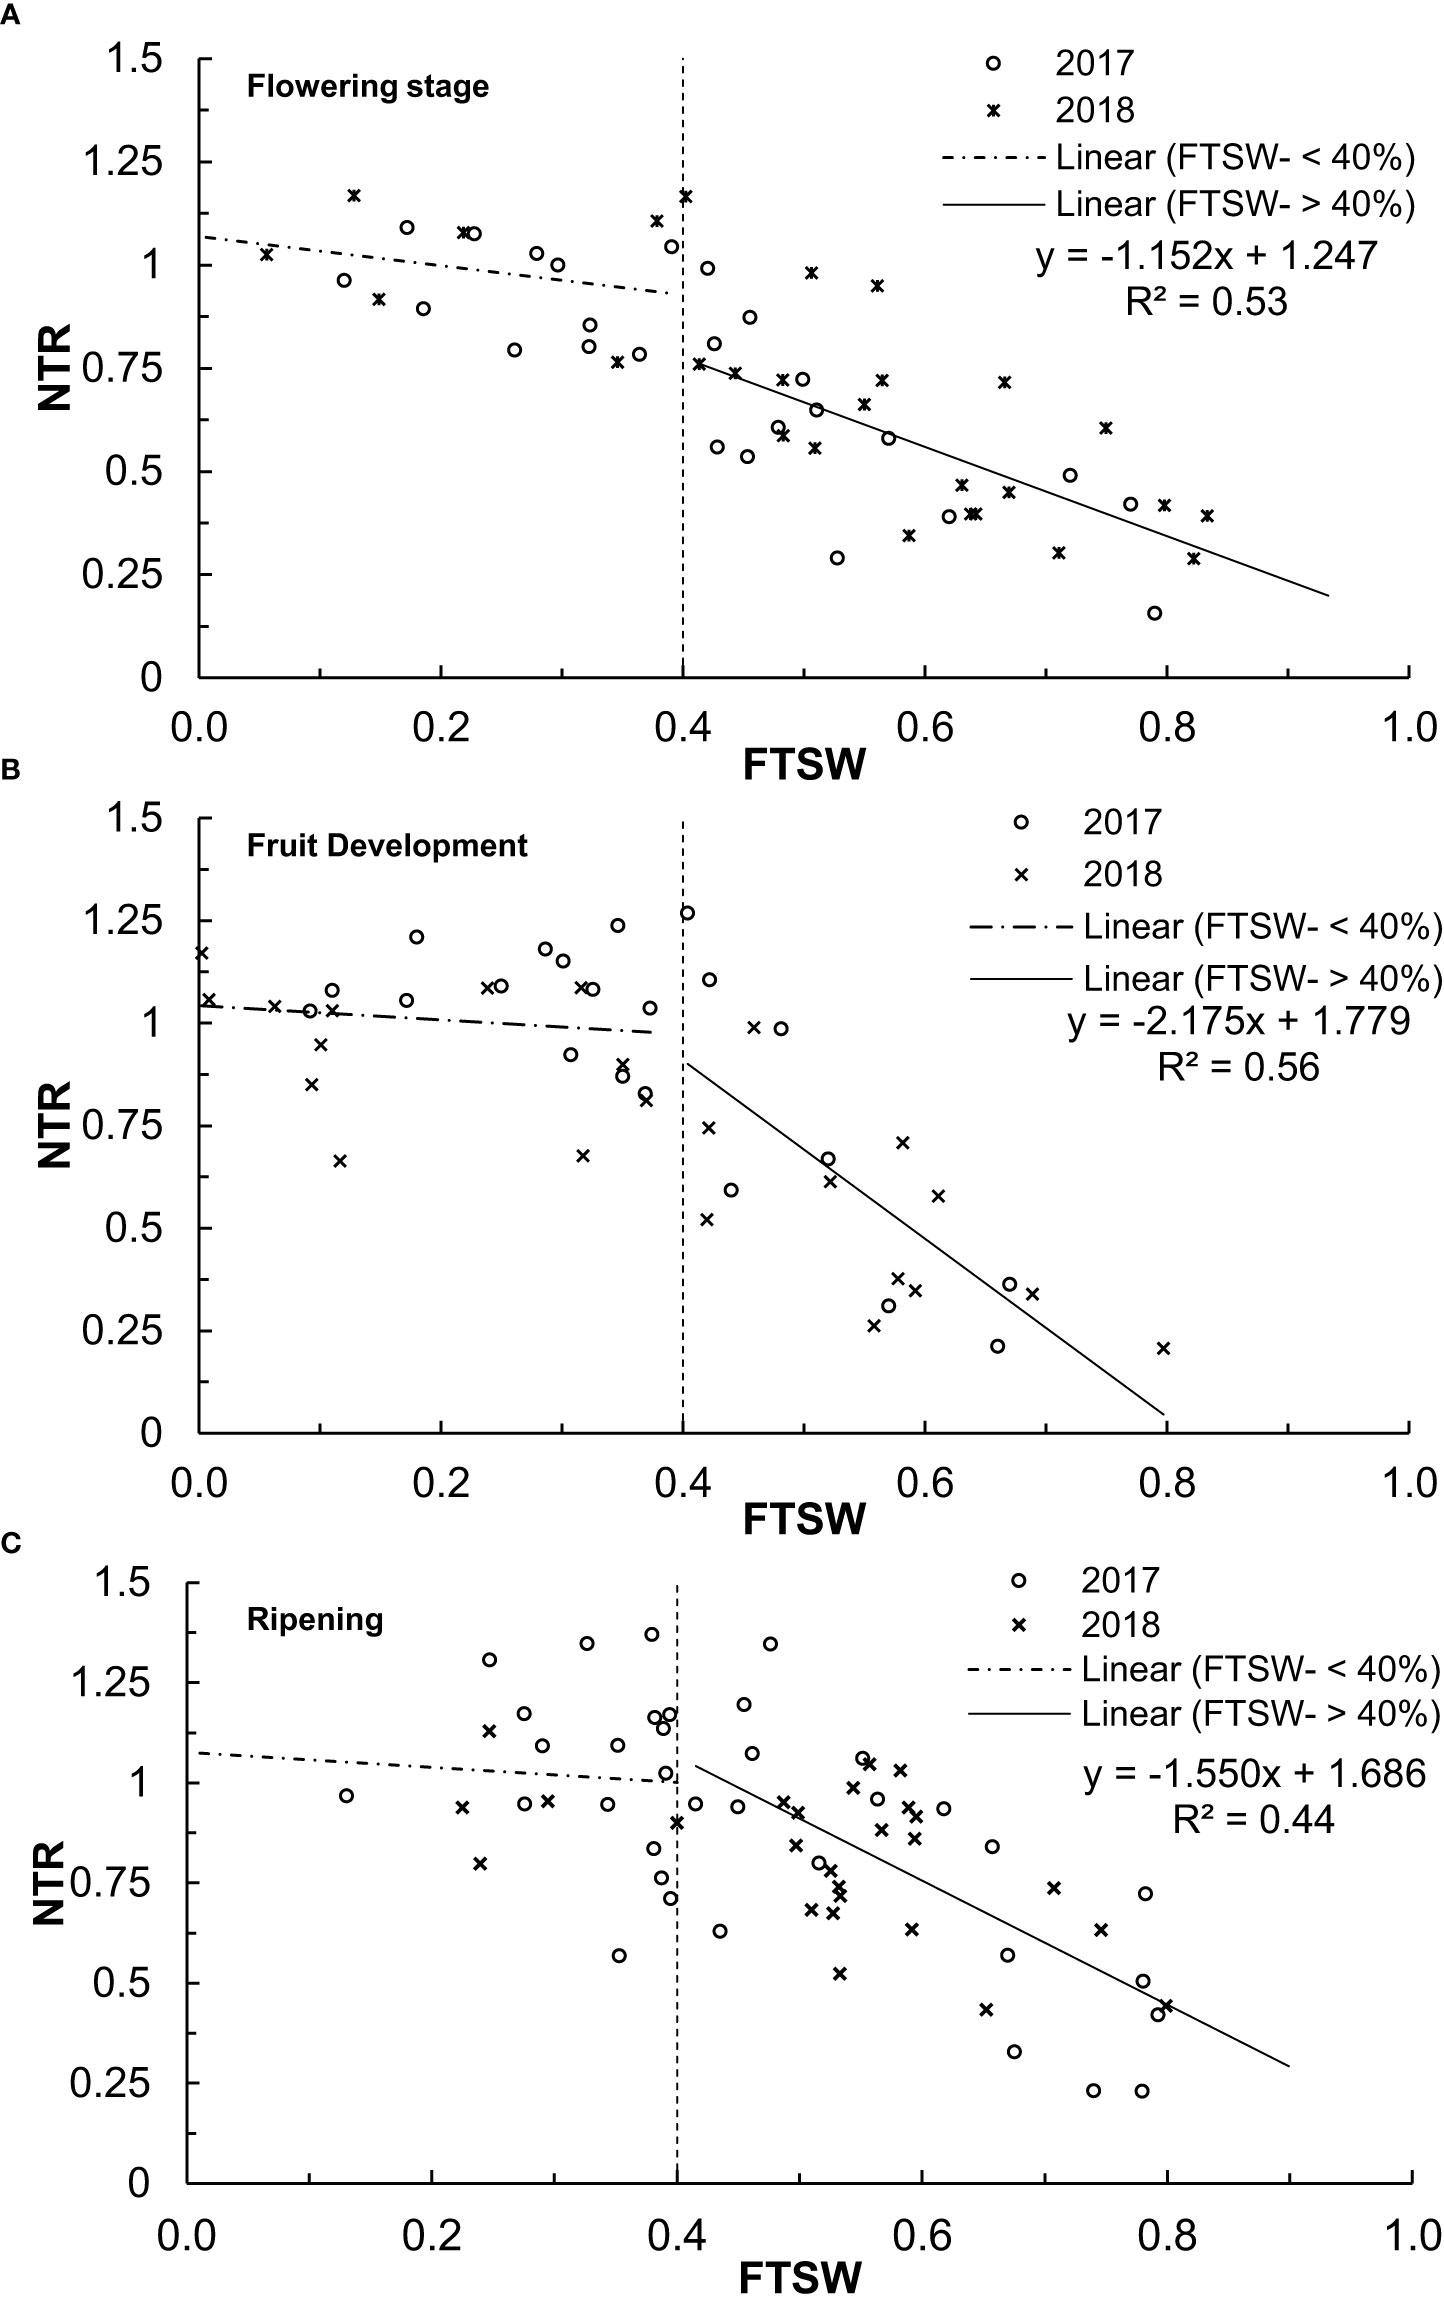
Figure 4 The average daily NTR for 2017 and 2018 and FTSW for the different growth stages (A) flowering (September-October), (B) fruit development (October), and (C) ripening (October to November).
Water stress coefficient
Adequate on-farm spatial soil variation information can be complex, including root-zone water content. However, due to limited time and limited resources, as is usually the case, SWC was considered representative of the entire orchard soil water status during different growth stages. In this study, the soil water-based stress coefficient method was used to address the sweet cherry tree water status based on soil water availability for the 300-400 mm depths. The adjusted stress coefficient factor, Kc, for the fruit development stages is presented in Figure 5.
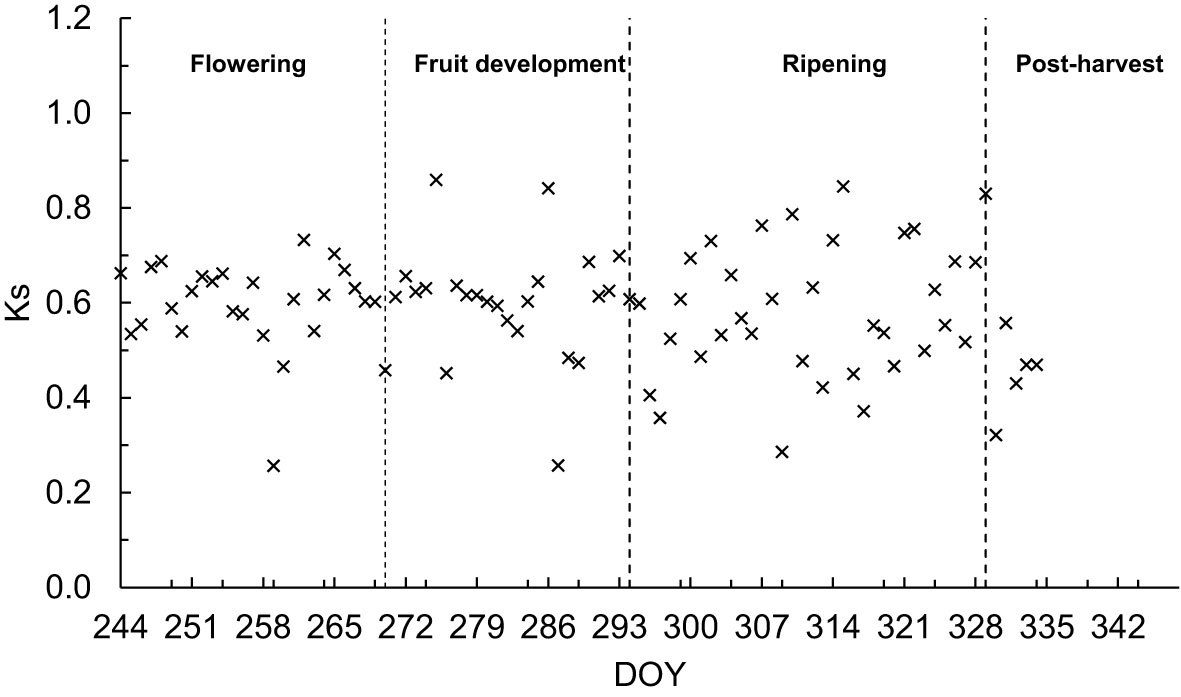
Figure 5 Adjusted Ks as determined by the FAO dual approach for sweet cherry trees during the principal growth stages.
During the fruit growth stages (flowering, fruit development, ripening) and the early post-harvest stage, the soil water content remained in the interval of the readily available water (RAW) (Equation 8), which is estimated at 55% of the total available water in the root zone (TAW) (Equation 9) and reached maximum Ks values greater than 0.70 for only 30% of the measurement days. However, most Ks values ranged between 0.45 and 0.65 (Figure 5) for different growth stages. The pattern of Ks varied during the fruit growth stages, particularly during fruit ripening. The Ks values were highly variable when the daily soil water content showed variations as the soil evaporation was expected to increase during dry days. The lowest Ks values were identified during DOYs 258, 286 and 308 in 2017 due to decreased soil water content. There were also some days with high values of Ks (≥0.80), for example, during DOY 273, 285 and 315 (2018), with an increase in rainfall at the later fruit growth stages. However, on some days, corresponding to shallow Ks values ranging between 0.20 and 0.40, when the trees experienced soil water deficits. During DOY 263 to 265, Ks increased from 0.80 to 0.85 due to rainfall at the end of fruit growth stages (October) in 2018. Thus, the average Ks variations were primarily due to low rainfall and high transpiration rate late in the season. In 2017, soil water stress was observed during the fruit ripening stage due to low rainfall.
Water vapour pressure deficit and estimated transpiration rate
The relationships between VPD and the amount of water transpired as estimated from the Penman-Monteith method (Tr-FAO-56 PENMAN) were positively correlated for both measurement periods (Figure 6). At a low atmospheric VPD (< 1.5 kPa), there was a good correlation with the estimated transpired water, but with an increased VPD, the estimated transpiration was underestimated and with scattered values. During the rainy days, the total amount of water transpired throughout the orchard ranged from 4.3 mm d-1 for a VPD of 1.1 kPa to 3.6 mm d-1 for a VPD of 3.6 kPa. Contrarily, during prolonged dry spell periods, cumulative transpiration ranged from 1.7 mm d-1 for VDP values of 1.1 kPa to 3.6 kPa.
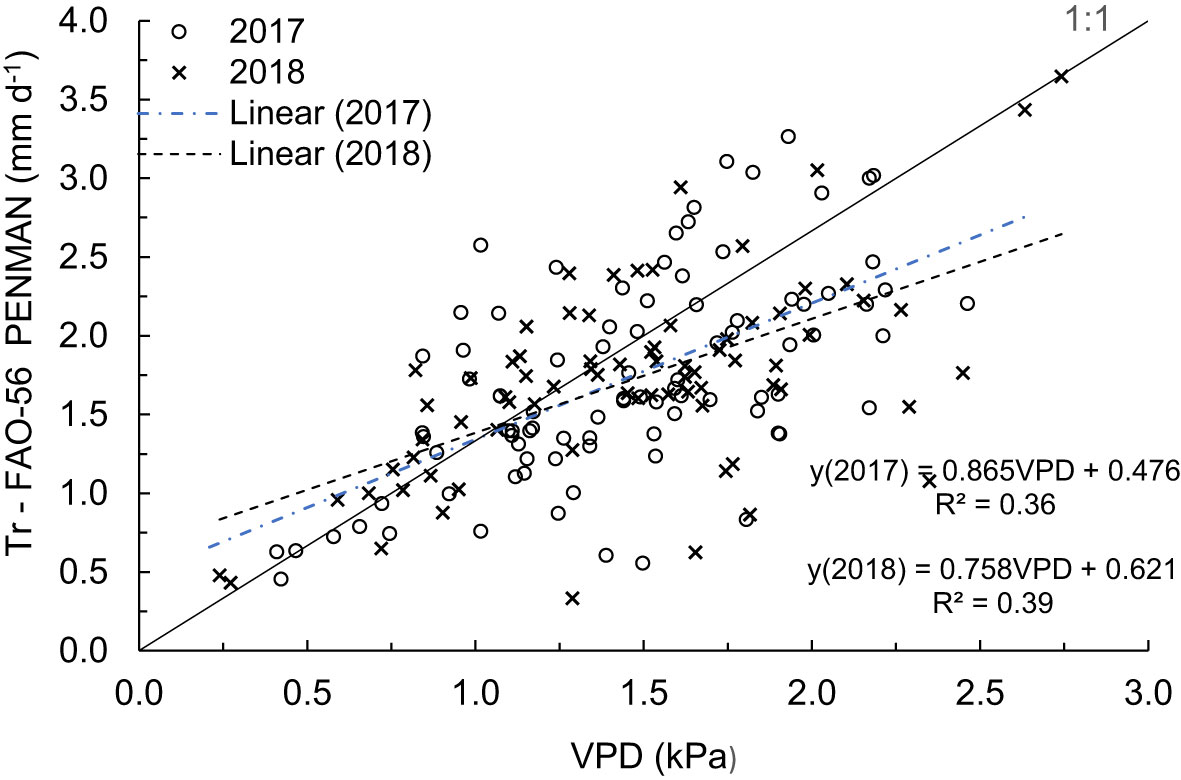
Figure 6 Relationship between the estimated transpiration rates derived from FAO-56 and VPD for September to December 2017 and 2018.
Similarly, the total estimated water transpired over the measurement period showed a positive linear relationship with R2 values of 0.36 and 0.39 with the increasing VPD in the 2017 and 2018 measurement periods, respectively (Figure 6). The slopes of the regression lines for the 2017 and 2018 measurement periods showed to be underestimated by 14% and 24%, respectively. This indicates that during the dry year (2017), VPD is better related to the estimated transpired water, while during the wet season (2018), the tree transpiration is vastly underestimated compared to the atmospheric VPD.
The overall increases in transpiration with increasing VPD observed for the sweet cherry trees in this study were consistent with Juhász et al. (2013b), who studied the correlation between the meteorological parameters and sap flow at specific periods of the day. They partitioned the day into water consumption in phases: the daytime from 6:00 to 22:00 was split into the morning (6:00–14:00) and afternoon segments (14:00–22:00). The daily pattern of sap flow was analysed in relation to air temperature, solar radiation, VPD, and wind speed better to understand the connection between transpiration and weather conditions. Based on their analysis, they found the strongest correlation between the sap flow and VPD. This study is also supported by Zuñiga et al. (2014), who found linear and logarithmic relations between transpiration and VPD with a coefficient of 0.88. There was also a consistent decrease in plant dry weight with increasing VPD for different stem sizes of the sweet cherry trees under different water management treatments in a study conducted by Juhász et al. (2013a). Previous studies by Burba et al. (2012); Zhang et al. (2013), and Tong et al. (2019) have shown that both stomatal conductance and carbon exchange rates decrease at high VPD.
Conclusions
The transpiration rate of sweet cherry under rainfed, semi-arid conditions are dependent on soil water availability. Vapour pressure deficit, solar radiation and air temperature are the significant drivers of sap flow. The transpiration rate depends on the transition from one growth stage to another with changes in the leaf area and fruit development, and crop load. The transpiration rates for sweet cherry trees under rainfed conditions were mostly driven by weather conditions which changed from one season to the other.
A combination of sap flow and soil water content was successfully used to detect tree water stress. A lower transpiration rate resulted in a lower fraction of transpirable soil water threshold where transpiration declined with progressive exposure to soil water deficit, making drought-stressed plants behave like well-watered plants until the soil became drier after long dry spells. However, more work is needed to understand transpiration rate regulation to enhance irrigation management practices. Therefore, the transpiration rate can be a valuable tool for irrigation scheduling and planning for transitioning from rainfed orchards to irrigated ones. Overall, the results support the proposition that sweet cherry has a substantially different response to SWC with a lower SWC than is the case for other deciduous trees. There was clear evidence in the tree response to dry soil conditions for the two years. The research findings, together with the results of previous studies, indicate that the sensitivity of relative transpiration rate to changes in SWC is approximately constant across a wide range of plant species.
Understanding transpiration or sap flow dynamics of sweet cherry trees, can assist farmers who want to transition from rainfed farming practice to irrigation as they will understand the crucial period or time of the growing season, which trees uses high volume of water. The results of this study indicate that trees use high volume of water from September to December and including January of the following year.
Data availability statement
The original contributions presented in the study are included in the article/supplementary material. Further inquiries can be directed to the corresponding author.
Ethics statement
Written informed consent was obtained from the individual(s) for the publication of any potentially identifiable images or data included in this article.
Author contributions
Edited and corrected the paper as it was part of the thesis for PT under his supervision. All authors contributed to the article and approved the submitted version.
Funding
The paper was funded by Thuthuka NRF Grant PHD Track.
Conflict of interest
The authors declare that the research was conducted in the absence of any commercial or financial relationships that could be construed as a potential conflict of interest.
Publisher’s note
All claims expressed in this article are solely those of the authors and do not necessarily represent those of their affiliated organizations, or those of the publisher, the editors and the reviewers. Any product that may be evaluated in this article, or claim that may be made by its manufacturer, is not guaranteed or endorsed by the publisher.
References
Allen R. (2008). Quality assessment of weather data and micrometeological flux - impacts on evapotranspiration calculation. J. Agric. Meteorol. 64, 191–204. doi: 10.2480/agrmet.64.4.5
Allen R. G., Pereira L. S., Raes D., Smith M. (1998). Crop evapotranspiration - guidelines for computing crop water requirements - FAO irrigation and drainage paper 56 (Rome, Italy: FAO).
Backes M., Blanke M. M. (2007). Water consumption and xylem flux of apple trees. Acta Hortic. 732, 573–578. doi: 10.17660/ActaHortic.2007.732.85
Braun P., Maurer B., Heinemann G. (2000). Scaling transpiration in apple orchards - meteorological versus plant based physiological measurements. Acta Hortic. 537, 45–51. doi: 10.17660/ActaHortic.2000.537.2
Burba G., Schmidt A., Scott R. L., Nakai T., Kathilankal J., Fratini G., et al. (2012). Calculating CO 2 and h 2O eddy covariance fluxes from an enclosed gas analyzer using an instantaneous mixing ratio. Glob. Change Biol. 18, 385–399. doi: 10.1111/j.1365-2486.2011.02536.x
Burgess S. S. O., Adams M. A., Turner N. C., Beverly C. R., Ong C. K., Khan A. A. H., et al. (2001). An improved heat pulse method to measure low and reverse rates of sap flow in woody plants. Tree Physiol. 21, 589–598. doi: 10.1093/treephys/21.9.589
Burgess S. S. O., Dawson T. E. (2008). Using branch and basal trunk sap flow measurements to estimate whole-plant water capacitance : a caution. Plant Soil 305, 5–13. doi: 10.1007/s11104-007-9378-2
Burgess S., Downey A., International I. C. T. (2014). SFM1 sap flow meter (Australia: ICT Int), 6770–6773.
Candogan B. N., Yazgan S. (2010). The effects of different irrigation levels on vegetative growth of young dwarf cherry trees in a sub-humid climate. Pakistan J. Bot. 42, 3399–3408.
Conradie D. C. U. (2012). South africa’s climatic Zones : today, tomorrow, in: international green building conference and exhibition future. Sandton South Afr. pp, 1–10.
Doronila A. I., Forster M. A. (2015). Performance measurement via sap flow monitoring of three eucalyptus species for mine site and dryland salinity phytoremediation. Int. J. Phytoremediation 17, 101–108. doi: 10.1080/15226514.2013.850466
Dye P. J., Soko S., Poulter A. G. (1996). Evaluation of the heat pulse velocity method for measuring sap flow in pinus patula. J. Exp. Bot. 47, 975–981. doi: 10.1093/jxb/47.7.975
Dzikiti S., Gush M. B., Taylor N. J., Volschenk T., Midgley S., Lötze E., et al. (2017). Measurement and modelling of water use by high yielding apple orchards and orchards of different age groups in the winter rainfall areas of south Africa. Acta Hortic. 1150, 31–38. doi: 10.17660/ActaHortic.2017.1150.5
Dzikiti S., Verreynne J. S., Stuckens J., Strever A., Verstraeten W. W., Swennen R., et al. (2010). Determining the water status of Satsuma mandarin trees [Citrus unshiu marcovitch] using spectral indices and by combining hyperspectral and physiological data. Agric. For. Meteorol. 150, 369–379. doi: 10.1016/j.agrformet.2009.12.005
Dzikiti S., Volschenk T., Midgley S. J. E., Lötze E., Taylor N. J., Gush M. B., et al. (2018). Estimating the water requirements of high yielding and young apple orchards in the winter rainfall areas of south Africa using a dual source evapotranspiration model. Agric. Water Manage. 208, 152–162. doi: 10.1016/j.agwat.2018.06.017
Edwards W. R. N., Warwick N. W. M. (1984). Transpiration from a kiwifruit vine as estimated by the heat pulse technique and the penman-monteith equation. New Zeal. J. Agric. Res. 27, 537–543. doi: 10.1080/00288233.1984.10418016
Egan L., Hofmann R., Nichols S., Hadipurnomo J., Hoyos-Villegas V. (2021). Transpiration rate of white clover (Trifolium repens l.) cultivars in drying soil. Front. Plant Sci. 12. doi: 10.3389/fpls.2021.595030
Fernández J. (2017). Plant-based methods for irrigation scheduling of woody crops. Horticulturae 3, 1–37. doi: 10.3390/horticulturae3020035
Fernández J. E., Green S. R., Caspari H. W., Diaz-Espejo A., Cuevas M. V. (2007). The use of sap flow measurements for scheduling irrigation in olive, apple and Asian pear trees and in grapevines. Plant Soil 305, 91–104. doi: 10.1007/s11104-007-9348-8
Fernández J. E., Palomo M. J., Díaz-Espejo A., Clothier B. E., Green S. R., Girón I. F., et al. (2001). Heat-pulse measurements of sap flow in olives for automating irrigation: tests, root flow and diagnostics of water stress. Agric. Water Manage. 51, 99–123. doi: 10.1016/S0378-3774(01)00119-6
Fuchs S., Leuschner C., Link R., Coners H., Schuldt B. (2017). Calibration and comparison of thermal dissipation, heat ratio and heat field deformation sap flow probes for diffuse-porous trees. Agric. For. Meteorol. 244, 151–161. doi: 10.1016/j.agrformet.2017.04.003
Girardi E. A., Assis F. D. E., Mourão A., Delgado-rojas J. S., Paulo J., Araújo D. E. C. (2010). Use of the heat dissipation method for sap flow measurement in citrus NUrsery trees. Rev. Bras. fruitc jaboticalbal 32, 976–983. doi: 10.1590/S0100-29452011005000007
Green S., Clothier B., Jardine B. (2003). Theory and practical application of heat pulse to measure sap flow. Agron. J. 95, 1371–1379. doi: 10.2134/agronj2003.1371
Gush M. B. (2008). Measurement of water-use by jatropha curcas l. using the heat-pulse velocity technique. Water SA 34, 2–6.
Gush M. B. (2011). Water-use, growth and water-use efficiency of indigenous trees species in a range of forest and woodland systems in south Africa (South Africa: University of Cape Town). doi: 10.1016/j.renene.2008.06.018
Jarmain C., Everson C., Savage M. J., Mengistu M. G., Clulow A. D., Walker S., et al. (2009). Refining tools for evaporation monitoring in support of water resources management. report no 1567 (South Africa: Water Research Commission, Pretoria).
Juhász Á., Hrotkó K. (2014). Comparison of the transpiration part of two sources evapotranspiration model and the measurements of sap flow in the estimation of the transpiration of sweet cherry orchards. Agric. Water Manage. 143, 142–150. doi: 10.1016/j.agwat.2014.06.014
Juhász Á., Sepsi P., Nagy Z., Tokei L., Hrotkó K. (2013a). Water consumption of sweet cherry trees estimated by sap flow measurement. Sci. Hortic. (Amsterdam). 164, 41–49. doi: 10.1016/j.scienta.2013.08.022
Juhász A., Sepsi P., Tőkei L., Hrotkó K. (2013b). Night-time sap flow rate of sweet cherry trees. Acta Hortic. 981, 591–596. doi: 10.17660/ActaHortic.2013.981.95
Lacape M. J., Wery J., Annerose D. J. M. (1998). Relationships between plant and soil water status in five field-grown cotton (Gossypium hirsutum l.) cultivars. F. Crop Res. 57, 29–43. doi: 10.1016/S0378-4290(97)00111-1
Mapeto T., Louw J., Gush M., Pauw J. (2018). Whole-tree sap flow responses to soil water and weather variables for pinus radiata and three indigenous species in a southern afrotemperate forest region. South. For. J. For. Sci. 80, 329–339. doi: 10.2989/20702620.2018.1429096
Marshall D. C. (1958). Measurement of sap flow in conifers by heat transport. Plant Physiol. 33, 385–396. doi: 10.1104/pp.33.6.385
Mobe N. T., Dzikiti S., Volschenk T., Zirebwa S. F., Ntshidi Z., Midgley S. J. E., et al. (2020). Using sap flow data to assess variations in water use and water status of apple orchards of varying age groups in the Western cape province of south Africa. Water SA 46, 213–224.
Molina A. J., Aranda X., Llorens P., Galindo A., Biel C. (2019). Sap flow of a wild cherry tree plantation growing under Mediterranean conditions : assessing the role of environmental conditions on canopy conductance and the effect of branch pruning on water productivity. Agric. Water Manage. 218, 222–233. doi: 10.1016/j.agwat.2019.03.019
Nadezhdina N. (1999). Sap flow index as an indicator of plant water status. Tree Physiol. 19, 885–891. doi: 10.1093/treephys/19.13.885
Ntshidi Z., Dzikiti S., Mazvimavi D. (2018). Water use dynamics of young and mature apple trees planted in south African orchards: a case study of the golden delicious and cripps’ pink cultivars. Proc. Int. Assoc. Hydrol. Sci. 378, 79–83. doi: 10.5194/piahs-378-79-2018
Ortuño M. F., García-Orellana Y., Conejero W., Ruiz-Sánchez M. C., Alarcón J. J., Torrecillas A. (2006). Stem and leaf water potentials, gas exchange, sap flow, and trunk diameter fluctuations for detecting water stress in lemon trees. Trees - Struct. Funct. 20, 1–8. doi: 10.1007/s00468-005-0004-8
Ouyang Z. P., Mei X. R., Li Y. Z., Guo J. X. (2013). Measurements of water dissipation and water use efficiency at the canopy level in a peach orchard. Agric. Water Manage. 129, 80–86. doi: 10.1016/j.agwat.2013.07.016
Pérez-Jiménez M., Hernández-Munuera M., Piñero M. C., López-Ortega G., del Amor F. M. (2017). CO2 effects on the waterlogging response of ‘Gisela 5’ and ‘Gisela 6’ (Prunus cerasus x prunus canescens) sweet cherry (Prunus avium) rootstocks. J. Plant Physiol. 213, 178–187. doi: 10.1016/j.jplph.2017.03.011
Poças I., Paço T. A., Cunha M., Andrade J. A., Silvestre J., Sousa A., et al. (2014). Satellite-based evapotranspiration of a super-intensive olive orchard: application of METRIC algorithms. Biosyst. Eng. 128, 69–81. doi: 10.1016/j.biosystemseng.2014.06.019
Polak A., Wallach R. (2001). Analysis of soil moisture variations in an irrigated orchard root zone. Plant Soil 233, 145–159. doi: 10.1023/A:1010351101314
Ramos M. C., Martinez-Casasnovas J. A. (2014). Soil water variability and its influence on transpirable soil water fraction with two grape varieties under different rainfall regimes. Agric. Ecosyst. Environ. 185, 253–262. doi: 10.1016/j.agee.2013.12.025
Santos L. F. (2018). Olive water use, crop coefficient, yield, and water productivity under two deficit irrigation strategies. Agronomy 8, 1–17. doi: 10.3390/agronomy8060089
Scalisi A., Marra F. P., Caruso T., Illuminati C., Costa F., Lo Bianco R. (2019). Transpiration rates and hydraulic conductance of two olive genotypes with different sensitivity to drought. Acta Hortic. 1253, 421–428. doi: 10.17660/ActaHortic.2019.1253.55
Sinclair T. R., Holbrook N. M., Zwieniecki M. A. (2005). Daily transpiration rates of woody species on drying soil. Tree Physiol. 25, 1469–1472. doi: 10.1093/treephys/25.11.1469
Steppe K., De Pauw D. J. W., Doody T. M., Teskey R. O. (2010). A comparison of sap flux density using thermal dissipation, heat pulse velocity and heat field deformation methods. Agric. For. Meteorol. 150, 1046–1056. doi: 10.1016/j.agrformet.2010.04.004
Steppe K., Vandegehuchte M. W., Tognetti R., Mencuccini M. (2015). Sap flow as a key trait in the understanding of plant hydraulic functioning. Tree Physiol. 35, 341–345. doi: 10.1093/treephys/tpv033
Swanson R. H., Whitfield D. W. A. (1981). A numerical analysis of heat pulse velocity theory and practice. J. Experiment Botany 32 (1), 221–239.
Tfwala C. M., van Rensburg L. D., Bello Z. A., Green S. R. (2018). Calibration of compensation heat pulse velocity technique for measuring transpiration of selected indigenous trees using weighing lysimeters. Agric. Water Manage. 200, 27–33. doi: 10.1016/j.agwat.2018.01.005
Tong X., Mu Y., Zhang J., Meng P., Li J. (2019). Water stress controls on carbon flux and water use efficiency in a warm-temperate mixed plantation. J. Hydrol. 571, 669–678. doi: 10.1016/j.jhydrol.2019.02.014
Van den Bilcke N., De Smedt S., Simbo D. J., Samson R. (2013). Sap flow and water use in African baobab (Adansonia digitata l.) seedlings in response to drought stress. South Afr. J. Bot. 88, 438–446. doi: 10.1016/j.sajb.2013.09.006
Yamane T., Hamana Y., Nakano M. (2011). Detection of water-deficit stress from daily sap flow profiles in peach. J. Japanese Soc Hortic. Sci. 80, 383–389. doi: 10.2503/jjshs1.80.383
Yazgan S., Buyukcangaz H., Demirtas C., Candogan B. (2006). Evapotranspiration for young cherry trees (Prunus avium l.) and growth responses to irrigation. Park. J. Biol. Sci. 9, 39–44.
Zhang Y., Shen Y., Xu X., Sun H., Li F., Wang Q. (2013). Characteristics of the water-energy-carbon fluxes of irrigated pear (Pyrus bretschneideri rehd) orchards in the north China plain. Agric. Water Manage. 128, 140–148. doi: 10.1016/j.agwat.2013.07.007
Keywords: transpirable, transpiration, water stress, crop coefficient, sap flow
Citation: Tharaga PC, Tesfuhuney WA, Coetzer GM and Savage MJ (2023) Heat pulse velocity method for determining water requirements in rainfed sweet cherry trees (Prunus avium L.). Front. Hortic. 2:1155862. doi: 10.3389/fhort.2023.1155862
Received: 31 January 2023; Accepted: 26 April 2023;
Published: 04 July 2023.
Edited by:
Carlos Poblete-Echeverría, Stellenbosch University, South AfricaReviewed by:
Ozkan Kaya, Erzincan Horticultural Research Institute, TürkiyeMauricio Andres Zuñiga, Center for Research and Transfer in Irrigation and Agroclimatology (CITRA), Chile
Copyright © 2023 Tharaga, Tesfuhuney, Coetzer and Savage. This is an open-access article distributed under the terms of the Creative Commons Attribution License (CC BY). The use, distribution or reproduction in other forums is permitted, provided the original author(s) and the copyright owner(s) are credited and that the original publication in this journal is cited, in accordance with accepted academic practice. No use, distribution or reproduction is permitted which does not comply with these terms.
*Correspondence: Phumudzo C. Tharaga, VGhhcmFnYXBjQHVmcy5hYy56YQ==