Abstract
The effects of Regulated Deficit Irrigation (RDI) on Class 1 yield, berry quality, and resource use efficiency of Malling Ace, an everbearer strawberry cultivar, were tested in a Total Controlled Environment Agriculture (TCEA) system over a cropping period of 10 months. An automated sensor-based irrigation system was used to ensure coir water and nutrient availability were optimal in the control (well-watered, WW) treatment. The extent of imposed coir drying in the RDI treatments was informed by identifying the coir volumetric moisture content value at which changes in midday stem water potential were first detected in response to gradual coir drying. Two RDI treatments were then imposed under standard TCEA conditions for strawberry. In RDI-1, plants received irrigation to raise the coir volumetric moisture content to a value midway between the irrigation set point and WW values. In RDI-2, irrigation was applied to maintain coir volumetric moisture content within a narrow range from the set point. All RDI treatments were imposed using the automated sensor-based fertigation system. In a second TCEA experiment, the RDI-1 treatment was imposed during a split photoperiod (two light and two dark periods in 24 h). In each experiment, treatment effects of RDI on leaf gas exchange were determined, as were those on Class 1 yields and berry quality. A series of Key Performance Indicators were calculated and compared between treatments and with those from conventional polytunnel strawberry production. The cropping potential of well-watered Malling Ace grown for 12-months in TCEA was quantified. Total Class 1 berry yields per plant were reduced by 30–36% in the RDI treatments due to a combination of lower berry fresh weight and fewer Class 1 berries. Berry soluble solids content was unaffected. Under the split photoperiod, Class 1 yields and berry quality attributes were similar, with water and nutrient use efficiencies being higher in the RDI-treatment. The mean cropping potential of Malling Ace grown for 12 months in TCEA was 3.3 kg of Class 1 fruit per plant, which equates to 39.7 kg per m². After the first cropping flush, the cumulative Class 1 fruit yield per plant was linear.
1 Introduction
Strawberry (Fragaria x ananassa) is an economically important crop; worldwide production reached 10.5 million tonnes in 2023 and is likely to continue to increase steadily (FAO, 2025) the UK strawberry production was worth £421 million, yielding 106,400 tonnes, whilst UK consumption reached 161,700 tonnes (DEFRA, 2024). The gap is filled by imported berries, worth £57 million in 2023 (DEFRA, 2024). To help to satisfy demand for home-grown strawberries, and to reduce reliance on imports, growers have improved cultivation practices by various means, including the use of substrate media in table-top production, transitioning to protected horticulture, also known as Controlled Environment Agriculture (CEA) and incorporating heating and supplemental lighting, adopting high-yielding cultivars, and implementing advanced fertigation management techniques to enhance efficiency and productivity (Van Delm et al., 2016). With the urgent need to reduce global carbon emissions, growers must balance yield-enhancing practices with efficient resource use to maintain profitable productivity. As margins continue to decline, improving resource efficiency to reduce costs whilst maintaining good commercial yields and excellent berry quality has become essential for sustainable strawberry production.
Out-of-season strawberry production in CEA has been practised by some larger UK soft fruit businesses for several years (Raffle et al., 2010b) and, in addition to partial import displacement, the higher market prices (DEFRA, 2025) help to offset the capital and energy costs associated with glasshouse production (Lieten, 2013). However, due to low ambient light and temperatures in winter months in the UK, profitable berry production under CEA is usually limited to 10 months (Raffle et al., 2010). Berry production under Total Controlled Environment Agriculture (TCEA), also known as vertical farming, could help to further reduce reliance on imports by facilitating UK production from October to April, but several additional challenges must first be overcome before this approach is viable. Key amongst these is effective and consistent pollination under TCEA systems (Nishimoto et al., 2023) and year-round availability of high-health, high quality propagules with a guaranteed high cropping potential (Kouloumprouka Zacharaki et al., 2024; K. Swann et al., in press). Although many TCEA systems are inherently efficient in their water and fertiliser use (Kozai and Sasaki, 2013), excessive canopy growth often necessitates time-consuming and expensive leaf removal during the fruit production phase. Work is underway to better target nitrogen inputs to more closely match demand with supply, and our initial results suggest that nitrogen savings of 50%, compared to commercial formulations, can be achieved without significant yield penalties (Stavridou and Else, unpublished)1.
Regulated Deficit Irrigation (RDI) is a proven method of water saving for many crops (Fereres and Soriano, 2007; Chai et al., 2015) including tomatoes (Lu et al., 2019), wine grapes (Romero et al., 2010) and woody crops (Chen et al., 2023), and can also lower fertiliser use (Chai et al., 2015). Since strawberry is often fertigated, water savings also translate to fertiliser savings, and so techniques such as RDI could also help to improve resource use efficiencies and deliver net zero emission targets (Chen et al., 2023).
In strawberry, RDI has been reported to limit excessive canopy development of strawberry plants (Grant et al., 2010) and extend post-harvest quality (Akhtar and Rab, 2015). Whilst severe water stress can reduce yield and berry fresh weight (FW) (Jensen et al., 2009; Weber et al., 2017), a moderate RDI stress may improve fruit quality without compromising yield (Weber et al., 2017; Marcellini et al., 2023). RDI can increase berry sugar, organic acid, antioxidant and phenolic contents in some strawberry cultivars (Terry et al., 2007; Giné Bordonaba and Terry, 2010; Weber et al., 2017), potentially enhancing fruit organoleptic quality and nutritional value. However, often, although not always (e.g. Dodds et al., 2007) these benefits are achieved because individual fruit FW is reduced under RDI.
Responses to RDI vary amongst cultivars, with some cultivars showing improved quality under mild stress and others performing better with full irrigation (Jensen et al., 2009; Weber et al., 2017). Plant water relations and leaf gas exchange can also be influenced by RDI treatments (Johnson and Simpson, 2014; Yang et al., 2022) and so identifying the extent and duration of substrate moisture stress is crucial for balancing water conservation and crop performance under RDI (Yang et al., 2022; Romero et al., 2010). Variation in response to water deficit stress is well documented amongst strawberry cultivars (Ariza et al., 2021) and so the point at which the rootzone water deficit stress begins to limit marketable yield will also differ between cultivars (Fereres and Soriano, 2007).
Additionally, June-bearer and everbearer strawberry varieties exhibit different responses to RDI. June-bearing cultivars, being short-day plants, can tolerate more extreme RDI treatments without significant yield reduction due to their single flowering flush (Nicoll and Galletta, 1987; Johnson and Simpson, 2014). In contrast, everbearing cultivars, which are day-neutral or long-day plants, often show negative yield effects under moderate RDI stress due to their continuous flowering and fruiting behaviour. Overall, carefully managed RDI can be an effective strategy for improving strawberry fruit quality whilst conserving water resources (Perin et al., 2019; Marcellini et al., 2023), but it is not without risk, especially in outdoor production, but also in CEA systems (polytunnel/glasshouse), where environmental conditions fluctuate constantly.
The controlled environment provided by TCEA systems allows for an extended cropping period under stable growing conditions and so this approach may be more amenable to using RDI to control canopy vigour and to improve berry phytonutrient content without incurring yield penalties. To our knowledge, there are no published reports of the effects of RDI on strawberry production in TCEA systems. We quantified the effects of different RDI treatments on the morphology, physiology, and cropping potential of the everbearer strawberry cultivar Malling Ace under a controlled environment. In addition, we compared RDI treatments under a conventional 24-hour photoperiod and a split photoperiod to investigate whether alternative light regimes could help compensate for any yield and fruit quality penalties resulting from RDI. We also compared the cropping potential of Malling Ace in a TCEA system to that in conventional polytunnel production, a form of CEA.
2 Materials and methods
2.1 Plant material
Cold stored mini-tray plants of Malling Ace were supplied by Berry Plants Ltd (Kent, UK) and delivered to Niab East Malling on 24 January 2024; plants were immediately stored at −2°C. On 9 February 2024, thawed plants were planted into 40 cm-long troughs (6L volume) sited in a controlled environment growth room at East Malling. Each trough contained buffered Cocogreen™ coir, and each was planted with two plants. To ensure uniform establishment, all plants received well-watered (WW) fertigation for 54 days. On 3 April 2024, 12 planted troughs were moved to a second growth room at East Malling.
2.2 Growth room environmental conditions
In Experiment 1, a growth room with a bench-top growing area of 19 m2; and fitted with white broad spectrum Kroptek LED (2.2umol/W) lighting systems delivering a photosynthetic photon flux density (PPFD) of 500 μmol·m−2·s−1 at canopy level was used. Environmental conditions were maintained at a day/night temperature of 22/15°C and relative humidity of 60/80%; with light and dark periods of 15/9 h respectively providing a Daily Light Integral (DLI) of 27 mol·m−2.
A similar growth room, with the same lighting system (PPFD and spectrum) was used for Experiment 2, but with a growing area of 9 m². The photoperiod was maintained as in Experiment 1 until 23 April 2024 (74 days after planting), after which the light period was adjusted to 14 h but was applied in two 7 h periods, with intervening dark periods of 5 h each (DLI = 25.2 mol·m−2). Thereafter, the lighting schedule maintained until the end of the experiment.
2.3 Experimental design
Experiment 1 followed a completely randomised block design with six blocks and three treatments (6 × 3), resulting in a total of 18 experimental plots (df = 10). Each plot comprised one trough containing two plants, giving a total of 36 plants. Experiment 2 was similarly structured as a completely randomised block design, but with six blocks and two treatments (6 × 2), resulting in a total of 12 plots (df = 5). As in Experiment 1, each plot consisted of one trough containing two plants, giving a total of 24 plants. The experimental layout is illustrated in Figure 1.
Figure 1

Schematic representation of the experimental design. Two independent experiments were conducted using Fragaria × ananassa Malling Ace under TCEA. Experiment 1 included three irrigation treatments (WW, RDI-1, RDI-2) arranged in a completely randomised design with 6 blocks (replicates) per treatment. Each plot consisted of one trough with two plants, totalling 36 plants. Experiment 2 used a similar design with two treatments (WW and RDI-1), 6 replicates per treatment, and 24 plants in total.
2.4 Application of RDI treatments in TCEA
2.4.1 Experiment 1
Three irrigation treatments were applied, based on the Coir Volumetric Moisture Content (CVMC):
-
A well-watered (WW) control in which CVMC values were maintained around 65%, which is equivalent to 0.65 m3 m−3;
-
a Regulated Deficit Irrigation 1 (RDI-1) treatment in which alternate wetting and drying cycles were imposed once CVMC values reached 30%;
-
a Regulated Deficit Irrigation 2 (RDI-2) treatment in which the CVMC value was set and maintained around 30%.
RDI treatments were informed by preliminary work in which a coir drying phase was imposed to identify the CVMC value at which physiological responses to limiting coir water availability could first be detected in Malling Ace (Figure 2A). Compared to WW values, statistically significant changes in midday Stem Water Potential (SWP), often the initial indicator of water deficit stress in plants (Moriana et al., 2012), were noted once a CVMC value of 30% was reached, this first occurred on 16 April 2024 (Figure 2B). This CVMC value was then used as the irrigation trigger point in each RDI treatment. The frequency and duration of fertigation events to WW plants was adjusted to achieve a mean run-off volume of 0.5–2.5% of input volume.
Figure 2
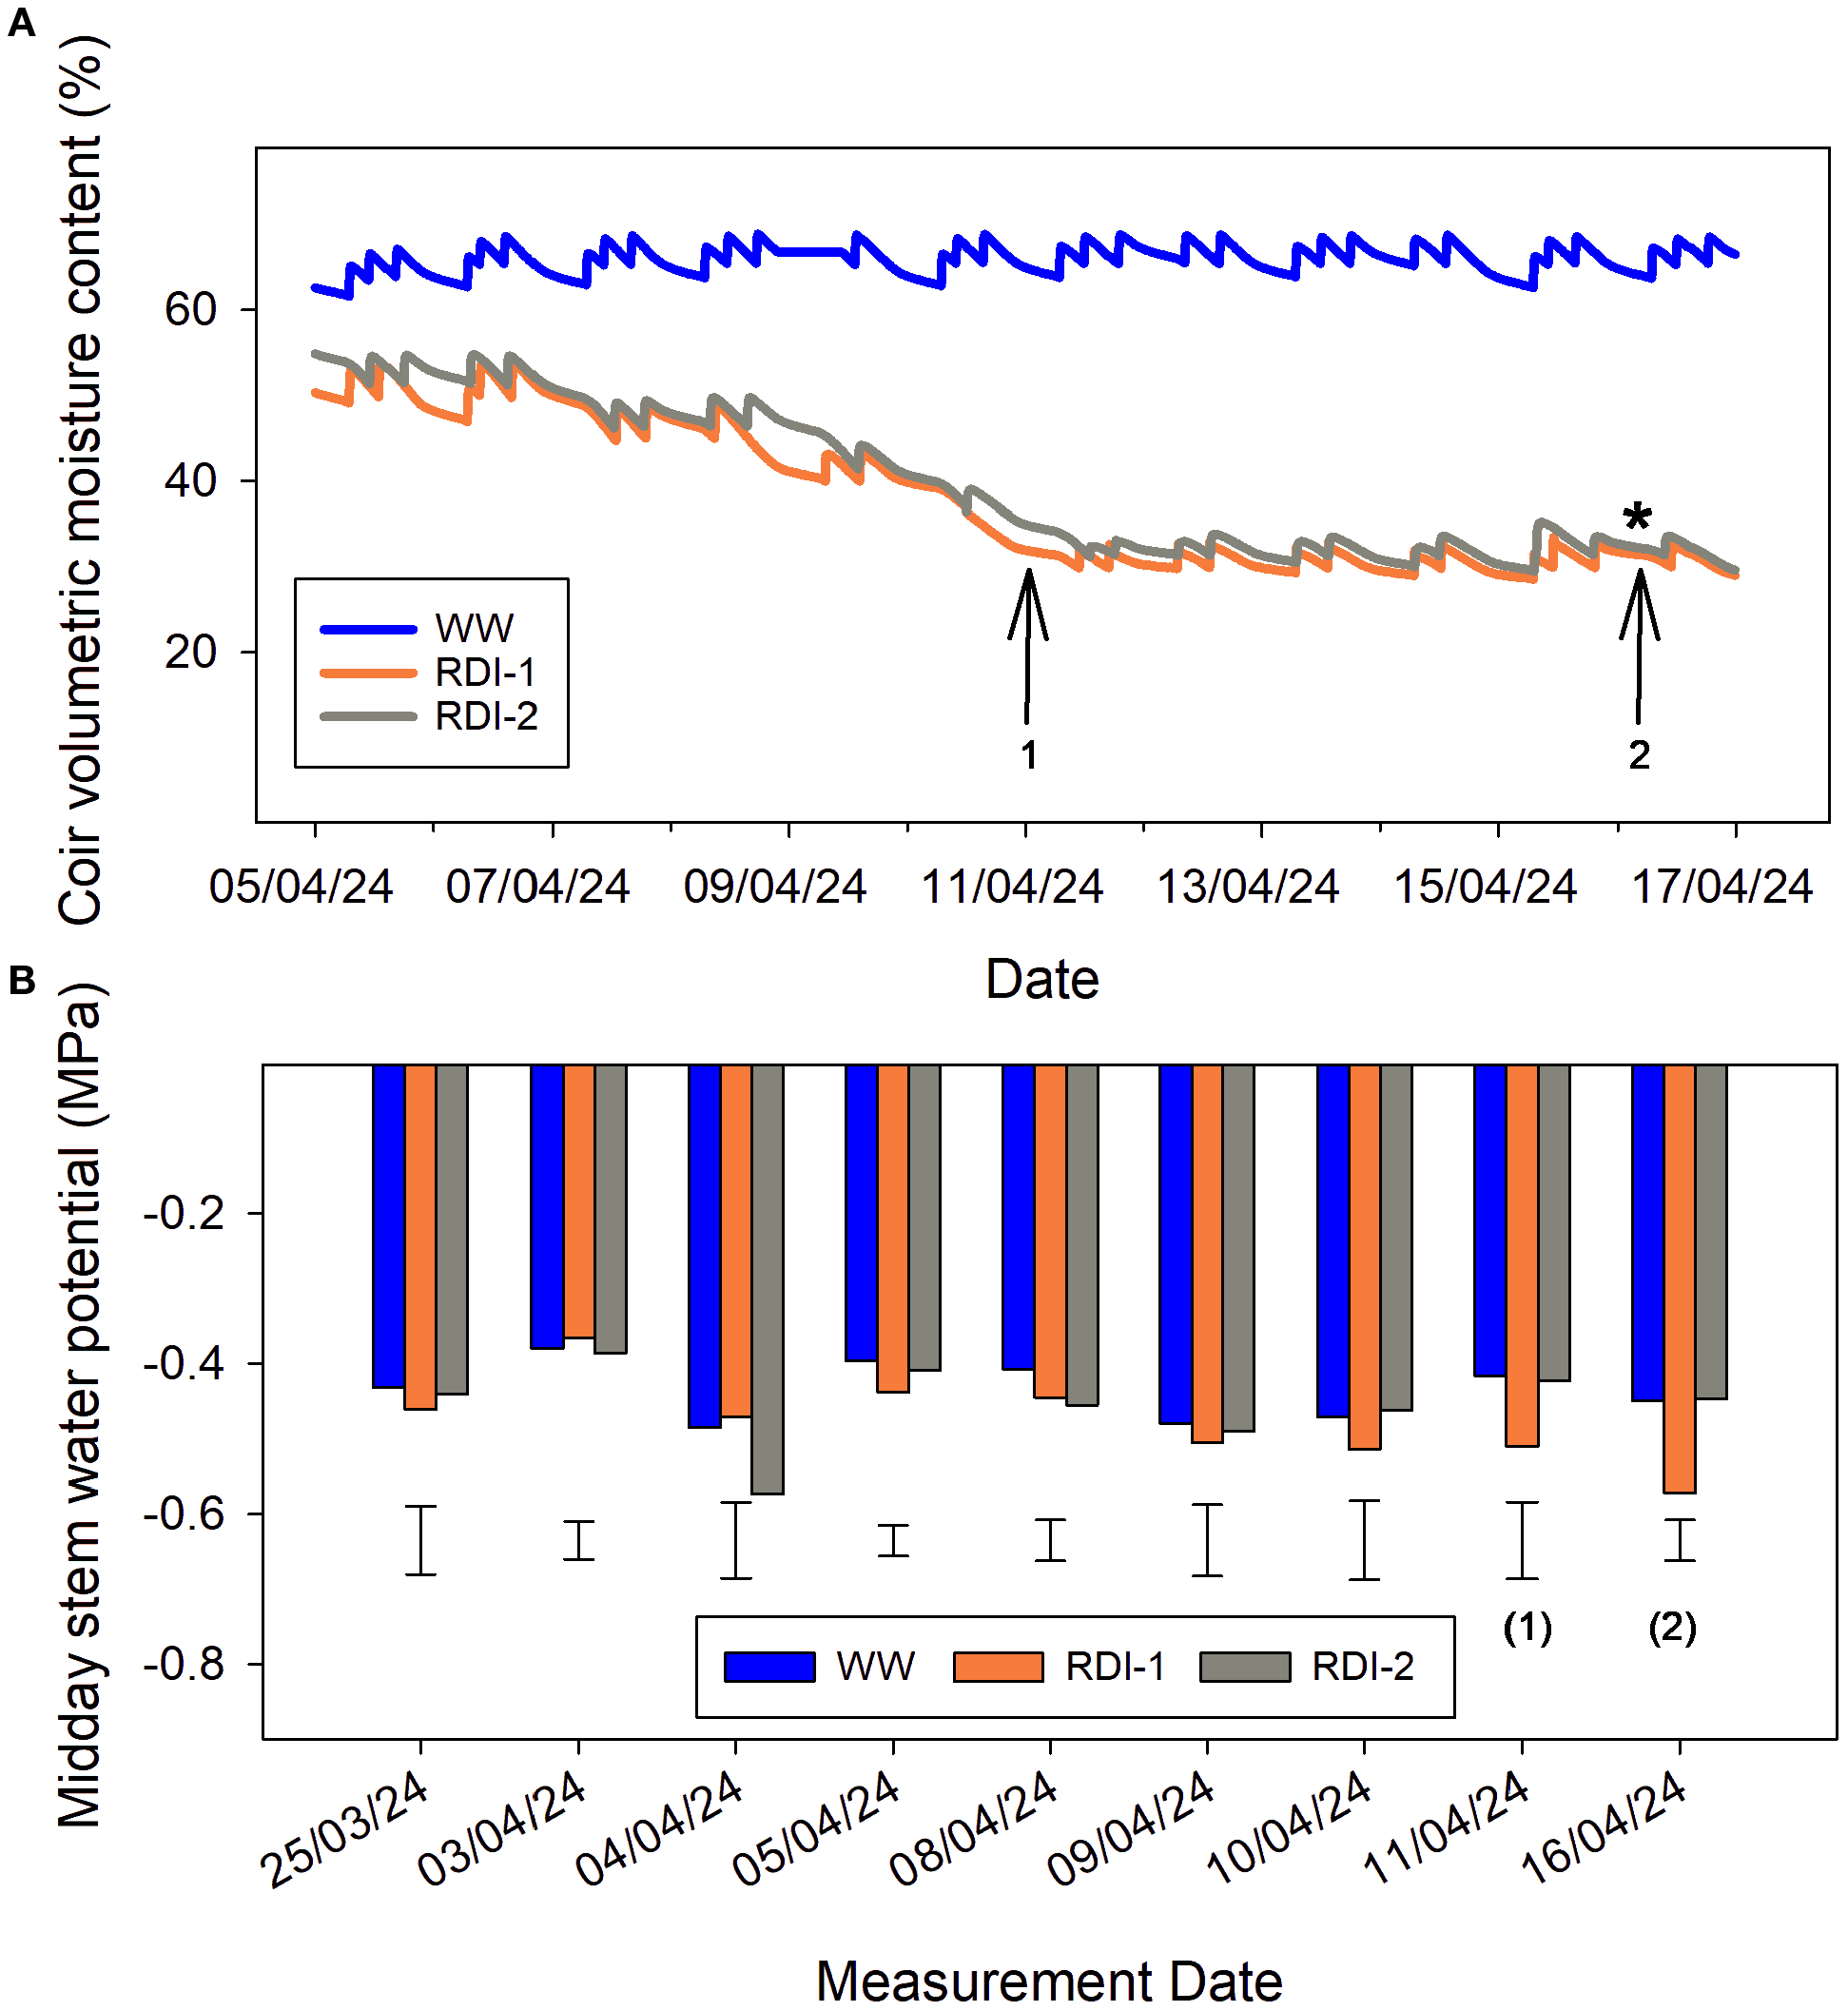
Changes in coir volumetric moisture contents (A) and midday stem water potentials (B) during the initial drying-down phase for the RDI-1 and RDI-2 treatments, compared to well-watered (WW) values. For RDI-1, treatment differences from WW values approached significance on the eighth measurement date (1) but were significant at the final date (2). The corresponding coir volumetric moisture content at (2) was used subsequently as the irrigation trigger point for both RDI treatments. Values are means of six replicate measurements; error bars represent the LSD at P < 0.05. Note the different x-axis scales in (A, B).
In RDI-1, a fertigation event was then applied to restore coir to water-holding capacity; this alternate wetting and drying approach was imposed until 25 November 2024. The fully wetted point for RDI-1 was originally set at the CVMC values of the WW treatment, coir drying created hydrophobic conditions which led to significant losses of water and fertiliser via run-off volumes. Consequently, the irrigation set point was adjusted so that daily run-off volumes did not exceed 2.5% – the corresponding CVMC value was 46%.
In RDI-2, CVMC values were maintained within a range of 30–35% throughout the experiment (Figure 3A). Irrigation events were scheduled only light periods (Figure 3B). After 25 November 2024, both RDI treatments were terminated and coir in all troughs was rewetted; Class 1 and yields were recorded to the end of extended cropping on 30 January 2025.
Figure 3

Effects of irrigation strategy on changes in CVMC measured continuously in WW and RDI-treated plants over 7 days and over 24 hours in Experiments 1 (A, B) and 2 (C, D). These time periods have been selected to demonstrate the different wetting and drying patterns resulting from the irrigation treatments imposed in each experiment. The effects of the different irrigation scheduling strategies in the RDI-1 treatments on hourly changes in CVMC are compared between experiments. Values are means of individual continuous measurements made in six replicate troughs.
2.4.2 Experiment 2
Malling Ace plants received either the WW treatment or the RDI-1 treatment, each was imposed as described above (Figure 3C). Irrigation was triggered both in light and dark periods to try to ameliorate any negative effects of RDI treatments on Class 1 yields (Figure 3D). Treatments continued until 28 November 2024 when the experiment was terminated.
2.5 Coir volumetric moisture content, coir pore electrical conductivity and run-off
In each experiment, weekly “spot” measurements of CVMC and coir pore Electrical Conductivity (E.C.). were made using a handheld Delta-T “WET” sensor calibrated for coir. Once mean values of coir pore E.C. in each treatment approached approximately 3.5 mS cm−1, flushing events were scheduled using mains water only, to prevent deleterious effects of high coir pore E.C. on fruit expansion. The number, duration, and timing of flushing events was informed by continuously monitoring changes in core pore E.C. at different positions within the trough during each flushing cycle. Flushing was ended once the mean pore E.C. values in the trough reached 1.5 mS cm−1; each flushing event was usually completed within 1 h.
In each growth room, volumes of run-off throughout the day were measured in each treatment using a raised platform and tubing to collect and channel run-off from two troughs into Decagon ECRN-50 rain gauges. The frequency of irrigation events and volumes of water applied to each treatment were recorded via an in-line water meter, with a digital output (ARAD group – water meter ARAD SF15) enabling volumes applied to be recorded. The rain gauges and in-line meter measuring run-off and input volumes were connected to the Delta-T GP2, and at the end of each day, volumes of daily input to, and run-off from each trough, and the mean daily % run-off were calculated automatically using preloaded scripts. These values were uploaded onto DeltaLINK Cloud reports and dashboards for real-time monitoring.
2.6 Irrigation application and scheduling
In each experiment, the timing and duration of irrigation events was controlled using a Galcon DC-4S unit (City Irrigation Ltd, Bromley, UK) connected to a manifold housing a DC-4S ¾” valve for each of the treatments. Within each experiment, each treatment was irrigated independently, and a fertiliser formulation was applied to each treatment from a common set of fertiliser tanks. Water was sourced from the mains to ensure a reliable supply throughout each experiment and fertigation was delivered to each trough or coir trough via dripper stakes connected to three 1.2 L/h Netafim non-return drippers.
In each TCEA experiment, Delta-T WET150 sensors were placed in every trough to measure changes in CVMC, coir temperature, and E.C. continuously. Sensors were connected to Delta-T GP2 Advanced Datalogger and Controller units and these triggered irrigation to each treatment independently once the mean CVMC value reached the target irrigation set point. For the WW treatment, the irrigation trigger point was periodically adjusted, ranging from 63% to 68% CVMC, to maintain a target run-off volume of 0.5%–2.5%. In the RDI-1 treatment, irrigation was triggered when the average CVMC reached 30%, with successive irrigation events applied every 30 minutes until an upper stop point was achieved. Conversely, in the RDI-2 treatment, a single irrigation event was applied when the average CVMC reached 30%, and no further irrigation occurred until the 30% trigger point was reached again. The GP2s were connected in series to a solar-powered Delta-T GPRS modem which allowed remote access for daily monitoring and adjustment of the irrigation set points.
2.7 Fertigation and plant husbandry
Throughout each experiment, advice on crop husbandry, fertiliser formulations, and pest and disease control were provided by a consultant agronomist. All plants were fertigated from three 25 L stock tanks, one containing calcium nitrate, potassium nitrate and iron EDTA (Tank A); the second containing magnesium sulphate, potassium nitrate, monopotassium phosphate and trace elements (Tank B) and the third containing 70% nitric acid, at 1% dilution (Tank C).
The E.C. and pH of the diluted feed solution at the drippers were measured weekly with a portable conductivity meter (Myron-L-6Psi). Dosatrons were used to adjust the E.C. and pH at the dripper to deliver the required nutrients at different stages of plant development and cropping. “Spot” measurements of coir pore E.C. were measured weekly with a Delta-T “WET” sensor calibrated for coir.
Two different fertiliser formulations were applied depending on whether plants in each of the experiments were in vegetative or fruiting stages. vegetative fertiliser formulation was supplied from planting to 27 March 2024 after which a fruiting formulation was applied. The vegetative formulation had elevated levels of nitrogen, potassium, and magnesium compared to the fruiting formulation, resulting in an E.C. of approximately 2.26 and a K∶N ratio of about 1.2. The fruiting formulation had a lower overall E.C., around 1.79, and a K∶N ratio below 1 to support fruit development and berry organoleptic quality.
Natupol seeds hives with 15 male bumblebees and male blood (Bombus Terrestis spp; Koppert, UK) were placed in both growth rooms on 11 March 2024 to ensure good pollination of the emerging strawberry flowers. Hives were replaced every 4 weeks, with some supplementary hand-pollination when needed between hive replacements.
2.8 Measurement of physiological parameters
Midday SWP of young, fully expanded leaves was determined using a Skye SKPM 1400 pressure chamber (Skye Instruments Ltd, UK); selected leaves were covered carefully with aluminium foil for 90 min prior to measurement (McCutchan and Shackel, 1992). “Spot” measurements of gas exchange in fully expanded leaves were made on two occasions in Experiment 1, on 13 and 24 June 2024, and two occasions in Experiment 2, on 17 and 24 June 2024, to determine whether the RDI treatments were impacting on stomatal conductance (gs) and net photosynthesis (Pn). Measurements were made using a portable infra-red gas analyser (LI-6800 XT, LiCor Biosciences) at a saturating light intensity of 1,500 μmol·m−2·s−1 (Mochizuki et al., 2013; Jun et al., 2017), with one measurement per trough (total n = 6 per treatment) with one measurement per trough (total n = 6 per treatment).
2.9 Class 1 yields and berry quality attributes
Ripe berries from plants in each trough were harvested twice weekly from 28 March 2024 to 30 January 2025 for Experiment 1, and from 5 April to 25 November 2024 in Experiment 2. All berries were graded based on diameter into Class 1 (≥ 27 cm) and waste (< 22 cm), and the number and FW for each category were recorded. Yield data collected at the trough level were subsequently converted to per-plant values by dividing by two prior to statistical analysis.
In all experiments, berry Soluble Solids Content (SSC) was measured once a week, in a pooled sample of juice expressed from three individual berries from each treatment in every experimental block, using a digital refractometer (Palett 100, Atago & co. Ltd, Tokyo, Japan).
2.10 Key performance indicators
In Experiments 1 and 2, KPIs were calculated for the RDI treatments up to 24 November 2024, 10-month cropping period, when treatments were ended. For WW plants in Experiment 1, KPIs were also calculated for the full 12-month cropping period, which ended 30 January 2025.
In each experiment, water use efficiency (WUE, kg/m³) was calculated by measuring the total Class 1 yield relative to the volume of irrigation water supplied. Nitrogen use efficiency (NUE, kg Class 1/kg N) was determined by dividing total Class 1 yield by the total nitrogen applied through fertigation. In the TCEA experiments, energy use efficiency (EUE) was calculated as Class 1 yield per light energy input (g/kWh), using energy consumption data from the lighting modules.
In each case, economic performance was evaluated by estimating gross income (£/m²), derived by multiplying the Class 1 yield per square meter by the market price of strawberries (£/kg).
2.11 Statistical analyses
Statistical analyses were carried out using Genstat 22nd Edition (VSN International Ltd). To determine whether differences between treatments were statistically significant, ANOVA tests were carried out and Least Significant Difference (LSD) values for p<0.05 were calculated. For yield prediction, linear regression analysis was conducted using Microsoft Excel, and the regression equations, coefficients of determination (R²) were reported.
3 Findings
3.1 Weekly “spot” measurements of CVMC and coir pore E.C.
In Experiment 1, the cumulative irrigation volume applied per plant was 30–36% less in the two RDI treatments compared to WW controls (Figure 4A). Daily volumes of run-off were greater in the RDI-1 treatment compared to WW values whilst run-off was barely measurable in the RDI-2 treatment (Figure 4B).
Figure 4

Effects of treatments applied in Experiment 1 on (A) total volume of applied irrigation (L), (B) run-off expressed as a percentage of input volumes, and (C) mean coir pore E.C. values over the course of the experiment. Irrigation applied and run-off data are the means from two troughs per treatment; coir pore E.C. was measured in six replicate troughs in each treatment.
Spot measurements of coir pore E.C. were used to track changes in the accumulation of “ballast ions” in the coir and to inform the scheduling of flushing events (Figure 4C). Coir pore E.C. values in the two RDI treatments were similar to, or lower than, changes in WW values over the experiment (Figure 4C) and so additional flushing events were not needed.
3.2 Net photosynthesis (Pn) and stomatal conductance (gs)
In Experiment 1, treatment effects on photosynthesis and stomatal conductance were measured on 13 June 2024 and 24 June 2024 (Table 1). Initially, there were no significant treatment differences (p > 0.05), and measured values of Pn were typical during cropping for this cultivar. On 24 June 2024, a significant effect of the RDI-1 treatment on Pn (p = 0.014) was noted, and gs was also lowered although not significantly (Table 1). On 13 June, the CVMC values for the WW, RDI-1, and RDI-2 treatments were 68%, 33%, and 30%, respectively; on 24 June, these values were 68%, 34%, and 32%, respectively.
Table 1
| 13 June 2024 | 24 June 2024 | |||||||
|---|---|---|---|---|---|---|---|---|
| Irrigation Treatment | Pn (µmol m−2 s−1) | gs (mol m−2 s−1) | Pn (µmol m−2 s−1) | gs (mol m−2 s−1) | ||||
| WW | 19.0 | ± 3.2 | 0.205 | ± 0.057 | 23.8a | ± 1.1 | 0.405 | ± 0.079 |
| RDI-1 | 19.2 | ± 2.6 | 0.252 | ± 0.093 | 16.5b | ± 5.9 | 0.250 | ± 0.192 |
| RDI-2 | 20.0 | ± 1.9 | 0.231 | ± 0.058 | 23.3b | ± 2.0 | 0.408 | ± 0.114 |
| Prob(f) | NS | NS | 0.014 | NS | ||||
| LSD(5%) | 5.0 | |||||||
Effects of the WW, RDI-1, and RDI-2 treatments in Experiment 1 on net photosynthesis (Pn, μmol m−2 s−1) and stomatal conductance (gs, mol m−2 s−1) in Malling Ace. “Spot” measurements were made with a Li-Cor 6800 IRGA unit during and shortly after the initial drying down phase (13 and 24 June 2024, respectively) to determine whether the RDI treatments were impacting on leaf gas exchange.
Values are means from one plant in each of six replicate troughs per treatment, with standard errors. Statistical significance was assessed using ANOVA; different letters denote significant differences at p < 0.05. NS = not significant; LSD (5%) = 5.0.
In Experiment 2, treatment effects on photosynthesis and stomatal conductance were measured on 17 June and 24 June 2024 (Table 1). No statistically significant treatment effects were noted on 17 June, but on 24 June 2024, gs was significantly lower in the RDI-1 treatment compared to WW values (Table 2). Corresponding CVMC values recorded at this time in the WW and RDI-1treatments were 57%, and 32% on the 17 June, and 57% and 36% on the June, respectively.
Table 2
| 17 June 2024 | 24 June 2024 | |||||||
|---|---|---|---|---|---|---|---|---|
| Irrigation Treatment | Pn (µmol m−2 s−1) | gs (mol m−2 s−1) | Pn (µmol m−2 s−1) | gs (mol m−2 s−1) | ||||
| WW | 20.85 | ± 2.45 | 0.300 | ± 0.10 | 21.96 | ± 0.86 | 0.405 | ± 0.07 |
| RDI-1 | 14.67 | ± 5.83 | 0.150 | ± 0.12 | 18.28 | ± 3.75 | 0.227 | ± 0.08 |
| Prob(f) | NS | NS | NS | 0.030 | ||||
| LSD(5%) | 0.154 | |||||||
Effects of the WW, and RDI-1 treatments in Experiment 2 on net photosynthesis (Pn, µmol m−2 s−1) and stomatal conductance (gs, mol m−2 s−1) in Malling Ace. “Spot” measurements were made with a Li-Cor 6800 IRGA unit during and shortly after the initial drying down phase (17 and 24 June 2024, respectively) to determine whether the RDI treatment was impacting on leaf gas exchange.
Values are means from one plant in each of six replicate troughs per treatment, with standard errors. Statistical significance was assessed using ANOVA; different letters denote significant differences at p < 0.05. NS = not significant; LSD (5%) = 5.0.
3.3 Berry fresh weight (FW), Class 1 yield and fruit number
In Experiment 1, the mean individual fruit FW for WW plants was 20 g over the cropping period but was significantly reduced (p = 0.007) in both RDI-1 (18.5 g) and RDI-2 (17.8 g) treatments (Table 3). This effect led to a lower number of fruits in the Class 1 category, with 96 and 93 per plant in the RDI-1 and RDI-2 treatments, respectively, compared to 140 in the WW treatment. By 28 November 2024 (42 weeks after planting) the cumulative Class 1 yield had reached 2,643 g/plant in WW plants but was significantly (p = 0.001) lower in RDI-1 and RDI-2 treated plants, at 1,719 and 1,601 g/plant, respectively (Figure 5).
Table 3
| Irrigation treatment | Yield (g) | N. of fruits | FW (g) | SSC (%Brix) | ||||
|---|---|---|---|---|---|---|---|---|
| WW | 2,643.17a | ± 380.62 | 139.58a | ± 17.74 | 19.98a | ± 1.55 | 8.33 | ± 0.42 |
| RDI-1 | 1,718.99b | ± 304.11 | 95.50b | ± 12.49 | 18.48b | ± 0.94 | 8.07 | ± 0.27 |
| RDI-2 | 1,601.04b | ± 188.51 | 93.08b | ± 8.63 | 17.79b | ± 0.79 | 8.69 | ± 0.30 |
| Prob(f) | 0.001 | <0.001 | 0.007 | 0.069 | ||||
| LSD(5%) | 429 | 19 | 1.2 | 0.5 | ||||
Effects of the WW, RDI-1, and RDI-2 treatments in Experiment 1 on mean Class 1 yield (g/plant), number of Class 1 fruits per plant, fruit FW (g), and SSC (%Brix) of Malling Ace after 43 weeks in the TCEA system.
Class 1 yield and fruit number data are averages from two plants in each of six replicate troughs per treatment; mean berry FW was calculated by dividing Class 1 yield by fruit number at each harvest date and averaging over the cropping period, and SSC are mean values from three ripe berries taken from plants in each of six replicate troughs per treatment. Different letters denote significant differences at p < 0.05. NS = not significant; LSD (5%) = 5.0.
Figure 5
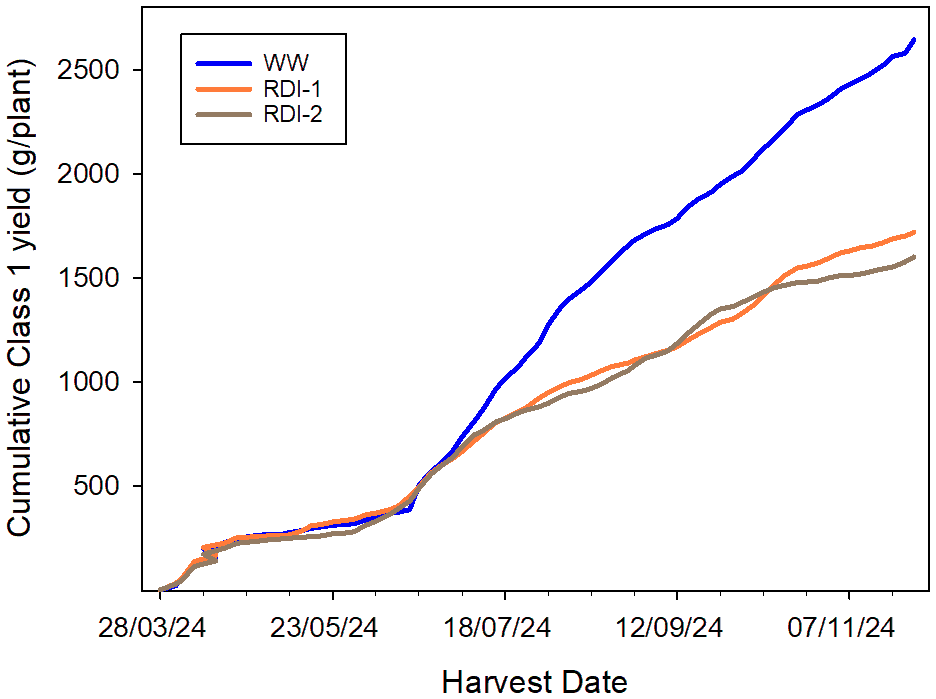
Cumulative Class 1 yields (g/plant) of Malling Ace achieved under the WW, RDI-1, and RDI-2 treatments in Experiment 1. Ripe fruits were harvested, counted, and weighed from 28 March to 28 November 2024 (43 weeks). Data are average Class 1 yields from two plants in each of six replicate troughs per treatment.
In Experiment 2, there was no significant effect of the RDI-1 treatment on Class 1 yield, number of fruits, berry FW, or SSC (Table 4). Mean Class 1 yield/plant under the WW and RDI-1 treatments were 2,183 and 2,025 g/plant, with 122 and 111 fruit/plant in this category, respectively. Mean individual berry FW was similar, 18.6 and 18.7 g in WW and RDI-1 treatments, respectively.
Table 4
| Irrigation treatment | Yield (g) | No. of fruits | FW (g) | SSC (%Brix) | ||||
|---|---|---|---|---|---|---|---|---|
| WW | 2,182.61 | ± 247.32 | 121.75 | ± 10.4 | 18.61 | ± 1.09 | 8.49 | ± 0.31 |
| RDI-1 | 2,024.75 | ± 327.64 | 111.00 | ± 12.5 | 18.71 | ± 1.77 | 8.48 | ± 0.29 |
| Prob(f) | NS | NS | NS | NS | ||||
| LSD(5%) | 444.47 | 17.93 | 2.4 | 0.32 | ||||
Effects of the WW and RDI-1 treatments in Experiment 2 on mean Class 1 yield (g/plant), number of Class 1 fruits per plant, fruit FW (g), and SSC (%Brix) of Malling Ace after 43 weeks under a split photoperiod.
Class 1 yield and fruit number data are averages from two plants in each of six replicate troughs per treatment; mean berry FW was calculated across the cropping period. SSC are mean values from three ripe berries taken from plants in each of six replicate troughs per treatment averaged over the cropping period. Different letters denote significant differences at p < 0.05. NS = not significant; LSD (5%) = 5.0.
In both experiments, a dip in flowering and fruit production occurred after the first fruit flush (13–20 weeks after planting), and a second dip was noted in Experiment 2 between 26 and 30 weeks after planting (Figure 6). In the WW treatment, Class 1 yields ranged from 1,845 to 2,493 g/plant despite all plants receiving very similar inputs. A similar range in cropping potential was noted in RDI-1 treated plants, 1,529 to 2,351 g/plant.
Figure 6
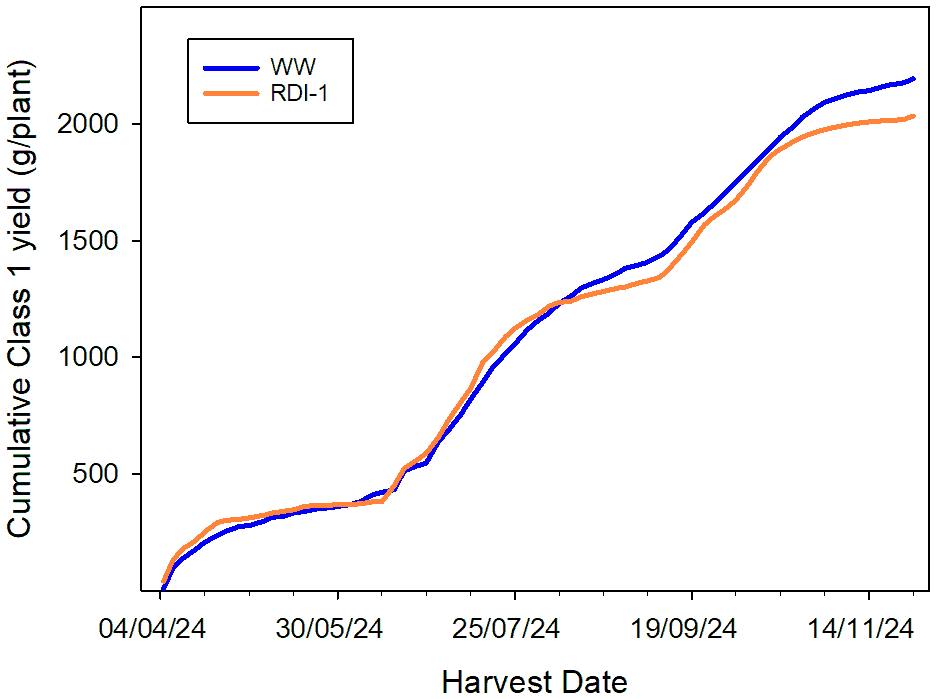
Effects of WW and RDI-1 treatments on cumulative Class 1 yield (g/plant) of Malling Ace under a split 14-hour photoperiod (Experiment 2) from 28 March to 28 November 2024. Data are average Class 1 yields from two plants in each of six replicate troughs per treatment.
3.3.1 Berry soluble solids content
In Experiment 1, apparent treatment differences in berry SSC (%Brix) values were not significant (p = 0.084). The highest SSC value recorded was 8.69 under RDI-2, followed by 8.33 in WW and 8.07 in RDI-1 (Table 3). In Experiment 2, mean berry SSC was 8.49 and 8.48 in the WW and RDI-1 treatments, respectively (Table 4).
3.3.2 Cropping potential of Malling Ace in TCEA
Following the rewetting of the RDI plants in Experiment 1 on 28 November 2024, all plants were maintained for a further 8 weeks to 1) quantify the cropping potential of Malling Ace grown in a TCEA environment for 12 months, and 2) determine whether the suppressive effects of the RDI-1 and 2 treatments on Class 1 yields were alleviated once plants were returned to WW conditions.
At the end of this 51-week growing period, the mean Class 1 yield in WW plants was 3,310 g/plant comprising 171 berries with a mean fruit FW of 19.6 g and a SSC of 8.4 (Table 5). Across all treatments and replicates, Class 1 yield per plant ranged from 2,724 g to 4,015 g. The cumulative Class 1 yield/plant increased linearly from the beginning of the start of the second fruiting flush (Figure 7). Class 1 yields in plants previously subjected to RDI treatments continued to increase at the same rate as when under RDI (data not shown).
Table 5
| Irrigation treatment | Yield (g) | N. of fruits | FW (g) | SSC (%Brix) | ||||
|---|---|---|---|---|---|---|---|---|
| WW | 3,306.66a | ± 409.22 | 178.75x | ± 19.07 | 19.39x | ± 1.15 | 8.41 | ± 0.43 |
| RDI-1 | 2,301.38b | ± 432.51 | 132.42x | ± 15.94 | 17.93x | ± 0.95 | 8.10 | ± 0.31 |
| RDI-2 | 2,120.40b | ± 276.78 | 127.75x | ± 14.99 | 17.28x | ± 0.77 | 8.66 | ± 0.27 |
| Prob(f) | <0.001 | 0.001 | 0.005 | NS | ||||
| LSD(5%) | 474.15 | 22.59 | 1.13 | |||||
Effects of the WW, RDI-1, and RDI-2 treatments in Experiment 1 on mean Class 1 yield (g/plant), number of Class 1 fruits per plant, fruit FW (g), and SSC (%Brix) of Malling Ace after 51 weeks in the TCEA system.
Values for the RDI treatments incorporate data from the 43 weeks of the RDI treatment and the 8 weeks after rewetting. Class 1 yield and fruit number data are averages from two plants in each of six replicate troughs per treatment; mean berry FW was calculated across the cropping period. SSC are mean values from three ripe berries taken from plants in each of six replicate troughs per treatment averaged over the cropping period. Different letters denote significant differences at p < 0.05. NS = not significant; LSD (5%) = 5.0.
Figure 7
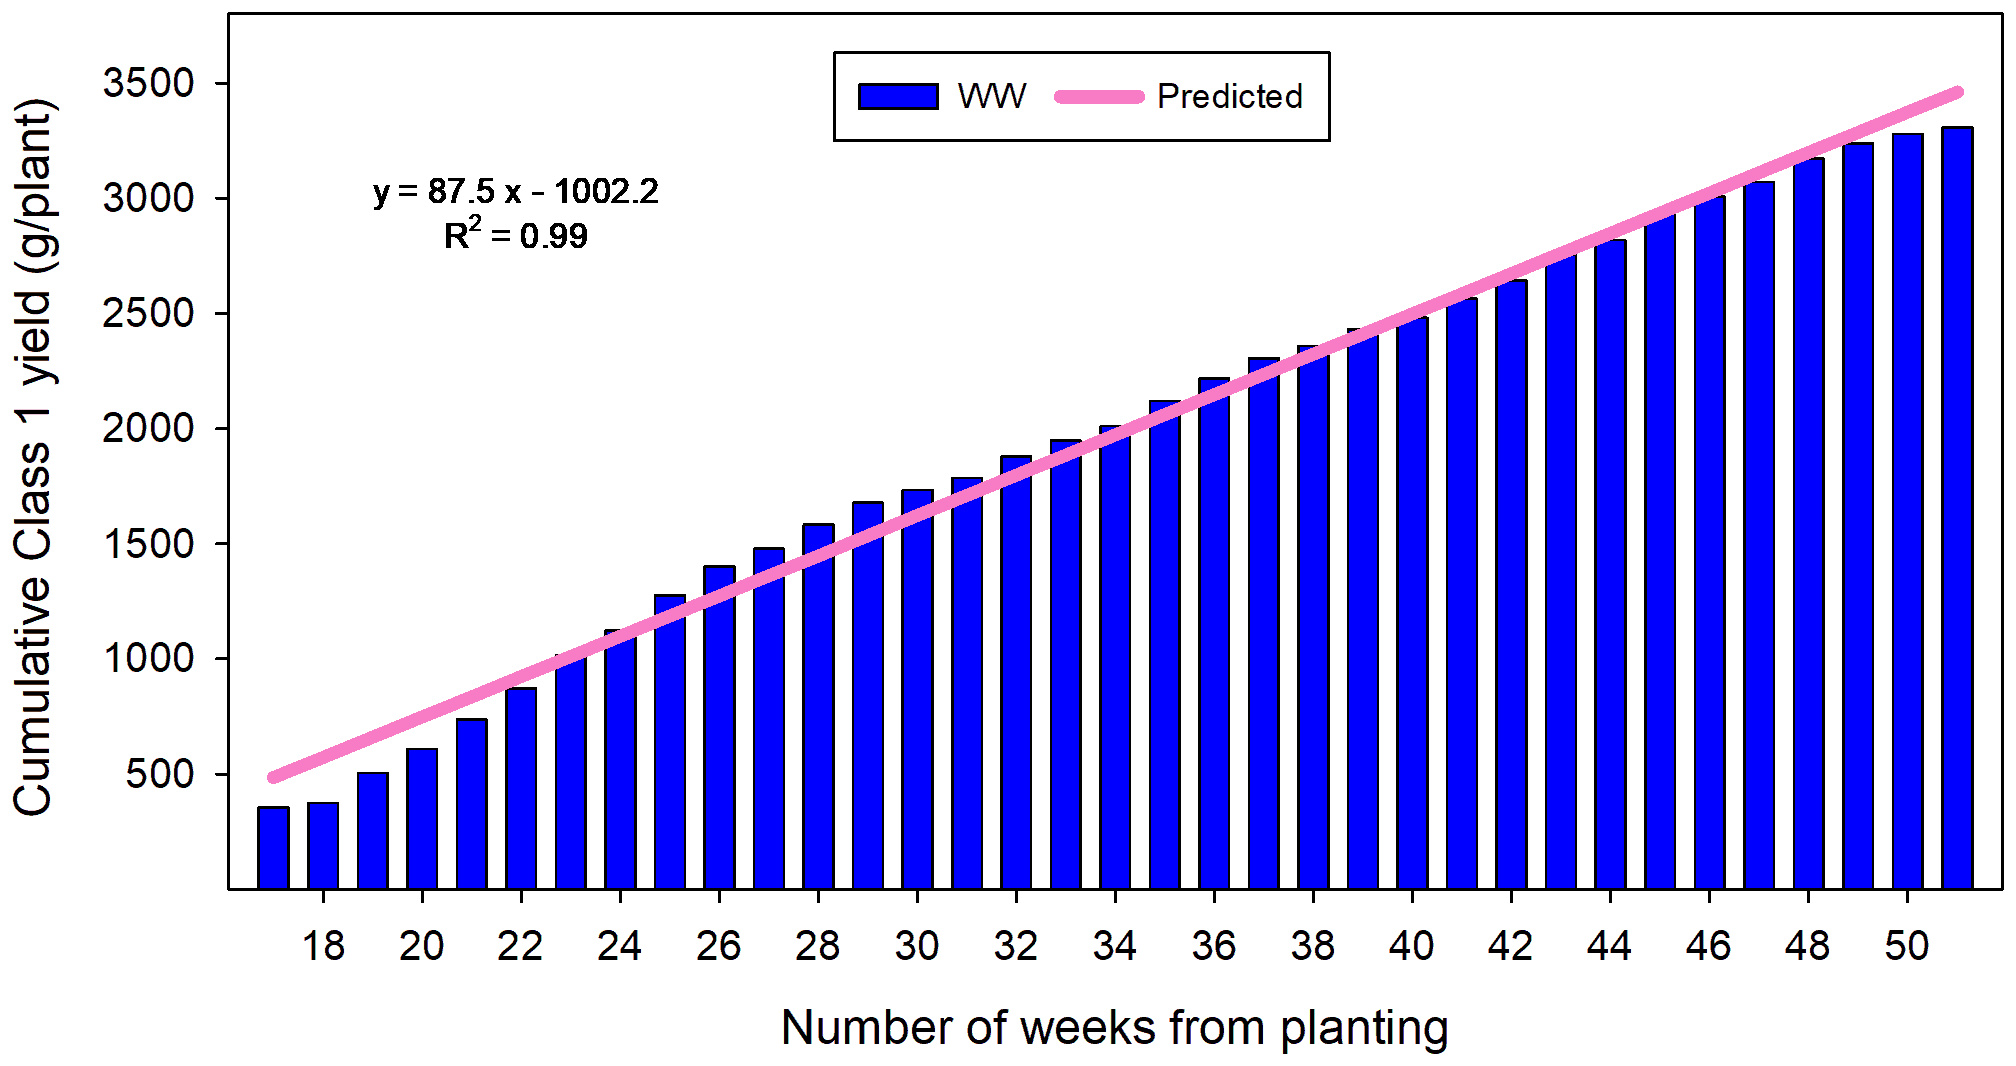
Cropping potential (Class 1 g/plant) of well-watered Malling Ace grown in TCEA under a standard photoperiod (15 h) for 12 months. Blue bars represent mean weekly cumulative yields from the beginning of cropping (Week 17 after planting, June 2024) to the end of the experiment (Week 51 after planting, February 2025). Predicting cumulative yield per plant in this growing system can be achieved by fitting a linear regression model to the mean weekly cumulative yield data (y = 87.52x −1002.2; R² = 0.99).
3.3.3 KPIs
In Experiment 1, KPIs were superior under the WW irrigation treatment compared to RDI-1 and RDI-2 treatments (Table 6). Higher yield per plant in WW consequently resulted in higher yield per m² and higher monthly mean yield per plant, whereas differences between RDI-1 and RDI-2 treatments were minimal.
Table 6
| Experiment 1 | Experiment 2 | |||||||
|---|---|---|---|---|---|---|---|---|
| 43 weeks | 51 weeks | 43 weeks | ||||||
| KPI | WW | RDI-1 | RDI-2 | WW | RDI-1 | RDI-2 | WW | RDI-1 |
| Yield (Kg·m−2) | 31.72 | 20.63 | 19.21 | 39.68 | 27.62 | 25.46 | 26.20 | 24.30 |
| Mean yield per month (g/plant) | 293.69 | 191.00 | 177.89 | 300.61 | 209.22 | 192.90 | 274.15 | 254.23 |
| WUE (kg/m3) | 21.80 | 22.50 | 18.75 | 22.39 | 24.71 | 20.74 | 26.37 | 27.24 |
| NUE (kg/kg N) | 154.57 | 171.40 | 142.99 | 163.73 | 191.36 | 161.41 | 163.89 | 174.29 |
| EUE (g/kWh) | 31.76 | 20.65 | 19.24 | 32.70 | 22.76 | 20.98 | 28.10 | 26.06 |
| Gross income (£/m−2) | 190.30 | 123.80 | 115.3 | 238.10 | 165.70 | 152.8 | 157.10 | 145.80 |
Effects of irrigation treatments on KPIs calculated for Malling Ace grown under TCEA in Experiments 1 and 2 (43 weeks), and for the extended cropping period (51 weeks).
KPIs are: Class 1 yield per m2 (kg) at a planting density of 12 plants/M; mean monthly Class 1 yield (g/plant); WUE, kg Class 1 yield/m³; NUE, kg Class 1 yield/kg N; EUE of light (g/kWh); and gross income (£/m²). Data were derived from pooled samples of two plants within each of six troughs per treatment in each experiment.
Resource use efficiencies varied across treatments (Table 6). WUE was highest under RDI-1, followed by WW, and lowest in RDI-2. Similarly, NUE was improved in RDI-1 compared to WW, suggesting that moderate deficit irrigation could enhance nutrient efficiency, although perhaps at the expense of marketable yield.
EUE followed the same pattern as yield, with the highest values observed in WW and marked reductions under both RDI treatments, reflecting lower biomass production per unit of energy consumed. Accordingly, gross income per m² was highest in WW, with lower values in RDI-1 and RDI-2 reflecting the yield penalties.
Under the extended 51-week cropping period in WW, Class 1 yield exceeded 39 kg per m², with WUE, NUE, and EUE all showing favourable values that underscore the productive potential of Malling Ace in TCEA systems.
In Experiment 2, strawberry productivity and resource use efficiency were again compared between WW and RDI-1 treatments. In this split photoperiod regime, yield per m² and average monthly Class 1 yield per plant were higher in WW, though differences were less pronounced than in Experiment 1. Under the split photoperiod, WUE and NUE values were greater in the RDI-1 treatment, indicating that water and nitrogen inputs were used more efficiently. However, EUE and gross income remained marginally greater under WW, consistent with the higher fruit yields achieved in this treatment.
4 Discussion
The sensor-based automated precision irrigation system deployed here maintained CVMC in WW plants within a narrow and optimum range throughout the 12-month experiment. The frequency and duration of fertigation events was managed to achieve a mean daily run-off value of 1.7% of input volumes over the experiment which ensured a high water use efficiency (see below). At these low run-off volumes, flushing of accumulated ions is limited and so coir pore E.C. tends to rise which, if left unchecked, would reduce fruit expansion rate and lower Class 1 yields. Eight flushing events were applied in Experiment 1, and since the water used was incorporated into the WUE calculations, further water savings could be achieved if bespoke fertiliser formulations were designed for TCEA production.
In the initial coir drying phase, we used the CVMC value at which significant changes in midday SWP were first detected in vegetative plants, relative to WW values, as the irrigation set point for subsequent irrigation events. In longer-term experiments, this approach is preferable to replacing a percentage of the evapotranspiration measured in well-watered plants at each irrigation event to impose a deficit irrigation stress (e.g. Grant et al., 2010) since some plants adapt by reducing canopy area (Saveé et al., 1993). In combination with stomatal closure, these long-term adaptive responses reduce water demand and so over time. even 70% of well-watered irrigation can result in substrate moisture contents in supposedly RDI-treated plants gradually returning to well-watered conditions.
Spot measurements during the cropping phase under a typical photoperiod (Experiment 1) confirmed that the RDI treatments altered leaf gas exchange and shoot water balance, although the CVMC at the time of the measurements influenced values of Pn and gs. Despite the intermittent nature of the reduced leaf gas exchange under both RDI strategies, total Class 1 yields were reduced by 30–36% in RDI-treated plants due to effects on both berry number and FW. These effects were first noted at the beginning of the second fruiting flush, suggesting that RDI suppressed flower initiation and/or expression and also reduced berry FW. The latter effect is well known (Liu et al., 2007; Grant et al., 2010; Weber et al., 2017; Yang et al., 2025) but berry FW under the deficit irrigation treatments reported here (17.8–18.48 g) is notably higher than those reported by Grant et al. (2010), (5.5–10.1 g across cultivars) and Weber et al. (2017) (10.44–11.71 g across cultivars and treatments). Again, cultivar differences are evident with Ariza et al. (2021), with their lowest observed berry FW of 23.8 g under deficit irrigation.
The lower Class 1 fruit number in RDI-treated plants in Experiment 1 aligns with the findings of Liu et al. (2007), who also reported a slight, though not statistically significant, reduction in berry number per plant under deficit irrigation. Weber et al. (2017) reported a slight reduction in fruit number over a three-month deficit irrigation experiment but again, differences were not significant. Our experiments extended over a longer duration (10 cropping months) compared to those reported by Liu et al. (2007), which lasted only three months. This prolonged exposure to RDI may have amplified the suppressive effects of RDI on flower initiation and expression. Similar responses to deficit irrigation have been reported in other studies (Grant et al., 2010; Yang et al., 2025), although one cultivar (“Idea”) in the first study showed an increase in yield under deficit conditions. Responses to RDI are cultivar-specific: cropping of “Eve’s Delight” yield was significantly reduced by deficit irrigation but not that of “Flamenco”. Indeed, water-stressed strawberries often exhibit increased root:shoot ratios resulting from slowed above-ground growth, an adaptive response to rootzone water deficits (Grant et al., 2010; Martínez-Ferri et al., 2016). This reallocation of resources, coupled with stress-induced hormonal changes such as elevated abscisic acid concentrations, is likely to result in flower inhibition leading to lower Class 1 yields in RDI treatments (Terry et al., 2009).
Between the two RDI treatment in Experiment 1, Class 1 yield, berry number, and individual berry FW were lower in the RDI-2 compared to the RDI-1 treatment, these differences were not significant. The yield penalties incurred under the RDI treatments were due to a combination of effects on berry FW and the number of fruits in all categories, not just the Class 1 category. Class 1 yields had, in fact, begun to diverge from WW values in mid-July 2024 (Figure 5) at the beginning of the second fruiting flush, these later flowers would have been initiated under TCEA conditions.
In Experiment 2, no negative effects of RDI on Class 1 yields were observed but effects on leaf gas exchange were again detected. We suggest that the shorter light periods lowered the cumulative daily stress of RDI-treated plants such that flower initiation, expression, and fruit size was not affected, relative to WW values. Irrigation in the dark period was also allowed whenever the set point was reached in Experiment 2, and this too presumably helped to alleviate RDI stress-induced effects on flower initiation, expression, and berry size.
At the end of the cropping periods, total Class 1 yields per plant were lowered by 17% in WW plants under the split photoperiod in Experiment 2, compared to those in Experiment 1 (Tables 3, 4). This was again due to effects on both fruit number and berry FW, but since the percentage of waste fruit were similar in each experiment (data not shown), the split photoperiod presumably affected flower initiation and expression. Preliminary data also suggest that the split photoperiod reduced bee activity and, therefore, pollination efficiency (Arnold, unpublished) and this could also have impacted on Class 1 yields. The daily photoperiod in Experiment 2 was also 1 h shorter leading to a lower DLI than in Experiment 1, and since Class 1 yields are closely correlated with light availability (Doddrell, 2023), this too could have lowered cropping potential. Despite these negative effects of split photoperiods on productivity even in WW plants, the potential saving in energy cost afforded by this strategy might be sufficiently compelling to make this approach economically viable in commercial TCEA systems, especially since the 2.2 kg Class 1 fruit achieved here is already above that budgeted for by many commercial vertical farming businesses (Alvarado-Camarillo et al., 2024; Hutchinson et al., 2025).
Soluble sugar content can be promoted by deficit irrigation in strawberry (Yang et al., 2025) but Ariza et al. (2021) reported that only one of the cultivars tested, “Sabrina”, had higher SSC values under the two most extreme deficit irrigation treatments (T65 and T85). Often, SSC values are higher in smaller fruit simply due to less dilution, and so the apparent accumulation of sugars is passive and not active (Else and Atkinson, 2010). Here, although the RDI treatments in Experiment 1 significantly reduced berry FW, this effect was not enough to raise berry SSC values.
In both experiments, the yield gap observed after the first fruiting flush (weeks 13–20 after planting) in WW plants is most likely due to a lack of differentiated flowers in the meristem during the propagation phase (Heide et al., 2013), which then led to reduced flower expression. Propagule variability is a major challenge in the strawberry industry and can have significant effects on cropping potential, pesticide requirements, fruit waste, and overall farm emissions, ultimately limiting productivity and profitability (Durner et al., 2002; Naing et al., 2019). A second drop in productivity was noted in WW plants in Experiment 2, but not in Experiment 1. Similar off-periods have been reported by Melis (2020) and Sønsteby et al. (2021), with the length and severity of the effect seemingly related to crop load. Sønsteby et al. (2021) suggested that the potential reason for this reduction could be source limitation for flower initiation, which could have occurred here under the split photoperiod and lower DLI in Experiment 2.
Growing Malling Ace in TCEA for 12 months delivered mean Class 1 yields of 3.3 kg/plant, equivalent to nearly 40 kg/m2. As a comparison, Malling Ace sourced from the same commercial supplier in 2024 was grown in conventional polytunnel substrate table-top production at East Malling. Cropping began in June and ended in early October and Class 1 yield per plant averaged 1.05 kg, equivalent to 12.6 kg/m2. Although Class 1 yields of 1.4–1.6 kg/plant from Malling Ace in polytunnel table-top production can be achieved in years in which light availability is high (e.g. 2023), our work shows that cropping potential under TCEA could be much greater. If production in TCEA was timed to deliver locally sourced fruit between October and April, higher prices for out-of-season berries would help to offset the variable costs of production (Kozai et al., 2020), particularly if smart energy use was deployed (Avgoustaki and Xydis, 2021).
Flowers in the first fruiting flush were initiated during the propagation phase in the previous year, and the 5–6-week lag between the first and second flower flushes suggests that conditions in the commercial propagation facility at that time were not entirely favourable for flower initiation. From the second fruit flush of WW plants onwards, the yield trajectory of Malling Ace plants followed a steady, linear trajectory (Figure 7). Such a predictable yield pattern not only underscores the cultivar’s capacity for sustained cropping performance under TCEA but also provides a robust foundation for developing accurate yield forecasting models when coupled with precisely regulated environmental parameters and effective husbandry and pollination strategies.
Values of water use efficiency, expressed as kg Class 1 fruit per m3 of water applied, were highest in the RDI-1 (27.24 kg/m3) and WW (26.37 kg/m3) treatments in Experiment 2. In Experiment 1, WUE values were highest under the RDI-1 treatment and lowest in the RDI-2 treatment. The latter was due to a combination of stress effects on Class 1 yield and on the relatively larger volume of water needed to rewet the drying coir due to its hydrophobic nature. These observations are important for optimising deficit irrigation strategies, since maintaining low substrate moisture contents can undermine water savings by increasing the volume required to overcome substrate hydrophobicity (Fields et al., 2014). Dodd and Kudoyarova (2021) observed similar trends and noted that moderate water restriction could optimise water-use efficiency but may compromise overall yield. Early work by Dodds (2008) reported that an RDI regime in which 80% of well-watered evapotranspiration rates was applied was optimal for water savings and Class 1 yields of the June-bearer “Elsanta”, and 70–80% of field capacity was recommended for balancing yield and quality with water savings (Yang et al., 2025) .
Generally, our findings were consistent with other studies (Liu et al., 2007; Yang et al., 2025), demonstrating deficit irrigation enhanced WUE in strawberries. Grant et al. (2010) reported improved WUE under deficit irrigation, with cultivars such as “Elsanta”, “Symphony”, and “Elvira” achieving WUE values of 25.4, 22.7, and 21.6 g/L, respectively; comparable to WUE levels observed in this study. However, Grant et al. (2010) also noted considerable variation amongst cultivars, with some exhibiting substantially lower WUE. In general, the increase in WUE under deficit irrigation is attributed to reduced gs, which lowers transpiration rates, thereby improving WUE (Ariza et al., 2021).
Treatment effects on NUE were similar to those reported for WUE which was expected since fertigation was applied to all plants and inputs were determined by demand for water. Accordingly, the NUE was greater in the RDI-1 treatments in both experiments. Enhanced absorption of nitrogen has also been reported in RDI treatments of studies of other crops (Li et al., 2010; Wang et al., 2013).
The EUE of lighting and the gross income per m2 were highest in WW treatments reflecting the higher Class 1 yields achieved under these treatments. In Experiment 1, values were comparable between the two RDI treatments and followed a similar trend during the extended cultivation period. Notably, EUE and gross income under RDI-1 were higher under Experiment 2 than Experiment 1 due to the maintenance of Class 1 yields in RDI-treated plants. The EUE and gross income recorded under TCEA in this study is substantially greater than those reported for greenhouse or open-field strawberry cultivation (Banaeian et al., 2011), due to outstanding yield outputs of TCEA and the prolonged cultivation period comparing to other CEA or open field.
Whilst this study demonstrated the potential of deficit irrigation to conserve water and enhance nitrogen use efficiency in strawberry production, it also highlighted a trade-off with yield and fruit quality. To comprehensively evaluate the feasibility of RDI strategies for commercial application, future research should consider additional critical parameters such as energy consumption and economic viability. Furthermore, given the documented variability in deficit irrigation thresholds across strawberry cultivars, identifying cultivar-specific irrigation regimes is essential to effectively balance yield maintenance and resource conservation. Finally, whilst split photoperiods present a promising avenue for mitigating yield and fruit quality reductions observed under deficit irrigation in TCEA conditions, further investigation is warranted to fully understand their impact on plant physiology, pollinator activity and efficiency, fruit biochemical composition, and post-harvest performance.
Statements
Data availability statement
The raw data supporting the conclusions of this article will be made available by the authors, without undue reservation.
Author contributions
AKZ: Funding acquisition, Writing – original draft. JT: Data curation, Formal analysis, Visualization, Writing – review & editing. MD: Data curation, Formal analysis, Visualization, Writing – review & editing. ME: Funding acquisition, Investigation, Methodology, Project administration, Supervision, Writing – review & editing.
Funding
The author(s) declare that financial support was received for the research and/or publication of this article. This research was conducted as part of the project “Optimising the propagation environment in TCEA systems to maximise strawberry yield potential in all production systems”, funded by DEFRA through the Industrial Strategy Challenge Fund (ISCF) and the Farming Innovation Programme – Small R&D Projects Round 2 (Project Reference: 10052449). The project runs from June 2023 to May 2026 and is a Collaborative R&D initiative.
Acknowledgments
We gratefully acknowledge the support of the technical staff at Niab, whose assistance with cultivation, data collection, and husbandry activities was invaluable throughout the duration of the experiment. We also extend our sincere thanks to the lead organisation of the project, Vertical Future Ltd, and our industry partners: Berry Gardens Growers Ltd, The Blaise Plant Company Ltd, Cocogreen Ltd, Clock House Farm Ltd, Delta-T Devices Ltd, Hugh Lowe Farms Ltd, Linton Growing Ltd, and the University of Reading, for their collaboration and support. The study also benefited from agronomic input provided by Mr Steven Kember.
Conflict of interest
The authors declare that the research was conducted in the absence of any commercial or financial relationships that could be construed as a potential conflict of interest.
Generative AI statement
The author(s) declare that no Generative AI was used in the creation of this manuscript.
Publisher’s note
All claims expressed in this article are solely those of the authors and do not necessarily represent those of their affiliated organizations, or those of the publisher, the editors and the reviewers. Any product that may be evaluated in this article, or claim that may be made by its manufacturer, is not guaranteed or endorsed by the publisher.
Footnotes
1.^Stavridou, E., and Else, M. Nitrogen demand modelling on cultivation of strawberries.
References
1
Akhtar I. Rab A. (2015). Effect of irrigation intervals on the quality and storage performance of strawberry fruit. J. Anim. Plant Sci. 25 (3).
2
Alvarado-Camarillo D. Valdez-Aguilar L. A. Cartmill D. L. Cartmill A. D. (2024). Strawberry grown in an indoor vertical farm responds to increased photosynthetic photon flux density when calcium is supplied at higher concentrations. HortScience.59, 1806–1814. doi: 10.21273/HORTSCI18230-24
3
Ariza M. T. Miranda L. Gómez-Mora J. A. Medina J. J. Lozano D. Gavilán P. et al . (2021). Yield and fruit quality of strawberry cultivars under different irrigation regimes. Agronomy11, 261. doi: 10.3390/agronomy11020261
4
Avgoustaki D. D. Xydis G. (2021). Energy cost reduction by shifting electricity demand in indoor vertical farms with artificial lighting. Biosyst. Engineering.211, 219–229. doi: 10.1016/j.biosystemseng.2021.09.006
5
Banaeian N. Omid M. Ahmadi H. (2011). Energy and economic analysis of greenhouse strawberry production in Tehran province of Iran. Energy Conversion Management.52, 1020–1025. doi: 10.1016/j.enconman.2010.08.030
6
Chai Q. Gan Y. Zhao C. Xu H. L. Waskom R. M. Niu Y. et al . (2015). Regulated deficit irrigation for crop production under drought stress. A review. Agron. Sustain. Dev.36, 1. doi: 10.1007/s13593-015-0338-6
7
Chen Y. Zhang J. H. Chen M. X. Zhu F. Y. Song T. (2023). Optimizing water conservation and utilization with a regulated deficit irrigation strategy in woody crops: A review. Agric. Water Management.289, 108523. doi: 10.1016/j.agwat.2023.108523
8
DEFRA (2024). “Horticultural statistics – dataset (Excel) 2023,” in National statistics (London, UK: Department for Environment, Food & Rural Affairs). Available at: https://www.gov.uk/government/statistics/latest-horticulture-statistics.
9
DEFRA (2025). Statistical data set Wholesale fruit and vegetable prices – Weekly price time series 2015 to 2025.ods (London, UK: Department for Environment, Food & Rural Affairs).
10
Dodd I. C. Kudoyarova G. (2021). Water uptake in drying soil: balancing supply and demand. Root Syst. Sustain. Agric. Intensification, 245–270. doi: 10.1002/9781119525417.ch9
11
Doddrell N. H. (2023). Realising increased photosynthetic efficiency to increase strawberry yields. (Reading, UK: University of Reading).
12
Dodds P. A. A. (2008). Using PRD and RDI to save water, reduce vegetative vigour, and improve fruit quality in strawberry. (East Malling: Lancaster University and East Malling Research).
13
Dodds P. A. A. Taylor J. M. Else M. A. Atkinson C. J. Davies W. J. (2007). Partial rootzone drying increases antioxidant activity in strawberries. Acta Horticulturae.744), 295–302. doi: 10.17660/ActaHortic.2007.744.30
14
Durner E. F. Poling E. B. Maas J. L. (2002). Recent advances in strawberry plug transplant technology. HortTechnology.12, 545–550. doi: 10.21273/HORTTECH.12.4.545
15
Else M. Atkinson C. (2010). Climate change impacts on UK top and soft fruit production. Outlook Agriculture.39, 257–262. doi: 10.5367/oa.2010.0014
16
FAO (2025). Agricultural data/Agricultural production/Crops primary/Strawberries (Rome, Italy: FAOSTAT). Available online at: https://www.fao.org/faostat/en/data/QCL.
17
Fereres E. Soriano M. A. (2007). Deficit irrigation for reducing agricultural water use. In. J. Exp. Botany.58, 147–159. doi: 10.1093/jxb/erl165
18
Fields J. S. Fonteno W. C. Jackson B. E. (2014). Hydration efficiency of traditional and alternative greenhouse substrate components. HortScience.49, 336–342. doi: 10.21273/HORTSCI.49.3.336
19
Giné Bordonaba J. Terry L. A. (2010). Manipulating the taste-related composition of strawberry fruits (Fragaria × ananassa) from different cultivars using deficit irrigation. Food Chem.122, 1020–1026. doi: 10.1016/j.foodchem.2010.03.060
20
Grant O. M. Johnson A. W. Davies M. J. James C. M. Simpson D. W. (2010). Physiological and morphological diversity of cultivated strawberry (Fragaria × ananassa) in response to water deficit. Environ. Exp. Botany.68, 264–272. doi: 10.1016/j.envexpbot.2010.01.008
21
Heide O. M. Stavang J. A. Sønsteby A. (2013). Physiology and genetics of flowering in cultivated and wild strawberries – A review. J. Hortic. Sci. Biotechnol.88, 1–18. doi: 10.1080/14620316.2013.11512930
22
Hutchinson G. K. Nguyen L. X. Ames Z. R. Nemali K. Ferrarezi R. S. (2025). Substrate system outperforms water-culture systems for hydroponic strawberry production. Front. Plant Science.16, 1469430. doi: 10.3389/fpls.2025.1469430
23
Jensen N. L. Jensen C. R. Liu F. Petersen K. K. (2009). Water relations and abscisic acid in pot-grown strawberry plants under limited irrigation. J. Am. Soc. Hortic. Science.134), 574–580. doi: 10.21273/JASHS.134.5.574
24
Johnson A. W. Simpson D. W. (2014). The effect of deficit irrigation on the flowering behaviour of two day-neutral and one everbearing strawberry cultivar. Acta Horticulturae.1049, 435–438. doi: 10.17660/ActaHortic.2014.1049.61
25
Jun H. Jung H. Imai K. (2017). Gas exchange characteristics of a leading cultivar of Korean strawberry (Fragaria × ananassa, ‘Sulhyang’). Scientia Horticulturae.221, 10–15. doi: 10.1016/j.scienta.2017.04.009
26
Kouloumprouka Zacharaki A. Monaghan J. M. Bromley J. R. Vickers L. H. (2024). Opportunities and challenges for strawberry cultivation in urban food production systems. Plants People Planet. 6 (3), 611–621. doi: 10.1002/ppp3.10475
27
Kozai T. Genhua. N. Michiko T. (2020). Plant factory : an indoor vertical farming system for efficient quality food production. (London, UK: Academic Press), 518.
28
Kozai T. Sasaki S. (2013). Resource use efficiency of closed plant production system with artificial light: Concept, estimation and application to plant factory. Proc. Japan Academy Ser. B.89, 447–461. doi: 10.2183/pjab.89.447
29
Li F. Yu J. Nong M. Kang S. Zhang J. (2010). Partial root-zone irrigation enhanced soil enzyme activities and water use of maize under different ratios of inorganic to organic nitrogen fertilizers. Agric. Water Management.97, 231–239. doi: 10.1016/j.agwat.2009.09.014
30
Lieten P. (2013). Advances in strawberry substrate culture during the last twenty years in the Netherlands and Belgium. Int. J. Fruit Science.13, 84–90. doi: 10.1080/15538362.2012.697024
31
Liu F. Savić S. Jensen C. R. Shahnazari A. Jacobsen S. E. Stikić R. et al . (2007). Water relations and yield of lysimeter-grown strawberries under limited irrigation. Scientia Horticulturae.111, 128–132. doi: 10.1016/j.scienta.2006.10.006
32
Lu J. Shao G. Cui J. Wang X. Keabetswe L. (2019). Yield, fruit quality and water use efficiency of tomato for processing under regulated deficit irrigation: A meta-analysis. Agric. Water Management.222, 301–312. doi: 10.1016/j.agwat.2019.06.008
33
Marcellini M. Raffaelli D. Mazzoni L. Pergolotti V. Balducci F. Armas Diaz Y. et al . (2023). Effects of different irrigation rates on remontant strawberry cultivars grown in soil. Horticulturae9. doi: 10.3390/horticulturae9091026
34
Martínez-Ferri E. Soria C. Ariza M. T. Medina J. J. Miranda L. Domíguez P. et al . (2016). Water relations, growth and physiological response of seven strawberry cultivars (Fragaria×ananassa Duch.) to different water availability. Agric. Water Management.164, 73–82. doi: 10.1016/j.agwat.2015.08.014
35
McCutchan H. Shackel K. A. (1992). Stem-water Potential as a Sensitive Indicator of Water Stress in Prune Trees (Prunus domestica L. cv. French). J. Am. Soc. Hortic. Science.117, 607–611. doi: 10.21273/JASHS.117.4.607
36
Melis P. (2020). “Manipulation of everbearers to steer harvest peaks and yielding. International soft fruit conference’s-hertogenbosch,” in International soft fruit conference’s-hertogenbosch, holland (s-Hertogenbosch, Holland: International Soft Fruit Conference). Available at: http://goodberry-eu.eu/fileadmin/goodberry/appliedpublications/3737.
37
Mochizuki Y. Iwasaki Y. Funayama M. Ninomiya S. Fuke M. New Y. Y. et al . (2013). Analysis of a high-yielding strawberry (Fragaria ×ananassa duch.) cultivar ‘Benihoppe’ with focus on dry matter production and leaf photosynthetic rate. J. Japanese Soc. Hortic. Science.82, 22–29. doi: 10.2503/jjshs1.82.22
38
Moriana A. Pérez-López D. Prieto M. H. Ramírez-Santa-Pau M. Pérez-Rodriguez J. M. (2012). Midday stem water potential as a useful tool for estimating irrigation requirements in olive trees. Agric. Water Management.112, 43–54. doi: 10.1016/j.agwat.2012.06.003
39
Naing A. H. Kim S. H. Chung M. Y. Park S. K. Kim C. K. (2019). In vitro propagation method for production of morphologically and genetically stable plants of different strawberry cultivars. Plant Methods15, 1–10. doi: 10.1186/s13007-019-0421-0
40
Nicoll M. Galletta G. J. (1987). Variation in growth and flowering habits of Junebearing and everbearing strawberries. J. Am. Soc. Hortic. Science.112, 872–880. doi: 10.21273/JASHS.112.5.872
41
Nishimoto Y. Lu N. Ichikawa Y. Watanabe A. Kikuchi M. Takagaki M. (2023). An evaluation of pollination methods for strawberries cultivated in plant factories: robot vs hand. Technol. Horticulture.3, 0–0. doi: 10.48130/TIH-2023-0019
42
Perin E. C. da Silva Messias R. Borowski J. M. Crizel R. L. Schott I. B. Carvalho I. R. et al . (2019). ABA-dependent salt and drought stress improve strawberry fruit quality. Food Chem.271, 516–526. doi: 10.1016/j.foodchem.2018.07.213
43
Raffle S. Irving R. Moore G. (2010a). Factsheet Strawberry: Extending the UK strawberry season using a range of plant types and growing systems (Coventry, UK: AHDB).
44
Raffle S. Robert I. Graham M. (2010b). “Extending the UK strawberry growing season using a range of plant types and growing systems,” in AHDB (Coventry, UK: AHDB). Available at: https://horticulture.ahdb.org.uk/knowledge-library/extending-the-uk-strawberry-growing-season-using-a-range-of-plant-types-and-growing-systems.
45
Romero P. Fernández-Fernández J. I. Martinez-Cutillas A. (2010). Physiological thresholds for efficient regulated deficit-irrigation management in winegrapes grown under semiarid conditions. Am. J. Enology Viticulture.61, 300–312. doi: 10.5344/ajev.2010.61.3.300
46
Saveé R. Penñuelas J. Marfaá O. Serrano L. (1993). Changes in leaf osmotic and elastic properties and canopy structure of strawberries under mild water stress. HortScience.28, 925–927. doi: 10.21273/HORTSCI.28.9.925
47
Sønsteby A. Woznicki T. L. Heide O. M. (2021). Effects of runner removal and partial defoliation on the growth and yield performance of ‘Favori’ Everbearing strawberry plants. Horticulturae7, 215. doi: 10.3390/horticulturae7080215
48
Swann K. Kouloumprouka Zacharaki A. Else M. A. Bromley J. R. Hadley P . “Optimising strawberry propagation in TCEA systems,” in Acta horticulturae.
49
Terry L. A. Chope G. A. Giné Bordonaba J. (2007). Effect of water deficit irrigation and inoculation with Botrytis cinerea on strawberry (Fragaria x ananassa) fruit quality. J. Agric. Food Chem.55, 10812–10819. doi: 10.1021/jf072101n
50
Terry L. A. Chope G. A. Giné Bordonaba J. (2009). Effect of water Deficit irrigation on strawberry (Fragaria × ananassa) fruit quality. Acta Horticulturae.842, 839–842. doi: 10.17660/ActaHortic.2009.842.185
51
Van Delm T. Melis P. Stoffels K. Vervoort M. Vermeiren D. Baets W. (2016). Historical milestones, current methods, and strategies resulting in year-round strawberry production in Belgium. Int. J. Fruit Science.16, 118–128. doi: 10.1080/15538362.2016.1239561
52
Wang Y. Liu F. Jensen L. S. de Neergaard A. Jensen C. R. (2013). Alternate partial root-zone irrigation improves fertilizer-N use efficiency in tomatoes. Irrigation Science.31, 589–598. doi: 10.1007/s00271-012-0335-3
53
Weber N. Zupanc V. Jakopic J. Veberic R. Mikulic-Petkovsek M. Stampar F. (2017). Influence of deficit irrigation on strawberry (Fragaria × ananassa Duch.) fruit quality. J. Sci. Food Agriculture.97, 849–857. doi: 10.1002/jsfa.2017.97.issue-3
54
Yang P. Drohan P. J. Zhang X. Long H. Soulis K. X. Shi X. (2025). Impacts of deficit irrigation on strawberry physiology, water productivity, quality, and yield. Sustainability (Switzerland).17. doi: 10.3390/su17020675
55
Yang B. Fu P. Lu J. Ma F. Sun X. Fang Y. (2022). Regulated deficit irrigation: an effective way to solve the shortage of agricultural water for horticulture. Stress Biol.2. doi: 10.1007/s44154-022-00050-5
Summary
Keywords
Malling Ace, Regulated Deficit Irrigation (RDI), Total Controlled Environment Agriculture (TCEA), photosynthesis (Pn), strawberry, water use, cropping potential
Citation
Kouloumprouka Zacharaki A, Taylor JM, Davies MJ and Else MA (2025) Effects of Regulated Deficit Irrigation on yields, berry quality, and resource use efficiency in the everbearer strawberry Malling Ace under long-term production in TCEA. Front. Hortic. 4:1627450. doi: 10.3389/fhort.2025.1627450
Received
12 May 2025
Accepted
30 June 2025
Published
01 August 2025
Volume
4 - 2025
Edited by
Li Zhang, Chinese Academy of Agricultural Sciences, China
Reviewed by
Anna Wenda-Piesik, University of Science and Technology (UTP), Poland
Rasha Badr Eldin, Alexandria University, Egypt
David Montague, Texas Tech University, United States
Irina Luk’yanchuk, I.V. Michurin Federal Scientific Center, Russia
Updates
Copyright
© 2025 Kouloumprouka Zacharaki, Taylor, Davies and Else.
This is an open-access article distributed under the terms of the Creative Commons Attribution License (CC BY). The use, distribution or reproduction in other forums is permitted, provided the original author(s) and the copyright owner(s) are credited and that the original publication in this journal is cited, in accordance with accepted academic practice. No use, distribution or reproduction is permitted which does not comply with these terms.
*Correspondence: Aikaterini Kouloumprouka Zacharaki, katia.zacharaki@niab.com
Disclaimer
All claims expressed in this article are solely those of the authors and do not necessarily represent those of their affiliated organizations, or those of the publisher, the editors and the reviewers. Any product that may be evaluated in this article or claim that may be made by its manufacturer is not guaranteed or endorsed by the publisher.