 Carlos Falquez
 Shiting Long
 Nam Ho
 Estela Suarez
 Dirk Pleiter
- 1Jülich Supercomputing Centre, Forschungszentrum Jülich, Jülich, Germany
- 2Division of Computational Science and Technology, EECS, KTH Royal Institute of Technology, Stockholm, Sweden
- 3Institute of Computer Science, Rheinische Friedrich-Wilhelms-Universität Bonn, Bonn, Germany
- 4SiPEARL, Maisons-Laffitte, France
- 5Department of Computer Science, Bernoulli Institute, University of Groningen, Groningen, Netherlands
The diversity of processor architectures used for High-Performance Computing (HPC) applications has increased significantly over the last few years. This trend is expected to continue for different reasons, including the emergence of various instruction set extensions. Examples are the renewed interest in vector instructions like Arm's Scalable Vector Extension (SVE) or RISC-V's RVV. For application developers, research software developers, and performance engineers, the increased diversity and complexity of architectures have led to the following challenges: Limited access to these different processor architectures and more difficult root cause analysis in case of performance issues. To address these challenges, we propose leveraging the much-improved capabilities of processor simulators such as gem5. We enhanced this simulator with a performance analysis framework. We extend available performance counters and introduce new analysis capabilities to track the temporal behaviour of running applications. An algorithm has been implemented to link these statistics to specific regions. The resulting performance profiles allow for the identification of code regions with the potential for optimization. The focus is on observables to monitor quantities that are usually not directly accessible on real hardware. Different algorithms have been implemented to identify potential performance bottlenecks. The framework is evaluated for different types of HPC applications like the molecular-dynamics application GROMACS, Ligra, which implements the breadth-first search (BFS) algorithm, and a kernel from the Lattice QCD solver DD-αAMG.
1 Introduction
Given both acquisition as well as operational costs of High-Performance Computing HPC systems, in particular exascale-class systems, efficient use of the hardware resources is becoming increasingly important. However, for computational scientists, who are often already challenged by the complexity of the numerical problems that they try to solve, understanding performance remains a huge challenge. A fundamental reason for this is that today's computers, in particular HPC systems, are complex systems in the sense that, based on the behaviour of individual components, it is difficult to extrapolate to the behaviour of the full system. This applies already to single-core architectures, on which we focus here. Modern processor architectures comprise different subsystems, each with its own challenges in understanding their performance. It starts with the micro-architecture of each individual processor core, where various factors influence the efficiency of utilising all functional units. It continues with memory subsystems where multi-level cache architectures, memory pre-fetchers, etc., result in a difficult-to-understand behaviour of the data transport capabilities. From a computational scientist's perspective, the complexity increases due to the increased diversity of processor architectures used for HPC. The market has long been dominated by HPC systems with x86-based processors. Arm-based processors established themselves on the HPC market with the advent of Marvell's ThunderX2, Fujitsu's A64FX, and NVIDIA's Grace processors. While being all based on the Arm Instruction Set Architecture (ISA), the performance characteristics of these processors are hugely different. In the European context, there are strong ongoing efforts to develop processors based on Arm cores supporting SVE, as well as on the RISC-V ISA, in particular targeting the performance opportunities resulting from the RISC-V vector instructions extension RVV. Furthermore, the different ISAs used for HPC processors continue to evolve. One example is the introduction of instructions optimised for matrix and tensor operations, like Arm's Scalable Matrix Extension (SME). Processors supporting SME are also expected to be used for HPC in the near future.
During the last decades, a lot of effort has gone into the development of tools supporting the analysis of performance. They leverage different techniques for collecting information during the execution of applications, which helps to understand the performance. Beyond simple time measurements, over time, these tools started to leverage the increasingly sophisticated hardware support for tracking the behaviour of hardware, including the processor. Any modern processor comprises a Performance Management Unit (PMU) that can be programmed at run-time for counting the number of times particular events occur. Counting the number of cache misses is a typical example. Despite these units having become increasingly sophisticated, computational scientists and performance engineers find themselves often in a situation where the set of events that can be tracked is limited. Furthermore, often a root cause analysis becomes challenging as the context for a particular processor behaviour cannot be recorded.
One alternative to running on real hardware and monitoring the behaviour is the use of simulators. Recently, a range of open-source simulators have been used in the area of HPC. As simulations are many orders of magnitude slower compared to real hardware, a compromise needs to be made with respect to the scope of the simulation model on the one hand, and the level of detail on the other hand. In this work, we focus on cycle-accurate simulations that in practice are only affordable when restricting the scope to a single or a small number of processor cores. As in this paper, we try to argue for a specific conceptual approach, we will limit ourselves to a single core architecture. While we focus in this paper on HPC processor architectures and applications, the approach is also applicable outside of HPC.
One popular choice for such a simulator is gem5 (Binkert et al., 2011; Lowe-Power et al., 2020), which supports several ISAs. It is continuously updated to support new architectural developments, like the emergence of Arm's SME and RISC-V's RVV. Furthermore, various efforts have been made to establish models for existing processor solutions used for HPC systems and to validate the model by comparing simulation results for complex workloads to results obtained on real hardware.
However, the use of gem5 by computational scientists and performance engineers for the purpose of performance analysis has been very difficult. gem5 has become a tool that is widely used by processor architects to investigate new design ideas. Over time, the community behind the simulator managed to enable the necessary flexibility despite the unavoidable complexity of the simulator. This focus, however, contributed to gem5 becoming difficult to use, requiring significant training before being ready to use this simulator in a reliable manner. To address this limitation, different tools have been proposed to simplify the use of gem5 while compromising on its flexibility. One example is gem5-dbc (Falquez et al., 2025).
A second shortcoming of gem5 is the lack of tools to correlate simulation statistics and application code. Even if the application is instrumented to restrict event profiling to a confined region of interest (ROI), gem5 statistical counters are accumulated over the entire ROI and typically reported as a single aggregate value. However, even within a single ROI, the application may exhibit multiple execution phases with significantly different performance characteristics. Detecting such execution phases and identifying the corresponding application code sections will make it easier to localise performance issues and explore root causes. Finally, based on these statistics, it requires often expert knowledge to detect performance issues and identify root causes. This makes gem5 a difficult to use tool for computational scientists or research software engineers, who work on efficient implementations of an application, and/or a performance engineer, who aims to reduce time-to-solution for a given application and workload.
The main contributions of this paper are:
1. A tool for detecting and visualising different phases of an application that is simulated using gem5 is presented.
2. Different strategies for detecting performance issues using gem5 simulations are discussed and implemented in gem5.
3. A few case studies show how the results of this work can be used for real-life applications, which have been selected such that they represented a broad range of computational science research.
This paper is organised as follows: In Section 2, we discuss related work before introducing the tool for detecting and visualising computational phases in Section 3. In Section 4, the detection of selected performance issues leveraging gem5 simulations is discussed. Next, in Section 5, we present three different case studies before we offer our conclusions in Section 6.
2 Related work
Most of the information, which is needed for a performance analysis, can only be retrieved via PMUs. However, they only allow monitoring a limited number of events, which cannot be changed once a processor design is final, and they are also highly vendor and processor solution specific. The latter problem has in parts been mitigated by introducing an Application Programming Interface (API), e.g. with the PAPI library (Browne et al., 2000). With this API, the occurrence rate of similar events could be measured on different processor architectures using the same code. Over time, the perf tool, which is integrated with the Linux kernel, has improved significantly and is on many platforms the easier path for system hardware monitoring (De Melo, 2010).
More recently, several vendors developing processor technologies and solutions have been integrating advanced performance monitoring capabilities. Examples are Intel's Processor Event Based Sampling (PEBS), which was introduced with the Intel Nehalem processor, AMD's Instruction-Based Sampling (IBS), which appeared with the AMD family 10h processors, and Arm's Statistical Profiling Extension (SPE), which is part of the Armv8.2 ISA. These new features support attributing events samples to the instructions that trigger them. This can significantly ease identification and localisation of performance issues. There have been various studies exploring the precision and usability of PEBS, IBS, and SPE (see, e.g., Akiyama and Hirofuchi, 2017, Sasongko et al., 2023, Miksits et al., 2024).
Over time, a large range of sophisticated performance tools have been developed that facilitate collection of performance-related observables and its analysis. Examples for open-source solutions include HPCToolkit (Adhianto et al., 2010), which has been mainly developed in the US, as well as various tools developed and supported mainly in Europe like PARAVER (Pillet et al., 1995), Scalasca (Geimer et al., 2010), and Vampir (Knüpfer et al., 2008). For a very recent overview over some of these tools, see (Wylie et al., 2025).
Our work can also be seen in the context of making the use of existing tools easier and/or more productive. This includes efforts towards more advanced visualisation capabilities and interactivity (see, e.g., Vavrik et al., 2025). Another effort in this direction aimed at integrating such tools into Jupyter notebooks, mainly for educational purposes (Oden et al., 2024).
Another important class of performance tools used for HPC are static code analysis tools. A few examples are llvm-mca, which is widely available as it is part of the LLVM compiler infrastructure, MAQAO (Valensi et al., 2019), one of the older but still actively developed tools, and OSACA (Laukemann et al., 2018). Both llvm-mca and OSACA are also conveniently available through the Compiler Explorer service.1
The advanced visualisation capabilities as well as various analysis capabilities, which aim to guide application developers or performance engineers, that are provided by the tools listed above, are to the best of our knowledge not available for cycle-accurate, processor-level simulation tools. This work on laying a basis for closing this gap based on the gem5 simulator.
The gem5 simulator is also an open-source tool (Binkert et al., 2011; Lowe-Power et al., 2020). It has developed into a popular tools for computer architecture research, which supports processing hardware at a cycle-level. It supports different ISAs including x86, Arm, and RISC-V. gem5 has become an important co-design tool in the context of the development of HPC processor technology. An example is the design of the A64FX processor (Kodama et al., 2019), where it was also used for early porting of computational kernels using the newly introduced SVE instructions. Within the European Processor Initiative's (EPI's) projects, the gem5 simulator together with other simulators was used for design space explorations (Zaourar et al., 2021). More recently, Domke et al. (2023) used gem5-based models for exploring processor design concepts for processor designs for future high-end HPC systems.
There have been various efforts to create reliable models for different core architectures that are validated on real hardware. Walker et al. (2018) consider several simpler Arm cores and found (after some fixes) an average deviation for the considered workload of about 10 %. Nassyr and Pleiter (2024) focussed on dgemm micro-kernels on different Arm-based processor architectures and found in a few cases large discrepancies of up to 40 %. Other work did compare performance results for HPC application benchmarks, e.g., (Brank and Pleiter, 2023; Brank, 2023) obtained on real hardware and matching gem5 models. They report a similar level of accuracy overall, but observed accuracy variability depending on the considered observable.
3 Time-binned event statistics and code region detection and labelling for gem5
In order for gem5 to become a useful tool for performance engineering, it needs to be able to profile performance over time, and identify which code was being executed. For this purpose, we introduce in this work the following functionality to gem5:
1. Support for time-binned event counters, and
2. Automatic labelling of executed code routines (code regions)
As discussed in Section 1, it is common practice to define Regions of Interest (ROIs) for the benchmarked application to keep the amount of data that is collected during a simulation manageable. Statistical data is only collected within the ROI, and counters are reset after each ROI iteration. In the case of gem5, defining a ROI requires code instrumentation and linking to the gem5 m5 help library.
The events are then sampled over the execution period T of the ROI, as shown in Figure 1a. But the length of period T might not offer enough granularity to detect different execution phases within the ROI, which can be critical for performance analysis. In this work, we implement time-binned event counters for gem5, as shown in Figure 1b. Events are aggregated over time bins Bi of fixed length TB, producing a sequence of event counts per bin. This provides finer temporal resolution and improves the ability to detect distinct execution phases.

Figure 1. gem5 sampling methods over a ROI with time interval T. (a) The current aggregated event sampling over the whole ROI. (b) Time-binned sampling, where events are sampled over smaller time-bins of fixed size.
The time-binned counter infrastructure implemented in gem5 allows for event frequency sampling. The sampling of instruction execution frequency leads to a method for automatic labelling of executed code regions. Code regions are contiguous instruction sequences corresponding to specific routines in the application source code. Detecting and correctly labelling executed code regions is essential for attributing execution phases to individual executed routines.
In the following sections, we describe these improvements in more detail. Section 3.1 describes the implementation of time-binned statistics. Section 3.3 describes the code region detection and labelling.
3.1 Time-binned event statistics
For each ROI, we partition the execution timeline into fixed length intervals, referred to as time bins B0, B1, B2, …, each of duration TB. This binning increases the temporal resolution of event sampling and improves the sensitivity of execution phase detection. If an event E occurs at time t then counter for bin Bi with is updated. Figure 1 illustrates the difference between sampling over the entire ROI, and sampling over time bins Bi. The number of bins is dynamically reallocated as needed during runtime. An event E can be, e.g., the commit of an instruction I. Whenever such an event occurs at a time t with iTB ≤ t < (i+1)TB, the corresponding counter is incremented.
Aggregating the counters in this way makes it easier to visually detect computational phases. As computational phases, we define time periods with particular characteristics, e.g. the continuous high occurrence rate of particular events. As an example, consider Figure 2 where results for the molecular-dynamics application GROMACS is shown. The top panel shows different phases that are characterised by a high rate of vector load and store instructions as well as SIMD Floating Point instructions.
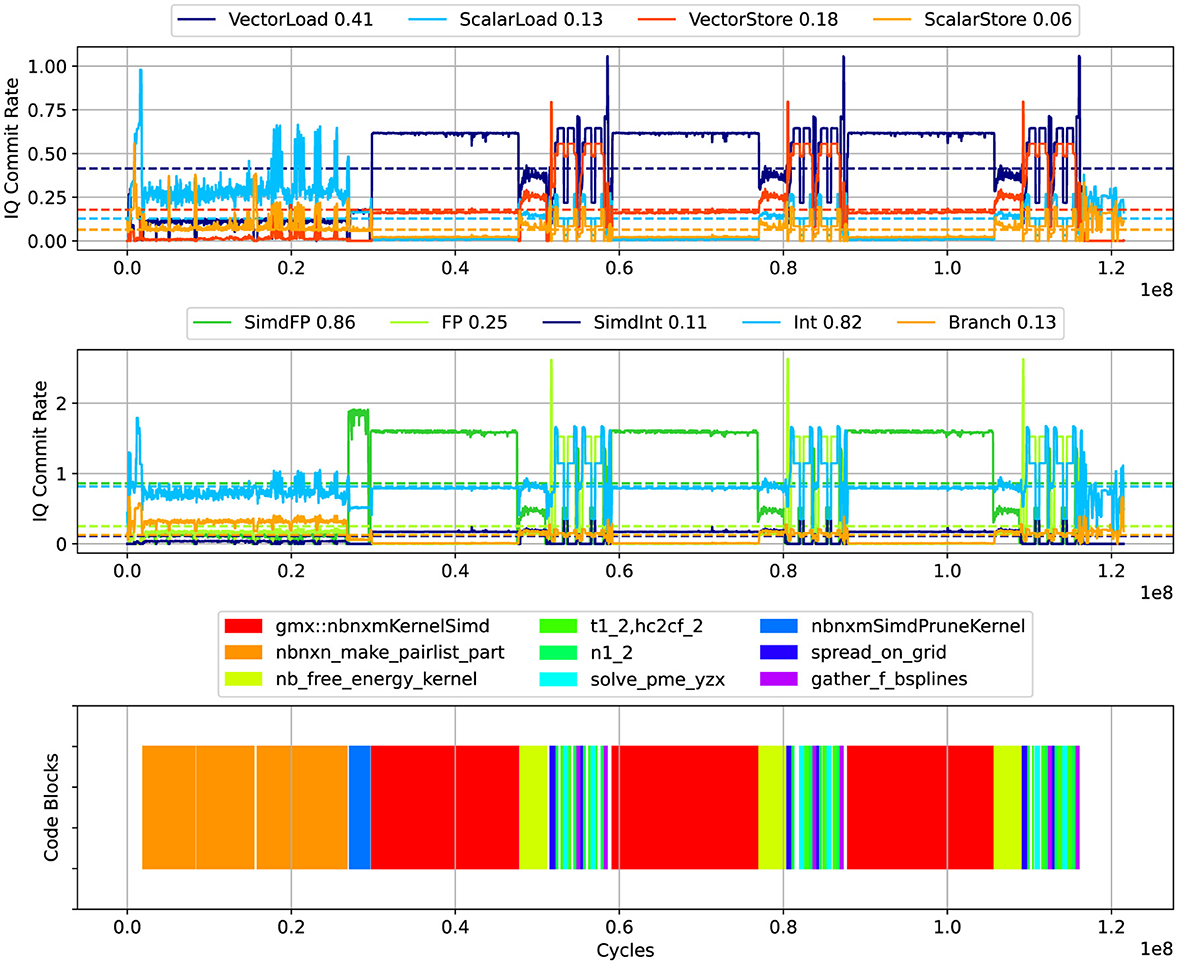
Figure 2. GROMACS: average number of committed instructions (top and middle) and corresponding code regions (bottom). Committed instructions are labelled by instruction type and commit rate average. The plot was produced with mw = 20.
Next, we determine for each time bin Bi a set Fi of the M most frequently occurring events, where Fi = {Ei, 0, Ei, 1, Ei, 2, …, Ei, M−1}. An event Ei, j is ranked higher if . In the case of the event that occurs earlier is ranked higher.
When sampling events over smaller time bins, the measured time evolution can exhibit stochastic fluctuations. To reduce noise and present a clearer signal in the plots, we apply the median filter implementation provided by the scipy Python package (Virtanen et al., 2020). The filter replaces the value at each bin with the median over a sliding window of width mw. The filter suppresses outliers while preserving sharp changes. The value of mw is chosen in each case to improve the readability of the plots, not to alter the underlying measurements, and is always orders of magnitude smaller than the ROI duration mwTB≪T. The specific value of mw for each time-binned statistics plot is reported in its description.
3.2 Code region detection and labelling
To detect and label code regions, the instructions of the executable are grouped according to the function entry point label lj. This is implemented by parsing the output of the objdump tool from the GNU Binutils collection. Let Sj be the set of instructions that belong to label lj and mi, j = |Fi∩Sj| the number of instructions that appear both in Fi and Sj. For this number of matching instructions we have 0 ≤ mi, j ≤ M. By introducing a threshold value mt, the set of labels associated to a time bin Bi can be defined as Li = {lj|mt ≤ mi, j}. As shown in Listing Algorithm 1, the label sequence (Li) can be converted to a list of (start, end) time ranges labelled by the executed function (or list of functions). These identified code region ranges describe a series of simply connected segments which can be mapped to the time-binned event counters. The code region range generation is parametrized by a small set of threshold lengths, determining the merging and filtering of identified segments. We set these values heuristically by inspecting the result and selecting the smallest thresholds that remove obvious noise while preserving continuous segments. In the following work we use M = 5, mt = 5, mg = 3, mf = 5, mj = 5, mpc = 0.01. The time bin width is TB = 5000 cycles.
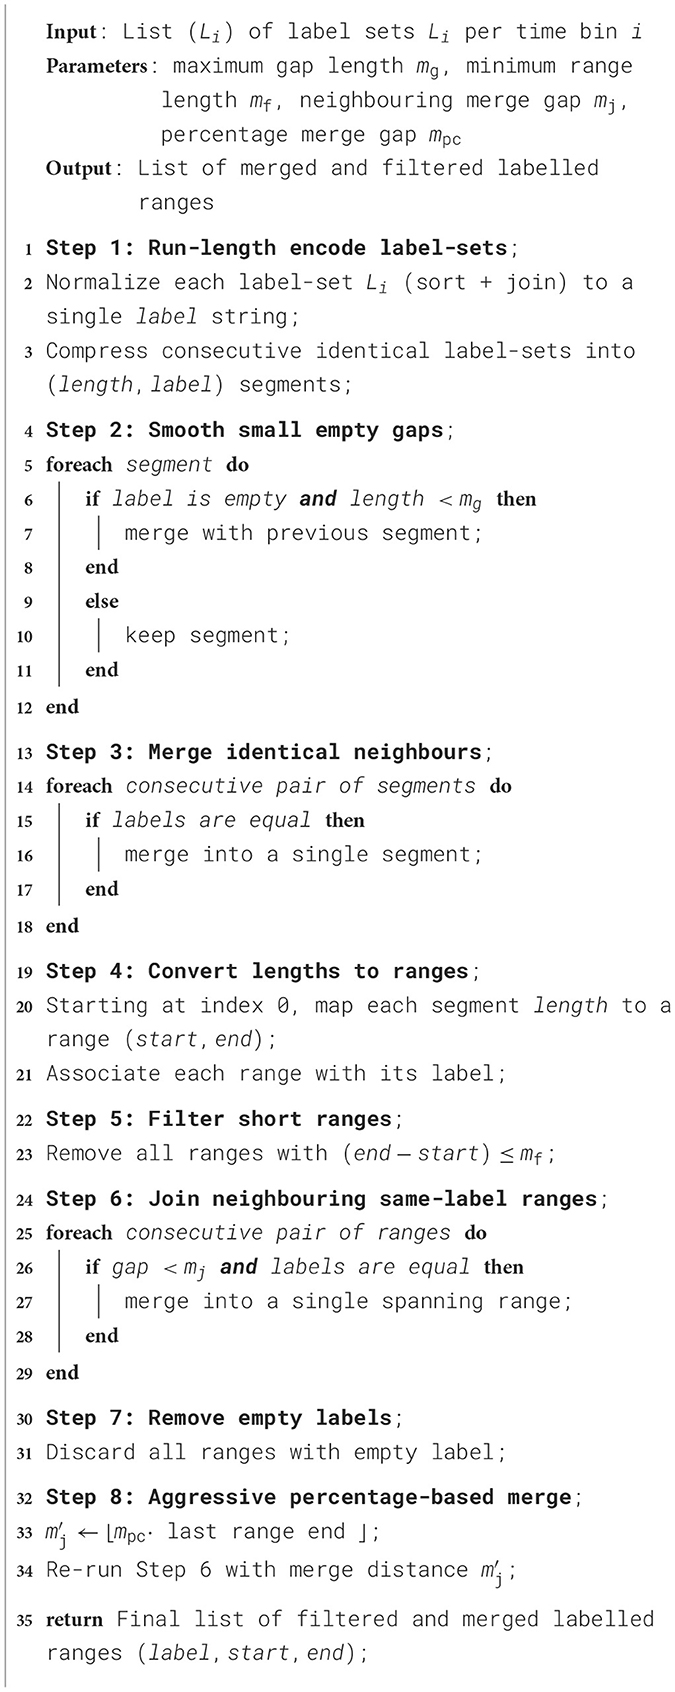
Algorithm 1. Code region range generation from list of function label sets.
3.3 gem5 model support
The time-binned counters as implemented are derived from the Stat base class from which all other gem5 statistic counters are derived, and can be used as a drop-in replacement. In the following work, we have added time-binned event and frequency counters for gem5 out-of-order CPU (O3CPU) model, Classic/Ruby cache and Simple/DRAM memory controller events. Specific event counters will be discussed in the sections below.
The time-binned statistics integrated into the various models are ISA-independent and can be used with any gem5 supported ISA, provided that the underlying model supports the ISA as well. In this work, we restrict our simulations to the 64-bit Arm architecture, but we plan to extend our results to other gem5 supported ISAs in the future.
4 Performance issues detection
In this section, we introduce a selected set of performance issues that can be detected with the help of our enhanced version of the gem5 simulator.
4.1 Sensitivity to instruction data dependencies
In various cases, performance is limited by the throughput of instructions. This can have different reasons. Complete filling of the micro-architecture's front-end pipeline or full utilisation of the relevant instruction pipelines are the most easy to detect because typical processor architectures do provide suitable hardware performance counters. More difficult to detect cases are caused by instruction dependencies. More specifically, we consider the case of already fetched instructions that cannot be issued as they are stalled waiting for operands generated by other instructions that are currently being executed. The impact of this dependency can vary depending on the depth of the execution pipelines and, therefore, result in unexpectedly low performance when running an application on different processor architectures.
Dispatched instructions are allocated to an IQ, where each instruction waits until all its operand dependencies are available. Let be the average number of instructions of type i= integer arithmetics, floating-point arithmetics, … waiting in the IQ for data dependencies to resolve. These instruction becomes ready to be issued once all its data dependencies have been resolved. Ready instructions are issued to available execution units. If no execution units are available, the instruction stalls until the next cycle. Let the average number of stalled instructions due to busy execution units be .
Consider a compute bound kernel loop running on an architecture with effective pipeline depth di for instructions of type i. If an application is ported to a processor architecture with a deeper pipeline, i.e., larger di, then the probability of instructions in the IQ waiting for data dependencies to resolve increases, i.e., likely becomes larger. At the same time, the pressure on the pipeline decreases, i.e., becomes smaller and, more importantly, the pipeline utilisation and, therefore, performance reduces.
To detect this specific scenario, we have added event counters for both and to gem5. The event counter is able to differentiate between different instruction classes.
In Section 5.1, we will describe how both counters can be used to identify performance issues caused by instruction data dependencies for a molecular-dynamics application.
4.2 Memory Traffic and memory controller queue length
In HPC, the performance of many applications is limited by the speed at which data can be exchanged with the external memory. Monitoring data transfer over the memory bus can be limited by need for privileged access to the hardware. This can, however, be overcome by suitable services, e.g. the PAPI Performance Co-Pilot (Barry et al., 2023). On various processor architectures, such monitoring cannot be reliably done due to lack of suitable hardware performance counters. As a result, often some modelling approach is used (see, e.g., McCalpin, 2023 for the case of Intel Xeon Max processors).
Another observable that helps to understand the interaction with the external memory is the average filling of the queue for pending requests at the memory controller.
The gem5 simulator already provides a rich set of event counters for detailed characterization of memory traffic. Cache controllers track accesses and line fills. Data transfer bandwidth and latency can be precisely tracked at the memory controller level, which is difficult to do on real hardware. Moreover, the average filling of the memory controller queues are tracked.
In Section 5.2, we will describe how measuring the data transferred via the memory controllers and the tracking of the memory controller queues helps to analyse the performance of an application from Lattice Quantum Chromodynamics (LQCD).
4.3 Long-latency instructions
The earlier highlighted issue of the performance impact of dependencies between different instructions is particular crucial in case of instructions that need long to complete. A typical example for such instructions are load instructions. Modern processors used in HPC systems typically support out-of-order instructions execution, which can be exploited to hide the latency of, e.g., load instructions. However, such a mechanism cannot be easily exploited if the long-latency instruction is conditioned.
Once detecting such cases, application developers or performance engineers can try to address this, e.g. by moving the long-latency instruction outside of the conditioned code section. An example for how such a case can be resolved is shown in the following code example:
void update (int, int *);
void test 1 (int cond1, int i, int *p, int *q) {
// Conditioned load
if (cond1 > 0) {
int d = p[i];
for (int j = 0; j < d;j++)
update (j, q);
}
}
void test2 (int cond1, int i, int * p, int * q) {
// Unconditioned load but conditioned use
int d = p[i];
if (cond1 > 0 && d > 0){
for (int j = 0; j < d; j++)
update (j, q);
}
}
The gem5 simulator can help to detect such situations by measuring the instruction squashing rate. Squashed instructions are instructions that have either already been or are to be speculatively executed and that need to be discarded because of miss-speculation.
In Section 5.3, we will describe how this mechanism could be successfully used to improve a framework for graph-based algorithms, including Breadth Search First (BFS).
5 Case studies
In this section, we document a number of case studies to demonstrate how to perform the analysis previously presented. The codes considered in this section are representative for a broad range of applications that are widely used on HPC systems. This includes a molecular-dynamics application (see, Section 5.1), which is one of the few classes of applications where the performance of relevant computational kernels are bound by the throughput of floating-point operations. For many stencil-type applications, including LQCD simulation applications (see, Section 5.2), the performance is on the other hand typically memory bandwidth limited. Furthermore, the performance of graph-based algorithms (see, Section 5.3) is typically limited by the performance of the memory subsystem. For these algorithms, control flow and memory access patterns are significantly less regular compared to the stencil application considered here.
For the sake of showing some case studies, we use a single, gem5-based simulation model. It represents the behaviour of a processor with a single Arm Neoverse v2 core supporting SVE instructions. This core is meanwhile used by different processor solution providers, including NVIDIA in its Grace processor. The software setup, which has been used, is documented in Table 1.
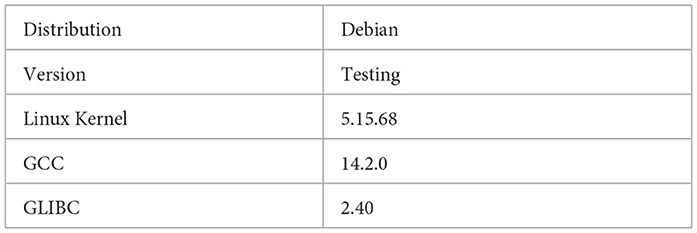
Table 1. Linux system used for gem5 full system simulation.
5.1 Molecular dynamics
GROMACS (Abraham et al., 2015) is a very widely used package to perform molecular dynamics simulations. It is designed to simulate systems comprising hundreds to millions of particles based on the Newtonian equations of motion. The application has a dedicated back-end for leveraging SIMD instructions. The most computationally expensive part of simulations is the computation of the non-bonded interactions, on which we focus here by using a dedicated benchmark for performance evaluation. For this kernel, GROMACS provides two different SIMD-optimised implementations, called 4 × M and 2 × MM. There is a specialised version for Arm's SVE ISA that leverages the Arm C Language Extensions (ACLE) with operand width fixed at compile time.
We have used gem5 to profile a recent version of GROMACS (v2024.5) using the solvation free energy benchmark benchSTI developed at the Max Planck Institute for Multidisciplinary Sciences.2 For the solvation free energy benchmark benchSTI the main numerical kernel is gmx::nbnxmKernelSimd. The gem5 architecture parameters used for the simulation are described in Table 2.
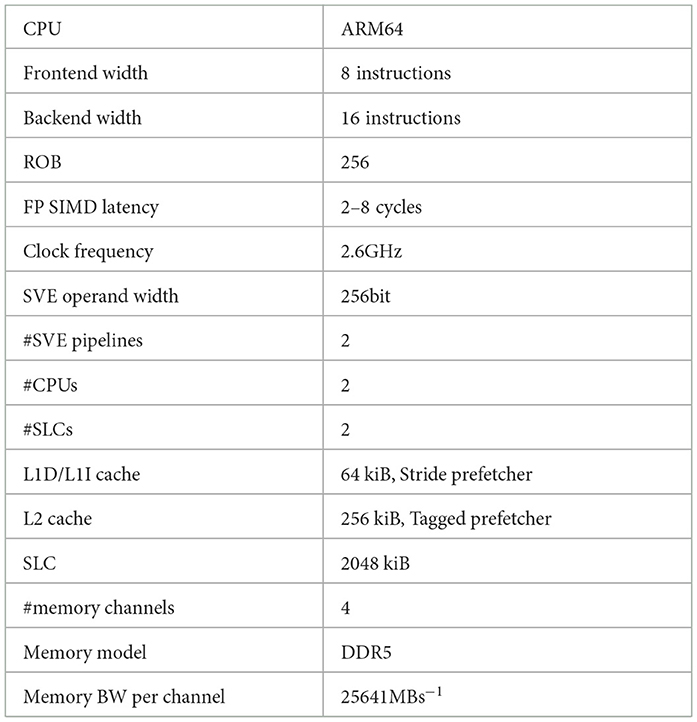
Table 2. gem5 simulation parameters used for GROMACS benchmarks.
Figure 2 shows the IQ commit rate for load and store instructions (upper panel) as well and floating-point, integer arithmetic and branching instructions (middle panel). The bottom panel of Figure 2 shows the identified executed code regions for each time bin. We see from the figure that the main numerical kernel gmx::nbnxmKernelSimd achieves a throughput of around 1.7 SIMD floating-point instructions, i.e. almost fully utilise the available 2 pipelines.
The performance sensitivity of GROMACS to long execution pipelines was already identified by Brank (2023). Brank verified using gem5 that by increasing the effective execution latency, GROMACS performance drops significantly compared to shorter execution lengths, and suggests that this sensitivity is due to instruction data dependencies.
Here we want to show how gem5 can be used to easily identify such situations. As discussed in Section 4.1, we have to consider the following counters:
1. , the average number of instructions in the IQ waiting its data dependencies to resolve.
2. , the average number of stalled instructions due to busy execution units.
The results from gem5 simulations are shown in Figure 3. The first row of Figure 3 shows how the average commit rate of FP SIMD instructions decreases for increasing SIMD execution latency. The second row shows the average number of stalled instructions due to busy execution units, . We see that for latencies=2,4 cycles, , while for latencies=6,8 cycles. The third row shows the average number of SIMD FP instructions at the IQ waiting for the data dependencies to resolved. For all latencies, this value remains above during the main 3 kernel blocks.
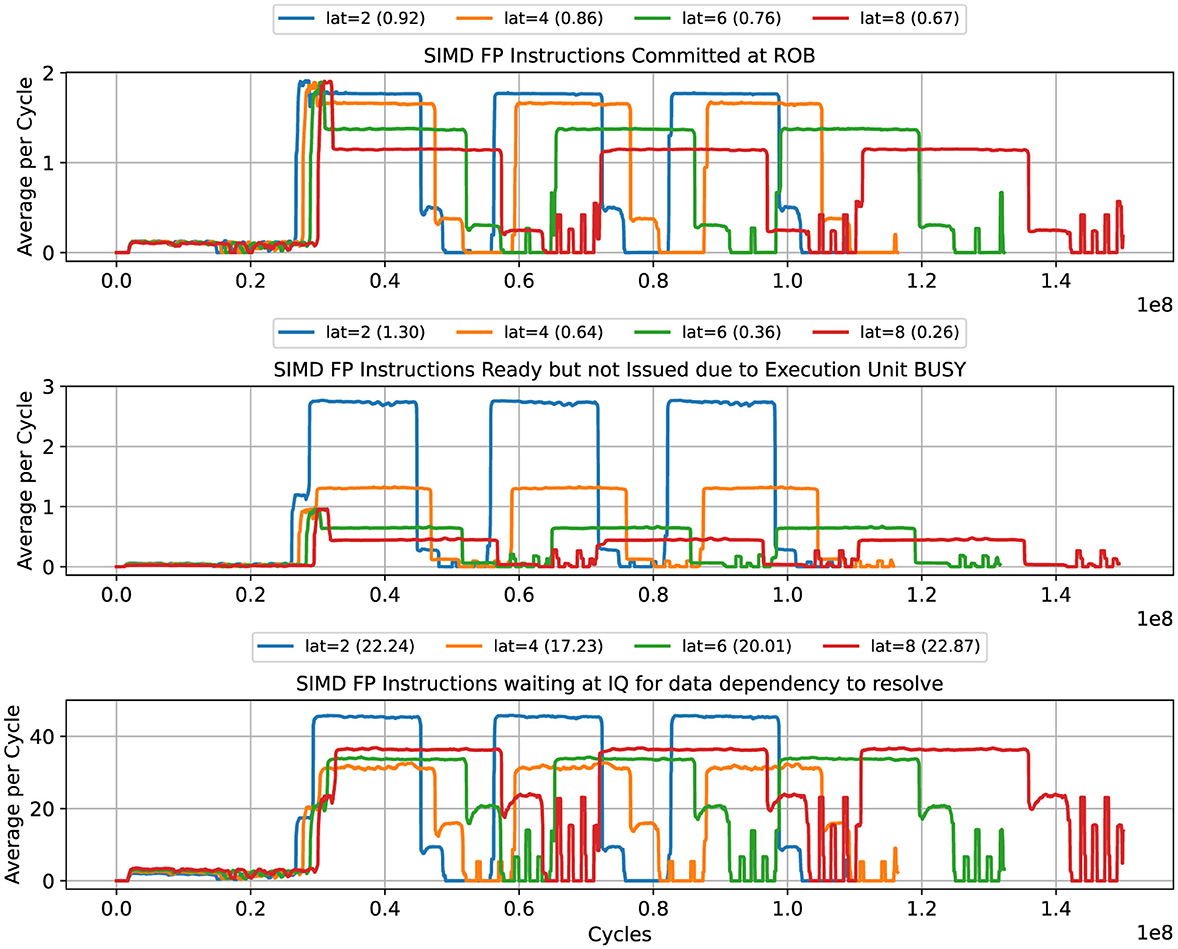
Figure 3. GROMACS: average number of instructions committed per cycle (top), instructions stalled in the IQ (middle), and instructions waiting for data dependencies to be resolved. The plot was produced with mw = 200.
We can conclude from these results that for an effective execution latency ≥4, the GROMACS vectorized kernel becomes sensitive to data dependencies. The average number of stalled instructions drops below 1, which signals the decrease in the rate of data dependency resolution, while the number of instructions waiting at the IQ for missing dependencies remains large, verifying that the frontend keeps sending instructions to the IQ at sufficient rate.
5.2 Lattice quantum chromodynamics
LQCD is a specific formulation of the theory of strong interactions that facilitates numerical simulations, which is often the only mean of computing fundamental physical quantities from first principles. Typical LQCD simulations spend most of the their computational efforts on solving particular linear sets of equations. For this case study, we focus on a kernel from a recently extended version3 of the DD-αAMG solver framework (Frommer et al., 2014). With this extension, support for solving the linear equations with multiple right-hand sides (RHSs) is added (Birk and Frommer, 2012). Using multiple RHSs has several benefits. Firstly, data locality is potentially improved resulting in a higher arithmetic intensity. Secondly, in innermost loops small matrix-matrix multiplications need to be performed, for which new instructions like SME can be used. Lastly, SIMD instructions can be exploited as the same arithmetic can be performed to all RHSs.
However, the optimization of multiple RHSs did not lead to the expected performance improvements on real hardware. Although the arithmetic intensity increases with the blocking size (i.e., the number of RHSs), the observed performance did not scale proportionally.
With the available performance counters of the A64FX processor on Ookami (Calder et al., 2023), we have identified that the effective memory bandwidth varied across different blocking sizes. This variation directly impacts performance since LQCD solvers are predominantly memory-bound. Since it is almost impossible to extract comprehensive information for the cache and memory controllers from real hardware, we turn to an analysis using gem5 with the parameters shown in Table 3.
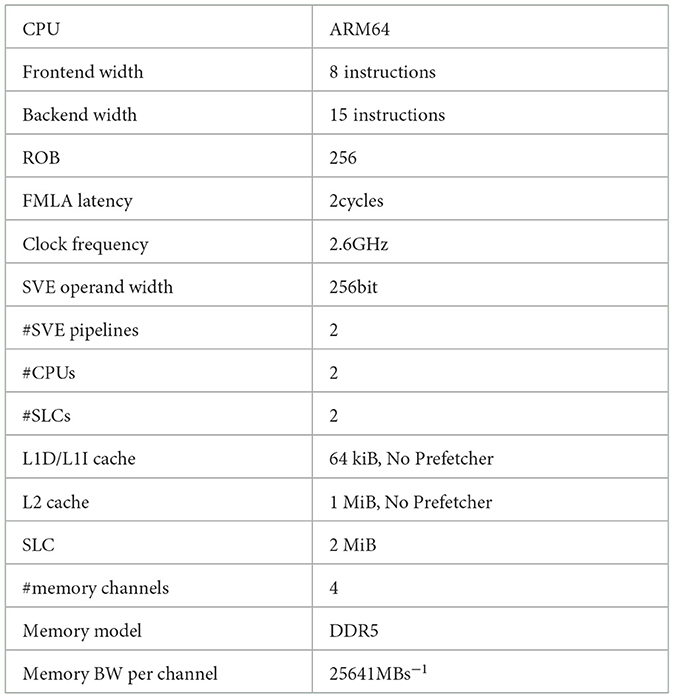
Table 3. gem5 simulation parameters used for the DD-αAMG benchmarks.
For this case study, we consider a read-intensive kernel with consistent arithmetic intensity to eliminate the known factors that impact performance. This kernel is also a bottleneck in the iterative solver GMRES of DD-αAMG, it computes multiple inner products of complex vectors:
where k loops over the blocking size b, which is assumed to be known at compile time. The indices i (0 ≤ i<vl) and j (0 ≤ j ≤ rl) iterate over the vector length vl and the GMRES restart length rl, respectively. The two lengths are provided only at runtime.
The implementation of the kernel is specified in Algorithm 2. We also implement a benchmark driver to repeatedly execute the kernel and use gem5 to collect operation counts and memory traffic data. As performance metric the throughput of floating-point operations bfp in units of flop/cycle is used. The number of floating-point operations is derived from an analysis of Algorithm 2: 8·b·vl·(rl+1), where the 8 corresponds to a complex multiply add.
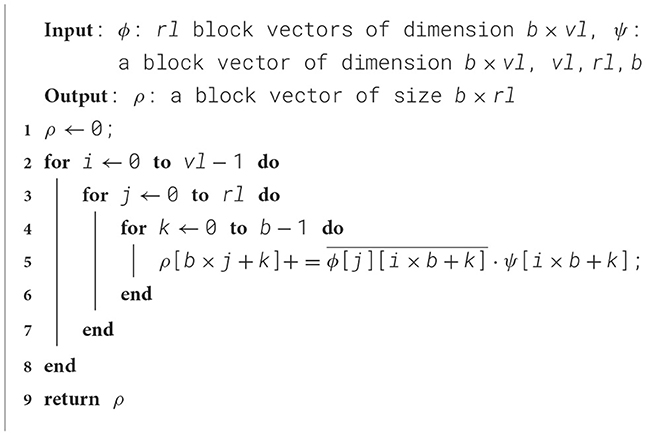
Algorithm 2. Multiple Inner Product
The results in Table 4 show that larger blocking sizes enhance kernel performance, mirroring the trends observed on real hardware. For b = 1, 2, the kernel performs poorly which is likely cause by vectorization challenges. Through previous static analysis, we observe that the compiler vectorizes both the loop over rl and the loop over b. This results in combinations of SIMD (both SVE and NEON) and floating-point instructions being generated plus additional loads and stores.
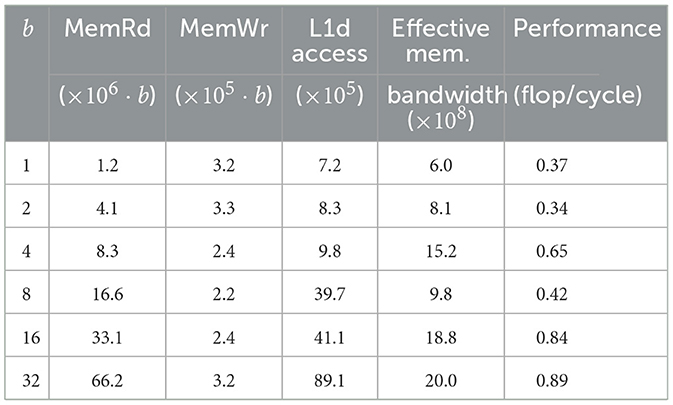
Table 4. DD-αAMG: performance of the multiple inner-product kernel with varying blocking sizes b taking vl = 49152 and rl = 5.
We observed an unexpected performance drop at b = 8. Unlike for the other values of b, the compiler does not vectorize the code in this case, and scalar load instructions are generated instead. Figure 4 shows that the rate of committed load instructions in the b = 8 case is slightly reduced. More importantly, Figure 5 shows that the read requests rate is reduced by a factor of two.
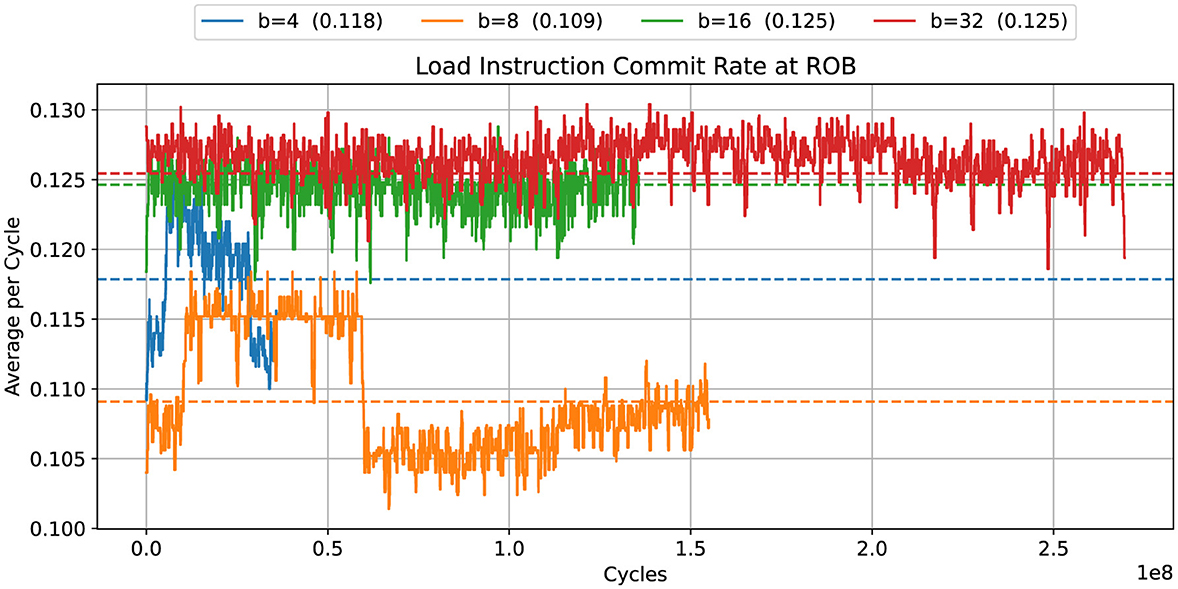
Figure 4. DD-αAMG: commit rate for load instructions for different blocking sizes b. The plot was produced with mw = 25.
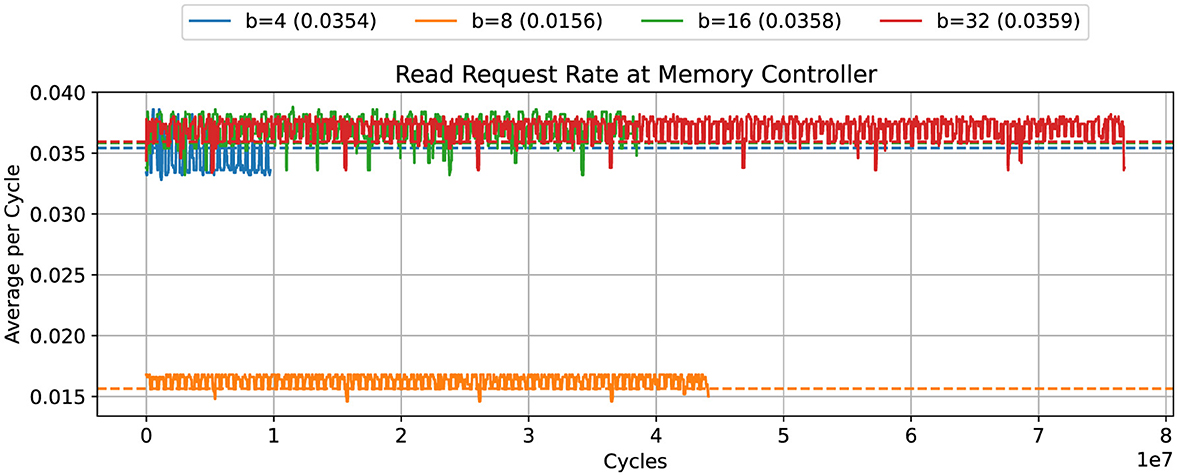
Figure 5. DD-αAMG: memory read rate with varying blocking sizes, taking time bin width of 5,000 cycles. The plot was produced with mw = 25.
5.3 Breadth first search
BFS is a popular graph algorithm, which is, among others, used for benchmarking HPC systems for a listing on the Graph500 list. There are different ways on how the algorithm can be implemented.
The most popular implementations are based on graph traversing. Based on a representation of the graph as a list of vertices and edges, efficient algorithms have been engineered for how to traverse the graph without visiting vertices twice. The implementation of these algorithms is based on queues and require in the parallel case atomic updates. For this case study, we consider Ligra (Shun and Blelloch, 2013). This framework implements edge visitors for both sparse and dense graphs.
We profile the Ligra BFS implementation's single-thread performance, solving a Kronecker graph of scale 16 using gem5. The architecture parameters used are documented in Table 5. The results are shown in Figure 6. The top panel shows the commit rate for scalar memory load and store, integer arithmetic, and branching instructions. Even though the simulated processor core has four integer execution units available, the performance profile shows poor execution unit utilization, with an average commit rate that is below 1 most of the time. Only the helper routine pbbs::sliced_for shows an integer commit rate close to 3.
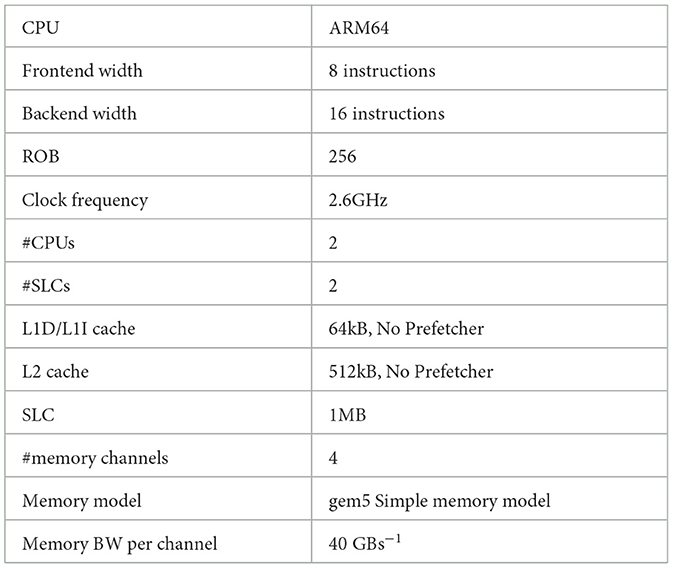
Table 5. gem5 simulation parameters used for the Ligra benchmarks.
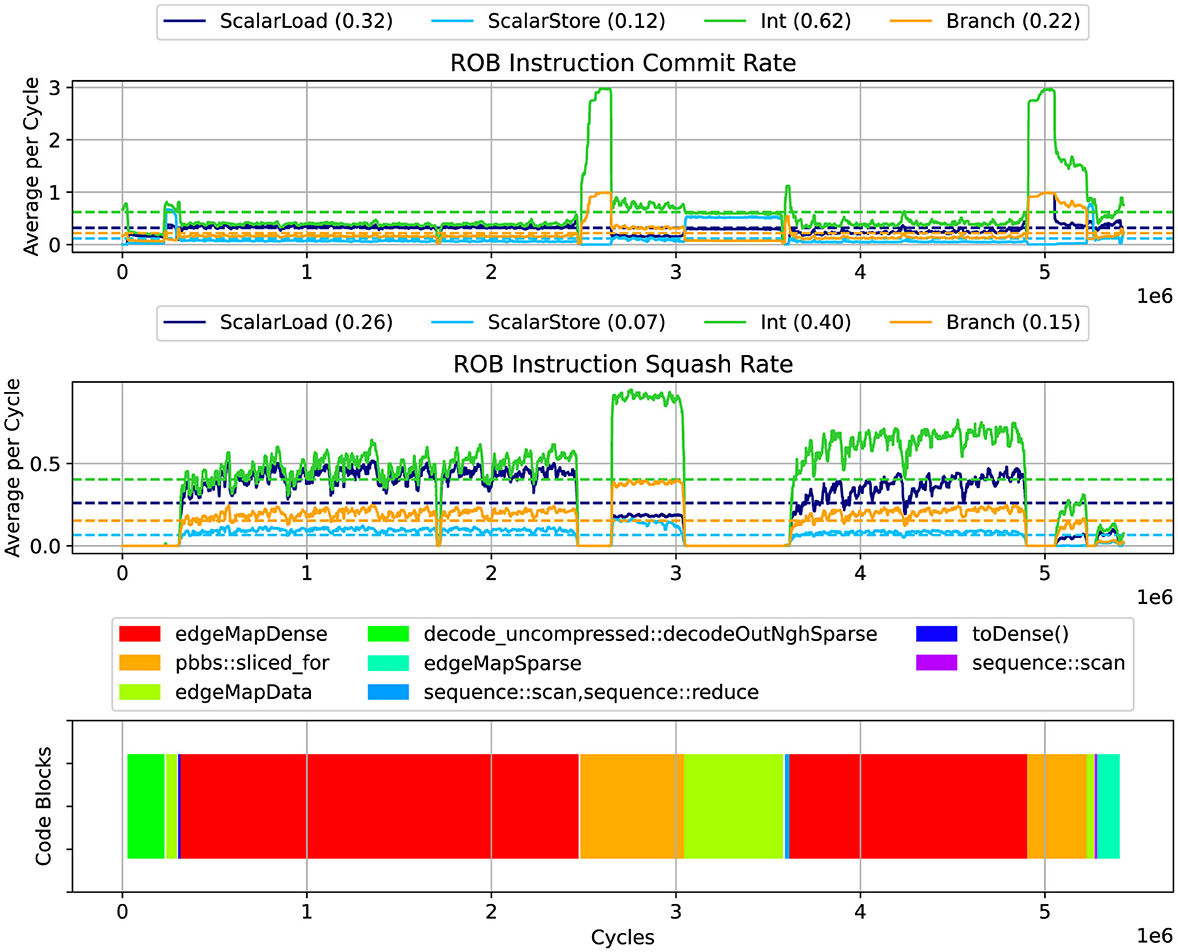
Figure 6. Ligra: Instruction commit rates (top), squashed instruction rate (middle), and code regions (bottom). The plot was produced with mw = 40.
The middle panel shows the rate of squashed instructions. Using our gem5 modifications, we were able to detect the main code locations causing squashing with its high penalty costs. Most of the branch mispredictions responsible for the high squashing rate are found in the EdgeMapDense routine, listed in Algorithm 3.
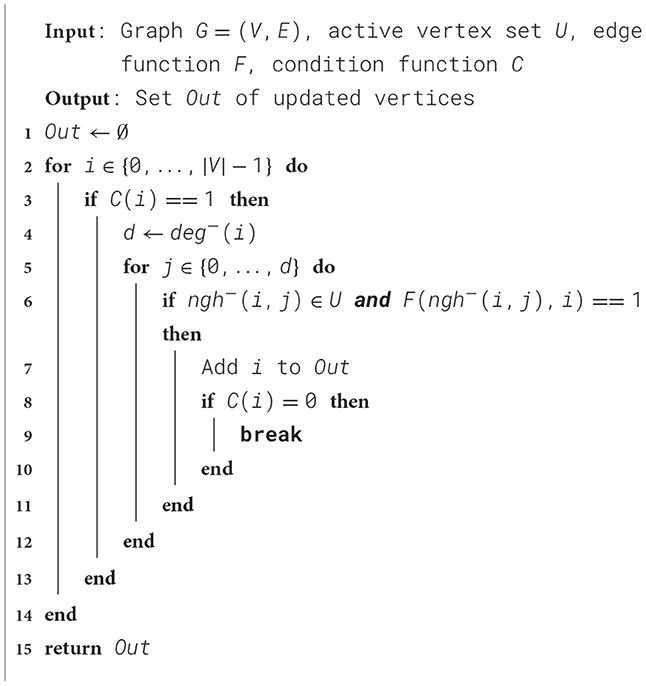
Algorithm 3. EdgeMapDense as implemented in Ligra, see Shun and Blelloch (2013).
Lines 6, 9 and 12 each cause about a third of the branch mispredictions. Due to the irregular nature and sparsity of the graph, the branch predictor has a difficult job anticipating branch outcomes. This also affects a load at line 7. By moving the load instruction outside of the branch, this load can be initiated earlier. The decision is a trade-off, as unnecessary data transfers may occur.
In order to test this hypothesis, EdgeMapDense is reimplemented as shown in Algorithm 4. Here the load is moved outside the test of C(i). Now each loop iteration will cause a load, but it is initiated earlier.
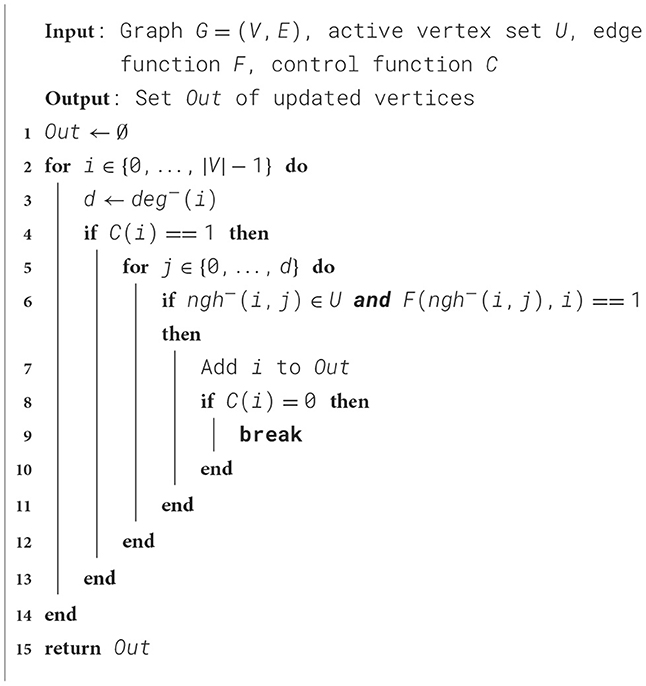
Algorithm 4. EdgeMapDense with out of branch load.
We have benchmarked both implementations with a recent version of Ligra and Kronecker graphs of scale 21..24 on an AWS Graviton 4 bare-metal node. The BFS solver runs single-threaded, and we present the time to solution in seconds as reported by Ligra. The results are shown in Table 6. We see a speed-up of around 5% for all investigated problem sizes.
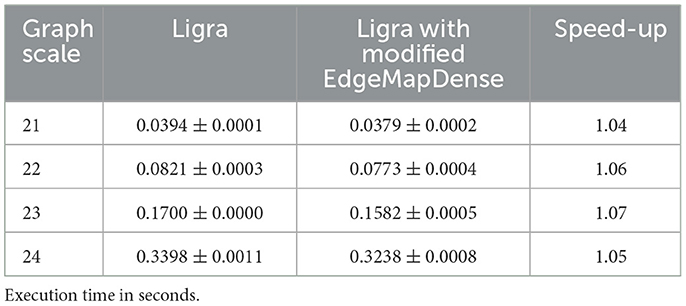
Table 6. Ligra: performance comparison on AWS Graviton 4 (baseline) and Ligra with modified EdgeMapDense across N = 10 runs.
6 Conclusion
In this paper, we presented a conceptual approach towards making the gem5 simulator a suitable tool for application developers and performance engineers. The approach is potentially also of benefit for compiler engineers and other system software components, e.g. the operating system. As a first step, we developed a tool that enables automatic procedure block detection. Furthermore, we showed how our enhanced version of the gem5 simulator can be used to address a selected set of performance issues. These results have been applied in the context of different case studies. For these case studies, we considered different kernels of applications that represent a range of HPC applications.
The benefit of the proposed approach is that gem5 itself already provides a large and diverse set of statistics that can help to improve the often difficult to uncover interplay between the observed performance of an application, and the complex hardware architecture on which it is being executed. There is a lot of freedom to add further event monitors to gem5 as well as more complex analysis mechanisms. In this paper, only a few examples have been shown.
There are, however, a number of limitations to this approach. While the performance of gem5 allows for simulation of complex application kernels, simulations of such kernels on a larger number of cores or even a full many-core processor architecture is likely to be prohibitively expensive. Single-core simulations are about 5-6 orders of magnitude slower compared to execution on real hardware. Distributed frameworks like COSSIM (Tampouratzis and Papaefstathiou, 2024) may help to mitigate this challenge. Furthermore, the use of gem5 to optimise code for specific processor solutions depends on the availability of validated gem5 configurations. At this point, no library for ready-to-use configurations is available. Finally, while various studies have shown good agreement between results obtained on real hardware and corresponding gem5 simulations, the discrepancies may not be good enough for all cases. There is also a risk of mismatches between the origin, i.e. a specific processor solution, and the model, i.e. a gem5 setup, which only show up under specific circumstances.
For the future, we plan to extend the list of performance issues for which automatic detection can be integrated into gem5. Furthermore, we aim for further case studies to further explore the benefits and disadvantages of the proposed approach.
Data availability statement
The modified version of the gem5 simulator used for this article has been made available at https://github.com/FZJ-JSC/gem5-tbstats.
Author contributions
CF: Writing – original draft. SL: Writing – original draft. NH: Writing – review & editing. ES: Writing – review & editing. DP: Writing – original draft.
Funding
The author(s) declare that financial support was received for the research and/or publication of this article. Funding for parts of this work has been received from the European Union's HORIZON MSCA Doctoral Networks programme AQTIVATE under Grant Agreement No. 101072344 as well as the EuroHPC Joint Undertaking under Grant Agreements 101034126 (The European PILOT) and 101036168 (EPI-SGA2).
Acknowledgments
We want to thank the Open Edge and HPC Initiative for access to an Arm-based development environment as well as computational resources for gem5 simulations through the HAICGU cluster at the Goethe University of Frankfurt. Finally, we would like to acknowledge the feedback from the reviewers, which led to various improvements of this manuscript.
Conflict of interest
ES was employed by company SiPEARL.
The remaining authors declare that the research was conducted in the absence of any commercial or financial relationships that could be construed as a potential conflict of interest.
Generative AI statement
The author(s) declare that no Gen AI was used in the creation of this manuscript.
Any alternative text (alt text) provided alongside figures in this article has been generated by Frontiers with the support of artificial intelligence and reasonable efforts have been made to ensure accuracy, including review by the authors wherever possible. If you identify any issues, please contact us.
Publisher's note
All claims expressed in this article are solely those of the authors and do not necessarily represent those of their affiliated organizations, or those of the publisher, the editors and the reviewers. Any product that may be evaluated in this article, or claim that may be made by its manufacturer, is not guaranteed or endorsed by the publisher.
Footnotes
References
Abraham, M. J., Murtola, T., Schulz, R., Páll, S., Smith, J. C., Hess, B., et al. (2015). GROMACS: high performance molecular simulations through multi-level parallelism from laptops to supercomputers. SoftwareX 1, 19–25. doi: 10.1016/j.softx.2015.06.001
Adhianto, L., Banerjee, S., Fagan, M., Krentel, M., Marin, G., Mellor-Crummey, J., et al. (2010). HPCTOOLKIT: tools for performance analysis of optimized parallel programs. Concurr. Computat.: Pract. Exp. 22, 685–701. doi: 10.1002/cpe.1553
Akiyama, S., and Hirofuchi, T. (2017). “Quantitative evaluation of Intel PEBS overhead for online system-noise analysis,” in Proceedings of the 7th International Workshop on Runtime and Operating Systems for Supercomputers ROSS 2017, ROSS 2017 (New York, NY: Association for Computing Machinery).
Barry, D., Jagode, H., Danalis, A., and Dongarra, J. (2023). “Memory traffic and complete application profiling with papi multi-component measurements,” in 2023 IEEE International Parallel and Distributed Processing Symposium Workshops (IPDPSW) (Melbourne: IEEE), 393–402.
Binkert, N., Beckmann, B., Black, G., Reinhardt, S. K., Saidi, A., Basu, A., et al. (2011). The gem5 simulator. SIGARCH Comput. Archit. News 39, 1–7. doi: 10.1145/2024716.2024718
Birk, S., and Frommer, A. (2012). A CG method for multiple right hand sides and multiple shifts in lattice QCD calculations. PoS, Lattice 2011:027. doi: 10.22323/1.139.0027
Brank, B. (2023). Vector length agnostic SIMD parallelism on modern processor architectures with the focus on Arm's SVE (PhD thesis). Bergische Universität Wuppertal, North Rhine-Westphalia, Germany.
Brank, B., and Pleiter, D. (2023). “CPU architecture modelling and co-design,” in High Performance Computing, eds. A. Bhatele, J. Hammond, M. Baboulin, and C. Kruse (Cham: Springer).
Browne, S., Dongarra, J., Garner, N., Ho, G., and Mucci, P. (2000). A portable programming interface for performance evaluation on modern processors. Int. J. High Perform. Comput. Appl. 14, 189–204. doi: 10.1177/109434200001400303
Calder, A. C., Siegmann, E., Feldman, C., Chheda, S., Smolarski, D. C., Swesty, F. D., et al. (2023). Ookami: An A64FX Computing Resource. arXiv. doi: 10.48550/arXiv.2311.04259
Domke, J., Vatai, E., Gerofi, B., Kodama, Y., Wahib, M., Podobas, A., et al. (2023). At the locus of performance: quantifying the effects of copious 3D-stacked cache on HPC workloads. ACM Trans. Archit. Code Optim. 20:4. doi: 10.1145/3629520
Falquez, C., Ho, N., Suarez, E., Schätzle, F., Portero, A., and Pleiter, D. (2025). “gem5-dbc: a declarative benchmark configuration framework for architectural exploration with gem5,” in, Presentation at the gem5 Workshop at ISCA 2025. Available online at: https://www.gem5.org/events/isca-2025
Frommer, A., Kahl, K., Krieg, S., Leder, B., and Rottmann, M. (2014). Adaptive aggregation-based domain decomposition multigrid for the lattice wilson-dirac operator. SIAM J. Scient. Comp. 36, A1581–A1608. doi: 10.1137/130919507
Geimer, M., Wolf, F., Wylie, B. J. N., Ábrahám, E., Becker, D., and Mohr, B. (2010). The Scalasca performance toolset architecture. Concurr. Comp.: Pract. Exp. 22, 702–719. doi: 10.1002/cpe.1556
Knüpfer, A., Brunst, H., Doleschal, J., Jurenz, M., Lieber, M., Mickler, H., et al. (2008). “The vampir performance analysis tool-set,” in Tools for High Performance Computing, eds. M. Resch, R. Keller, V. Himmler, B. Krammer, and A. Schulz (Berlin: Springer), 139–155.
Kodama, Y., Odajima, T., Asato, A., and Sato, M. (2019). Evaluation of the RIKEN Post-K Processor Simulator. arXiv. doi: 10.48550/arXiv.1904.06451
Laukemann, J., Hammer, J., Hofmann, J., Hager, G., and Wellein, G. (2018). “Automated Instruction Stream Throughput Prediction for Intel and AMD Microarchitectures.” in 2018 IEEE/ACM Performance Modeling, Benchmarking and Simulation of High Performance Computer Systems (PMBS), 121–131.
Lowe-Power, J, Ahmad, A., Armejach, A., Herrera, A., Roelke, A., Farmahini-Farahani, A., Mondelli, A., et al. (2020). The gem5 Simulator: Version 20.0+.
McCalpin, J. D. (2023). “Bandwidth limits in the Intel Xeon Max (sapphire rapids with HBM) processors,” in High Performance Computing, eds. A. Bienz, M. Weiland, M. Baboulin, and C. Kruse (Cham: Springer Nature Switzerland), 403–413.
Miksits, S., Shi, R., Gokhale, M., Wahlgren, J., Schieffer, G., and Peng, I. (2024). “Multi-level memory-centric profiling on ARM processors with ARM SPE,” in SC24-W: Workshops of the International Conference for High Performance Computing, Networking, Storage and Analysis, 996–1005.
Nassyr, S., and Pleiter, D. (2024). “Exploring processor micro-architectures optimised for BLAS3 micro-kernels,” in Euro-Par 2024: Parallel Processing, eds. J. Carretero, S. Shende, J. Garcia-Blas, I. Brandic, K. Olcoz, and M. Schreiber Cham: Springer Nature Switzerland, 47-61,
Oden, L., Nölp, K., and Brauner, P. (2024). “Integrating interactive performance analysis in jupyter notebooks for parallel programming education,” in 2024 IEEE International Parallel and Distributed Processing Symposium Workshops (IPDPSW) (San Francisco, CA: IEEE), 369–376.
Pillet, V., Labarta, J., Cortes, A., and Girona, S. (1995). “PARAVER: A tool to visualize and analyze parallel code,” in World Occam and Transputer User Group Technical Meeting (Manchester: IOS Press), 17.
Sasongko, M. A., Chabbi, M., Kelly, P. H. J., and Unat, D. (2023). Precise event sampling on AMD versus Intel: quantitative and qualitative comparison. IEEE Trans. Parallel Distrib. Syst. 34, 1594–1608. doi: 10.1109/TPDS.2023.3257105
Shun, J., and Blelloch, G. E. (2013). “Ligra: a lightweight graph processing framework for shared memory,” in Proceedings of the 18th ACM SIGPLAN Symposium on Principles and Practice of Parallel Programming, PPoPP 2013 (New York, NY: Association for Computing Machinery), 135–146.
Tampouratzis, N., and Papaefstathiou, I. (2024). “Fast, accurate and distributed simulation of novel HPC systems incorporating ARM and RISC-V CPUs,” in Proceedings of the 33rd International Symposium on High-Performance Parallel and Distributed Computing, HPDC 2024 (New York, NY: Association for Computing Machinery), 389–392.
Valensi, C., Jalby, W., Tribalat, M., Oseret, E., Ibnamar, S., and Camus, K. (2019). “Using MAQAO to analyse and optimise an application,” in 2019 IEEE 27th International Symposium on Modeling, Analysis, and Simulation of Computer and Telecommunication Systems (MASCOTS) (Rennes: IEEE), 423–424.
Vavrik, R., Panoc, T., Garcia-Gasulla, M., Wylie, B. J. N., and Mohr, B. (2025). “POP3: advancing HPC performance and productivity: invited paper,” in Proceedings of the 22nd ACM International Conference on Computing Frontiers: Workshops and Special Sessions, CF 2025 Companion (New York, NY: Association for Computing Machinery), 157–162.
Virtanen, P., Gommers, R., Oliphant, T. E., Haberland, M., Reddy, T., Cournapeau, D., et al. (2020). SciPy 1.0: fundamental algorithms for scientific computing in Python. Nat. Methods 17, 261–272. doi: 10.1038/s41592-020-0772-5
Walker, M., Bischoff, S., Diestelhorst, S., Merrett, G., and Al-Hashimi, B. (2018). “Hardware-validated CPU performance and energy modelling,” in 2018 IEEE International Symposium on Performance Analysis of Systems and Software (ISPASS) (San Francisco, CA: IEEE), 44–53.
Wylie, B. J., Giménez, J., Feld, C., Geimer, M., Llort, G., Mendez, S., et al. (2025). 15+ years of joint parallel application performance analysis/tools training with Scalasca/Score-P and Paraver/Extrae toolsets. Fut. Generat. Comp. Syst. 162:107472. doi: 10.1016/j.future.2024.07.050
Zaourar, L., Benazouz, M., Mouhagir, A., Jebali, F., Sassolas, T., Weill, J.-C., et al. (2021). “Multilevel simulation-based co-design of next generation HPC microprocessors,” in 2021 International Workshop on Performance Modeling, Benchmarking and Simulation of High Performance Computer Systems (PMBS) (St. Louis, MO: IEEE), 18–29.
Keywords: high-performance computing (HPC), processor architectures, instruction set extensions, vector instructions, Arm's Scalable Vector Extension (SVE), RISC-V's RVV, performance counters, performance profiles
Citation: Falquez C, Long S, Ho N, Suarez E and Pleiter D (2025) Processor simulation as a tool for performance engineering. Front. High Perform. Comput. 3:1669101. doi: 10.3389/fhpcp.2025.1669101
Received: 18 July 2025; Accepted: 27 October 2025;
Published: 02 December 2025.
Edited by:
Michael Brim, Oak Ridge National Laboratory (DOE), United StatesReviewed by:
Giorgis Georgakoudis, Lawrence Livermore National Laboratory (DOE), United StatesNikolaos Tampouratzis, International Hellenic University, Greece
Copyright © 2025 Falquez, Long, Ho, Suarez and Pleiter. This is an open-access article distributed under the terms of the Creative Commons Attribution License (CC BY). The use, distribution or reproduction in other forums is permitted, provided the original author(s) and the copyright owner(s) are credited and that the original publication in this journal is cited, in accordance with accepted academic practice. No use, distribution or reproduction is permitted which does not comply with these terms.
*Correspondence: Dirk Pleiter, cGxlaXRlckBrdGguc2U=