 Hakim C. Achterberg
 Marcel Koek
 Wiro J. Niessen
- 1Biomedical Imaging Group Rotterdam, Departments of Medical Informatics and Radiology, Erasmus MC, Rotterdam, Netherlands
- 2Imaging Science & Technology, Faculty of Applied Sciences, Delft University of Technology, Delft, Netherlands
With the increasing number of datasets encountered in imaging studies, the increasing complexity of processing workflows, and a growing awareness for data stewardship, there is a need for managed, automated workflows. In this paper, we introduce Fastr, an automated workflow engine with support for advanced data flows. Fastr has built-in data provenance for recording processing trails and ensuring reproducible results. The extensible plugin-based design allows the system to interface with virtually any image archive and processing infrastructure. This workflow engine is designed to consolidate quantitative imaging biomarker pipelines in order to enable easy application to new data.
1. Introduction
In medical image analysis, most methods are no longer implemented as a single executable, but as a workflow composed of multiple programs that are run in a specific order. Each program is executed with inputs that are predetermined or resulting from the previous steps. With increasing complexity of the methods, the workflows become more convoluted and encompass more steps. This makes execution of such a method by hand tedious and error-prone, and makes reproducing the exact chain of processing steps in subsequent studies challenging. Therefore, solutions have been created that are based on scripts that perform all the steps in the correct order.
In population imaging, data collections are typically very large and are often acquired over prolonged periods of time. As data collection is going on continuously, the concept of a “final” dataset is either non-existent or defined after a very long follow up time. Commonly, analyses on population imaging datasets, therefore, define intermediate cohorts or time points. To be able to compare intermediate cohorts, all image analysis methods need to produce consistent results over time and should be able to cope with the ever growing size of the population imaging. Therefore, the process of running analysis pipelines on population imaging data needs to be automated to ensure consistency and minimize errors.
When different population imaging cohorts are combined in multi-center imaging studies or imaging biobanks (e.g., ADNI (Mueller et al., 2005), OASIS (Marcus et al., 2007b), The Heart-Brain Connection (van Buchem et al., 2014) and BBMRI-NL2.01) where data are often acquired from different scanners, the challenge of ensuring consistency and reliability of the processing results also calls for automated processing workflows.
Traditionally, this is accomplished by writing scripts created specifically for one processing workflow. This can work well, but generally the solutions are tailor-made for a specific study and software environment. This makes it difficult to apply such a method to different data or on a different infrastructure than originally intended. With evolving computational resources, in practice this approach is, therefore, not reproducible and difficult to maintain. Additionally, for transparency and reproducibility of the results, it is very important to know exactly how the data were processed. To accomplish this, a comprehensive data provenance system is required.
Writing a script that takes care of all the aforementioned issues is a challenging and time consuming task. However, many of the components are generic for any type of workflow and do not have to be created separately for each workflow. Workflow management systems can be used to address these issues. These systems help formalize the workflow and can provide features, such as provenance as part of the framework, removing the need to address these for every separate workflow.
For our use cases, we desire a workflow management system that works with the tools found in the domain of image analysis, can handle advanced data flows (explained more in detail in section 2.3), has strong provenance handling, can handle multiple version of tools, flexible execution backend, and can be embedded in our infrastructure. There are already a number of workflow systems available, but none of them fit all our criteria (see Table 1).
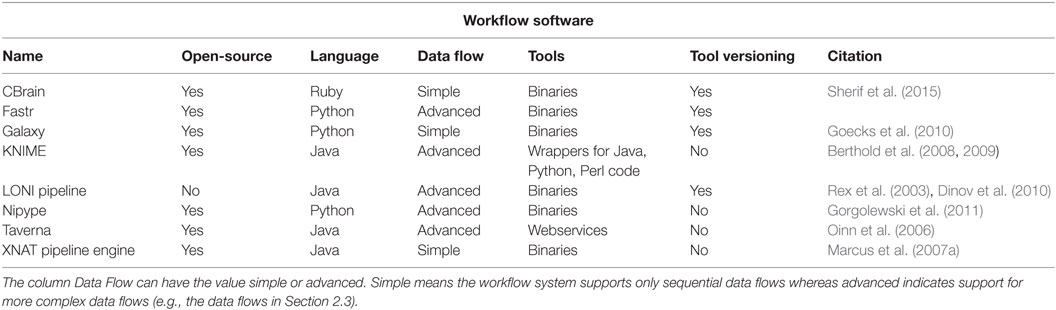
Table 1. A overview of workflow systems and the important features of each.
The most notable open-source, domain-specific workflow system that we are aware of is Nipype (Gorgolewski et al., 2011), which is aimed at creating a common interface for a variety of neuroimaging tools. It also features a system for creating workflows. The tool interfaces of Nipype are elaborate, but Nipype only tracks the version of tools, but does not manage it. This means the system is only aware of the currently installed version of the tool, and cannot offer multiple versions simultaneously.
LONI pipeline (Rex et al., 2003; Dinov et al., 2010) and CBrain (Sherif et al., 2015) also have been developed for the domain of medical image analysis. They include workflow engines, but these systems are part of larger environments that includes data management and processing backends. This makes it difficult to integrate in our infrastructure. Furthermore, LONI is closed-source, which makes it even more difficult to integrate it.
The XNAT storage system also has a related workflow system called XNAT pipeline engine (Marcus et al., 2007a). The pipeline engine is integrated nicely with the XNAT storage system and works with simple data flows. However, it does not handle advanced data flows and does not provide tool versioning.
Besides the workflow systems specific for the domain of medical image analysis, there are a number of other notable workflow systems that are either domain-independent or have been created for a different domain. Taverna (Oinn et al., 2006) and KNIME (Berthold et al., 2008, 2009) are well-known and mature workflow management systems. These systems are domain-independent, but mostly used in the bioinformatics field. Their support for local binary targets is limited and, therefore, not suitable for using most medical imaging analysis tools. KNIME needs tools to be created with their API and Taverna is mostly focused on web services.
Finally, Galaxy (Goecks et al., 2010) is a web-based workflow system for bioinformatics. It is mainly focused on next-generation sequencing (NGS). It has a large repository of tools, web interface, and large support in their domain. However, the system is not designed for batch processing and it does not support complex data-flows.
We developed an image processing workflow framework for creating and managing processing pipelines: Fastr. The framework is designed to build workflows that are agnostic to where the input data are stored, where the resulting output data should be stored, where the steps in the workflow will be executed, and what information about the data and processing needs to be logged for data provenance. To allow for flexible data handling, the input and output of data are managed by a plugin-based system. The execution of the workflow is managed by a pluggable system as well. The provenance system is a built-in feature that ensures a complete log of all processing steps that led to the final result.
In the following section, we discuss the design of Fastr. In Section 3, we present the resulting software. Finally, we discuss related work and future directions in section 4.
2. Design
The Fastr workflow design follows similar principles as flow-based programing (Morrison, 2010). This paradigm defines applications as a network of black boxes, with predefined connections between the black boxes that indicate the data flow. The black boxes can be reordered and reconnected to create different workflows. However, it should be noted that other aspects of the paradigm are not met, so our design can at most be considered to have flow-based programing aspects.
In Fastr, the workflow is described as a Network, which is a directional acyclic graph. The Nodes of this Network are based on templates that we call Tools. These Nodes can be interpreted as the black boxes from the flow-based programing paradigm. In the next subsection, we will discuss the Tools in more detail. After that, we will describe the Network and its components in more detail using an example from medical image analysis.
2.1. Tools
In Fastr, the Tools are the blueprints for the Nodes: they describe the input, output, and behavior of the Node. The Tools are composed of three main parts: general metadata, a target, and an interface. The Tools are stored as XML or JSON files. An example of a simple Tool that adds two list of integers element-wise is given in Listing 1. The general metadata contains information about the Tool, such as id, version, author, and license. The target describes how to set the execution environment properly, e.g., by setting the correct search path to use a specific version of the software. The interface describes the inputs and outputs of a Tool and how the Tool executes given a set of inputs and outputs.
The tools are specified in a schema. This schema validates the internal python data structures (after conversion from XML or JSON) and is specified as a JSON schema. The schemas are located in the source code. There is a schema for the general Tool2 and a schema for the FastrInterface.3 Other types of Interfaces can also defined by their own data schema files.
Listing 1. The XML code that defines the AddInt Tool. Note that though it might seem the two author entries are redundant or conflicting, the first one states the author of the Tool description file, whereas the second states the author of the underlying command (addint.py in this case).
<tool id="AddInt" name="Add two integers" version="1.0">
<description>Add two integers together.</description>
<authors>
<author name="Hakim Achterberg" email="h.achterberg@erasmusmc.nl"
↪ url="http://www.bigr.nl/people/HakimAchterberg"/>
</authors>
<command version="0.1" url="">
<targets>
<target os="*" arch="*" interpreter="python" paths="./" bin="addint.py"/>
</targets>
<description>
addint.py value1 value2
output = value1 + value2
</description>
<authors>
<author name="Marcel Koek" email="m.koek@erasmusmc.nl"
↪ url="http://www.bigr.nl/people/MarcelKoek"/>
</authors>
</command>
<repository/>
<interface>
<inputs>
<input id="left_hand" name="left hand value" datatype="Int" prefix="––
↪ in1" cardinality="1-*" repeat_prefix="false" required="true"/>
<input id="right_hand" name="right hand value" datatype="Int" prefix="––in2"
↪ cardinality="as:left_hand" repeat_prefix="false" required="true"/>
</inputs>
<outputs>
<output id="result" name="Resulting value" datatype="Int" automatic="True"
↪ cardinality="as:left_hand" method="json" location="∧RESULT=(.*)$">
<description>The summation of left_hand and right_hand.</description>
</output>
</outputs>
</interface>
</tool>
The content of the interface tag depends on the class of Interface used. The default Interface class in Fastr creates a call to a command-line program given the set of Inputs and Outputs. In the example, there are two inputs and one output. In Fastr, the minimal information required for an Interfaces to function is the id, cardinality and data type for each Input and Output. The cardinality is the number of values a sample contains (e.g., an argument requiring a point in 3D space, represented by three float values, would have a cardinality of 3).
In Fastr, there is a notion of datatypes: each input and output has a (set of) data types it accepts or produces. The datatypes in Fastr are plugins that, in the simplest form, only need to expose their id, but can be extended to include functionality, such as validators and handlers for multi-file data formats. Data types can be simple values or point to files.
Fastr checks if the datatypes of a linked input and output are (or at least can be) compatible. In addition, data types can be grouped, which is useful for groups of programs using a common (io) library (for example, programs created with The Insight Segmentation and Registration Toolkit4 (Yoo et al., 2002) can read/write a number of images formats that we grouped together in a pseudo-datatype).
2.2. Networks
After Tools are defined, a workflow can be created by linking a set of Tools that results in a Network. Once a Network is defined, it can be executed. Figure 1 shows a graphic representation of an atlas-based segmentation workflow, using the image registration software Elastix (Klein et al., 2010). Elastix can register two images by optimizing the transformation applied to a moving image to match it to a fixed reference image.
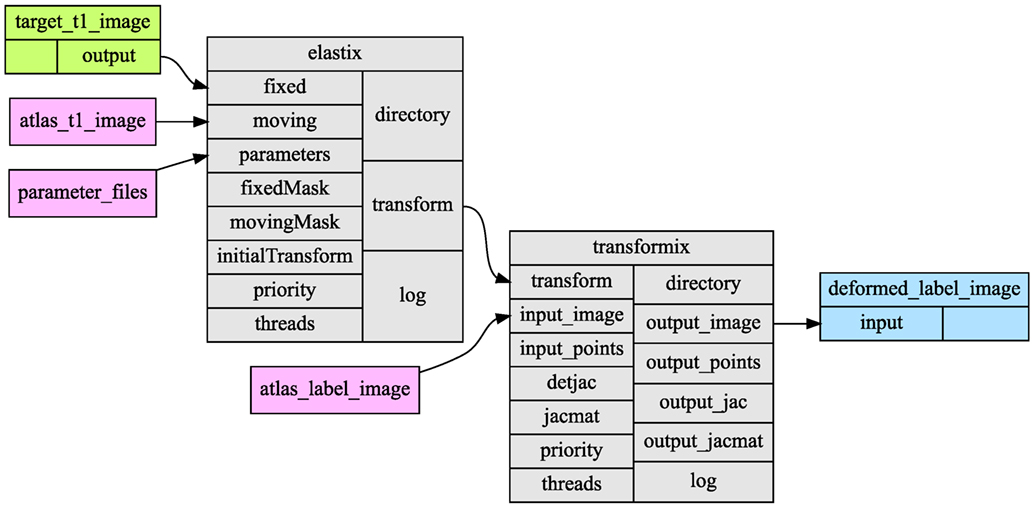
Figure 1. Example Network representing a single atlas-based segmentation workflow implemented using the open source Elastix image registration software. Green boxes are Source Nodes, purple Constant Nodes, gray normal Nodes, and blue Sink Nodes. Each Node contains two columns: the left column represents the inputs, the right column represents the outputs of the Node. The arrows indicate links between the inputs and outputs. This image was generated automatically from the source code.
There are different classes of Nodes: normal Nodes (gray blocks in Figure 1), Source Nodes (green), Constant Nodes (purple), and Sink Nodes (blue). Data enter the Network through a Source Node and leave the Network through a Sink Node. A Constant Node is similar to the Source Nodes, but has its data defined as part of the Network. When a Network is executed, the data for the Source Nodes and Sink Nodes has to be supplied. The specifics of the Source Nodes and Sink Nodes will be discussed in section 2.4. The normal Nodes process the data as specified by the Tool.
The data flow in the Network is defined by links (the arrows in Figure 1). A link is a connection between the output of a Node and the input of another Node. A link can manipulate the flow of the data, which will be discussed in section 2.3.
The Nodes and links in the Network form a graph from which the dependencies can be determined for the execution order. Since all Nodes are black-boxes that can operate independently of each other, this allows for Nodes to be executed in parallel as long as the input dependencies are met.
2.3. Data Flow
In Fastr, a sample is defined as the unit of data that are presented to an input of a Node for a single job. It can be a simple scalar value, a string, a file, or a list of the aforementioned types. For example, in the addint Tool presented in Listing 1, the left_hand and right_hand inputs of the Tool are required to be (lists of) integers. The result output will generate a sample that contains a list of integers. As the cardinality of right_hand and result are defined to be the same as the left_hand, they will all have to same length.
Fastr can handle multiple samples on a specific input. Figure 2 shows examples of how Fastr handles inputs with multiple samples and in which output samples this results. The inputs and output names are abbreviated as lh for left_hand, rh for right_hand and res for result. In Figure 2A, we present the simplest situation, in which one sample with one value is offered to each input and one sample with one value is generated. In Figure 2B, the left_hand and right_hand inputs have one sample with two values. The result is a sample with two values, as one result value is created per input value.
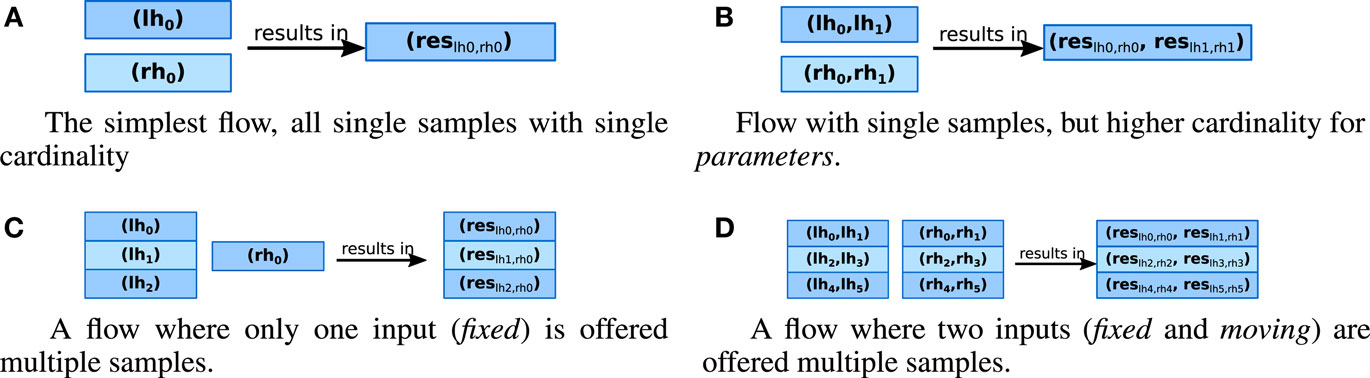
Figure 2. Illustration of the data flows in a Node. Each rectangle is a sample, and a block of rectangles represents a sample collection. The value is printed in each rectangle, where the commas separate multiple values. The samples lh are offered to the left_hand input, the sample rh to right_hand input. The sample res is generated for the result output. The subscript of sample res indicates which input samples were used to generate the result.
To facilitate batch processing, a Node can be presented with a collection of samples. These collections are multi-dimensional arrays of samples. In Figure 2C, we depict a situation where three additions are performed. Three samples are offered to the left_hand input and one sample is offered to the right_hand input. This results in three samples: each sample of the left_hand input was used in turn, whereas the samples for the right_hand were considered constant. In Figure 2D, there are three samples for the left_hand and right_hand inputs. The result is again three samples, as now each pair of samples from left_hand and right_hand inputs was taken.
This is useful for simple batch processing where a task should be repeated a number of times for different input values. However, in certain situation (e.g., multi-atlas segmentation), it is required to register every fixed image to every moving image. To simplify this procedure, Fastr can switch from pairwise behavior to cross product behavior. In Figure 3, this is depicted graphically. Every combination of left_hand and right_hand sample is used for registration and the result is a two-dimensional array of transformation samples that in turn contain two transformations each.
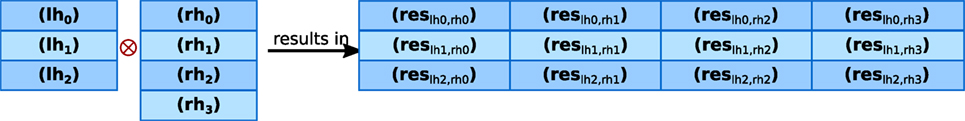
Figure 3. Illustration of the data flows in a Node that has multiple input groups. The default operator creates a new sample for each combination of input groups.
Sometimes a Tool outputs a sample with a higher cardinality that should be treated as separate samples for further processing, or conversely a number of samples should be offered as a single sample to an input (e.g., for taking an average). For this, Fastr offers two flow directives in data links. The first directive is expand, which indicates that the cardinality is to be transformed into a new dimension. This is illustrated in the left side of Figure 4. The second directive is collapse, which indicates one or more dimensions in the sample array should be collapsed and combined into the cardinality. This process is illustrated in the right side of Figure 4. These flow directives allow for more complex dataflows in a simple fashion and enable users to implement MapReduce type of workflows.
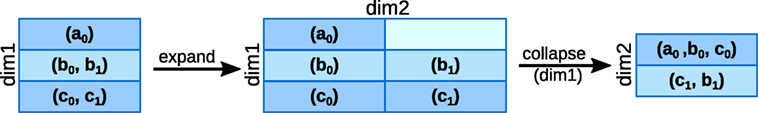
Figure 4. Collapsing and expanding flows. The start situation on the left expands to the situation in the middle after which data collapses the first dimension. Note that in the middle situation there is an empty place in the sample collection (top right). This is possible due to a sparse array representation of the sample collections. This results in two samples with different cardinality in the right-most situation.
2.4. Data Input and Output
The starting points of every workflow are Source Nodes, in which the data are imported into the Networks. Similarly, the endpoints of every workflow are the Sink Nodes, which export the data to the desired location. When a Network is constructed only the data type for the Source Nodes and Sink Nodes needs to be defined. The actual definition of the data is done at runtime using uniform resource identifiers (URI).
Based on the URI scheme, the retrieval and storage of the data will be performed by a plugin. Consider the following two example URIs:
vfs://mount/some/path/file1.txt
xnat://xnat.example.com/data/archive/projects/sandbox/subj…
The schemes (in red) of these URI indicate by which plugin the retrieval or storage of the data is handled. For the first URI, vfs indicates that the URI will be handled by the Virtual File System plugin. For the second URI, xnat indicates that the URI will be handled by the XNAT storage plugin. These plugins implement the methods to actually retrieve and store the data. The remainder of the URI is handled by the plugin, so the format of the schemes URI format is defined by the plugin developer.
Plugins can also implement a method to expand a single URI into multiple URIs based on wildcards or searches. In the following example, URIs we use wildcards (shown in blue) to retrieve multiple datasets in one go:
xnat://xnat.example.com/search?projects=test&subjects=s[0-9]…
vfsregexp://tmp/network_dir/.*/.*/__fastr_result__.pickle.gz
The XNAT storage plugin has a direct storage as well as search URI scheme defined. The VFS regular expression plugin uses the regexp filter to generate a list of matching vfs URIs. This illustrates that a plugin can expand a url into urls of a different type, and the newly generated urls will be handled by the appropriate plugin.
The use of URIs makes the Network agnostic to the location and storage method of the source and target data. Also, it allows easy loading of large amounts of resources using wildcards, csv files or search queries.
Currently, Fastr includes plugins for input/output from the (virtual) file system, csv files and XNAT. New plugins can be created easily as there are only a few methods that need overwriting. It is also possible to make plugins that can only read data, only write data, or only perform search queries. This allows users to create plugins purely for reading or writing.
Fastr does not include a credential store or other solution for authentication. For all Network based input/output plugins (e.g., the XNAT plugin) a netrc file stored in the user’s home directory is used for authentication. However, for running Fastr on a grid without a shared network drive this might lead to problems.
2.5. Execution
The Fastr framework is designed to offer flexible execution of jobs. The framework analyzes the workflow and creates a list of jobs, including dependencies, that need to be executed. Then it dispatches the jobs to an execution plugin. The plugins can run jobs locally or dispatch them to an execution system, such as a cluster, grid, or cloud. A different plugin can be selected for each run allowing for easy switching of the execution backend.
The Fastr execution system consists of a number of components that work together in a layered fashion (see Figure 5). The execution starts when the Network execute method is called. We will call the machine on which the Network execution is started the Submit Host.
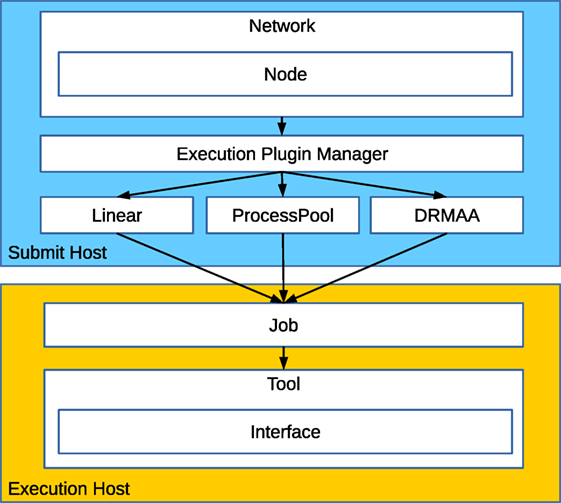
Figure 5. An overview of the execution components in Fastr. The Network controls the main execution, it sorts the Nodes required and executes those, resulting in a list of jobs to be run. The jobs are dispatched via an execution plugin. The job is then executed. On execution, all arguments are translated to values and paths that the Tool can use. The Tool then sets the environment and, finally, calls the Interface for the actual running of the underlying task.
Fastr analyzes the Network and divides it in chunks that can be processed further. For each chunk, the Network determines in what order the Nodes have to be processed and then executes the Nodes in the correct order. When a Node is executed, it analyzes the samples on each input and creates a job for each combination input (as specified by the data flow directives).
Jobs contain all information needed to run a single task (e.g., input/output arguments, Tool used, etc). The jobs are then dispatched by an execution plugin. The plugin can run the job remotely (e.g., on a compute cluster or cloud) or locally (in which case the Submit Host and Execution Host are the same).
Jobs are executed on the Execution Host, and during this step the arguments are translated from urls to actual paths/values. Subsequently, the Tool sets the environment for execution according to the target specification and invokes the interface. The interface executes the actual Tool commands. Once the interface returns its results, they are validated and the paths in the results are translated back into urls.
Once the job execution is finished, the execution plugin will trigger a callback on the Submit Host that reads the job result and updates the Network accordingly. If a chunk is finished, the Network will process the next chunk, using the updated information. If all chunks are finished, the Network execution is done.
Currently, Fastr supports functional plugins for processing locally and on a cluster (using the DRMAAv1 API5). Future plugins will focus on flexible middleware for grid/cluster/cloud, like Dirac,6 that offer support for a wide range of systems. For creating a new plugin, five methods need to be implemented: an initialization and a cleanup method as well as methods for queuing, releasing and canceling a job.
2.6. Provenance
Data provenance is a built-in feature of Fastr and is based on an implementation of the W3C PROV-DM: Prov Data model recommendation (Belhajjame et al., 2013). Fastr records all relevant data during execution and ensures that for every resulting file a complete data provenance document is included. The standard format of a provenance document is PROV-N, which can be serialized to PROV-JSON or PROV-XML.
In Figure 6, the three base classes and the properties of how they relate to each other are illustrated. For Fastr, Networks, Tools, and Nodes are modeled as agents, jobs as activities and data objects as entities. The relating properties are naturally valid for our workflow application. The hierarchy and topology of the Network follows automatically from the relating properties between the classes, but in order to make the provenance document usable for reproducibility, extra information is stored as attributes on the classes and properties. For every Tool, the version is stored. For every data sample, the value or file path and a checksum is stored. For every job, the start and end time of execution, the stdout and stderr logs are stored, the end status (success, success with warnings, failed, etc.), and an exhaustive description of the execution environment.
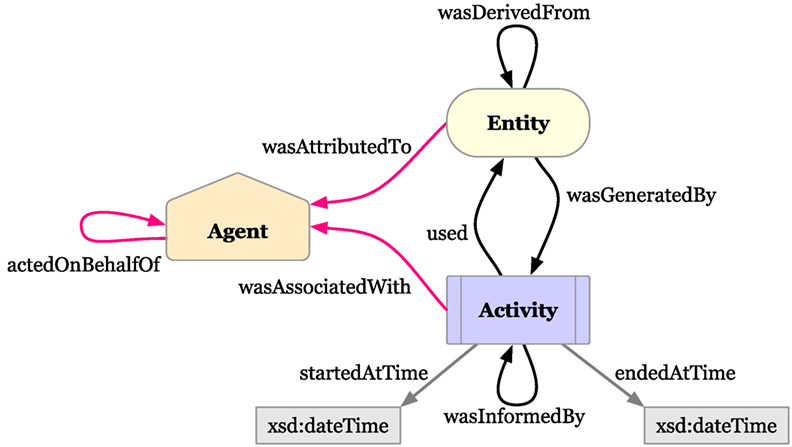
Figure 6. The three base classes of the provenance data model with their relating properties. The agents are orange pentagons, the entities are yellow ovals and the activities are depicted as blue squares. This image is copied from PROV-O: The PROV Ontology. Copyright © 2015 W3C® (MIT, ERCIM, Keio, Beihang). http://www.w3.org/Consortium/Legal/2015/doc-license
2.7. Visualization
To give the user insight in the data flow through the Network, it is possible to visualize the Network using graphviz (Gansner and North, 2000). The figures in this paper that show examples of Networks (Figures 1 and 7) are generated automatically by Fastr. Fastr plots the Tool as a collection of inputs and outputs and draws the links between them.
Because Fastr allows for more advanced data flows, there is a few visualization options that can aid users in validating the data flow. First, the color of a link changes if the flow in the Link is different. Second, there is an option to draw the dimension sizes in a Network. This shows the number of dimension and the expected size (as symbols). A simple example of the visualization of a more advanced dataflow is given in Figure 7.
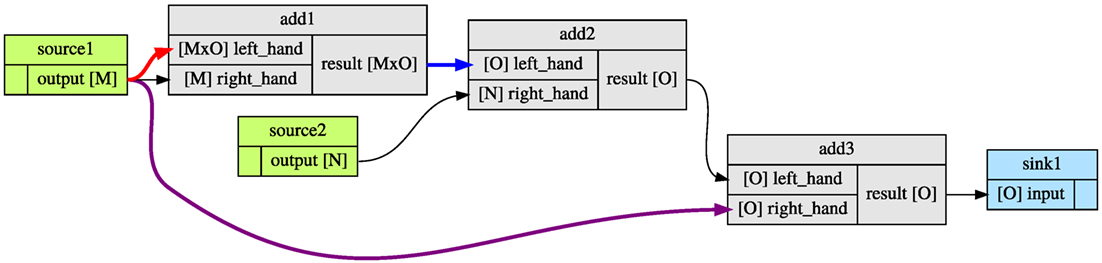
Figure 7. An example of flow visualization. The colored arrows indicate the flow directive in the link: red for expand, blue for collapse, and purple for a combination of both. After each input and output, the dimensions are printed in square bracket. In this workflow, the dimensions N and O should match, but the system can only validate this at runtime.
3. Evaluation
A functional version of Fastr is available from https://bitbucket.org/bigr_erasmusmc/fastr. Fastr is open-source and free to use (under the Apache license 2.0). The framework is written in Python and easy to install using the python package index (pip install)7 or using the included setuptools from the source distribution. Fastr is platform independent and runs on Linux, Mac, and Windows environments. However, Linux support is much more stable, since that is the platform used in most processing environments.
Documentation is available at http://fastr.readthedocs.io; it includes a quick start tutorial, a user manual and a developer reference of the code. The documentation is built using Sphinx.
The Fastr software is composed of core modules and plugins. The core modules implement the networking, data flow, and interfacing with the plugins. The plugins provide the data input/output, and execution functionality. Fastr is tested for code quality using both unit tests and functional tests. The unit tests are limited to the core modules and ensure the integrity of the core on a fine grained level. The functional testing covers the building and execution of small Networks. The functional tests validate the functional requirements of Fastr. Both the unit and the functional tests are performed continuously using the continuous integration framework Jenkins.8
Currently, we are using Fastr for a number of workflows for several single-center and multi-center studies. For example, the Rotterdam Scan Study (Ikram et al., 2011), containing over 12.000 scan sessions, uses a analysis pipeline implemented in Fastr for the preprocessing, tissue type segmentation, white matter lesion segmentation and lobes segmentation of brain MR images (see Figure 8). The data are fetched from the archive and is processed in a cluster environment. The resulting data are stored in an image archive.
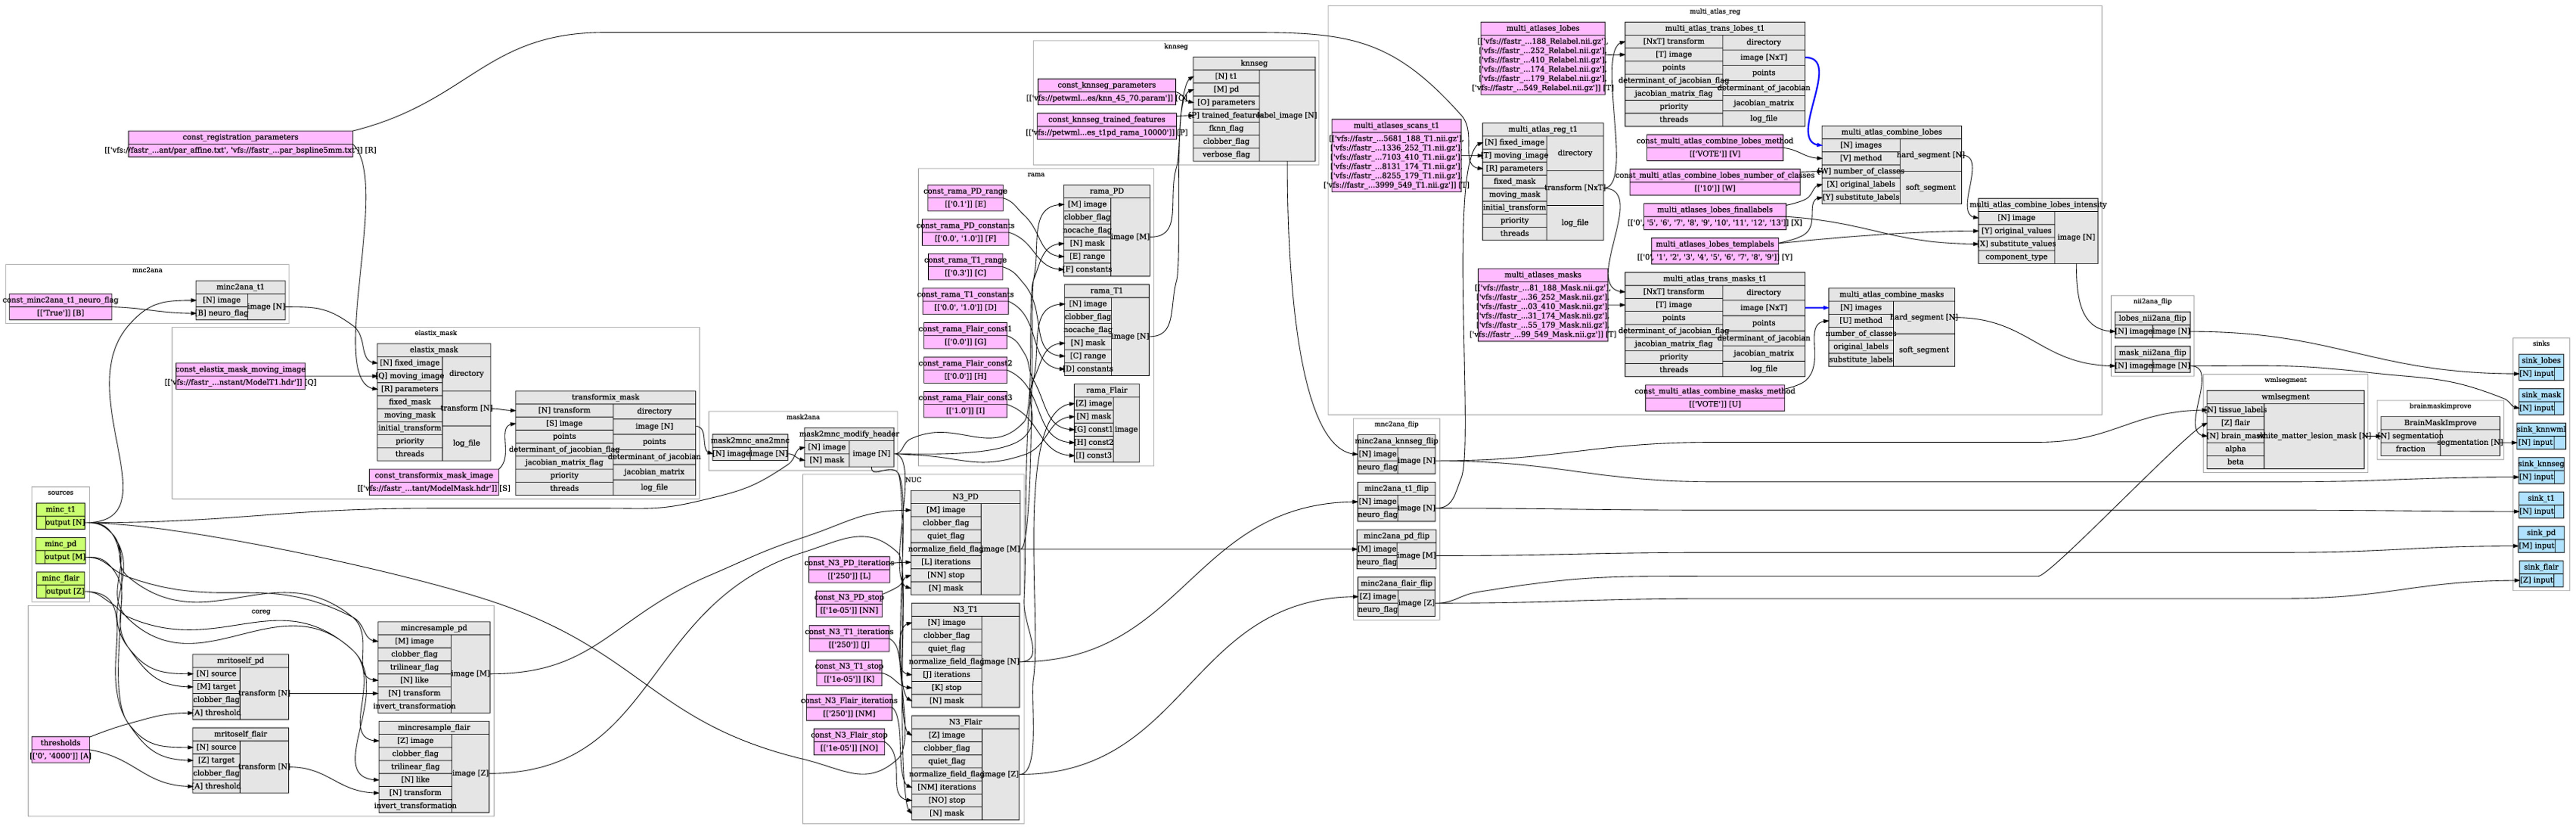
Figure 8. The graphical overview of the processing pipeline used for the Rotterdam Scan Study. It performs brain masking, bias field correction, segments the brain tissues, white matter lesions, and different lobels of brain.
Fastr has been used to run this workflow on new batches of subjects since mid 2015. Its performance has proven to be very stable as the workflow always succeeded. The overhead is limited as the Fastr workflow engine uses only a fraction of the resource compared the underlying Tools.
4. Discussion
With Fastr we created a workflow system that allows users to rapidly create workflows. The simple access to advanced features makes Fastr suitable for both simple and complex workflows. Workflows created with Fastr will automatically get data provenance, support for execution on various computational resources, and support for multiple storage systems. Therefore, Fastr speeds up the development cycle for creating workflows and minimizes the introduction of errors.
Fastr offers a workflow system that works with tools that can really be black boxes, they do not need to implement a specific API as long as their inputs and outputs can be defined. Fastr can manage multiple versions of tools, as we believe it is important to be able to keep an environment where all the old versions of tools are available for future reproducibility of the results. Additionally, it provides provenance records for every result for reproducibility of the experiments. Batch processing and advanced data flows are at the core of Fastrs design. Fastr communicates with processing backends and data providers via plugins allowing interoperability with other components of research infrastructures.
4.1. Workflow Languages
Most workflows systems and languages are simpler with respect to data flow. However, there are two languages that have features similar to that of Fastr. Taverna, using the SCUFL2 language, has a concept of a dot product or cross product for input ports. This is equivalent to the use of input groups in Fastr. Also the MOTEUR (Glatard et al., 2008) system, using the GWENDIA (Montagnat et al., 2009) language, has the same cross product and dot product concepts.
A main difference between Fastr and the other two languages is that Fastr describes the data as N-D arrays, and a cross product increases the number of dimensions, whereas GWENDIA and SCUFL2 follow the list (of lists) principle. Of course, a list of lists can be seen as a 2D array, but that is not used by the aforementioned languages.
There is also the recent effort of the Common Workflow Language, CWL (Amstutz et al., 2016). The CWL includes a specification for tools and workflows. The CWL has a support for an optional scatter directive. This allows a cross product type of behavior. However, this is not part of main specification, but rather an optional feature.
4.2. Limitations
The Fastr workflow system has been created with some clear goals, but there are also some limitations in the design. First of all, our design is created with automated processing workflows in mind and there is no support for interactive steps in the workflow. This is a design choice and there are no plans to address this issue.
Maybe the largest drawback of Fastr is that as a new system the amount of Tools available is limited. The Tool wrappers and interfaces are very flexible, but compared to systems as LONI pipeline and Nipype there is a lack of resources. This is a problem any new system faces and we believe that in time this issue will be resolved.
A similar issue is the limited number of execution backend plugins. The system is plugin based and has the potential to support almost any computational resource, but currently only supports local execution and cluster environments. We will add new plugins whenever a project requires one, but do not aim to create many additional plugins on the short term. For grid execution, this could be more challenging due to the lack of credentials management in Fastr. Currently, we do not facilitate advanced credential storage, which is often an important requirement in grid computing.
The system is currently completely command-line based and offers no graphical user interface (GUI). Since the focus of Fastr is batch processing, the target environments are mostly headless. It is good practice to completely decouple core functionality from the user interface, especially when running in headless environments. Therefore, we decided to spend our time on creating a solid workflow engine before creating a GUI. We believe that the tooling can always be added and improved later, but that the core design limitations are generally harder to solve in the future. We plan on adding more (graphical) tools that provide more convenient user interaction in the future.
And finally, we are not satisfied with our current test code coverage. We have test for some core functionally, but the code coverage of the unit tests on the low side. This is partially offset by the functional testing, but we feel we should improve the test code coverage to avoid technical debt.
4.3. Future Directions
Because of the differences in design philosophy, Fastr and Nipype are complementary in focus: Fastr is created for managed workflows and has tools and interfaces as a necessity, whereas the interfaces are the primary focus of Nipype. Considering that there are many interfaces available for Nipype, we created a prototype NipypeInterface in Fastr, which allows Tools in Fastr to use Nipype for the interface. This is still experimental and there are still some limitations because Nipype and Fastr have incompatible data type systems.
Another option to increase the amount of tools available is to start supporting Boutiques.9 Boutiques are an application repository with a standard packaging of tools, so that they can be used on multiple platforms. The boutiques applications are somewhat similar to Fastr Tools, as they describe the inputs and output in a JSON file. Additionally, the underlying binaries, scripts, and data are all packaged, versioned, and distributed using Docker10 containers. It would require to either rewrite the boutique inputs/outputs into a Fastr interface or to create a new interface class for Boutiques.
Although the CWL at the moment is as far as we know not used in the medical imaging domain, we think that support for the CWL is an important future feature for Fastr as we fully support the idea to have a common standard language. Support for CWL tools in Fastr could possible using a new interface class, but the support for workflows would probably need to be an import/export that transcribes workflows from CWL to Fastr and back.
For reproducibility, it is important to be able to re-run analyses in exactly the same conditions. Currently, Fastr supports environment modules to keep multiple versions of software available at the same time. However, the same version of the software can still be different based on underlying libraries, compiler used, and the OS. Virtual Machines or Linux Containers offer a solution to this problem. Linux containers, such as Docker and LXC, are often seen as a light-weight alternative to Virtual Machines. They ensure that the binaries and underlying libraries are all managed, but they use the kernel of the host OS. We plan to add support for Docker containers to make it easier to share tools and improve reproducibility further.
For continuous integration, we have a Jenkins (see text footnote 8) continuous integration server that runs our tests nightly. Additionally, we use SonarQube11 for inspecting code quality, technical debt, and code coverage. We are aiming for each release to increase the code coverage and to decrease the technical debt.
Finally, we are working on more (web-based) tooling around Fastr to make it easier to visualize, develop, and debug Networks and to inspect the results of a run (including provenance information).
Glossary
API – An application programing interface, a set of functions and protocols that allow the creation of applications that access the features another application or service.
Cardinality – The number of elements in a grouping. For Fastr specifically, this is the number of elements contained in a sample.
Code coverage – A measure indicating what part of the code is covered by a test suite. This is often expressed as a percentage of the total lines of code.
JSON – JavaScript Object Notation is an open data format that is used often in client-server communication and uses human readable text to present data in key-value pairs.
Linux Containers – Virtualization for running multiple isolated linux systems on one Linux kernel on the operating system level.
MapReduce – A programing model for processing large datasets. Typically, it consists of a Map operation on the elements and a Reduce operation that aggregates the elements into a final result.
Population imaging – Population imaging is the large-scale acquisition and analysis of medical images in controlled population cohorts. Population imaging aims to find imaging biomarkers that allow prediction and early diagnosis of diseases and preventive therapy.
Provenance – Report of the origin and operations that has been done on an object.
technical debt – A concept in programing that reflects the extra work that is the results of using quick solutions instead of the proper solution.
XML – eXtensible Markup Language is a human readable markup language for encoding documents.
Author Contributions
The Fastr workflow engine described in the article was designed and implemented primarily by HA and MK under supervision of WN. The manuscript was written primarily by HA and MK, and was revised by WN. All of the authors approved this work for publication.
Conflict of Interest Statement
WN is cofounder, part-time Chief Scientific Officer, and stockholder of Quantib BV. The remaining authors declare that the research was conducted in the absence of any commercial or financial relationships that could be construed as a potential conflict of interest.
Acknowledgments
We would like thank Coert Metz and Fedde van der Lijn for helping us with the creating the very first prototype of the system. We are grateful to the people from the BIGR group who were the first to test the system, give valuable feedback, and enough patience to allow us to improve to Fastr further. We would like to thank Esther Bron for proofreading the paper and giving us valuable feedback. Finally, we would like to thank all people who have contributed in any way to Fastr.
Funding
This work was supported by the following projects: The Heart Brain Connection Consortium, supported by the Netherlands Cardiovascular Research Initiative (CVON2012-06); Population Imaging Infrastructuur in Medical Delta, supported by European Regional Development Fund (Kansen voor West) and co-financed by the province of South-Holland; and BBMRI-NL2.0 (see text footnote 1).
Footnotes
- ^http://www.bbmri.nl
- ^https://bitbucket.org/bigr_erasmusmc/fastr/src/default/fastr/resources/schemas/Tool.schema.json
- ^https://bitbucket.org/bigr_erasmusmc/fastr/src/default/fastr/resources/schemas/FastrInterface.schema.json
- ^www.itk.org
- ^http://www.drmaa.org
- ^http://diracgrid.org
- ^https://pypi.python.org/pypi/fastr
- ^https://jenkins.io
- ^http://boutiques.github.io/
- ^https://www.docker.com
- ^http://www.sonarqube.org/
References
Amstutz, P., Andeer, R., Chapman, B., Chilton, J., Crusoe, M. R., Guimer, R. V., et al. (2016). Common Workflow Language, Draft 3. doi: 10.6084/m9.figshare.3115156.v2
Belhajjame, K., B’Far, R., Cheney, J., Coppens, S., Cresswell, S., Gil, Y., et al. (2013). PROV-DM: The PROV Data Model. Recommendation, W3C. Available at: http://www.w3.org/TR/2013/REC-prov-dm-20130430/
Berthold, M. R., Cebron, N., Dill, F., Gabriel, T. R., Kötter, T., Meinl, T., et al. (2008). KNIME: The Konstanz Information Miner. Springer.
Berthold, M. R., Cebron, N., Dill, F., Gabriel, T. R., Kötter, T., Meinl, T., et al. (2009). Knime-the konstanz information miner: version 2.0 and beyond. ACM SIGKDD Explor. Newslett. 11, 26–31. doi:10.1145/1656274.1656280
Dinov, I., Lozev, K., Petrosyan, P., Liu, Z., Eggert, P., Pierce, J., et al. (2010). Neuroimaging study designs, computational analyses and data provenance using the loni pipeline. PLoS ONE 5:e13070. doi:10.1371/journal.pone.0013070
Gansner, E. R., and North, S. C. (2000). An open graph visualization system and its applications to software engineering. Softw. Pract. Exper. 30, 1203–1233. doi:10.1002/1097-024X(200009)30:11<1203::AID-SPE338>3.3.CO;2-E
Glatard, T., Montagnat, J., Lingrand, D., and Pennec, X. (2008). Flexible and efficient workflow deployment of data-intensive applications on grids with moteur. Int. J. High Perform. Comput. Appl. 22, 347–360. doi:10.1177/1094342008096067
Goecks, J., Nekrutenko, A., Taylor, J., and The Galaxy Team. (2010). Galaxy: a comprehensive approach for supporting accessible, reproducible, and transparent computational research in the life sciences. Genome Biol. 11, R86. doi:10.1186/gb-2010-11-8-r86
Gorgolewski, K., Burns, C. D., Madison, C., Clark, D., Halchenko, Y. O., Waskom, M. L., et al. (2011). Nipype: a flexible, lightweight and extensible neuroimaging data processing framework in python. Front. Neuroinform. 5:13. doi:10.3389/fninf.2011.00013
Ikram, M. A., van der Lugt, A., Niessen, W. J., Krestin, G. P., Koudstaal, P. J., Hofman, A., et al. (2011). The rotterdam scan study: design and update up to 2012. Eur. J. Epidemiol. 26, 811–824. doi:10.1007/s10654-011-9624-z
Klein, S., Staring, M., Murphy, K., Viergever, M. A., and Pluim, J. P. (2010). elastix: a toolbox for intensity-based medical image registration. IEEE Trans. Med. Imaging 29, 196–205. doi:10.1109/TMI.2009.2035616
Marcus, D. S., Olsen, T. R., Ramaratnam, M., and Buckner, R. L. (2007a). The extensible neuroimaging archive toolkit. Neuroinformatics 5, 11–33. doi:10.1385/NI:5:1:11
Marcus, D. S., Wang, T. H., Parker, J., Csernansky, J. G., Morris, J. C., and Buckner, R. L. (2007b). Open Access Series of Imaging Studies (OASIS): cross-sectional MRI data in young, middle aged, nondemented, and demented older adults. J. Cogn. Neurosci. 19, 1498–1507. doi:10.1162/jocn.2007.19.9.1498
Montagnat, J., Isnard, B., Glatard, T., Maheshwari, K., and Fornarino, M. B. (2009). “A data-driven workflow language for grids based on array programming principles,” in Proceedings of the 4th Workshop on Workflows in Support of Large-Scale Science, WORKS ’09 (New York, NY: ACM), 7:1–7:10.
Morrison, J. P. (2010). Flow-Based Programming, 2nd Edition: A New Approach to Application Development. Paramount, CA: CreateSpace.
Mueller, S. G., Weiner, M. W., Thal, L. J., Petersen, R. C., Jack, C. R., Jagust, W., et al. (2005). Ways toward an early diagnosis in Alzheimers disease: the Alzheimers Disease Neuroimaging Initiative (ADNI). Alzheimers Dement. 1, 55–66. doi:10.1016/j.jalz.2005.06.003
Oinn, T., Greenwood, M., Addis, M., Alpdemir, M. N., Ferris, J., Glover, K., et al. (2006). Taverna: lessons in creating a workflow environment for the life sciences. Concurr. Comput. 18, 1067–1100. doi:10.1002/cpe.993
Rex, D. E., Ma, J. Q., and Toga, A. W. (2003). The loni pipeline processing environment. Neuroimage 19, 1033–1048. doi:10.1016/S1053-8119(03)00185-X
Sherif, T., Rioux, P., Rousseau, M.-E., Kassis, N., Beck, N., Adalat, R., et al. (2014). CBRAIN: a web-based, distributed computing platform for collaborative neuroimaging research. Front. Neuroinform. 8:54. doi:10.3389/fninf.2014.00054
van Buchem, M. A., Biessels, G. J., Brunner la Rocca, H. P., de Craen, A. J., van der Flier, W. M., Ikram, M. A., et al. (2014). The Heart-Brain Connection: a multidisciplinary approach targeting a missing link in the pathophysiology of vascular cognitive impairment. J. Alzheimers Dis. 42, S443–S451. doi:10.3233/JAD-141542
Keywords: workflow, pipeline, data processing, provenance, reproducible research, distributed computing, data flow, Python
Citation: Achterberg HC, Koek M and Niessen WJ (2016) Fastr: A Workflow Engine for Advanced Data Flows in Medical Image Analysis. Front. ICT 3:15. doi: 10.3389/fict.2016.00015
Received: 15 April 2016; Accepted: 03 August 2016;
Published: 24 August 2016
Edited by:
Florence Forbes, INRIA, FranceReviewed by:
Suyash P. Awate, Indian Institute of Technology Bombay, IndiaAvan Suinesiaputra, University of Auckland, New Zealand
Copyright: © 2016 Achterberg, Koek and Niessen. This is an open-access article distributed under the terms of the Creative Commons Attribution License (CC BY). The use, distribution or reproduction in other forums is permitted, provided the original author(s) or licensor are credited and that the original publication in this journal is cited, in accordance with accepted academic practice. No use, distribution or reproduction is permitted which does not comply with these terms.
*Correspondence: Hakim C. Achterberg, aC5hY2h0ZXJiZXJnQGVyYXNtdXNtYy5ubA==