 Markus Kächele*†
 Martin Schels
 Friedhelm Schwenker
- Institute of Neural Information Processing, Ulm University, Ulm, Germany
The integration of emotions into human–computer interaction applications promises a more natural dialog between the user and the technical system operators. In order to construct such machinery, continuous measuring of the affective state of the user becomes essential. While basic research that is aimed to capture and classify affective signals has progressed, many issues are still prevailing that hinder easy integration of affective signals into human–computer interaction. In this paper, we identify and investigate pitfalls in three steps of the work-flow of affective classification studies. It starts with the process of collecting affective data for the purpose of training suitable classifiers. Emotional data have to be created in which the target emotions are present. Therefore, human participants have to be stimulated suitably. We discuss the nature of these stimuli, their relevance to human–computer interaction, and the repeatability of the data recording setting. Second, aspects of annotation procedures are investigated, which include the variances of individual raters, annotation delay, the impact of the used annotation tool, and how individual ratings are combined to a unified label. Finally, the evaluation protocol is examined, which includes, among others, the impact of the performance measure on the accuracy of a classification model. We hereby focus especially on the evaluation of classifier outputs against continuously annotated dimensions. Together with the discussed problems and pitfalls and the ways how they affect the outcome, we provide solutions and alternatives to overcome these issues. As the final part of the paper, we sketch a recording scenario and a set of supporting technologies that can contribute to solve many of the issues mentioned above.
1. Introduction
The integration of affective signals into human–computer interaction (HCI) is generally considered beneficial to improve the interaction process (Picard, 2000). The analysis of affective data in HCI can be considered both cumbersome and prone to errors. The main reason for this is that the important steps in affective classification are particularly difficult. This includes difficulties that arise in the recording of suitable data collections comprising episodes of affective HCI, in the uncertainty and subjectivity of the annotations of these data, and finally in the evaluation protocol that should account for the continuous nature of the application.
There are a number of different papers that broadly review and discuss the topic of affective computing (Zeng et al., 2009; Calvo and D’Mello, 2010; Wu et al., 2014). This comprises notable data collections and the state-of-the-art classification techniques for affective states as well as promising classification results. A major issue in this context is the multimodal fusion of different sources of affective information (e.g., input from different sensors) using a broad variety of classifier and feature fusion approaches. There are, however, a number of open issues that are not yet investigated in a systematic way in the literature of (continuous) affect recognition in human–computer interaction, which are, nonetheless, important to generate valid classification results and essential to eventually advance the field.
These issues are situated in a number of technical details that are easily neglected but nonetheless critical for a successful outcome.
In this paper, we identify and examine a number of these issues that occur in the work-flow centered on affective classification studies, leaving aside the topics that are already extensively covered in the previously mentioned papers. As the first part, we examine the recording procedures of corpora that are situated in the area of affective HCI. We provide insights into the preparation of emotional corpora and discuss different kinds of emotional stimulation with respect to their targeted responses and their practical relevance for HCI. Further important aspects are the repeatability of an experiment with the same test subject and its impact on the application, as well as plausibility of a scenario to elicit the desired responses.
Furthermore, the annotation process is described and investigated. Annotation of emotional corpora, especially in continuous time, is very challenging, and various difficulties have to be accounted for. We analyze each step of the annotation pipeline including the tools, postprocessing, and agglomeration procedures not only to gather reliable ground truths but also to consider the person behind the process (i.e., the annotator). More precisely, we show how the labeling software influences the outcome of the annotation process and highlight the differences in the outcomes of different tools. Furthermore, we investigate the labeling delay of the annotators and initial conditions and discuss methods to resolve these issues. As the final issue, postprocessing techniques to obtain a combined label from multiple raters are compared and discussed. To support the findings, we conducted an annotation study that shows the prevalence of the mentioned issues in real-world data.
As the third point, we examine the evaluation process of statistical classifiers for continuous affective labels. We examine commonly used protocols (such as cross-validation) for the applicability for continuous emotion recognition and discuss how the proper performance measure should look like and what problems the practitioner should avoid. As a case study, we analyze the datasets of the audio-visual emotion recognition (AVEC) series with regard to the presented issues and discuss how the proposed solutions (that are necessary for real-world problems and especially challenges) perform.
In light of this, we want to offer a discussion about how data recording and evaluation in the field of human–computer interaction might evolve for true next-generation applications.
Note that the contribution of the paper is not a single method that can easily be validated using quantitative experiments but rather a discussion about the state of the art and the presentation of a set of tools of the trade to overcome the mentioned issues. As such, the paper discusses many different approaches and ideas.
The remainder of the paper is organized as follows: in Section 2, we briefly outline the relevant techniques and data sets from the literature. This comprises computational modeling of crisp and continuous class assignments and their relation to common emotion theories. Subsequently, popular tools and techniques for the annotation, important existing affective corpora for HCI, and finally performance measures that are used for continuous classification and regression tasks are introduced. The main part of the paper is Section 3, which elaborates on the issues that are described in the previous paragraph. A set of approaches to the collection and annotation of affective corpora for HCI is outlined in Section 4 that may be useful to circumvent the exposed shortcomings. Finally, in Section 5, a summary of the presented findings is offered, and the paper is closed with a conclusion.
2. Related Work
In this section, the state-of-the-art technologies are outlined for the construction and evaluation of affective corpora.
2.1. Computational Aspects of Affective Modeling
A pattern recognition problem is defined by assigning categories to objects. The simplest way to do so is to assign a distinct entry ωi from a set of all possible classes
to the object (Kuncheva, 2004). This means that an object is of class ωi and not of any other class ωj, j ≠ i. This concept is reflected in a vast body of research in affective computing. In earlier studies, prototypic basic emotions (Ekman and Friesen, 1978) such as “anger,” “fear,” “disgust,” and “happiness” are used as target labels to build classifiers.
There are obviously shortcomings to the concept of crisp class assignments when a class membership is either uncertain or only partial. In order to model these circumstances, a variety of different formalisms are proposed. The most obvious choice is the Probability Theory (Bishop, 1995). It is based on the observation of the so-called random variables X that can take values x1 … xM in a number of trials in random experiments. The probability p(X = xi) of an event xi is then defined by the fraction of the number of trials where the event ni occurs and the total number of trials N:
with N going to infinity. If the events xi are mutually exclusive holds.
A further formal concept that acknowledges uncertainty in the modeling of class memberships is the fuzzy set (Zadeh, 1965; Dubois and Prade, 1980). The fixed logic for an element to fully belong or to fully not belong to a set (i.e., a class) is altered in this framework to model the concept of vagueness. Instead, a continuous membership value that is ranging between 0 and 1 is assigned to an element. Increased values for this variable signify a greater membership of an element to this set. The membership values can further be used to define vague concepts like “high” or “small” by defining thresholds or distinct bands in their range. The memberships for a set of distinct classes are hence summarized in a vector that contains the continuous membership values for each individual data point.
Using gradual class assignments for modeling human emotions is an intuitive choice that reflects the inherent nature of the application. This is reflected by continuous spaces in which emotions can also be represented. They are spanned by affective dimensions such as “arousal,” “dominance,” and “valence” (Russell and Mehrabian, 1977). Using these representations, a value is assigned to the emotional states of a subject for each of the respective dimensions. The generated multidimensional emotional space can consist of a variable number of dimensions, in the literature mostly ranging from two (Ringeval et al., 2015) to five (McKeown et al., 2010).
2.2. Annotation
In this section, the manual annotation of affective data is discussed.
2.2.1. Tools for Continuous Annotation
Assigning labels of emotional activity to affective data that do not rely on distinct stimuli is a non-trivial task that demands for specialized software. This demand led to a variety of different publicly available solutions that are designed to present the data adequately, allow to navigate in the material and also to let a human rater assign labels in a comfortable and intuitive way.
There are many solutions for this problem when considering crisp, blocked label assignments (Kipp, 2001; Meudt et al., 2012).
There are also tools that overcome the block-wise nature of the labeling as, e.g., the Feeltrace annotation tool (Cowie et al., 2000). Feeltrace displays the complete video continuously and, hence, allows the assignment of fully continuous labels for every frame. A two-dimensional labeling area is provided, which allows the concurrent annotation of two affective dimensions using a computer mouse or other input devices. Thus, a quick labeling of fully continuous label traces is possible.
Gtrace (Cowie et al., 2012) can be considered the successor of Feeltrace. In contrast to Feeltrace, this tool is restricted to a single dimension per iteration, which reduces the cognitive load. The interface is designed such that the video can be seen on the left side and the annotation cursor on the right side of it together with custom dimension descriptions. In order to provide a label to a snippet of the presented data, the mouse button has to be held to indicate that the traces should be recorded. A unique feature of this tool is that the label history is made visible by showing a trajectory of the cursor’s past movements.
The Annemo tool (Ringeval et al., 2013) uses a one-dimensional horizontal slider for continuous label assignment. A unique feature for annotation is that the mouse cursor is caught by the slider after clicking on it the first time and every movement of the mouse from that point on influences the given label.
The label tool Carma (Girard, 2014) provides an interface with a vertical slider to assign values for one continuous dimension. In order to use this tool, the labeler has to drag the indicator by holding the mouse button and releasing the button lets the label stay at this point. All the mentioned labeling tools use a starting point for each labeling session of 0.
The ATLAS labeling tool is designed to assign blocked and continuous labels to affective materials (Meudt et al., 2012). This tool increases the amount of possible data sources to multiple audio and video files with the possibility to add additional generic data traces such as physiological signals, feature matrices, or classification results. Additionally, semi-supervised classification approaches are integrated to speed up the annotation process by automatically suggesting labels that can be accepted or rejected by the annotator. The annotation is not restricted to a predefined emotion model; instead, it can be fully customized thus rendering it useful for annotation beyond affective dimensions.
2.2.2. Combining Individual Ratings
As there are high individual variances of the raters, it is mandatory to combine multiple ratings for the same sequence. There are a number of approaches in the literature to create combined label trajectories that set different focuses. The most straightforward solution is simple averaging of all available trajectories (Valstar et al., 2014a). It is based on the assumption that every rating is of equal importance and is equally correct given that the annotation happened under the same conditions.
The second possibility is to create an average from the individual traces weighted according to a criterion. The criterion can, for example, be the averaged agreement with the other trajectories to emphasize traces that are in close accordance with the others and to penalize outliers. This procedure has been used to normalize the annotation of the RECOLA corpus (Ringeval et al., 2013).
It may also be a feasible idea to identify and remove unreliable raters. In Celiktutan et al. (2014), the correlation coefficients of the ratings of all pairs of annotators are used to identify outliers in the set of raters that deviate too much from the majority. It was, however, asserted that at least 3 raters are selected to form the final averaged label.
2.3. Data Recording for Affective HCI
The conception and recording of corpora that are eligible to study affect in human–computer interaction can be categorized into three main groups. These groups differ in the way the emotional stimulation is conducted. In the following, the methods of emotional stimulation are presented together with notable examples of corpora that follow the respective design paradigm. All described data sets are publicly available for research purposes.
2.3.1. Human–Human Interaction
The focus of this stimulation method is the interaction between a subject and one or more other participants. Depending on the given task, the additional participants are either experimenters that act as interlocutor or other subjects that are part of the given task or have to solve a similar task on their own. The interaction is generally not restricted and mostly contains free speech. Emotional ground truth is commonly created by subsequent manual annotation of the recordings as the free interaction is less suited for blocked stimuli. Notable examples that leverage this stimulation method are the Audio-visual Interest Corpus (TUM AVIC), the PIT, and the RECOLA corpora.
The TUM AVIC (Schuller et al., 2009) contains human conversational speech annotated for five different levels of interest of the test subjects. A total number of 21 speakers, 11 male and 10 female, were recorded using cameras and microphones.
The PIT corpus (Strauss et al., 2008) conducts a more exploratory approach to the subject of HCI by enabling a computer-assisted multiparty dialog. The corpus was used to develop a set of labels that are useful for HCI such as high level categories (e.g., interest) and also actions on a lower abstraction level (e.g., is the user looking at the computer screen). Audio and several video streams from multiple perspectives are provided with the data collection. Concretely, 5 different categories have been annotated by three raters using a block-wise annotation scheme.
The RECOLA corpus (Ringeval et al., 2013) pairs of French speaking participants are collaborating to solve a survival task. Mood manipulation in a Wizard-of-Oz setting introduces additional emotional reactions. In total, 27 participants were recorded using audio, video, and bio-physiological measurements. Fully continuous annotation has been added using the Annemo tool. For each recording, 6 native speakers annotated the dimensions arousal and valence.
2.3.2. Human–Computer Interaction
Emotional induction in the scenario of human–computer interaction can itself be divided into three subgroups. One possibility is, analogously to the examples mentioned earlier for human–human interaction, to give the participants a task and let them freely solve it. Emotional annotation is again done as a postprocessing step by manual annotation. The advantages of this method are that no other personnel is required as interlocutor or to control a system and that the experimental design can be simplified to stating a task and giving the participants the means to solve it without further interaction. Notable examples are the AVEC 2013 and AVEC 2014 (Valstar et al., 2014b) corpora, which can still be considered HCI applications, however, in a clinical environment with test subjects suffering from different levels of depression. The patients, who were recorded using camera and microphones, were instructed to conduct different, in parts therapeutic, tasks not only talking about their childhood but also reading predefined texts. The corpus is manually annotated by one to five human annotators in continuous affective dimensions, namely, arousal and valence for the 2013 edition and valence, arousal, and dominance for the 2014 edition of the challenge.
Another option for emotional stimulation is to pose a task, which includes one or more hidden triggers. As the participants solve the task using a computer system, more or less unexpected events are designed to trigger emotional reactions. While it can be considered a consequent advancement from static task solving, the design phase is more complicated as the trigger events have to be conceived and validated. Reactions that occur during the experiment though are generally of higher intensity in comparison to the previous example.
The LAST MINUTE Corpus (LMC) (Prylipko et al., 2014) is designed using this paradigm. Subjects are asked to pack a suitcase for a voyage to an unknown place using a voice controlled dialog system. The unexpected trigger is that the destination has arctic climate instead of a tropical one. It is designed to study affective human–computer dialogs (Rösner et al., 2012) and consists of audio and video recordings. Additional events are stimulated by setting malfunctions of the dialog system using external manipulations of the experimenter.
The last subgroup of emotion stimulation methods is the so-called Wizard-of-Oz paradigm (Kelley, 1983). In this case, a task is posed that should be solved using or with help of a seemingly intelligent device. However, this device is controlled by an invisible human operator, while the subjects think that there is a fully operational system. The system can be directly used to frustrate the user and provoke emotional reactions within an interactive setting. The task can, for example, include playing a game using a voice controlled system (controlled by the wizard), as it is the case in the EmoRec II (Walter et al., 2013a; Rukavina et al., 2015) corpus. Emotions in the Valence-Arousal-Dominance (VAD) space were induced using different difficulties of the game and negative or positive feedback from the system. Sequences of similar stimuli were considered as blocks of the same label. The recorded data include audio, video, and physiological channels.
Another example is the Belfast Sensitive Artificial Listener database (SAL) (McKeown et al., 2010). Here, interactive characters with different personalities are used to induce emotions during an interaction sequence. Five different emotional dimensions (Activation, Expectation, Intensity, Power, and Valence) were annotated continuously using the tool Feeltrace. Parts of this corpus have been used for the 2011 and 2012 editions of the AVEC challenge (Schuller et al., 2011, 2012).
A comprehensive overview of all mentioned corpora is given in Table 1.
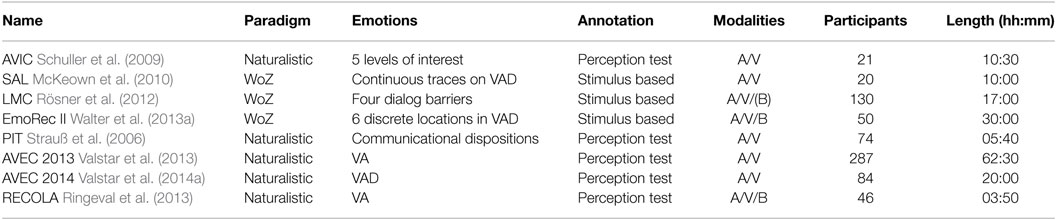
Table 1. Overview of selected emotional corpora.
2.4. Performance Measures
A central issue in the field of affective pattern recognition that is highly important and fiercely intertwined with the whole process, yet often neglected, is the selection of a suitable performance measure. It determines the optimization criteria that should be used for the construction of classifiers for prediction and allows statements about the quality of estimation.
An obvious choice for this is to compute the error of the classification by counting misclassified samples, as it is conducted in most of the traditional classification applications:
where yi is the true label, f (xi) is the output of classifier f for sample xi, and 𝟙 denotes the indicator function. Because of normalization, the error ranges from 0 to 1. For the sake of completeness, it is noteworthy that there are various formalisms to denote the error or accuracy in the realm of classification with discrete class labels. Popular instances are recall, precision, and combined measures that reflect skewness of the class distribution as the F1 score and the receiver operating characteristic (Theodoridis and Koutroumbas, 2009).
This is obviously not feasible if the categorization is not given by discrete values (Schuller et al., 2012). For such kinds of applications, it is appealing to borrow performance measures from the field of statistical regression for the evaluation of continuous classification outputs.
2.4.1. Measures of Dissimilarity
Natural representatives for that are distance measures that are computed between two signals xi and yi of length n such as the root mean square error:
or other variants of the same concept, e.g., the mean absolute error
The goodness of fit χ2 is defined by the squared deviation of the prediction from the true value divided by the true value:
A good fit is defined for values that are close to 0.
2.4.2. Measures of Similarity
A frequently used similarity measure is to compute the correlation coefficient to check for linear relationships between the prediction and the given label trajectory over a time sequence:
where and are the means of x and y, respectively. The correlation coefficient ranges from −1 to 1. This measure does not take into account any additive constants in the two signals, which could be considered an advantage over the distance-based errors or a drawback, depending on the targeted concept of optimality.
There are also measures that combine the error and the correlation coefficient in order to mitigate the respective shortcomings. A suggestion for that is the concordance correlation coefficient (CCC) (Lin, 1989) that is defined in following form:
for two signals x and y, their variances and , and the Pearson correlation coefficient ρ. The quantity ρC also takes values in (−1, 1).
A further measure that is often used to asses the performance of particularly linear regressions models is the coefficient of determination R2. It is defined as follows
and should take values between 0 and 1. This measure, however, can also assume values beyond these limit if, for example, the estimated curve has not been obtained by linear regression.
There are also performance measures that are defined to account for fuzzy memberships, such as the fuzzy S1 measure described in Dubois and Prade (1980), which is defined as
The S1 measure denotes the overlap of the support of the estimated and true fuzzy class assignments.
3. Shortcomings
In this section, shortcomings with respect to experimental design of the recording, the annotation, and the evaluation of experiments of affective HCI are presented.
3.1. Shortcomings in the Recordings
In the following, several issues are presented that are related to the recording of affective corpora which may inflict the validity of classification studies.
3.1.1. Applications
An important issue in the course of creating affective corpora for the investigation of human emotions in HCI is to define a believable recording scenario. For example, when studying emotions in psychology, it is convenient to use visual or auditory stimuli to evoke distinct emotions like the well-known IAPS image data base (Lang et al., 1999). But this is hardly eligible for the application of HCI, as it is a purely passive scenario and the content of these images are not likely to be reproducible in an interaction with a computer. Other data collections which appear at first glance more relevant use computer interfaces and interactions with them to induce emotions (Schuller et al., 2011; Walter et al., 2013a) or conduct other tasks that are given by the experimenter like packing a virtual suitcase for a voyage (Rösner et al., 2012) or a collaborative interaction task (Ringeval et al., 2013). For more details, the reader is referred to Section 2.3.
Stimuli that look promising on paper such as a fictive story (for example, about winning a voyage to an unknown place) and a consequential task that relies on the believability of this story can be met with indifference. One reason for this is that the affective trigger is not as convincing as expected by the experimenter (in this example, this could be the unknown climate of the destination, which turns out to be arctic instead of subtropical and the subjects packed only bathing suits) (Rösner et al., 2012). The catch is that the subjects know that everything is only fictional and that in reality nothing is at stake (i.e., they will not travel anywhere). Some of the stimuli that are used for the induction further use non-functional user interfaces, e.g., the speech recognition is not working properly or other user commands to the system are not or wrongly recognized (Gnjatović and Rösner, 2008; Walter et al., 2013a). A less restricted interaction with a humanoid avatar is suggested in the SAL data collection (McKeown et al., 2010), which results in a generally relaxed atmosphere that encourages people to talk freely.
This scenario, however, has yet to transcend from the lab into everyday life.
3.1.2. Intraindividual Experiments
Another beneficial property for the research in affective HCI is the repeatability of an experiment with the same test subject as human behavior is very heterogeneous over different individuals. This is unfortunately not the case in the presented examples with HCI: there seems to be a quick accustoming of the test subjects in the different scenarios (Rösner et al., 2012; Walter et al., 2013a). For example, playing a game twice in a row with the same types of feedback without any impact on the personal life of the subject will not render eligible results (Walter et al., 2011). It turns out that different levels of engagement can play an important role and stimuli that rely on surprise effects can justifiably be used only once. Analogously, the interaction with the same virtual avatar for the second or third time will hardly be as exciting and interesting as the first time (Schuller et al., 2011). The collection of data for statistical evaluations of person dependent effects is hindered by this problem. A solution, however, is highly desirable as the intersubject variances in such an application are naturally very high and a personalization of machine classifiers is generally beneficial for the prediction outcome (Stemmler, 1989).
3.1.3. Involvement of Test Subjects
The repeatability of the experiment is closely related to the involvement of the subject in the task. As the emotional stimulation has to occur in controllable settings, only relatively artificial scenarios are feasible that can be worked off during one short session of recording. This limits the narrative to very basic issues (McKeown et al., 2010; Walter et al., 2011; Rösner et al., 2012). In an experiment designed like that, the test subject has normally no real intrinsic interest in the task, other than to acquit oneself well in the experiment and to satisfy the experimenter. Hence, there is a need for a convincing experimental setting for affective recordings to study HCI. A scenario that fits to these requirements should be clearly related to computer interaction and be complex enough to involve the subject into the task. Sometimes, monetary rewards are offered to the subjects to motivate them to participate in the experiments (Schüssel et al., 2014). This practice is often successful as the amount of rewarded money might be dependent on the performance of the subject. This way, the subject’s involvement is increased as correct understanding and awareness of the situation often leads to a larger reward. However, monetary compensation may become expensive over time and its effectiveness is debatable as is might skew the distribution of decisions of the subject to maximize the reward. Another option that seems to work to a certain extent is to include an additional dialog partner who drives the experiment, with the HCI device being only the means to an end (Strauß et al., 2006; Ringeval et al., 2013). The downside is that another person (be it an experimenter or another participant) is needed which further complicates the experimental process.
3.1.4. Affective Categories in Human–Computer Interaction
All these previous points are more or less directly linked to finding affective categories that are actually useful in HCI. Many experiments that lead to recordings of affective content try to capture a very broad spectrum of emotional categories, e.g., all defined basic emotions or the whole 3 or 4 dimensional continuous emotional space (Kanade et al., 2000; Burkhardt et al., 2005; Lang et al., 2005). This presumably means that too many affective peculiarities are covered where most of them are practically irrelevant for the actual application at hand. This includes basic emotions like “disgust” or “fear” and their counterparts in dimensional spaces. To maximize the predictive quality of an automatic affect recognition system, the learning procedure should not be over-strained by artificially complicating the task (e.g., by multi-class learning instead of binary), rather the focus should be sharpened to the task at hand. A further issue is that the intensities of the targeted phenomena are typically low in HCI as the subjects are normally focusing on solving the given task and exaggerated display of emotions is rather unnatural in such situations (Valstar et al., 2013; Walter et al., 2013a). This stands in contrast to the many databases in which the emotional material is of very high expressiveness, because it is acted and in some cases overacted (Kanade et al., 2000; Burkhardt et al., 2005).
3.2. Shortcomings in the Annotation
3.2.1. Finding “True” Labels
An important issue is that it is generally not possible to determine a true class assignment or a true value for dimensional categories (Calvo and D’Mello, 2010) as it is the case for traditional pattern recognition tasks such as optical character recognition or some measured quantity like the distance between two objects. As outlined in Section 2.2.1, an estimate for these values can be provided using external annotation tools, by self assessment techniques or combinations of them. Labeling the data obviously renders only an outside perspective of what is really going on. Even though empathy is a rather unique human trait and humans are trained from birth to recognize even the most subtle cues, it is not eligible in all cases and especially if no cues are displayed by the subject. Self assessment is an alternative to capture the perspective of the test subjects; however, it requires to interrupt the enclosing experiment thus directly influencing the state of the participant, which makes the assessment unreliable (Grimm and Kroschel, 2005). A further obstacle is that the self assessment techniques may not be easy to understand for naive test subjects.
3.2.2. Combining Annotations
The question of how to properly combine annotations of different raters into a ground truth that can be used for statistical evaluation has been discussed in Section 2.2. In this section, the effects that different normalization techniques have on the final label are discussed.
In detail, we compare the normalization that has been used for the AVEC 2013 (Valstar et al., 2013) and AVEC 2014 (Valstar et al., 2014a) corpora with the technique presented for the RECOLA corpus (Ringeval et al., 2013) to highlight their differences.
For the AVEC corpora, the arithmetical average is computed to obtain a mean trajectory. In contrast, for the RECOLA corpus, a more complex procedure is used to average the trajectories while simultaneously increasing the interrater agreement in terms of concordance correlation. The average agreement of each trace with all the other traces is used as weight to construct the average. The individual traces are thus shifted toward the label that has the highest weight as it best represents most of the labeled information.
The result of both procedures can be seen in Figure 1 applied to traces from one video of the AVEC 2014 corpus. Figures 1A,B show the original labels and the shifted trajectories according to Ringeval et al. (2013), respectively. Figure 1C shows the resulting averaged traces for both approaches. It can be observed that the normalization method used for the RECOLA corpus shifts the trajectories to a closer match (Figure 1B). However, as the results suggest, the shift also introduces a dramatic change of the final annotation value. The averaged arousal trajectory shows a mean value of about 0.25 using the RECOLA procedure, while standard averaging yields a mean below 0.1. By inspecting the original traces (Figure 1A), it can be seen that only a single trajectory has a value comparable to the red trace in Figure 1C.
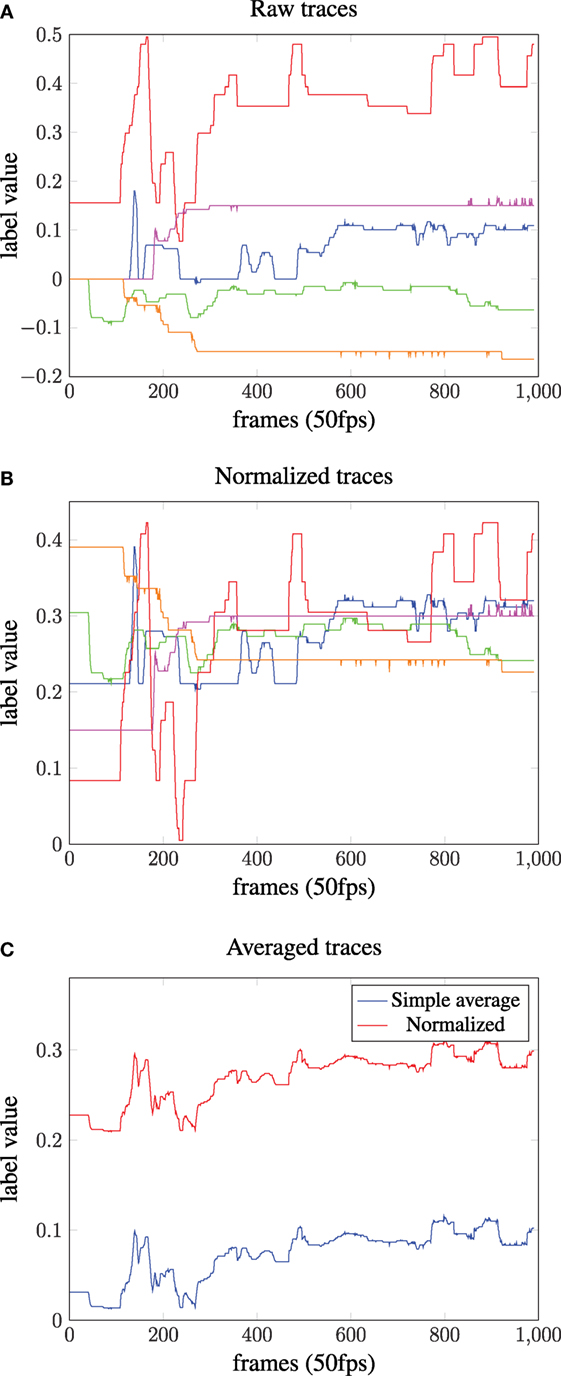
Figure 1. Normalization of label traces to increase the interrater agreement. (A) The raw traces from the annotation procedure of a single video of the AVEC 2014 corpus. (B) Normalized traces using the procedure suggested in Ringeval et al. (2015). (C) Averaged traces. Simple averaging leads to the blue trajectory, while the procedure in Ringeval et al. (2015) leads to the red trace. Note that a shift toward the upper end of the label range occurs.
Hence, combining individual labels is necessary to obtain a usable ground truth, but the process how to create the final label comes with a great deal of variation.
3.2.3. Effects of the Human Rater
In order to investigate the annotator-dependent effects on the final label, we use the annotation experiment that is described in Kessler et al. (2015). Seven naive annotators were instructed to annotate a 3-min video snippet, taken from the RECOLA corpus. Their task was to annotate the general gaze direction of the participant depicted in the video, who either looked down on a desk in front of her or to a hidden interlocutor in the vicinity of the camera. The task was selected based on two factors. First, a reliable ground truth is available by frame-wise annotation of the true gaze direction, and second the task involves observing a human while filtering out distracting elements, such as conversational turn taking.
Annotation was done with the three tools Annemo, Carma, and Gtrace that are described in Section 2.2.1. For each rater, the observed delay for the gaze annotation task was manually determined. The results in Figure 2A suggest that even for a simple task such as the categorization of the gaze direction a considerable delay exists for every annotator. It ranges from about 0.2 s to almost 2 s and, most interestingly, it is not constant over time. This indicates that mechanisms to compensate annotation delays have to be able to deal with varying delays or the inability to compensate should be factored into further steps of the experimentation procedure.
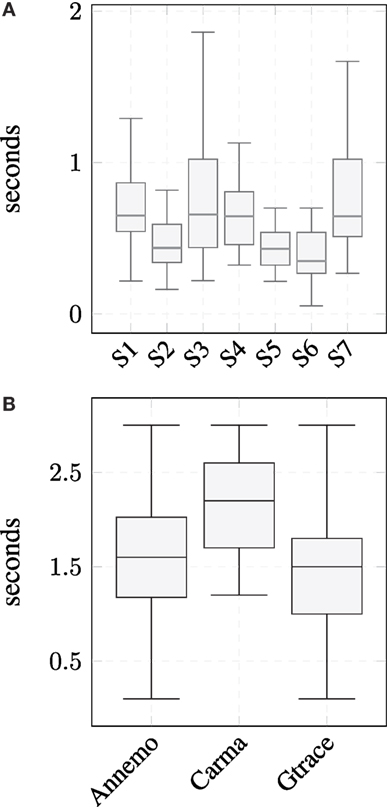
Figure 2. (A) Label delays of the gaze subtask for the individual subjects averaged over the three tools. There is some variance over the subjects but also for individuals’ observable. (B) Delays of the three individual label tools for the mood task [cf. Kessler et al. (2015)]. It can be seen that for this task the largest delays are produced by the Carma software.
3.2.4. Effects of the Tool
Further investigations based on the annotation study suggest that not only the annotator has impact on the outcome but also the choice which tool to use. The annotation delay is pictured in Figure 2B, however, this time grouped into the tools that were utilized. As can be seen, Carma leads to the biggest delays with a difference of more than a half second to the other tools.
3.3. Shortcomings in the Evaluations
In this part of the section, more technical questions about the evaluation of classifiers are addressed that are related to the interpretability of the obtained results.
3.3.1. Performance Measures
Taking the binary accuracy of correctly versus incorrectly classified samples would render an easy to compute and very intuitive performance measure. However, this binary notion can arguably not reflect the complexity of the application of emotion recognition, which is characterized by different intensities of categories and also of high uncertainties between the true label and the statistical classification result (Schuller et al., 2012).
However, these obvious choices raise not so obvious technical questions that jeopardize the interpretability of the results and the notion of when a prediction can be considered correct (Calvo and D’Mello, 2010). An impressive example for this is depicted in Figure 3 for a continuous trace of the label “Arousal” (blue) from the AVEC 2014 data collection and two simulated attempts for prediction (red). While the prediction that is shown in Figure 3A is correct with a Euclidean error of zero in most of the time steps, the correlation coefficient of the two signals is relatively low. On the contrary, the prediction is only correct at 3 time steps in Figure 3B, but the RMSE is approximately the same and the correlation coefficient is by far higher.
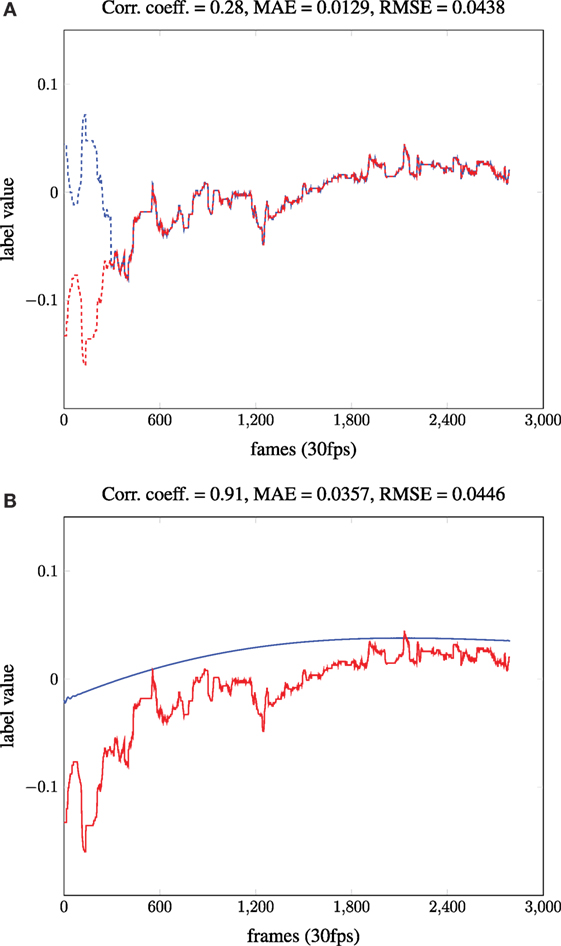
Figure 3. Example of estimations (blue) and true labels (red), where performance measures are counter-intuitive. Adapted from Kächele et al. (2014). (A) Highly overlapping trajectories. (B) Coarsely matching trajectories.
A further issue that can be easily overlooked is how to compute an averaged performance of the predictions for multiple interaction sequences. As measures like the correlation coefficient can take negative values is has to be prevented that terms cancel each other. For example, one can take the absolute value for every individual sequence and then compute an average over the different sequences (Valstar et al., 2013). This acknowledges that negative correlation coefficients also denote a linear relation and should be treated just as positive values. However, it can also be argued that a negative correlation coefficient close to absolute value 1 is actually quite the opposite of a good match for the true label trace (Schuller et al., 2012). These, only slightly different, approaches render rather different numbers for the same predictions.
One solution that is used as a work-around for all these issues is to still use the traditional accuracy as a measure and hence conduct a discretization of the continuous label signal (Schuller et al., 2011). Thus, the continuous nature of the application may still be exploited in the collection of the data but is lost in the classification phase.
In order to assess the differences of the various possibilities to evaluate continuous class assignments, we show a hypothetical predication for some true label in Figure 4. Figure 4A shows the two curves that are the basis for this example. In the beginning, the prediction is wrong and even diametrically opposed to the true label. This is followed by an episode of general concordance of the signals and, in the last section, the prediction does not change any more while the true label oscillates.
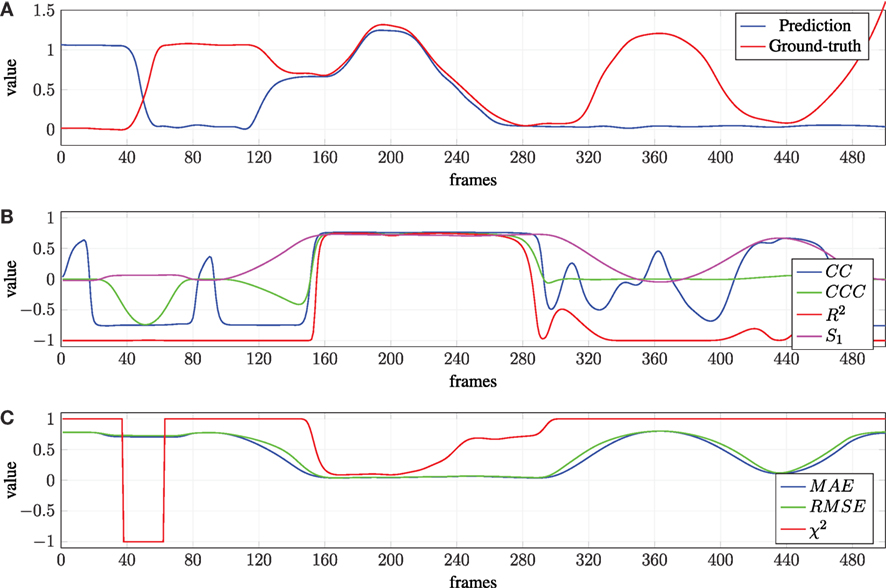
Figure 4. Evaluation of a hypothetical ground truth and prediction for 500 time frames using a sliding window approach with window sizes of 50 frames. χ2 and R2 are clamped to fit in [−1, 1]. (A) Hypothetical ground truth and prediction for a continuous class assignment. (B) Performance in terms of different similarity measures. (C) Performance in terms of dissimilarity measures.
The four dissimilarity measures are shown in Figure 4B for this setting. Every entry in the graph represents the value of the measure in a 50 frames window to account for the temporal structure. It can be observed that they render very different notions of correctness, not only by introducing a vertical shift but also by the rating of particular situations. For example, the value of the CCC drops around frame 50 finally to the minimal value while S1 and R2 stay at their respective minimums all the time until approximately frame 150. An exception to that is the CC, which also returns relatively high values occasionally. Also, the CC deviates from the other measures in the last 3rd of the figure by returning high vales in parts where the divergence of the two curves is maximal.
The three similarity measures are examined in Figure 4C. While the two distance measures MAE and RMSE are quite similar in this setting (with small differences nonetheless), the performance assessment using χ2 is very different. The most interesting part can be seen at around frame 200, where the trajectories are relatively close and consequently the different error measures yield small values. The χ2 measure, however, returns comparably large values in this case.
3.3.2. Time-Dependent Effects
A further important issue that should be paid attention to in both, the collection of a corpus and subsequent classification studies is the nature of time-dependent effects. These can unintentionally create artifacts in the data that jeopardize the validity of the experiments and thus the scientific outcome. One possible source of such artifacts is inherent in the annotation of continuous data as it is conducted with tools that use sliding controllers to define a label while a video or audio recording is played (Cowie et al., 2000; Schuller et al., 2012; Valstar et al., 2013). Thus, clear technical constraints are imposed on the annotation, of which the most prominent is that a starting point has to be defined. One could argue that this is not necessary as the different subjects are arriving in a, in a sense, “neutral” affective state at the experiment which is subsequently altered in the course of the recording. There is, however, little evidence for this assumption and also the costs that come with this approach are notable: it tends to result in very characteristic label traces that exhibit a transient phase (Glodek et al., 2012; Kächele et al., 2014). An example for such traces can be seen in Figure 5 where the continuous average labels of the AVEC 2012 and 2014 data sets are denoted together with the frame-wise variances over all sequences.
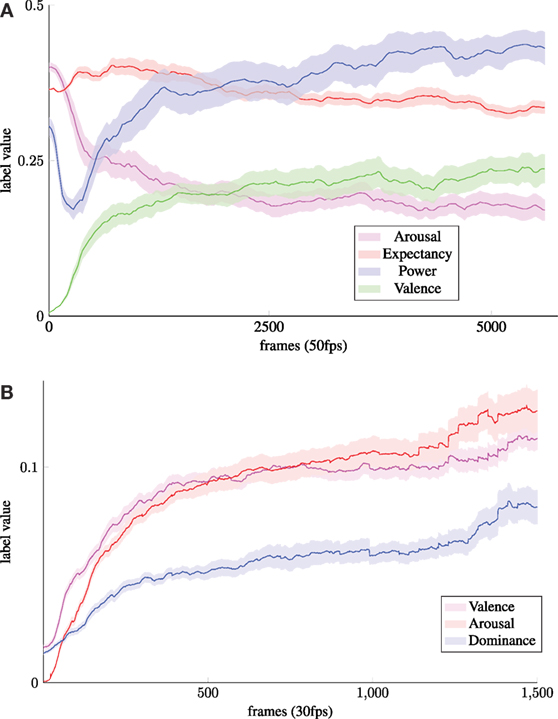
Figure 5. Average absolute labels and variances over all videos of the AVEC 2012 and 2014 corpora. Adapted from Kächele et al. (2014). (A) Absolute mean of label traces with variances of AVEC 2012. (B) Absolute mean of label traces with variances of AVEC 2014.
To shed further light on the transient phase and how it can be avoided, a small annotation experiment has been conducted. For this, a video from the RECOLA corpus (Ringeval et al., 2013) was annotated by 5 naive annotators. However, the video was modified to include a short buffer video in the beginning. About 12 s of the video were copied and reversed in time with additional correction of the audio channel, so that the annotators do not notice it. They were not told about this modification (which fits seamless to the actual RECOLA video) and annotated the whole sequence. The result of this can be seen in Figure 6. The figure clearly shows that the label position after the initial mirror sequence is far from the absolute mean label that can be seen in the official annotations.
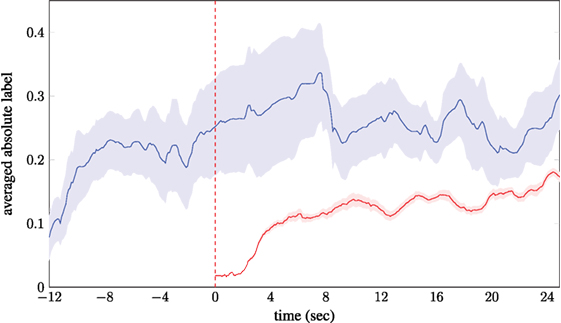
Figure 6. Comparison between normal annotation (red) and annotation with an additional buffer sequence (blue) in the beginning. As can be seen the absolute labels differ by a large amount at the red line which indicates the starting point of the actual video.
Similar effects occur when the problem of finding a ground truth is addressed by defining blocks of similar feedback from the system or the experimenter, grouped by the desired (and induced) user state (Walter et al., 2011, 2013a; Rösner et al., 2012). This is often accompanied by a fixed order of the individual blocks as it may be infeasible to direct user states arbitrarily. Thus, it is apparent that the most dominant “feature” for the classification of these blocks is actually the elapsed time. Sometimes, such effects are present in recording channels and hence extracted features where it is not directly perceivable, e.g., as it is the case in physiological measurements (Walter et al., 2013a). These kinds of signals commonly show a distinct piecewise trend that can be used to discriminate the blocks against each other, rather than taking into account the actual signal, e.g., in case of frequency variations of electromyography (EMG). Using linear detrending can account for this problem to some extent. However, it cannot be ensured that further artifacts, for example, in higher order derivatives of the frequency spectrum do not exist.
3.3.3. Subject Dependencies and Evaluation of Classification Experiments
Most of the aforementioned data collections are unfortunately afflicted with at least one of these issues. In order to still be able to conduct scientifically relevant experiments based on this data, it is mandatory to invest more time into numerical evaluation procedures. One of the major issues that separate this application from related ones like, e.g., face recognition or speaker verification is that of subject-dependent variances. These variances are present in all channels but most prominently in physiological data and they diminish the classification performance especially when conducting leave-one-subject-out experiments (Schels et al., 2014).
Performing subject-dependent classification experiments, on the other hand, however, yields comparably high accuracies, often fueled by multiple of the shortcomings in the recording (Walter et al., 2013a; Williamson et al., 2013; Kächele et al., 2014). For example, for subject-dependent classification using physiological signals in an experimental setting with blocked stimuli, classification can work exceptionally well because artifacts from the different blocks might dominate the outcome. Hence, it would be intriguing to have multiple episodes of interaction from the same subject in the same experiment to train the models on different subsets of episodes than the ones that are used for evaluation. However, this is generally not possible with existing corpora as the experiments are not designed to be passed multiple times.
3.4. Example: AVEC 2014
The points that were outlined in this section hinder scientific conclusiveness of statistical classification studies without researchers even taking notice. They are commonly not familiar to practitioners and engineers that have a traditional pattern recognition background and are used to work in more technical applications. Hence, a more critical view on the data collection and data annotation process has to be taken.
An illustration of a culmination of the introduced issues has been given in the course of the affect sub-challenges of the AVEC challenge: we show the official result diagrams of the 2014 edition of the event in Figure 7B. The performance measure that was used to rate the submissions of the participants was the correlation coefficient and it can be seen that the highest correlation has been rendered by the team “ulm” where several of the authors of this paper were members of. The results were achieved by submitting a characteristic curve for each of the affective categories without looking at the actual underlying video or audio data (Kächele et al., 2014), for which the term proto-label was coined. They are basically a mapping of the frame number to a label value that is either constructed using ϵ-SVR or EVD [see Kächele et al. (2014) for details on the implementation].
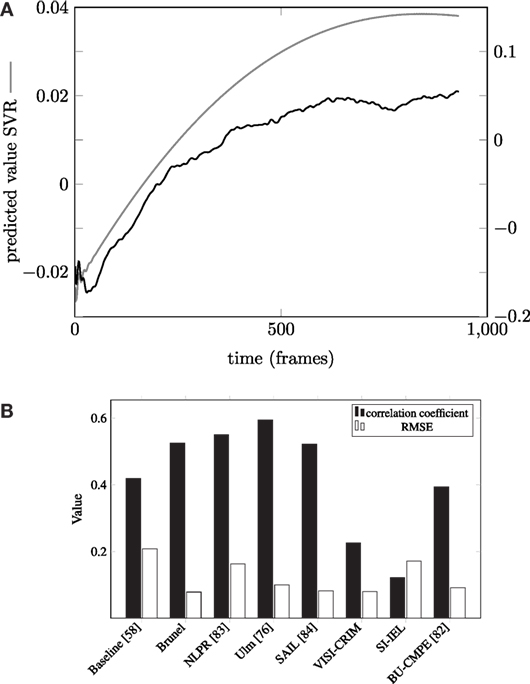
Figure 7. Task-dependent proto-label and average correlation coefficient and RMSE of the affect sub-challenge of the 2014 edition of the AVEC challenge. Source: http://sspnet.eu/avec2014/. (A) Task-dependent proto-label for one subtask. (B) Challenge results of AVEC 2014.
One example for each of the approaches is shown in Figure 7A, which shows a quasi-logarithmic shape of the proto-label for the “Freeform” subtask and the affective dimension “arousal.” This accurately reflects the shape of the mean absolute labels as they are seen in Figure 5B. This originates from the fact that there is a transient phase inflicted by the tool that is large compared to the variation in the annotation. A further reason for the success of the proto-labels is the usage of the CC as performance measure and its unique features as seen in Figure 4B.
Thus, it was possible to outperform all other submitted approaches that used elaborate learning techniques such as deep neural networks (Chao et al., 2014) and support vector machines (Gupta et al., 2014) on complex audio and video features.
This highlights that there is a need for a new way to approach affective HCI to incorporate the issues that have been raised above.
4. Toward More Natural Data Collections
In Section 4.1, it will be described how finding a relevant application for affective HCI determines the respective categories that are useful in the course of the interaction. Furthermore, in Section 4.2, it is motivated how state-of-the-art machine learning techniques may help in the course of the collection of data and during the annotation of the material.
4.1. Applications and Categories
The goal is to define affective categories in HCI that actually occur in practical scenarios and which are relevant for the task at hand. Finding traditional applications that fulfill these requirements is not easy. Writing a book on a computer, for example, is certainly some form of HCI and affective states that are in some relation to this process may also occur. However, there is hardly anything conceivable that the computer or any technical system could do to make that task easier apart from providing a functional interface.
One possible application in which a computer can alter the course of an interaction with a user is when it plays the role of a trainer or a teacher (D’Mello et al., 2007; Arroyo et al., 2009; Palm and Glodek, 2013). A user might want to acquire distinct skills, possibly both physical and intellectual, and the computer is monitoring the progress as well as the emotional reactions. Examples for that may be learning a foreign language using a vocabulary trainer or rehabilitative training after surgeries.
As argued earlier, detection of positive affective states will not be beneficial for the system or the user to fulfill the goals of the user as the interaction seems to go well and no intervention seems to be necessary. It can be argued that negative affective states are more useful to be detected in order to improve the interaction and its outcome (D’Mello and Calvo, 2013; Palm and Glodek, 2013; Walter et al., 2013b). For example, if a student in this scenario is bored, a system that is acting as a teacher may, e.g., change the way information is presented to the student or adapts to search different sources of information. Another example could be that if the subject is frustrated with the task or with the interaction the respective task could be made easier for the subject or further explanations could be given to him.
An advantage of this approach is that the dialog model of the interaction can thus be used to find emotional patterns that are useful for the interaction. For example, if some form of input from the user is required but not provided or a wrong answer is given (in a teacher role) emotional cues can be incorporated.
4.2. Supporting Technologies
To render the task of creation and annotation of affective corpora feasible, a number of supporting technologies from the realm of machine learning and statistical pattern recognition can be used.
A major issue that renders the creation of corpora difficult is the assignment of complex labels to large amounts of data (see Section 3.2.1). It is therefore desirable to reduce the workload of labelers by preselecting “interesting” parts of the interaction for subsequent manual inspection using appropriate label tools. Such a pre-selection should be done automatically, either as given by the dialog structure or by using machine learning techniques.
Using the dialog structure of the experiment demands that it has been designed in a suitable way. An example for this scenario is the dataset presented in Thiam et al. (2014). It was designed to study the interaction history of participants with an interactive system by playing a puzzle game. Audio-visual recordings are available as well as the result of each timed puzzle. Each puzzle is accompanied by a search phase and the uttering of a potential solution, which is then indicated to be correct or false by the system. This situation is illustrated in Figure 8. The wrongly solved puzzles and the accompanying indication thereby elicit the most vivid reactions as indicated as yellow event in Figure 8. By inspecting the recordings around those events, most of the interesting parts can be found with relative little effort, while the searching phase and correctly solved puzzles hardly evoke any notable reactions. Subsequent manual annotation based on the events yields the desired information as indicated in the lower most trace in Figure 8.
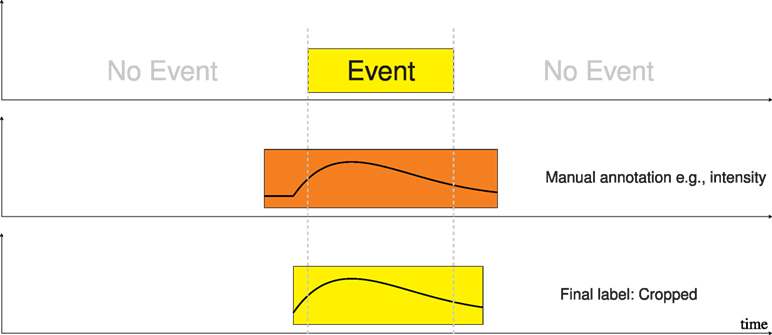
Figure 8. Illustration of the event based hybrid labeling strategy of interesting sub-sequences.
Another possibility to solve this problem is to use statistical novelty detection. Different approaches to extract outliers and interesting points from the majority of the data have been proposed in the literature. A popular choice is one-class SVM (Schölkopf et al., 2000) or support vector data description (SVDD) (Tax and Duin, 1999). Other approaches include generative models such as Gaussian mixture models. These methods, however, require that the data can be decomposed into a normal and an outlier class. For the interaction experiment, this is obviously possible because the events (i.e., the outlier class) are relatively rare, and the rest can be considered normal. There are unfortunately a number of issues that existing approaches to novelty detection have to account for. The data that are assigned to the normal class have to be homogeneously distributed which may not be the case, especially when considering data of multiple subjects due to individual differences. Furthermore, there are the issues of trading-off missing out outliers and generating many false alarms in the optimization of such models and how to deal with actual (technical) outliers in the data (i.e., sensor errors or false face detections) that should not belong to the event class. Finally, traditional approaches to novelty detection are bound to applications that are not dependent on time. For the applications targeted in this paper, an extension to sequences is desirable as a sample could be an outlier or not depending on the previous samples.
A promising approach to reduce cognitive load for annotators includes the use of partially- and semi-supervised learning (Schwenker and Trentin, 2014). In these methods, information from unlabeled and commonly much fewer labeled samples is combined to infer labels for all the samples in an automated manner. Popular instances include self- or co-training (Yarowski, 1995; Blum and Mitchell, 1998) but more significant for the application at hand is the so-called active learning (McCallum and Nigam, 1998) as the former require already reliable classifiers. In active learning, unlabeled samples are ranked by a machine learning algorithm according to an uncertainty-based criterion. The highest scoring samples are selected and given to an expert for annotation or inspection of a proposed label. The idea is to select samples whose labels offer the biggest gain in information for the system and to reduce the total number of samples that have to be manually annotated. While active learning has been successfully applied to annotation (Thiam et al., 2014) and can significantly reduce the amount of samples to annotate, there are still a hand full of open issues. For example, how can one identify an individual “sample” for active learning in an interaction history? Furthermore, how can uncertainty be measured for time continuous episodes with also continuous classifier outputs? If a given sample is passed to an expert what does accepting or rejecting of a respective label trace mean given the high rater variances?
Another problem that has been discussed in Section 3.2.1 is the annotation delay that differs between annotators but more importantly is not constant with respect to a single annotator over time. While solutions that rely on subtraction of the measured delay can only achieve a certain quality level due to the non-constant shifts, machine learning can help to remedy this problem. In Ringeval et al. (2015), bidirectional long- and short-term memory (BLSTM) recurrent neural networks (Graves and Schmidhuber, 2005) have been applied to deal with the delay in a non-linear, time invariant manner. The internal state is a function of the states at earlier time steps and thus the required information to compensate the delay is readily available within the network. The downside of this method is that training of recurrent neural networks is a difficult task and to fine-tune such architectures and reliably achieve convergence demands a considerable amount of time and expert knowledge.
The concentration on interesting sequences clears resources for human annotation that would otherwise be occupied by labeling long, uneventful interaction sequences that are exhausting for labelers and might render uncertain labels (Calvo and D’Mello, 2010). These resources should hence be spent on inspecting the interesting sequences multiple times by the same person and optimally as well by multiple (e.g., >10) subjects. Thus, a better probabilistic estimate of the true user state can be inquired by averaging over many individually uncertain ratings. Furthermore, it is possible to compute meaningful variances for the class assignments that could be used to judge the respective reliability (Bishop, 2006). For example, when assigning a mean class probability of 0.5 with a low variance of the individual ratings even small deviations of an assumed automatic classification should be punished more severely than an assignment of 1.0 that comes with a high variance of the individual ratings.
In this context, it may be beneficial to evaluate an application not so much using the recognition of the respective affective user states but using an evaluation of the whole system. There is already a whole body of research and standardized questionnaires that address these questions. Popular choices are the AttrakDiff questionnaire (Hassenzahl et al., 2003) that queries the feelings about the system from the user, the NASA TLX (Hart, 2006) that assesses the workload of the user and measuring the human–computer trust (Madsen and Gregor, 2000). Such results could be used to improve the affective HCI, for example, using techniques of reinforcement learning, where the scores of questionnaire are used as part of reward functions.
5. Summary and Conclusion
In this paper, we presented a critical view of the steps included in the creation of affective data collections. This includes the experimental design, the actual recording, annotation, and statistical evaluation. We revealed common pitfalls in each of these steps and presented ideas to solve them.
In detail, we discussed the recording scenarios that are used to compile corpora to study affective HCI and further connected issues such as the repeatability of an experiment. Furthermore, we analyzed the annotation process. Here, we outlined the effects the human annotation and the utilized tool have on the outcome of the annotation. Beyond that, we showed that choosing a suitable performance measure is essential for statistical evaluation of classifier predictions and stress that this issue is commonly overlooked. We demonstrated these shortcomings using the example of the well-known AVEC benchmark datasets, which implies that the raised issues are of far reaching relevance for the affective computing community. We furthermore presented some points at which machine learning algorithms can tie in to help remedy some of the presented issues.
We believe that the presented issues have to be tackled in order to take the research in affective HCI further. The solutions for the individual points are yet up to debate in the scientific community. We attempt in to introduce in this paper a concept for the annotation of continuous affective data sets that is aware of time-dependent artifact. The main concept for this is to segment the data such that the time-dependent parts of the label can be separated. The details of this approach depend unfortunately heavily on the application and the specifics of the individual test subject. For example, the time difference of a starting point of a data sample and the reaction to a situation. Basically, all of the presented issues are strongly application and subject dependent and in our opinion important to consider. The respective choices should be justified based on the task at hand when compiling a new affective data set.
Author Contributions
MK contributed substantially to the contents of and the analysis in the present paper. He contributed to a great extent to the manuscript and gives his final approval of the version to be published. He agrees to be accountable for all aspects of the work in ensuring that questions related to the accuracy or integrity of any part of the work are appropriately investigated and resolved. MS contributed substantially to the contents of and the analysis in the present paper. He contributed to a great extent to the manuscript and gives his final approval of the version to be published. He agrees to be accountable for all aspects of the work in ensuring that questions related to the accuracy or integrity of any part of the work are appropriately investigated and resolved. FS contributed to the contents of and the analysis in the present paper. He contributed to the manuscript and gives his final approval of the version to be published. He agrees to be accountable for all aspects of the work in ensuring that questions related to the accuracy or integrity of any part of the work are appropriately investigated and resolved.
Conflict of Interest Statement
The authors declare that the research was conducted in the absence of any commercial or financial relationships that could be construed as a potential conflict of interest.
The reviewer AT and handling editor declared their shared affiliation, and the handling editor states that the process nevertheless met the standards of a fair and objective review.
Funding
This paper is based on work done within the Transregional Collaborative Research Centre SFB/TRR 62 Companion-Technology for Cognitive Technical Systems funded by the German Research Foundation (DFG). MK is supported by a scholarship of the Landesgraduiertenförderung Baden-Württemberg at Ulm University. The work is furthermore supported by the SenseEmotion project funded by the German Ministry of Science, Research and Arts and was performed using the computational resource bwUniCluster funded by the Ministry of Science, Research and Arts and the Universities of the State of Baden-Württemberg, Germany, within the framework program bwHPC.
References
Arroyo, I., Cooper, D. G., Burleson, W., Woolf, B. P., Muldner, K., and Christopherson, R. (2009). “Emotion sensors go to school,” in Proceedings of the 2009 Conference on Artificial Intelligence in Education: Building Learning Systems that Care: From Knowledge Representation to Affective Modelling (Amsterdam: IOS Press), 17–24.
Blum, A., and Mitchell, T. (1998). “Combining labeled and unlabeled data with co-training,” in COLT: Proceedings of the Workshop on Computational Learning Theory (New York: Morgan Kaufmann Publishers), 92–100.
Burkhardt, F., Paeschke, A., Rolfes, M., Sendlmeier, W. F., and Weiss, B. (2005). “A database of German emotional speech,” in INTERSPEECH’05 (Lisbon: ISCA), 1517–1520.
Calvo, R., and D’Mello, S. (2010). Affect detection: an interdisciplinary review of models, methods, and their applications. IEEE Trans. Affect. Comput. 1, 18–37. doi:10.1109/T-AFFC.2010.1
Celiktutan, O., Eyben, F., Sariyanidi, E., Gunes, H., and Schuller, B. (2014). “Maptraits 2014: the first audio/visual mapping personality traits challenge,” in Proceedings of the 2014 Workshop on Mapping Personality Traits Challenge and Workshop, MAPTRAITS ’14 (New York: ACM), 3–9.
Chao, L., Tao, J., Yang, M., Li, Y., and Wen, Z. (2014). “Multi-scale temporal modeling for dimensional emotion recognition in video,” in Proceedings of the 4th International Workshop on Audio/Visual Emotion Challenge, AVEC ’14 (New York, NY: ACM), 11–18.
Cowie, R., Douglas-Cowie, E., Savvidou, S., McMahon, E., Sawey, M., and Schröder, M. (2000). “‘FEELTRACE’: an instrument for recording perceived emotion in real time,” in Proceedings of the ISCA Workshop on Speech and Emotion (Newcastle, Northern Ireland: ISCA), 19–24.
Cowie, R., McKeown, G., and Douglas-Cowie, E. (2012). Tracing emotion: an overview. Int. J. Synth. Emot. 3, 1–17. doi:10.4018/jse.2012010101
D’Mello, S., and Calvo, R. A. (2013). “Beyond the basic emotions: what should affective computing compute?,” in CHI ’13 Extended Abstracts on Human Factors in Computing Systems, CHI EA ’13 (New York: ACM), 2287–2294.
D’Mello, S., Picard, R. W., and Graesser, A. (2007). Toward an affect-sensitive autotutor. IEEE Intell. Syst. 22, 53–61. doi:10.1109/MIS.2007.79
Dubois, D., and Prade, H. (1980). Fuzzy Sets and Systems: Theory and Applications. New York: Academic Press.
Ekman, P., and Friesen, W. V. (1978). Facial Action Coding System (FACS): A Technique for the Measurement of Facial Action. Palo Alto: CPP.
Girard, J. M. (2014). Carma: software for continuous affect rating and media annotation. J. Open Res. Softw. 2, e5. doi:10.5334/jors.ar
Glodek, M., Schels, M., Palm, G., and Schwenker, F. (2012). “Multiple classifier combination using reject options and Markov fusion networks,” in Proceedings of the 14th ACM International Conference on Multimodal Interaction (New York: ACM), 465–472.
Gnjatović, M., and Rösner, D. (2008). “On the role of the NIMITEK corpus in developing an emotion adaptive spoken dialogue system,” in Proc. of the 7th LREC (Marrakech, Morocco).
Graves, A., and Schmidhuber, J. (2005). Framewise phoneme classification with bidirectional LSTM and other neural network architectures. Neural Netw. 18, 602–610. doi:10.1016/j.neunet.2005.06.042
Grimm, M., and Kroschel, K. (2005). “Evaluation of natural emotions using self assessment manikins,” in IEEE Workshop on Automatic Speech Recognition and Understanding (Cancun: IEEE), 381–385.
Gupta, R., Malandrakis, N., Xiao, B., Guha, T., Van Segbroeck, M., Black, M., et al. (2014). “Multimodal prediction of affective dimensions and depression in human-computer interactions,” in Proceedings of the 4th International Workshop on Audio/Visual Emotion Challenge, AVEC ’14 (New York, NY: ACM), 33–40.
Hart, S. G. (2006). “Nasa-task load index (nasa-tlx); 20 years later,” in Proceedings of the Human Factors and Ergonomics Society Annual Meeting, Vol. 50 (New York: Sage Publications), 904–908.
Hassenzahl, M., Burmester, M., and Koller, F. (2003). “AttrakDiff: Ein Fragebogen zur Messung wahrgenommener hedonischer und pragmatischer Qualität,” in Mensch & Computer 2003 (Wiesbaden: Springer), 187–196.
Kächele, M., Schels, M., and Schwenker, F. (2014). “Inferring depression and affect from application dependent meta knowledge,” in Proceedings of the 4th International Workshop on Audio/Visual Emotion Challenge, AVEC ’14 (New York: ACM), 41–48.
Kanade, T., Cohn, J., and Tian, Y. (2000). “Comprehensive database for facial expression analysis,” in Automatic Face and Gesture Recognition, 2000 (Washington: IEEE), 46–53.
Kelley, J. F. (1983). “An empirical methodology for writing user-friendly natural language computer applications,” in Proceedings of the SIGCHI Conference on Human Factors in Computing Systems, CHI ’83 (New York: ACM), 193–196.
Kessler, V., Schels, M., Kächele, M., Palm, G., and Schwenker, F. (2015). “On the effects of continuous annotation tools and the human factor on the annotation outcome,” in Proceedings of the International Symposium on Companion Technology (Ulm: Ulm University Open Access Repository), 17.
Kipp, M. (2001). “Anvil – a generic annotation tool for multimodal dialogue,” in Proc. of 7th European Conference on Speech Communication and Technology (Eurospeech) (Aalborg: ISCA), 1367–1370.
Lang, P. J., Bradley, M. M., and Cuthbert, B. N. (1999). International Affective Picture System (IAPS): Technical Manual and Affective Ratings. Technical report. Gainesville: Center for Research in Psychophysiology, Gainesville, University of Florida.
Lang, P. J., Bradley, M. M., and Cuthbert, B. N. (2005). International Affective Picture System (IAPS): Affective Ratings of Pictures and Instruction Manual. Technical Report A-6. Gainesville, FL: University of Florida.
Lin, L. I. (1989). A concordance correlation coefficient to evaluate reproducibility. Biometrics 45, 255–268. doi:10.2307/2532051
Madsen, M., and Gregor, S. (2000). “Measuring human-computer trust,” in Proceedings of Eleventh Australasian Conference on Information Systems (Brisbane: ACS), 6–8.
McCallum, A., and Nigam, K. (1998). “A comparison of event models for naive Bayes text classification,” in AAAI-98 Workshop on Learning for Text Categorization (AAAI Press), 41–48.
McKeown, G., Valstar, M. F., Cowie, R., and Pantic, M. (2010). “The SEMAINE corpus of emotionally coloured character interactions,” in IEEE International Conference on Multimedia and Expo (ICME) (Singapore: IEEE), 1079–1084.
Meudt, S., Bigalke, L., and Schwenker, F. (2012). “Atlas – an annotation tool for HCI data utilizing machine learning methods,” in Proceedings of the 1st International Conference on Affective and Pleasurable Design (APD’12) (Boca Raton, FL: CRC Pess), 5347–5352.
Palm, G., and Glodek, M. (2013). “Towards emotion recognition in human computer interaction,” in Neural Nets and Surroundings, Vol. 19, eds B. Apolloni, B. Simone, A. Esposito, and F. C. Morabito (Berlin: Springer), 323–336.
Prylipko, D., Rösner, D., Siegert, I., Gnther, S., Friesen, R., Haase, M., et al. (2014). Analysis of significant dialog events in realistic human-computer interaction. J. Multimodal User Interfaces 8, 75–86. doi:10.1007/s12193-013-0144-x
Ringeval, F., Schuller, B., Valstar, M., Jaiswal, S., Marchi, E., Lalanne, D., et al. (2015). “AV+EC 2015 – the first affect recognition challenge bridging across audio, video, and physiological data,” in Proceedings of AVEC (New York: ACM), 3–8.
Ringeval, F., Sonderegger, A., Sauer, J., and Lalanne, D. (2013). “Introducing the RECOLA multimodal corpus of remote collaborative and affective interactions,” in Proceedings of Face & Gestures 2013, 2nd IEEE International Workshop on Emotion Representation, Analysis and Synthesis in Continuous Time and Space (EmoSPACE) (Shanghai: IEEE), 1–8.
Rösner, D., Frommer, J., Friesen, R., Haase, M., Lange, J., and Otto, M. (2012). “LAST MINUTE: a multimodal corpus of speech-based user-companion interactions,” in Proc. of LREC (Istanbul: ELRA), 2559–2566.
Rukavina, S., Gruss, S., Walter, S., Hoffmann, H., and Traue, H. C. (2015). “Open_emorec II – a multimodal corpus of human-computer interaction,” in Proceedings of ICACII (Berlin: Springer), 356–367.
Russell, J. A., and Mehrabian, A. (1977). Evidence for a three-factor theory of emotions. J. Res. Pers. 11, 273–294. doi:10.1016/0092-6566(77)90037-X
Schels, M., Kächele, M., Glodek, M., Hrabal, D., Walter, S., and Schwenker, F. (2014). Using unlabeled data to improve classification of emotional states in human computer interaction. J. Multimodal User Interfaces 8, 5–16. doi:10.1007/s12193-013-0133-0
Schölkopf, B., Smola, A. J., Williamson, R. C., and Bartlett, P. L. (2000). New support vector algorithms. Neural Comput. 12, 1207–1245. doi:10.1162/089976600300015565
Schuller, B., Müller, R., Eyben, F., Gast, J., Hörnler, B., Wöllmer, M., et al. (2009). Being bored? Recognising natural interest by extensive audiovisual integration for real-life application. Image Vision Comput. 27, 1760–1774. doi:10.1016/j.imavis.2009.02.013
Schuller, B., Valstar, M., Cowie, R., and Pantic, M. (2012). “Avec 2012: the continuous audio/visual emotion challenge – an introduction,” in Proc. of the 14th ACM ICMI’12 (New York: ACM), 361–362.
Schuller, B., Valstar, M., Eyben, F., McKeown, G., Cowie, R., and Pantic, M. (2011). “AVEC 2011 – the first international audio visual emotion challenges,” in Proceedings of ACII (2011), volume 6975 of LNCS, Part II (Berlin: Springer), 415–424.
Schüssel, F., Honold, F., Schmidt, M., Bubalo, N., Huckauf, A., and Weber, M. (2014). “Multimodal interaction history and its use in error detection and recovery,” in Proceedings of the 16th International Conference on Multimodal Interaction, ICMI ’14 (New York: ACM), 164–171.
Schwenker, F., and Trentin, E. (2014). Pattern classification and clustering: a review of partially supervised learning approaches. Pattern Recognit. Lett. 37, 4–14. doi:10.1016/j.patrec.2013.10.017
Stemmler, G. (1989). The autonomic differentiation of emotions revisited: convergent and discriminant validation. Psychophysiology 26, 617–632. doi:10.1111/j.1469-8986.1989.tb03163.x
Strauss, P.-M., Hoffmann, H., Minker, W., Neumann, H., Palm, G., Scherer, S., et al. (2008). “The PIT corpus of German multi-party dialogues,” in Proc. of LREC (Marrakech: ELRA), 2442–2445.
Strauß, P.-M., Hoffmann, H., Minker, W., Neumann, H., Palm, G., Scherer, S., et al. (2006). “Wizard-of-oz data collection for perception and interaction in multi-user environments,” in Proceedings of LREC (Genoa: ELRA), 2014–2017.
Tax, D. M. J., and Duin, R. P. W. (1999). Support vector domain description. Pattern Recognit. Lett. 20, 1191–1199. doi:10.1016/S0167-8655(99)00087-2
Theodoridis, S., and Koutroumbas, K. (2009). Pattern Recognition, 4th Edn. Burlington, MA: Academic Press.
Thiam, P., Meudt, S., Kächele, M., Palm, G., and Schwenker, F. (2014). “Detection of emotional events utilizing support vector methods in an active learning HCI scenario,” in Proceedings of the 2014 Workshop on Emotion Representations and Modelling for HCI Systems, ERM4HCI ’14 (New York: ACM), 31–36.
Valstar, M., Schuller, B., Smith, K., Almaev, T., Eyben, F., Krajewski, J., et al. (2014a). “Avec 2014: 3d dimensional affect and depression recognition challenge,” in Proceedings of the 4th International Workshop on Audio/Visual Emotion Challenge, AVEC ’14 (New York: ACM), 3–10.
Valstar, M., Schuller, B., Smith, K., Almaev, T., Eyben, F., Krajewski, J., et al. (2014b). “AVEC 2014: 3D dimensional affect and depression recognition challenge,” in Proceedings of ACM Multimedia 2014 (New York: ACM), 3–10.
Valstar, M., Schuller, B., Smith, K., Eyben, F., Jiang, B., Bilakhia, S., et al. (2013). “Avec 2013: the continuous audio/visual emotion and depression recognition challenge,” in Proceedings of AVEC 2013, AVEC ’13 (New York: ACM), 3–10.
Walter, S., Kim, J., Hrabal, D., Crawcour, S., Kessler, H., and Traue, H. (2013a). Transsituational individual-specific biopsychological classification of emotions. IEEE Trans. Syst. Man Cybern. 43, 988–995. doi:10.1109/TSMCA.2012.2216869
Walter, S., Wendt, C., Bhnke, J., Crawour, S., Tan, J., Chan, A., et al. (2013b). Similarities and differences of emotions in human-machine and human-human interaction: what kind of emotions are relevant for future companion systems. Ergonomics 57, 374–386. doi:10.1080/00140139.2013.822566
Walter, S., Scherer, S., Schels, M., Glodek, M., Hrabal, D., Schmidt, M., et al. (2011). “Multimodal emotion classification in naturalistic user behavior,” in Human-Computer Interaction. Towards Mobile and Intelligent Interaction Environments, Volume 6763 of LNCS, ed. J. Jacko (Berlin, Heidelberg: Springer), 603–611.
Williamson, J. R., Quatieri, T. F., Helfer, B. S., Horwitz, R., Yu, B., and Mehta, D. D. (2013). “Vocal biomarkers of depression based on motor incoordination,” in Proceedings of the 3rd ACM International Workshop on Audio/Visual Emotion Challenge, AVEC ’13 (New York: ACM), 41–48.
Wu, C.-H., Lin, J.-C., and Wei, W.-L. (2014). Survey on audiovisual emotion recognition: databases, features, and data fusion strategies. APSIPA Trans. Signal Inform. Process. 3, e12. doi:10.1017/ATSIP.2014.11
Yarowski, D. (1995). “Unsupervised word sense disambiguation rivaling supervised methods,” in Proceedings Thirty-Third Meeting of the ACL (Stroudsburg: ACL), 189–196.
Keywords: affective computing, affective labeling, human–computer interaction, performance measures, machine guided labeling
Citation: Kächele M, Schels M and Schwenker F (2016) The Influence of Annotation, Corpus Design, and Evaluation on the Outcome of Automatic Classification of Human Emotions. Front. ICT 3:27. doi: 10.3389/fict.2016.00027
Received: 15 May 2016; Accepted: 26 October 2016;
Published: 30 November 2016
Edited by:
Anna Esposito, Seconda Università degli Studi di Napoli, ItalyReviewed by:
Anna Pribilova, Slovak University of Technology in Bratislava, SlovakiaAlda Troncone, Seconda Università degli Studi di Napoli, Italy
Copyright: © 2016 Kächele, Schels and Schwenker. This is an open-access article distributed under the terms of the Creative Commons Attribution License (CC BY). The use, distribution or reproduction in other forums is permitted, provided the original author(s) or licensor are credited and that the original publication in this journal is cited, in accordance with accepted academic practice. No use, distribution or reproduction is permitted which does not comply with these terms.
*Correspondence: Markus Kächele, bWFya3VzLmthZWNoZWxlQHVuaS11bG0uZGU=
†Markus Kächele and Martin Schels contributed equally to this work.