 Xin Li1,2†
 Wenjing Wang3†
 Jing Chen1†
 Bangxiang Xie3
 Shumin Luo1
 Dexi Chen3Chao Cai1*Chuanyun Li2*
 Weihua Li1*
- 1Institute of Infectious Diseases of Integrated Traditional Chinese and Western Medicine, Beijing Youan Hospital, Capital Medical University, Beijing, China
- 2General Surgery Center, Beijing Youan Hospital, Capital Medical University, Beijing, China
- 3Beijing Institute of Hepatology, Beijing Youan Hospital, Capital Medical University, Beijing, China
Exosomes play an important role during human immunodeficiency virus (HIV) acute infection. Yet, information regarding its cargo and its association with HIV rapid progressors (RPs) and typical progressors (TPs) remain largely unknown. In this study, exosomal miRNAs sequencing and mass cytometry were used to identify differential exosomal miRNAs and membrane proteins that participate in the pathogenesis of TPs and RPs. We discovered that miR-144-5p, miR-1180-3p, miR-451a, miR-362-5p, and miR-625-5p are associated with the TPs and miR-362-5p with the RPs. Decreased autophagy, amino acid metabolism, immune response, and IL-6 are closely related to RPs. In addition, SP1 was selected as the most significant transcription factor (TF) associated with disease progression. CD49D, CD5, CCR5, CD40, CD14, and CD86 were selected as the differential exosomal membrane proteins between TPs and RPs. This study provides valuable information for clarifying the mechanism in people with acute HIV infection.
Introduction
Acquired immunodeficiency syndrome (AIDS) is a chronic, life-threatening condition and the most advanced stage of immunodeficiency virus (HIV) infection (1). The most common transmission routes include anal or vaginal sex, sharing needles, syringes, or other drug-injection equipment, and mother-to-child transmission (2, 3). Human immunodeficiency virus types 1 and 2 (HIV-1 and HIV-2) that cause AIDS (3) have many similarities, including intracellular replication mechanisms and transmission modes. However, HIV-1 has higher transmissibility, and AIDS caused by HIV-1 is a more aggressive type of disease (4). Moreover, HIV-1 is widely spread worldwide, while HIV-2 is mainly prevalent in countries in West Asia (5).
Antiretroviral therapy (ART) is the best treatment for AIDS, yet, ART is a lifelong therapy that can only control the activity of HIV and cannot prevent its transmission. Furthermore, not all patients respond well to HIV vaccination (6–10). Therefore, further exploring the mechanism of HIV-1 might help develop new treatments.
HIV infection can be divided into three types: typical progression (TPs), rapid progression (RPs), and long-term non progression (LTNP). The RPs is defined as an infection that appears within 3 years; TPs as an infection that appears between 8 years to 10 years after the first infection; LTNP is defined based on the number of CD4 cells > 400 after infection over 10 years (11). Studies on HIV have been mainly focused on LTNP, while TPs and the RPs have been less reported.
Exosomes are small membrane-bound nano-sized vesicles 30-150 nm in diameter that contain many biologically active molecules involved in the communication between cells and the surrounding microenvironment (12–14). MicroRNAs (miRNAs) are 21-22nt small non-coding RNA that regulate gene expression and are involved in cell proliferation, cell differentiation, cell migration, disease initiation, and disease progression (15–19). Studies have suggested that miRNA protects exosomes from degradation and guarantees their stability (20). Also, miRNAs in exosomes are considered a third way of intercellular communication that has the same importance as the cell-to-cell contact-dependent signaling and signaling via the transfer of soluble molecules (21, 22). Detection of exosomal member proteins can help researchers to figure out which kinds of cells secreted these miRNAs.
Prior studies suggest exosomes have an important role in HIV pathogenesis. Yet, information regarding its cargo and its association with HIV progression is not fully understood. In this study, we explored the role of exosomal miRNAs and member proteins in the pathogenesis of the TPs and the RPs in people infected with HIV-1. We also highlighted the need for new technologies that can associate a specific marker with an exosome subtype and the exosome subtype to a particular function and/or group of functions (23).
Materials and methods
Patients and samples
A total of 15 participants, including 5 Healthy control (HC), 5 HIV patients with TPs, and 5 HIV cases with RPs from Beijing Youan Hospital, were included between 2006 and 2016. Plasma samples were collected at 1, 6, and 12 months after HIV infection. HIV was diagnosed by the Chinese Center for Disease Control and Prevention or the department of infectious diseases in Beijing You’an Hospital. The classification of HIV was based on stages of disease progression (DP): the RPs was defined as an infection that appears within 3 years; TPs as an infection that appears between 8 years to 10 years after the first infection (24).
Peripheral blood samples from patients were collected in EDTA tubes following a regular venipuncture procedure. After centrifugation at 3,000 ×g for 15 min at 4°C, the plasma was aspirated and stored at −80°C.
Plasma exosomes isolation (ultracentrifugation and molecular size exclusion)
The UC (ultracentrifugation) method was optimized according to the previously described approach (25). After thawing at 37°C, plasma samples were centrifugated at 3,000 ×g for 15 min to remove cell debris. Then, the supernatant was diluted by a seven-fold volume of phosphate-buffered saline (PBS), centrifuged at 13,000 ×g for 30 min, and processed through a 0.22 μm filter to remove large particles. The supernatant was then ultracentrifuged using a P50A72-986 rotor (CP100NX; Hitachi, Brea, CA, USA) at 100,000 ×g, 4°C, for 2 h to pellet the exosomes. Then, the pellet was re-suspended in PBS and centrifuged at 100,000 ×g 4°C for 2 h. After PBS washing, the exosomes pellet was re-suspended in 100 µl PBS.
The size exclusion method (SEC) was used to separate the exosomes. Briefly, after 0.8 μm filtration, 1 ml plasma sample was diluted with 1.5 times PBS and then purified by Exosupur exclusion column (Echobiotech, China) following the manufacturer’s instructions. The sample was then eluted with 0.1M PBS, and 2ml of the target fraction was collected. Finally, the exosome solution was concentrated (200 μL) through an Amicon® ultrafiltration tube with a molecular weight cutoff of 100kDa (Merck, Germany).
Characterization of exosomes
Nanoparticle tracking analysis (NTA)
Vesicle suspensions with concentrations between 1x10⁷/ml and 1x10⁹/ml were examined using the ZetaView PMX 110 (Particle Metrix, Meerbusch, Germany) equipped with a 405 nm laser to determine the size and quantity of particles. A video of 60-sec duration was taken with a frame rate of 30 frames/sec, and particle movement was analyzed using NTA software (ZetaView 8.02.28).
Transmission electron microscope (TEM) inspection
A 10 µl exosome solution was placed on a copper mesh and incubated at room temperature for 10 min. After washing with sterile distilled water, the exosome was mixed with uranyl acetate solution for 1 min. The sample was then dried for 2 min under incandescent light. The copper mesh was observed and photographed under a transmission electron microscope (H-7650, Hitachi Ltd., Tokyo, Japan).
Confocal laser scanning microscopy (CLSM)
The exosome supernatant was denatured in 5× sodium dodecyl sulfonate (SDS) buffer and subjected to Western blot analysis (10% SDS-polyacrylamide gel electrophoresis; 50 µg protein/lane) using rabbit polyclonal antibody CD63 (sc-5275, Santa Cruz, CA, USA). The proteins were visualized on the Tanon4600 Automatic chemiluminescence image analysis system (Tanon, Shanghai, China).
Western blot (WB)
Exosomes were denatured in 5× sodium dodecyl sulfonate (SDS) buffer, and then rabbit anti-CD63 (sc-5275, Santa Cruz, CA, USA), CD9 (60232-I-Ig, Proteintech, Rosemont, IL), HSP90 (60318-I-Ig, Proteintech, Rosemont, IL), Alix (sc-53540, Santa Cruz, CA, USA), TSG101 (sc-13611, Santa Cruz, CA, USA) and calnexin (10427-2-AP, Promega, Madison, Wis Visualize protein detection results).
ExoRNA isolation and RNA analysis
The total RNA of plasma exosomes was separated using the miRNeasy® Mini kit (Qiagen, cat. No. 217004) following the manufacturer’s instructions. The concentration and purity of RNA were evaluated by the RNA Nano 6000 Assay Kit of Agilent Bioanalyzer 2100 System (Agilent Technologies, CA, USA).
Library construction and sequencing
One to 500 ng of total RNA was used for small RNA libraries preparation by QIAseq miRNA Library Kit (Qiagen, Frederick, MD), which assigned a unique molecular index (UMI) sequence to each cDNA via reverse transcription. The sample index sequence was added during library amplification. The library quality was evaluated by Agilent Bioanalyzer 2100. Index-labeled samples were clustered in the acBot Cluster Generation System using TruSeq PE Cluster Kitv3-cBot-HS (Illumina, San Diego, CA, USA), and then paired-end sequencing was performed on the Illumina Hiseq platform.
miRNA analysis
miRNA identification and differential expression analysis
Bowtie was used to compare clean reads with Silva, GtRNAdb, Rfam, and Repbase databases to filter out rRNA, tRNA, snRNA, snoRNA, other ncRNAs, and repetitive sequences, respectively. The remaining reads were used for comparisons with miRbase and the human genome (GRCh38) and the identification of known miRNAs and prediction of new miRNAs. The number of reads for each miRNA was corrected by UMI and then normalized by the TPM method.
Target gene prediction
Target gene prediction method and software: the intersection of the prediction results of RNAhybrid and miRanda. Threshold parameter: RNAhybrid minimum free energy threshold: -30, miRanda scoring threshold: 150, miRanda minimum free energy threshold: -30.
Enrichment analysis of GO and KEGG pathways
Gene functions and signaling pathways were annotated using GO full name (GO) and KEGG full name (KEGG) databases. The clusterProfiler package was used for GO and KEGG enrichment analysis of differential genes. The significant p-value was obtained by the algorithm of hypergeometric distribution, and the q-value was obtained by BH correction.
Weighted co-expression network construction and identification of key modules
Exosomes miRNA co-expression networks were built according to the procedure of the WGCNA package in the R language (26). After filtering expression data using TPM>1 & cv > 0.5, 693 miRNAs were obtained. Primarily, we constructed the gene expression similarity matrix based on calculating the absolute value of Pearson’s correlation coefficient between gene pairs. Next, the similarity matrix was transformed into an adjacency matrix using a power adjacency function, which encodes the strength of the connection between node pairs (27). The power β = 4 was chosen based on the scale-free topology criterion when the R2 value was approximated to 0.81. A topological overlap matrix (TOM), which was based on the adjacency matrix, was used to identify miRNA modules, while a dynamic tree-cut algorithm was used to allocate miRNAs to different modules. The minimal module size was set at 30, and a threshold of 0.1 was selected to merge similar miRNA modules.
Sample preparation of mass cytometry
Plasma exosome samples were collected from HIV-infected people and healthy donors. All samples were cultured with metal-conjugated antibodies in 50 μL CSB for 30 min at RT. After triple washing in CSB, exosomes were incubated with 0.05 μm intercalator in fix and perm buffer (Fluidigm) at 4 °C overnight.
Data acquisition in Helios
After being cultured with an intercalator, exosomes were washed three times with deionized water. Before the acquisition, samples were resuspended in deionized water containing 10% EQ 4 Element Beads (Fluidigm). Data acquisition was performed on a Helios mass cytometer (Fluidigm). The original.FCS data were normalized and.fcs files were collected for each individual. All.fcs files were uploaded into Cytobank, and data cleaning was performed according to previous research. Also, tSNE analyses were performed as previously described.
Statistical analysis
The data were analyzed by using R software (version 3.6.1, R Project for Statistical 155 Computing) and GraphPad Prism 7 (GraphPad Software, San Diego, California). For the two independent samples, Student’s t-test (normally distributed data) and the Mann–Whitney U test (non-normally distributed data) were used to identify the significant differences. The mean intensity of protein expression was calculated by Cytof software. The Kruskal-Wallis H test was used for multiple independent samples. P-value <0.05 and Q value <0.05 were considered to be statistically significant.
Results
The baseline clinical characteristics of participants and identification of exosomes
None of the above HIV-infected people received antiretroviral therapy (ART). There was no significant difference in virus load (VL) and CD4 expression between the TPs and the RPs group in the acute infection phase (Figure 1). The baseline clinical characteristics of participants are presented in Table 1.
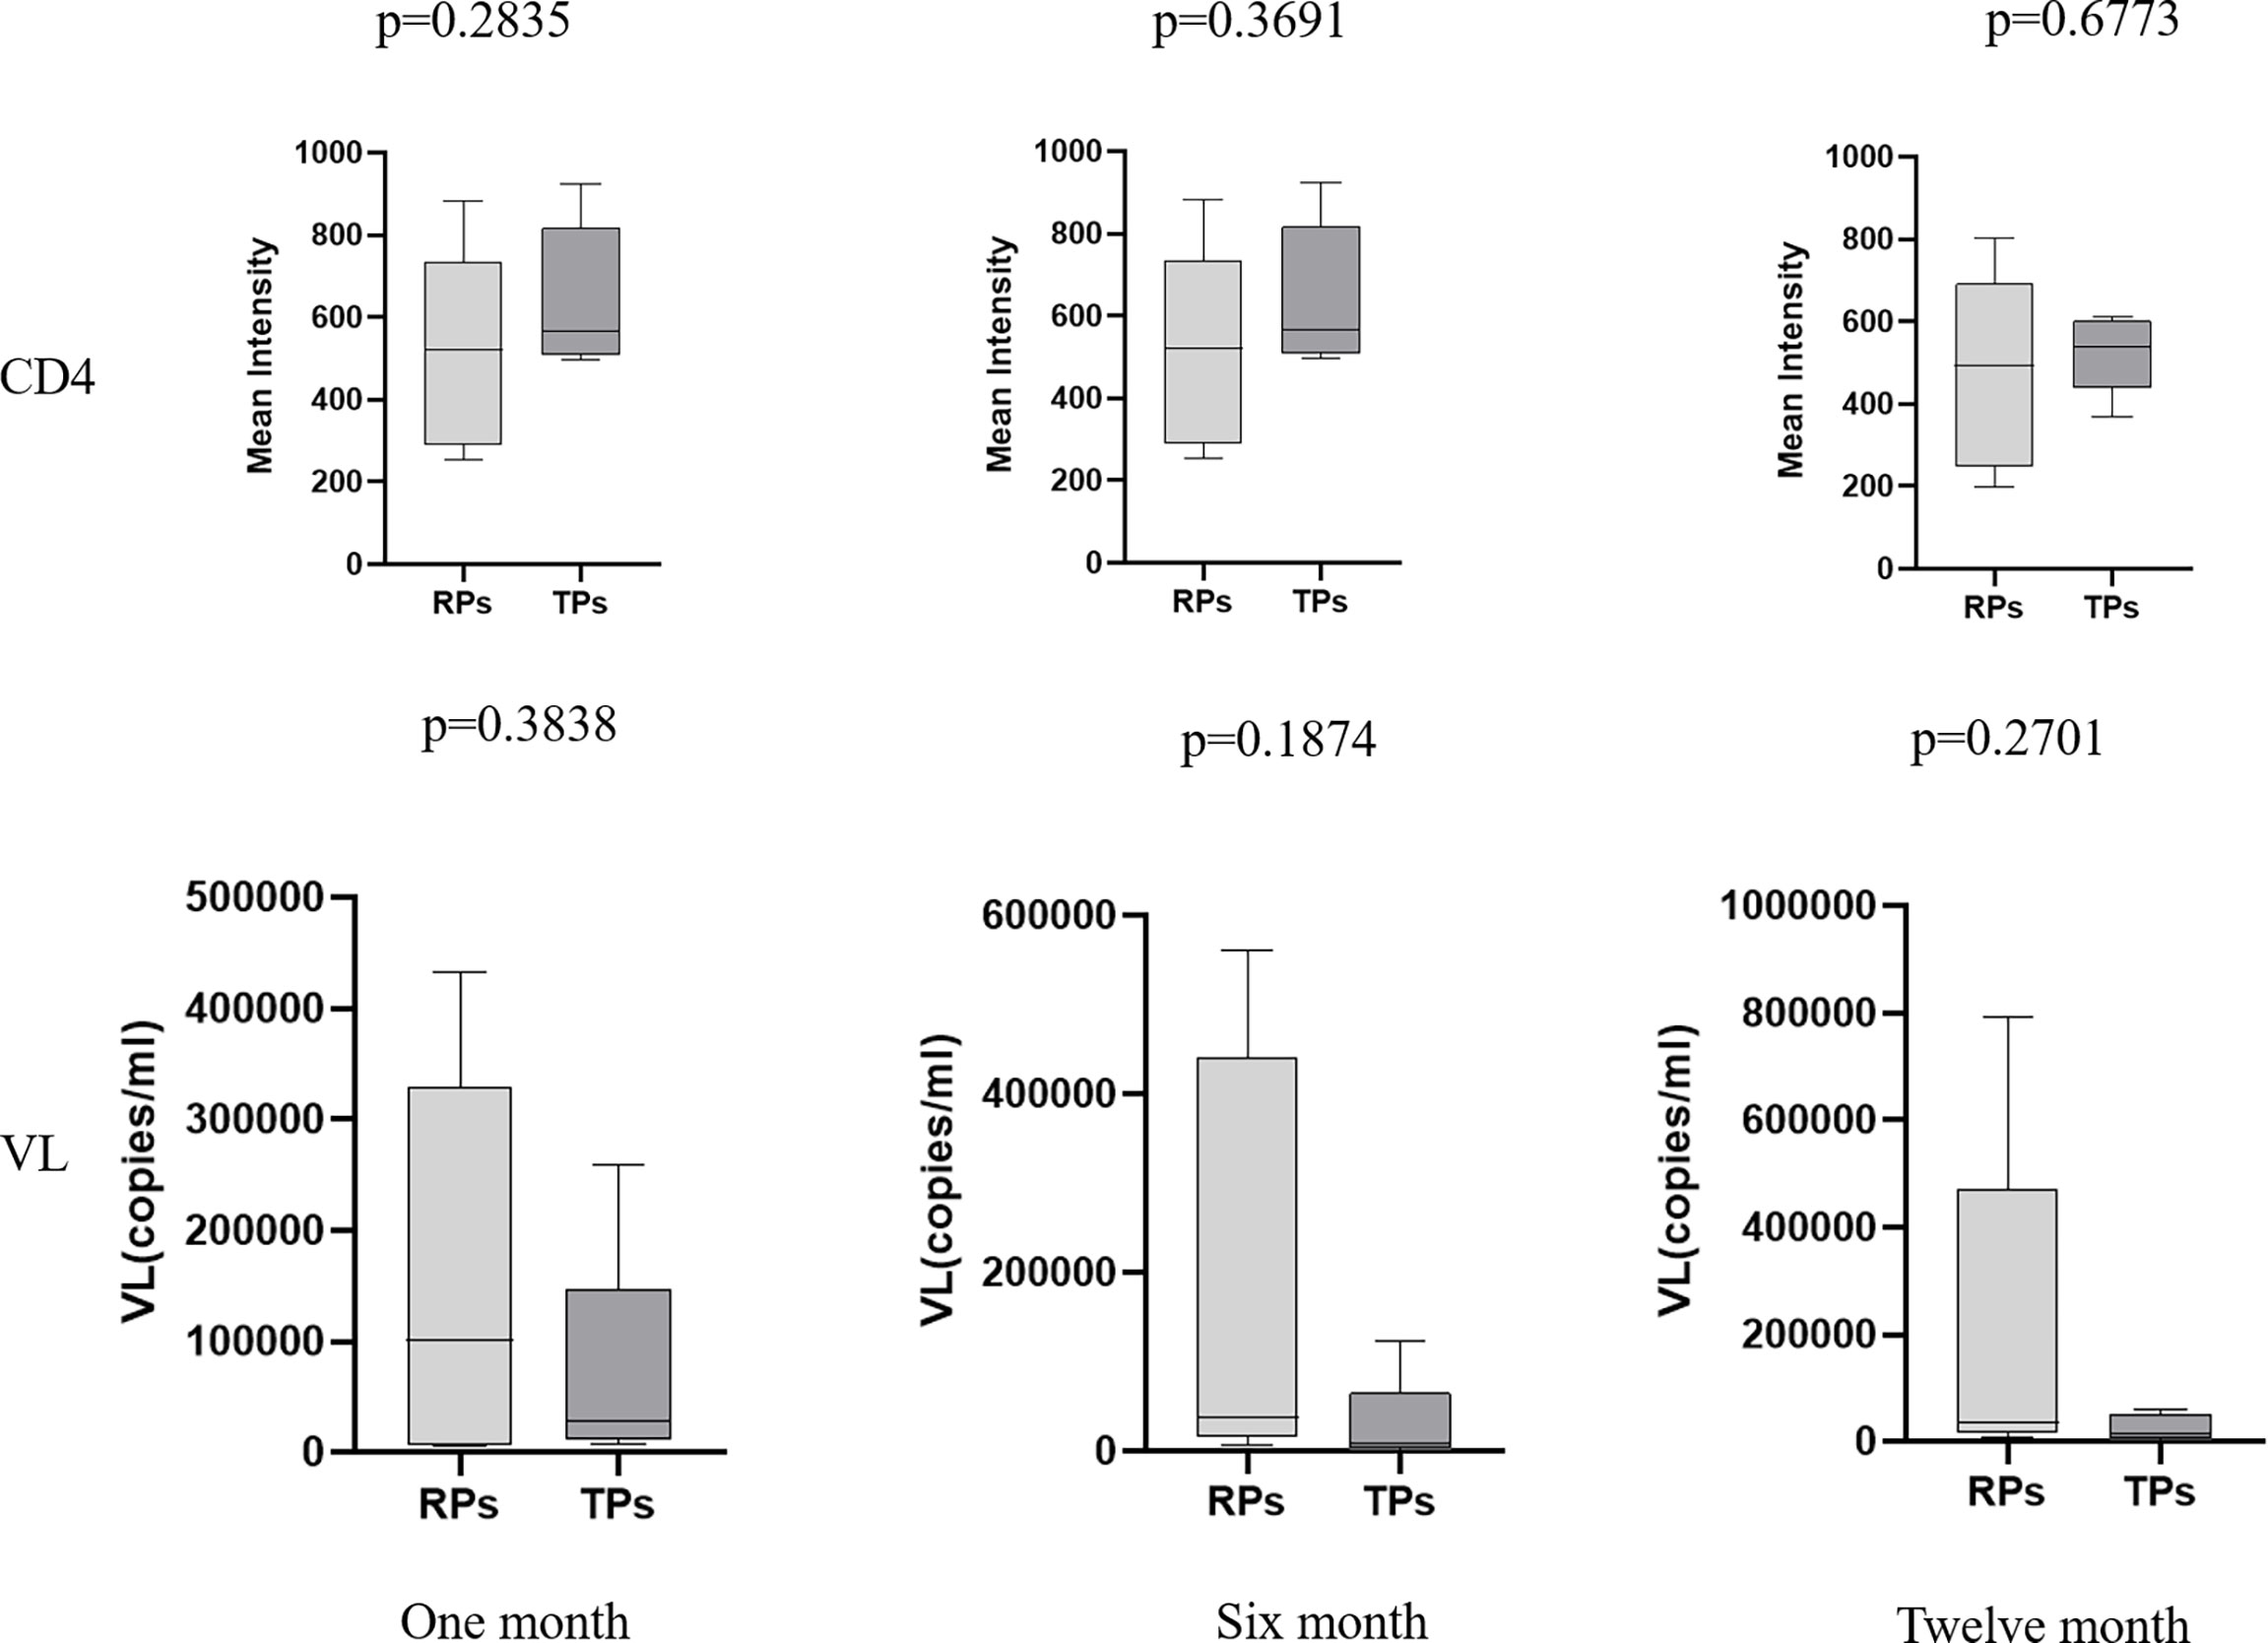
Figure 1 The comparison of CD4 and virus load (VL) at month 1, 2, and 12 in the TPs and RPs.
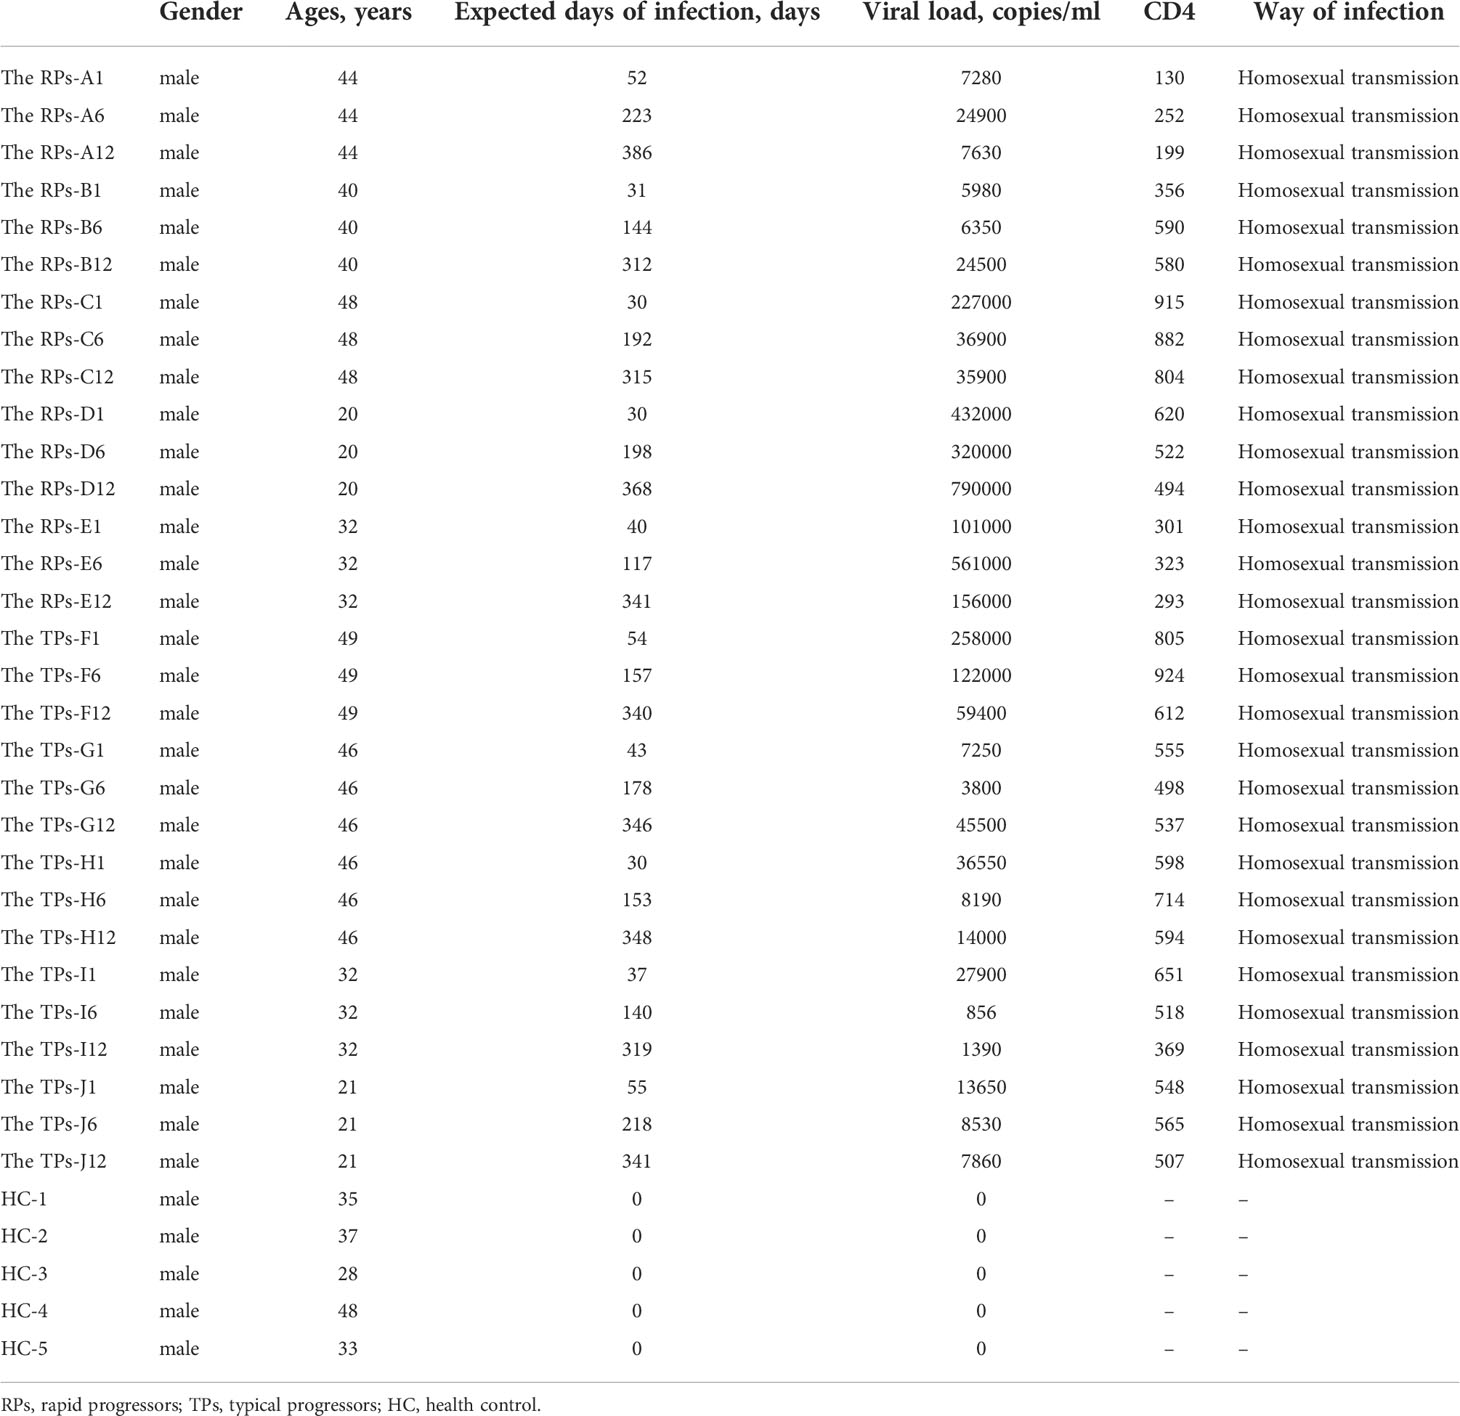
Table 1 The baseline Clinicopathological Characteristics of the Study Population.
The isolated exosomes were extracted from plasma samples and analyzed by TEM, NTA, WB, and CLSM. TEM indicated that particles had bilayer membranes (Figure 2A); CLSM further indicated a positive expression of EV markers CD9-AF647 (Figure 2B). Also, over 80% of the particles had a size of 30-150nm; the peak size was 70nm (Figure 2C).
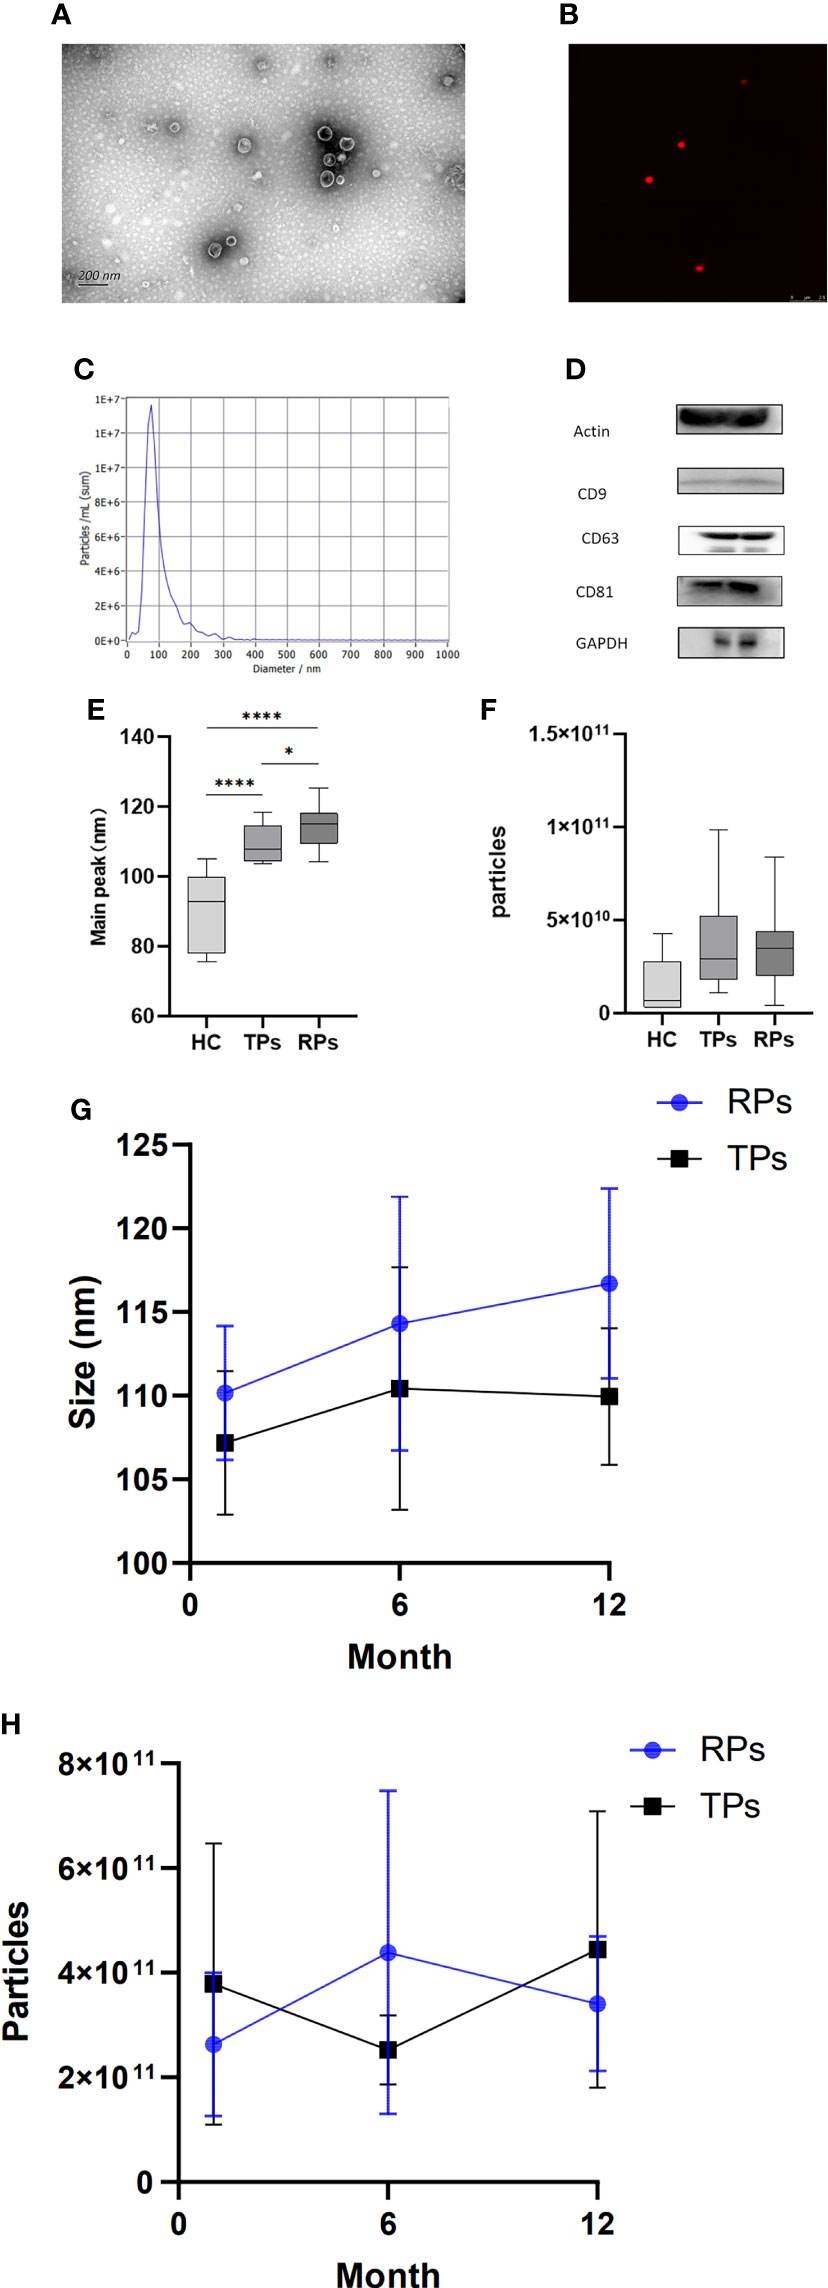
Figure 2 Basic characteristics and identification of exosomes in different disease progress groups. (A) Exosomes morphology analyzed by representative electron microscopy. Scale bar, 200 nm. (B) Ultrasensitive laser confocal microscopy was used to identify Exosomes (CD9-AF647). (c) NTA obtained the nanoparticle size distribution for plasma Exosomes. The particle size is between 30 and 150; the highest peak is observed at 70 nm. (D) Western blot analysis of actin, CD9, CD63, CD81, and GAPDH expression. (E, G) The peak size between HC, TPs, and RPs (e) and between month 1, 6, and 12 in TPs and RPs groups (g). (F, H) The concentration of Exosomes between HC, TPs, and RPs (f) and between month 1, 6, and 12 in TPs and RPs groups (h). * p<0.05, ****p<0.0001.
Next, we compared the peak size between HC, TPs, and RPs. There was a significant difference between HC and patients with acute HIV infection (Figure 2E). Furthermore, the peak size gradually increased in a time-dependent manner (i.e., it was lower at 3 months and higher at 12 month post-infection) in both TPs and the RPs group (Figure 2G). There was no significant difference in exosome concentration between the three groups; however, RPs > TPs > HC overall (Figure 2F). Also, there was no significant difference in exosome concentration between month 1, 2, and 12 in the TPs and the RPs groups (Figure 2H).
The biomarkers of exosomes, actin, CD9, CD63, CD81, and GADPH were expressed in plasma exosomes (Figure 2D). High-sensitivity flow cytometer and Amnis imaging flow assay were also used to identify exosomes (Figure S1). The small RNA sequencing of 40 samples was completed, and 1057.84 M Raw Reads were obtained, with an average of 26.45 M Raw Reads for each sample. Totally 2304 miRNAs were identified, among which 1744 were known, and 560 were newly predicted miRNAs. In addition, 18,737 miRNA target genes were predicted, and the functional annotation and enrichment analysis of the differentially expressed miRNA target genes were completed.
The analysis of HIV-specific exosomal miRNAs expression and their function in the HC group vs. HIV-infected people
Firstly, we compared the HC group with HIV-infected patients. A total of 208 differentially expression miRNAs (P<0.05) were identified, among which 167 were down-regulated and 41 were up-regulated (Figure 3A). Next, we performed the GO and KEGG pathway enrichment analysis. According to GO enrichment analysis, positive regulation of the BMP signaling pathway, positive regulation of GTPase activity, positive regulation of cell migration, and regulation of dendrite morphogenesis were the most enriched items in the biological process (BP) (Figure 3B). In the cell component (CC), the significant items were cell surface, neuronal cell body, cell junction, and proteinaceous extracellular matrix (Figure 3C). In the molecular function (MF), the significant items were activation and repression transcription, RNA polymerase II, Ras guanyl-nucleotide exchange factor activity, and protein kinase (Figure 3D).
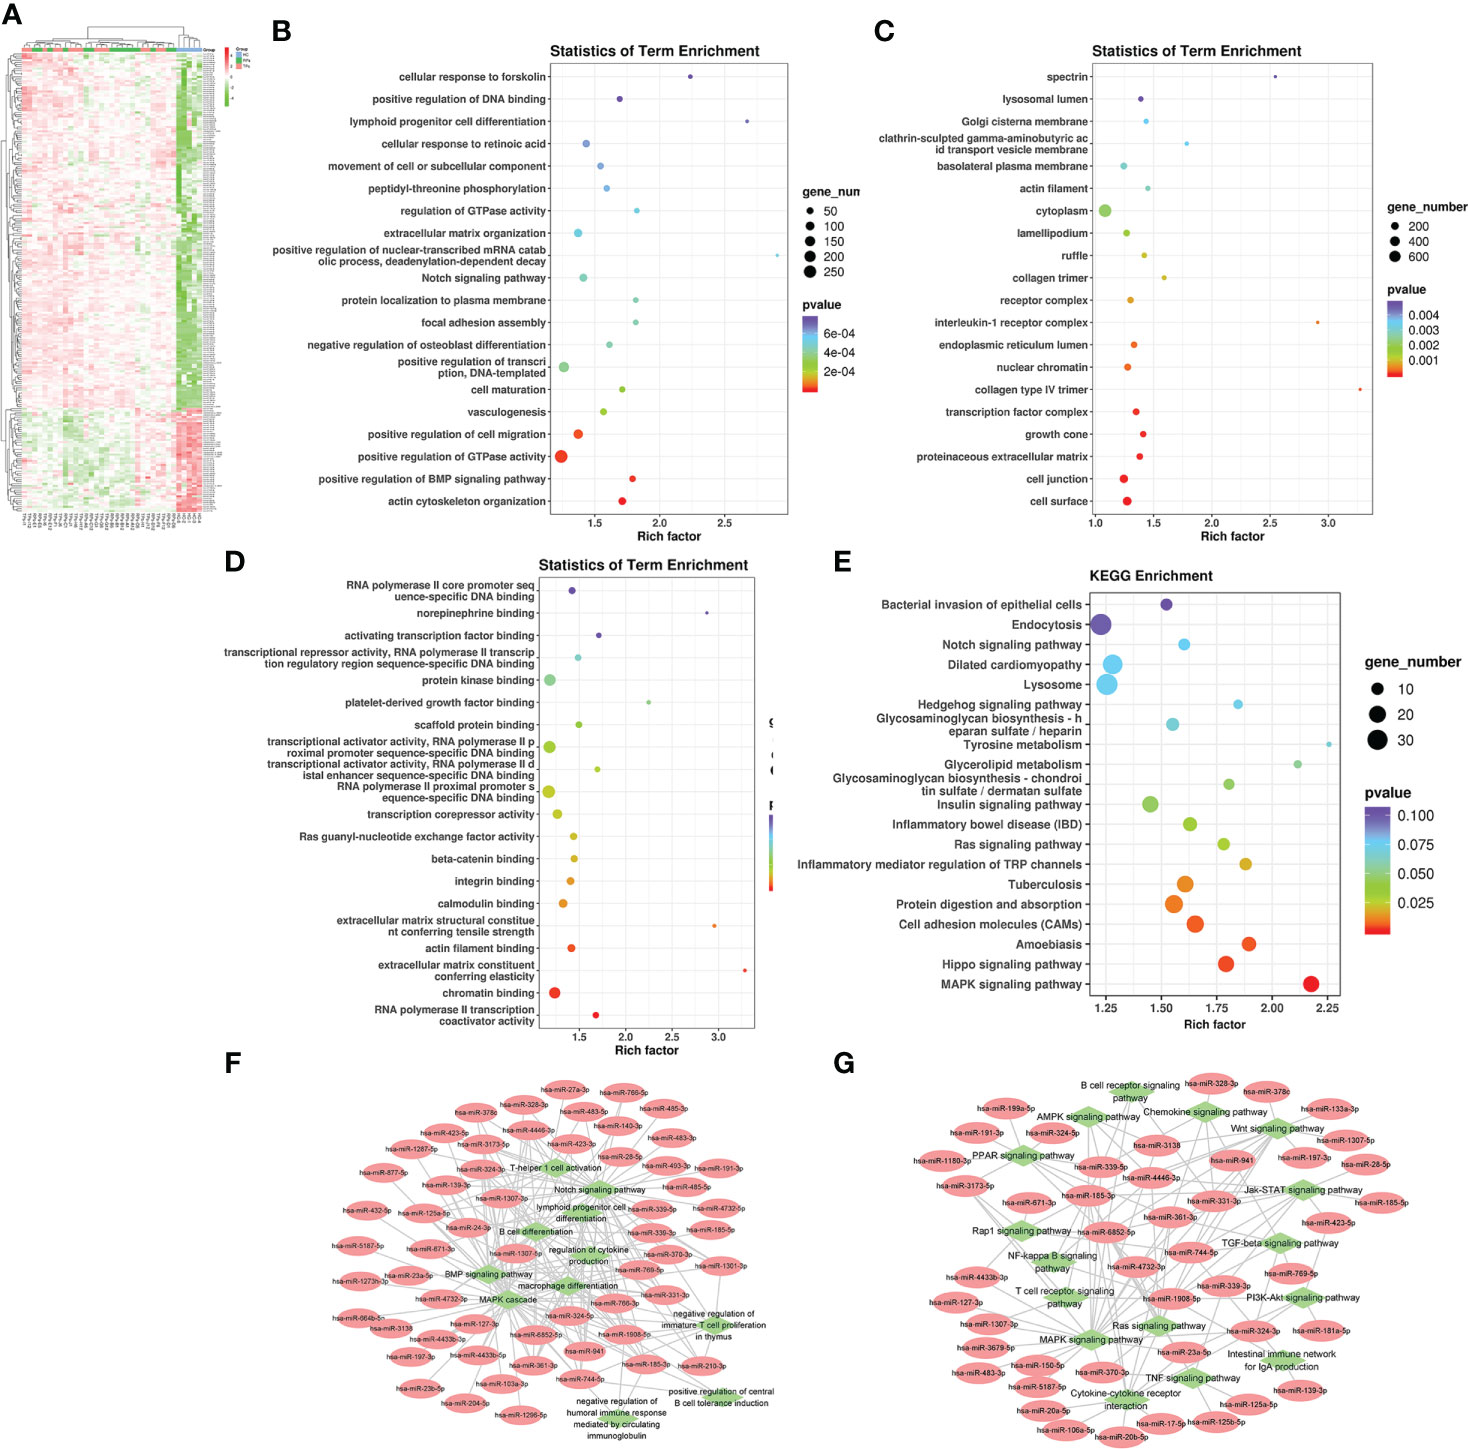
Figure 3 The analysis of differential HIV-specific miRNAs expression profile and their function. (A) The Cluster heatmap of the 208 differential exosomal miRNAs between HIV acute infected patients and HCs. (B-D) The GO terms interpretation for the functions of these 208 differential miRNAs. (E) The KEGG terms interpretation for the functions of these 208 differential miRNAs. (F) The miRNA target interaction regulatory network form GO terms. (G) The miRNA target interaction regulatory network form KEGG terms.
Based on KEGG analysis, glutamatergic synapse, MAPK signaling pathway, Ras signaling pathway, Hippo signaling pathway, and Insulin signaling pathway were the most common pathways (Figure 3E).
Then, we performed a function and signal pathway network diagram from the results of GO and KEGG to depict the function and signal pathway of differential miRNAs. From the GO BP network diagram, the results indicated these miRNAs were mainly involved in T cell differentiation, B cell differentiation, macrophage differentiation, Notch signal pathway, BMP signal pathway, and MAPK cascade (Figure 3F), while the KEGG network diagram indicated that these miRNAs mainly participate in B cell receptor, T cell receptor, Rap1 signal pathway and PPAR signal pathway (Figure 3G).
Multiple miRNAs were defined as HIV-development characteristic miRNAs
The analysis of differential miRNAs between TPs and RPs
Previous research indicated that exosomal miRNAs have a significant role in the pathogenesis of HIV (28). To further investigate the specific mechanism of HIV pathogenesis in acute infection, we conducted a differential centrifugation protocol to build 35 plasma exosome groups from 15 patients and conducted an extensive analysis of the full miRNA content by small RNA sequencing. Twenty miRNAs were differentially expressed in RPs vs. the TPs. Among those, 13 miRNAs were differentially expressed in these three groups; 2 miRNAs in the RPs vs. the TPs and RPs vs. HC; 2 miRNAs in the TPs vs. RPs and TPs vs. HC. MiR-125a-5p and miR-194-5p were up-regulated in TPs and HC while down-regulated in RPs. MiR-1299 and miR-15b-3p were up-regulated in TPs while down-regulated in RPs and HC (Figures 4A, B). Compared with RPs, miR-1299 and miR-133a-3p were significantly down-regulated in TPs, while miR-1180-3p was significantly down-regulated in TPs (Table 2).
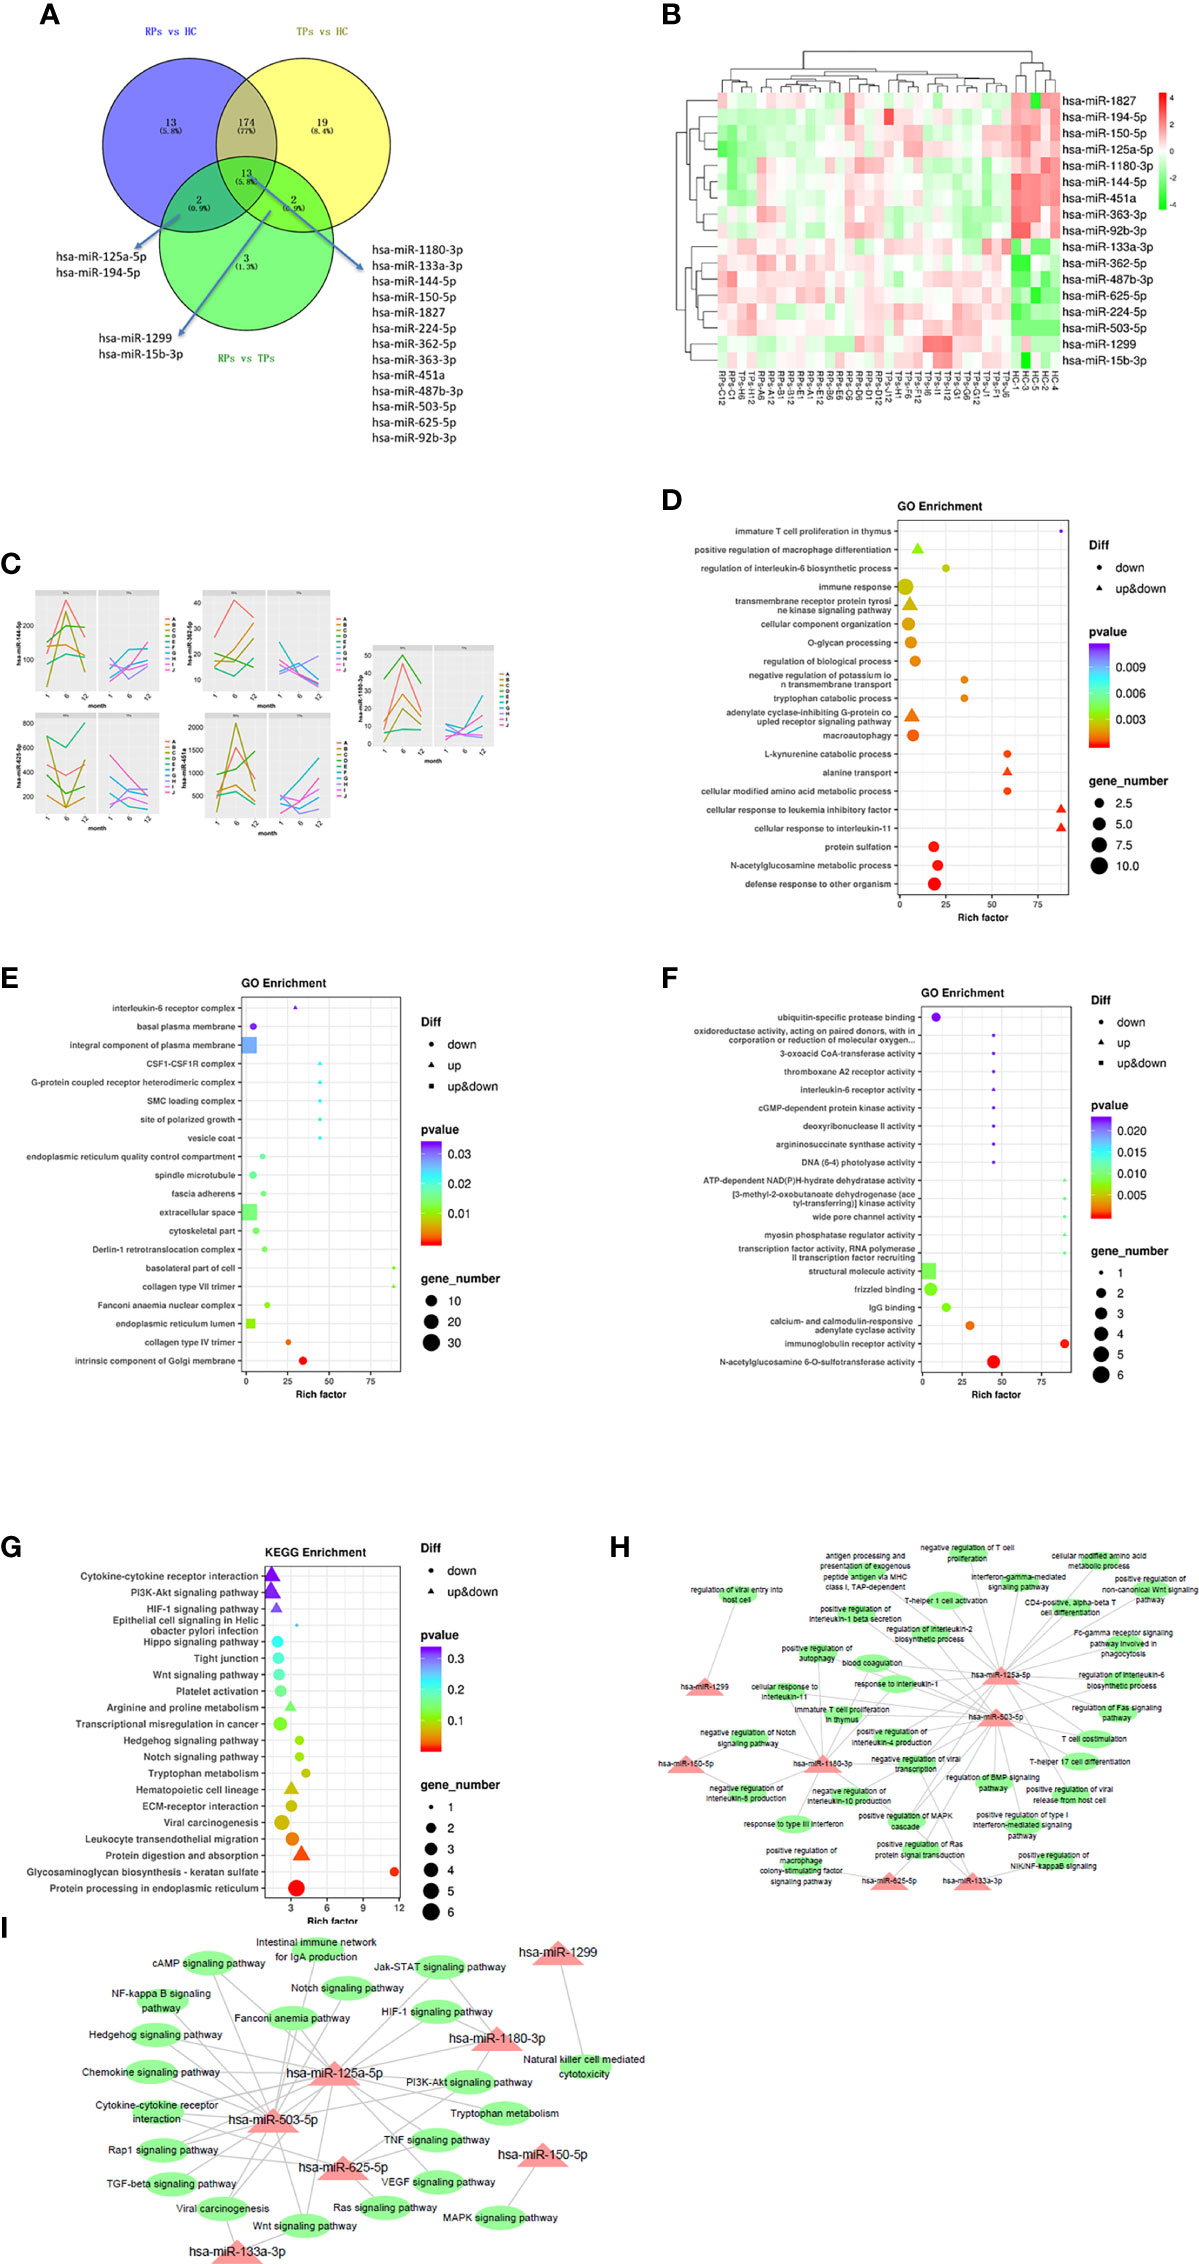
Figure 4 The analysis of key differential exosomal miRNAs and their variation tendency. (A) Venn plot showing differently expressed miRNAs between TPs and RPs at 1, 6, and 12 months. (B) The heatmap indicated 17 differently expressed miRNAs between RPs, TPs, and HC groups. (C) We depicted five miRNAs expression variations in TPs and RPs at 1, 6, and 12 months. (D–F) The GO terms interpretation for the functions of these 208 differential miRNAs. (G) The KEGG terms interpretation for the functions of these 208 differential miRNAs. (H) The miRNA target interaction regulatory network form GO terms. (I) The miRNA target interaction regulatory network form KEGG terms.
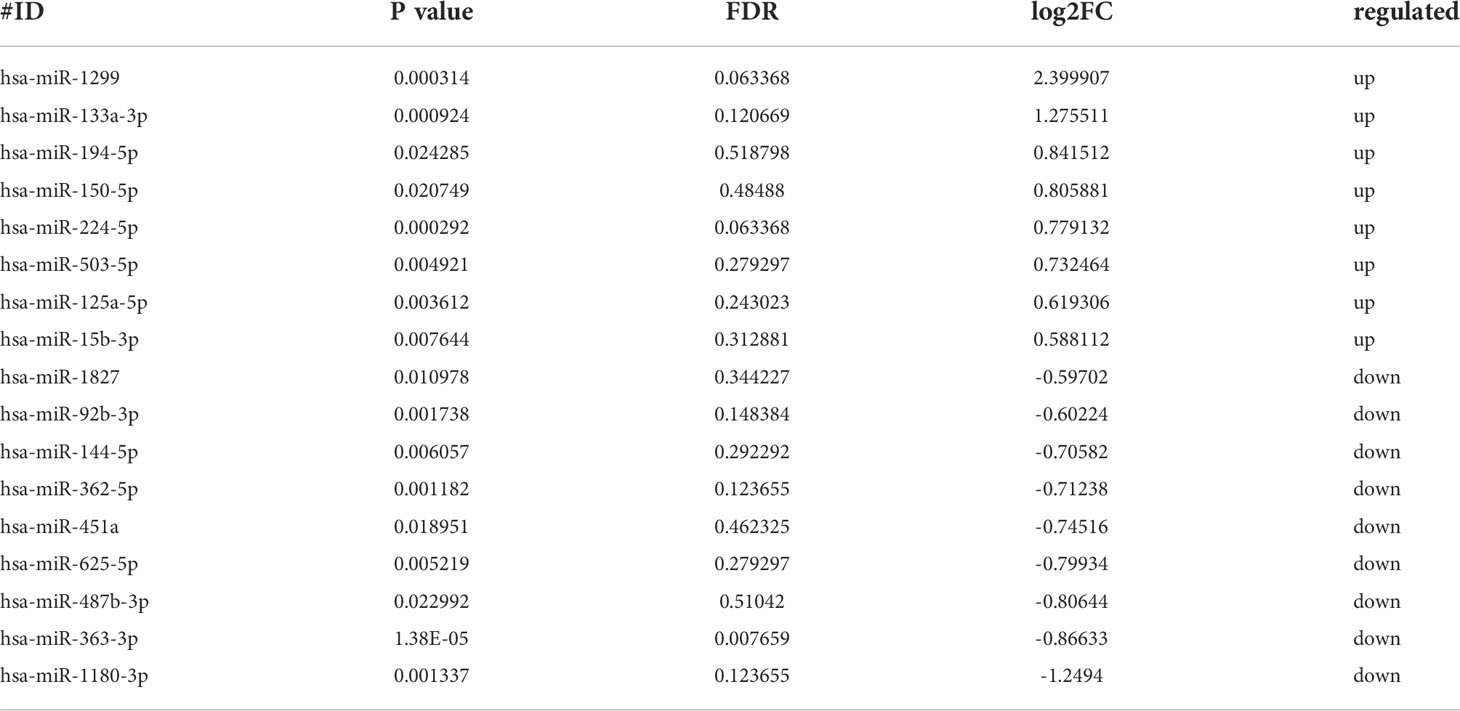
Table 2 Seventeen differential expression miRNAs.
A previous study indicated that the overexpression of miR-125a-5p is negatively associated with the macrophage-associated inflammatory response and may promote the M2 polarization of macrophages (29). MiR-150-5p is an immune-related miRNA that can activate T cells (30). Up-regulation of circRNA-0003528 can promote the TB-associated macrophage polarization by up-regulating the expression of CTLA4, and miR-224-5p is one of the ceRNAs in circRNA-0003528 (31). MiR-99b-3p is increased in the response of H. capsulatum (32). Furthermore, Wang et al found that the overexpression of miR-194-5P can enhance the production of interferon-gamma (IFN-γ) of CD8+ T cells (33). Also, Zhou et al indicated that the overexpression of miR-144-5p can reduce the viability of macrophages and inhibit the expression of TNF-alpha, IL-6, and IL-8, possibly by inhibiting the expression of TLR2 and suppressing the activation of NK-kappa B signaling (34). Another study indicated that the down-regulated miR-363-3p could promote the spread of the viral pathogen cytomegalovirus (35). Another study indicated that miR-362-5p is highly expressed in human peripheral blood NK (pNK) cells, and the overexpression of miR-362-5p can enhance the expression of IFN-γ perforin, granzyme-B, and CD107a in human primary NK cells (36).
MiR-451a in blood-circulating extracellular vesicles (Exosomes) can affect the innate immune responses of macrophages and dendritic cells (37). Specjalski and colleagues indicated that miR-625-5p could decrease cytokine secretion of Th1 cells (38). Qian et al found that overexpression of miR-625-5p can inhibit the secretion of IL-6 and TNF (39). Zhang et al found that miR-1299 can inhabit PD-L1 to enhance the immune system (40). Furthermore, Schiavinato et al indicated that miR-1299 could increase the percentage of FoxP3+ cells among CD4+CD25+/hi cells (41). These miRNAs are mainly involved in macrophage polarization, T cell activation, NK cell, IL-6, IL-8, and NK-kappa B signaling.
Next, miRNA sequencing was performed on the TPs and the RPs at 1, 6, and 12 months after virus infection (Figure 4C). In this study, we performed the former 17 differential miRNAs to depict images that change over time. Finally, 4 miRNAs with significant changes were selected. MiR-144-5p, miR-1180-3p, and miR-451a were gradually increased in the TPs group, while miR-362-5p and miR-625-5p were gradually down-regulated in the TPs group. In the RPs group, miR-362-5p was gradually increased. The remaining 12 miRNAs showed no obvious change trend (Figure S2).
Go and KEGG pathway enrichment analysis
Next, we performed the GO and KEGG enrichment analysis to explore the function of these miRNAs. Since strict requirements were applied for predicting the parameters of the target gene, only a few were found. GO BP term analysis indicated that RPs are characterized by a downregulated immune response, macroautophagy, defense response to other organisms, multiple amino acid metabolic changes, IL-6, and immature T cell proliferation in the thymus (Figure 4D). The GO CC term analysis further showed that these miRNAs are mainly involved in the IL-6 receptor complex, CSF1-CSF1R complex, and G-protein coupled heterodimeric receptor complex (Figure 4E). The GO MF term analysis indicated that miRNAs are mainly involved in IL-6 receptor activity, ubiquitin-specific protease binding, and cGMP-dependent protein kinase activity (Figure 4F). The KEGG analysis revealed that RPs are characterized by downregulation in Hippo, Wnt, Hedgehog, Notch, Tryptophan metabolism, Glycosaminoglycan biosynthesis-keratin sulfate, and protein processing in the endoplasmic reticulum (Figure 4G).
Consequently, we performed a miRNA target interaction regulatory network to depict the functions of miRNAs (Figures 4H, I). From the network diagram, in innate immunity, these miRNAs mainly involved cytokine, interferon, chemokine, and macrophage differentiation. In adaptive immunity, they mainly involved T cells. The main involved pathways included Notch, BMP, MAPK, Wnt, Hedgehog, HIF-1, PI3K-Akt, NF-kappa B, TGF-beta, Jak-STAT, Ras, and TNF signal pathways.
IL-6 is a prototypical cytokine highly correlated with inflammation and immune responses (42). A recent clinical trial indicated a higher level of IL-6 in AIDS-Kaposi’s sarcoma group compared to HIV individuals (43). In this study, IL-6 had higher expression in RPs group compared with the TPs group, which further suggested that elevated IL-6 may be an indicator of poor disease prognosis.
Identification of the hub genes related to different HIV disease progression statuses by weighted gene co-expression network analysis (WGCNA)
To identify the different progression of AIDS status, WGCNA was performed based on 35 participants. First, after deleting the outliers, the sample dendrogram and trait heatmap were built (Figure 5A). Second, the best soft threshold power (β) was selected as 4 to build the scaleless network (Figure 5A). Third, seven modules were identified by average hierarchical clustering and dynamic tree clipping (Figure 5B). Then, the merged module tree was constructed to express a better result (Figure 5C). The brown and blue modules were highly related to the progression of HIV (p<0.05); thus, these two modules were selected as clinically significant modules for further research (Figure 5D).
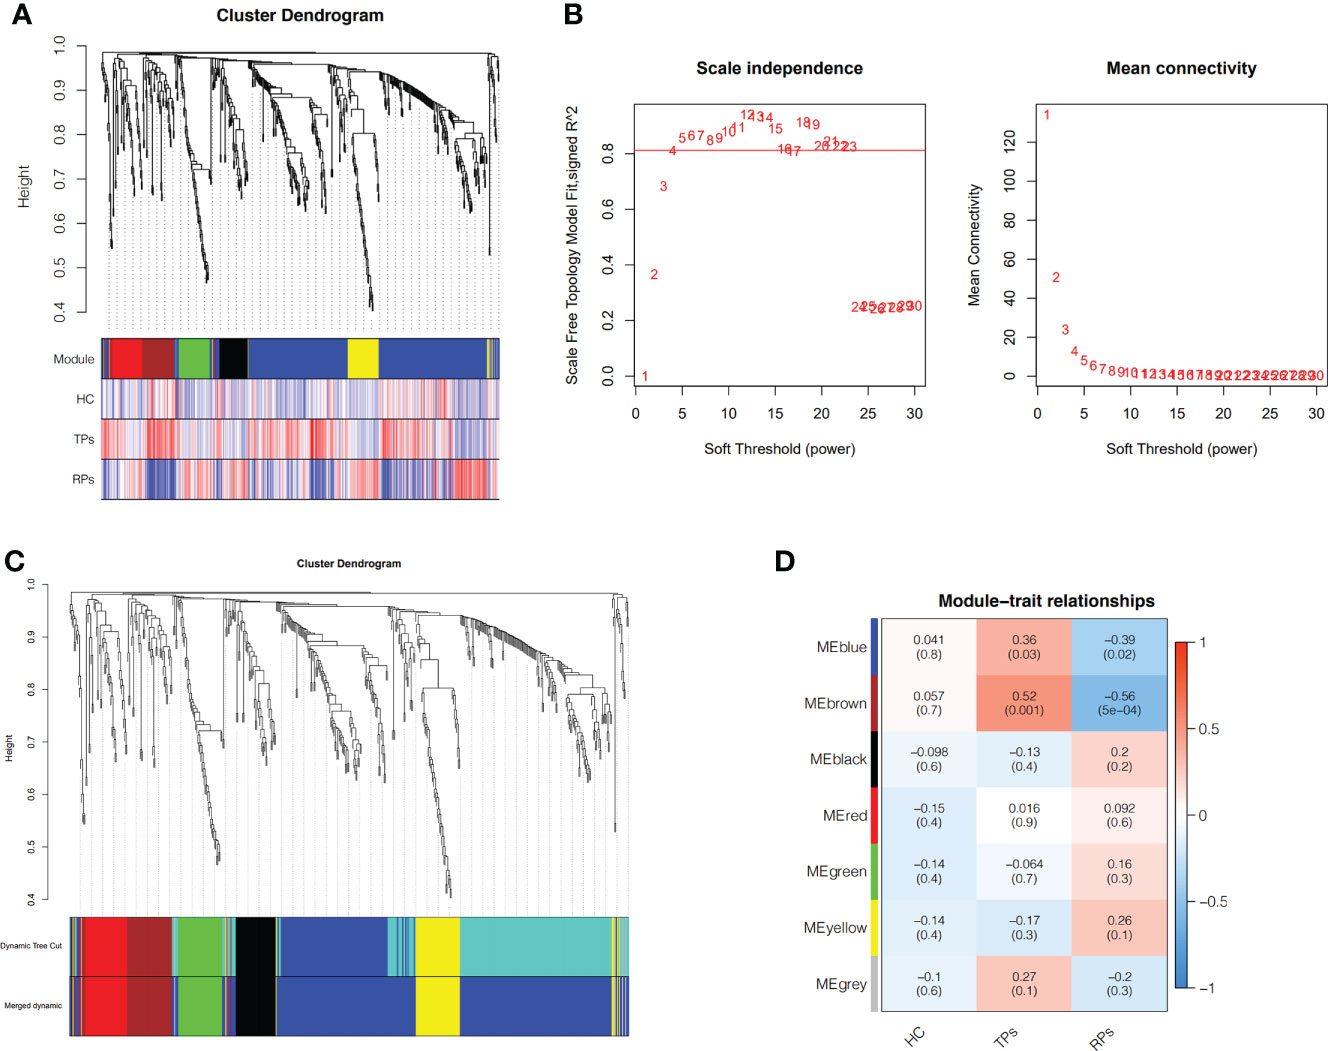
Figure 5 Weighted Co-Expression Network Construction and identification of key modules. (A) Clustering dendrogram of 35 samples with trait heatmap. (B) Determination of soft-threshold power in the WGCNA. (C) Merged module tree of miRNAs, with dissimilarity based on the topological overlap, together with assigned module colors. (D) Heatmap of the correlation between the module eigengenes and clinical traits of HIV. Brown and blue modules were selected for further analysis.
Enrichment analysis of GO and KEGG in the brown module
In this study, we performed an enrichment analysis of biological significance in the brown module. As seen in Figure 6A, the BP indicated that miRNAs were mainly associated with glycoprotein and amino acid metabolic changes, innate immunity (cytokines, interferons, chemokine, dendritic cells, and macrophages), and adaptive immunity (B cells, T helper cells, and NK cells). As seen in Figure 6B, the CC showed that these miRNAs were found in the cytosol, nucleolus, endoplasmic reticulum membrane, and cell conjunction. In addition, the MF suggested that these miRNAs regulate metal ion binding, DNA transcription factor activity, identical protein binding, RNA polymerase II proximal promoter sequence-specific DNA binding, and ubiquitin-protein ligase binding (in Figure 6C). Moreover, the KEGG indicated that these miRNAs participate in the PI3K-Akt signaling pathway, MAPK signaling pathway, RAS signaling pathway, cAMP signaling pathway, and cGMP-PKG signaling pathway (in Figure 6D).
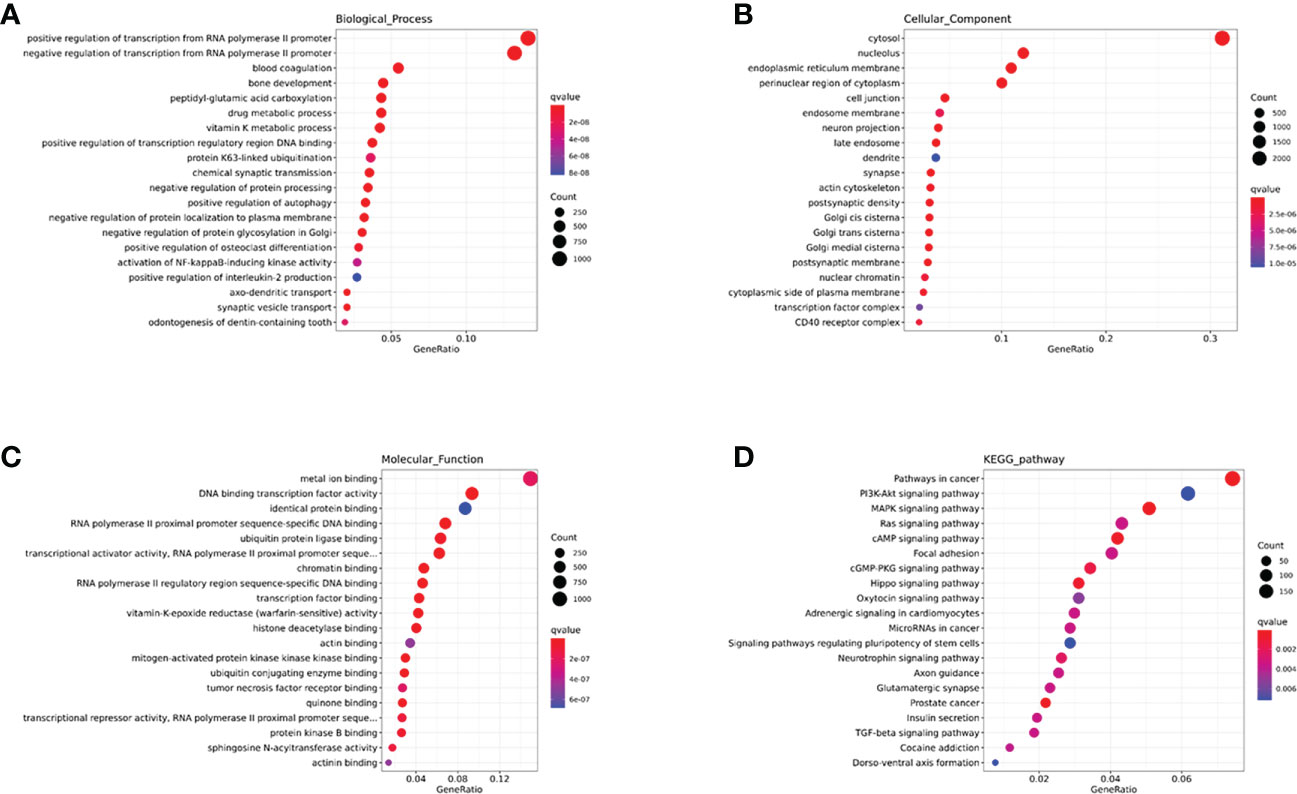
Figure 6 The GO and KEGG enrichment analysis interpretation for the functions of the brown module. (A-C) The GO terms interpretation for the functions of these 208 differential miRNAs. (D) The KEGG terms interpretation for the functions of these 208 differential miRNAs.
Enrichment analysis of GO and KEGG in the blue module
As seen in Figure 7A, the BP indicated that miRNAs are mainly associated with fatty acid metabolism, regulation of viral protein levels in host cells by viruses, innate immunity (cytokines, interferons, chemokine, dendritic cells, and macrophages), and adaptive immunity (B cells, T cells, and NK cells). As seen in Figure 7B, the CC showed that these miRNAs are found in the cytosol, nucleoplasm, cytoplasm, integral component of the plasma membrane, Golgi apparatus, and cell conjunction. In addition, the MF indicated that these miRNAs regulate metal ion binding, ATP binding, DNA binding transcription factor activity, RNA polymerase II proximal promoter sequence-specific DNA binding, and chromatin binding (Figure 7C). Moreover, the KEGG showed that these miRNAs participate in the MAPK signaling pathway, focal adhesion, cAMP signaling pathway, Rap1 signaling pathway, and calcium signaling pathway (Figure 7D).
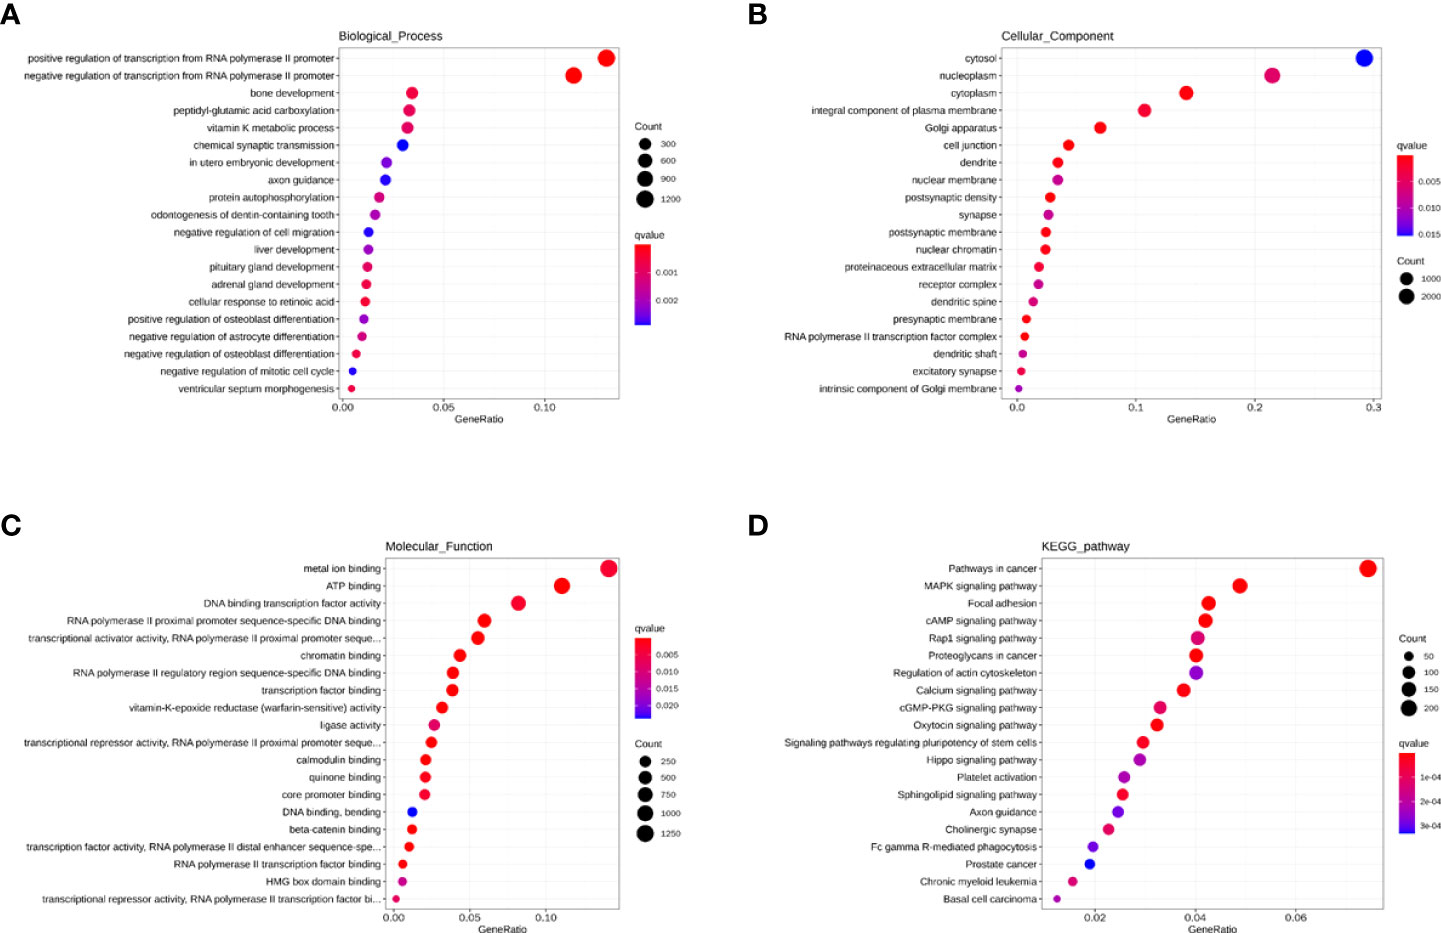
Figure 7 The GO and KEGG enrichment analysis interpretation for the functions for the blue module. (A–C) The GO terms interpretation for the functions of these 208 differential miRNAs. (D) The KEGG terms interpretation for the functions of these 208 differential miRNAs.
The transcription factors of brown and blue module
Transmit v 2.0 database was used to predict the transcription factors (TFs) of the 15 hub genes, and a network diagram of miRNAs interaction with TFs was constructed. A total of 11 TFs were selected in the brown module with the most significant TF: SP1 (Figure 8A) and 2 TF were selected in the blue module with the most significant TFs: CEBPB and MAZ (Figure 8B), and the selected criterion was P<0.05. There were 15 key miRNAs in the brown module; SP1 regulated 10 miRNAs with the most significant P-value. There were 42 key miRNAs in the blue module; CEBPB regulated 20 miRNAs, and MAZ regulated 26 miRNAs with the most significant P-value.
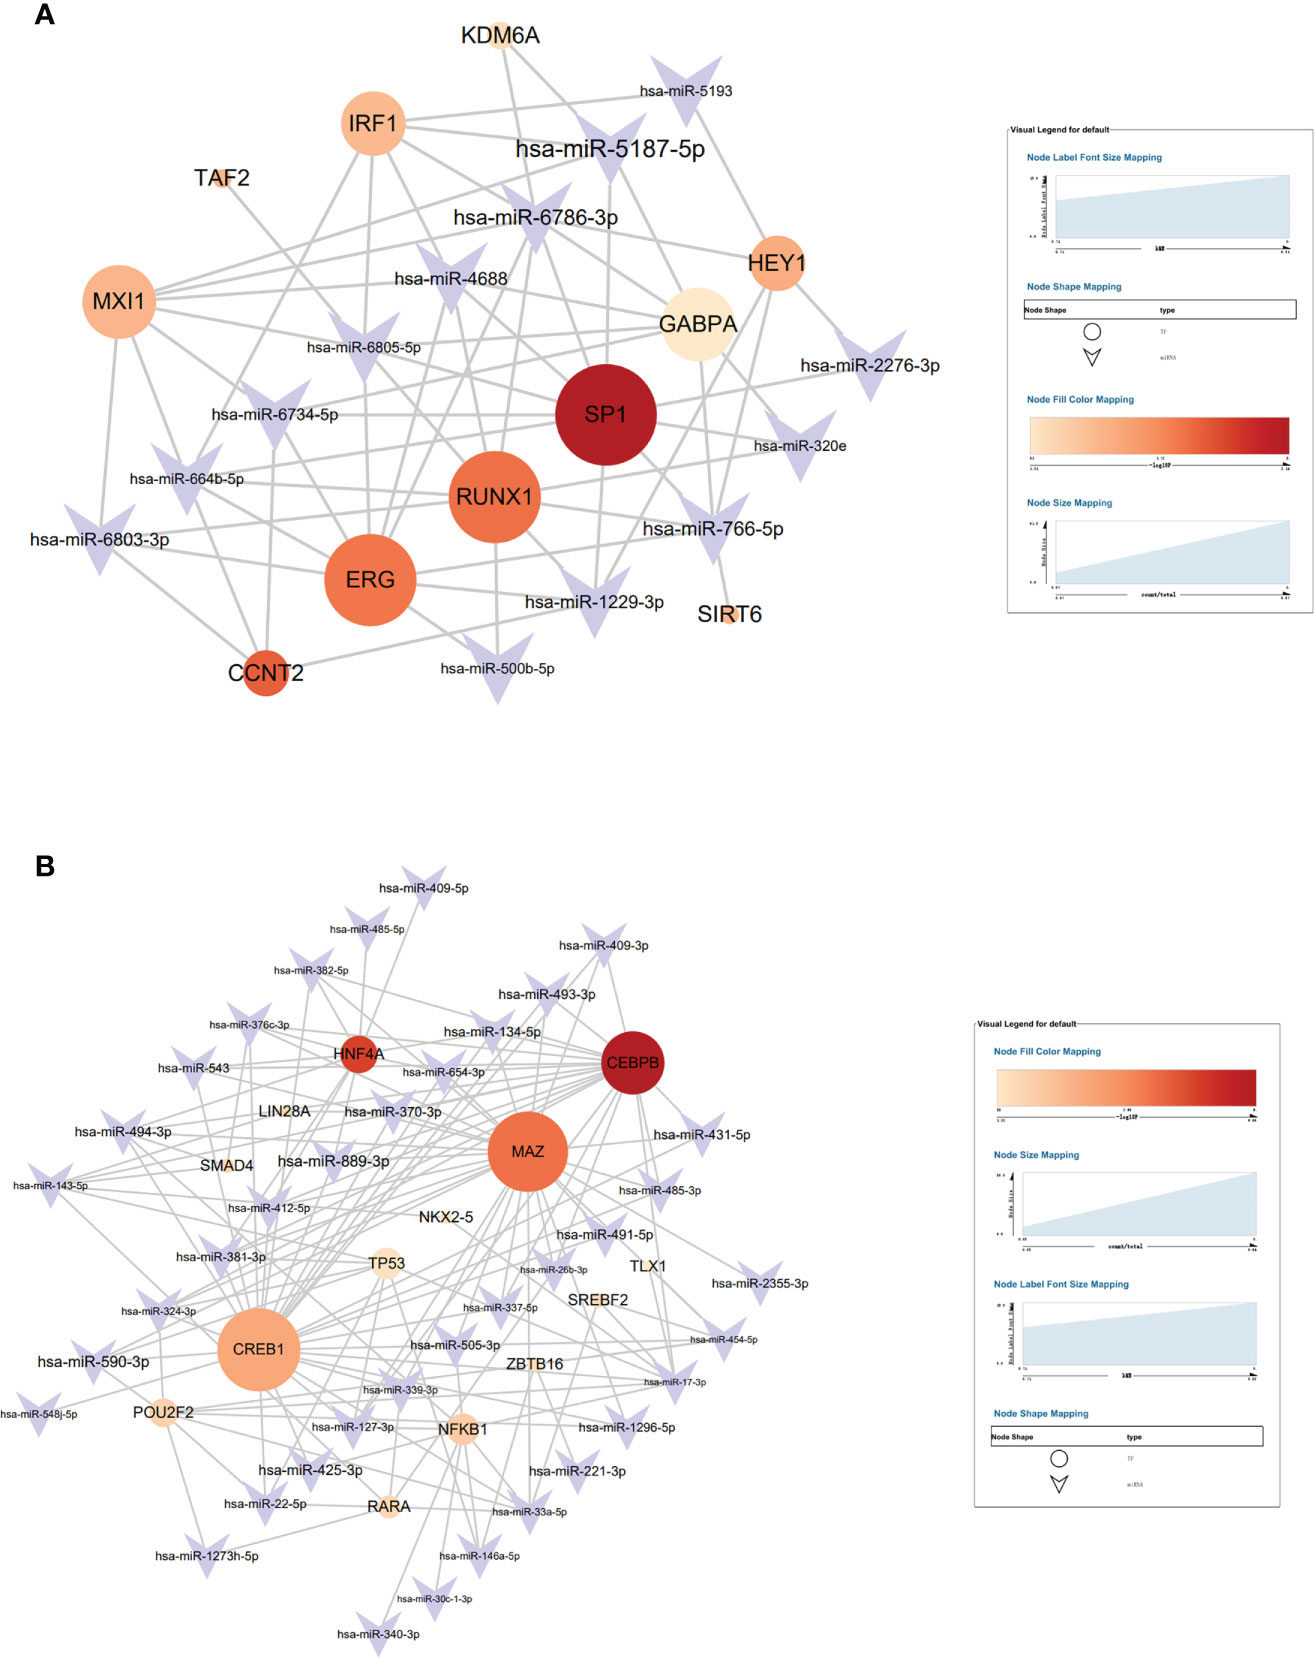
Figure 8 The target interaction regulatory network diagram of transcriptional factors (TF) and miRNAs of the brown module (A) and blue module (B).
SP1, which is found in nearly all mammalian cell types, belongs to the strong SP/KLF family of transcription factors (44). Hotter et al indicated that IFN-inducible PYHIN protein IFI16 could reduce transcription factor Sp1 to inhabit HIV transcription (45). RUNX1 belongs to the core-binding factor family of transcription factors and is indispensable for establishing hematopoiesis in vertebrates (46). Chen et al found that lncRNA uc002yug.2 can downregulate RUNX1b and -1c to activate latent HIV-1 (47). Furthermore, ERG (ETS-Related Gene) belongs to E-twenty-six (ETS) specific factors, which is a family of more than 20 helix–loop–helix domain transcription factors (48). Studies have revealed that ERG is involved in megakaryopoiesis and T-cell development (49–52). CCAAT/enhancer-binding protein β (CEBPB) is a member of transcription factors that regulates the gene expression of immune and inflammation (53). CEBPB-deficient myeloid progenitor cells cannot produce sufficient monocytes and granulocyte-like colonies, which reduces the immune reaction (54). A previous study indicated that Myc-associated zinc finger protein (MAZ) has a significant role in immune regulation (55). Transcription factor CREB1 is related to the activation of DCs and can promote DCs to produce cytokine (56). In their study, Alantomalka et al indicated that CREB1 might promote CD4+T cells and B cells to the site of antigen presentation (57).
The correlation between differential exosomal membrane proteins and miRNAs expression
Different exosomes membrane protein expressions in the 3 groups
Mass cytometry was used to screen differential membrane proteins in the TPs and RPs. Exosomes surface proteins CD49D, CD5, CCR5, CD40, CD14, and CD86 were all higher in TPs than in RPs (Figure 9) (all p<0.001).
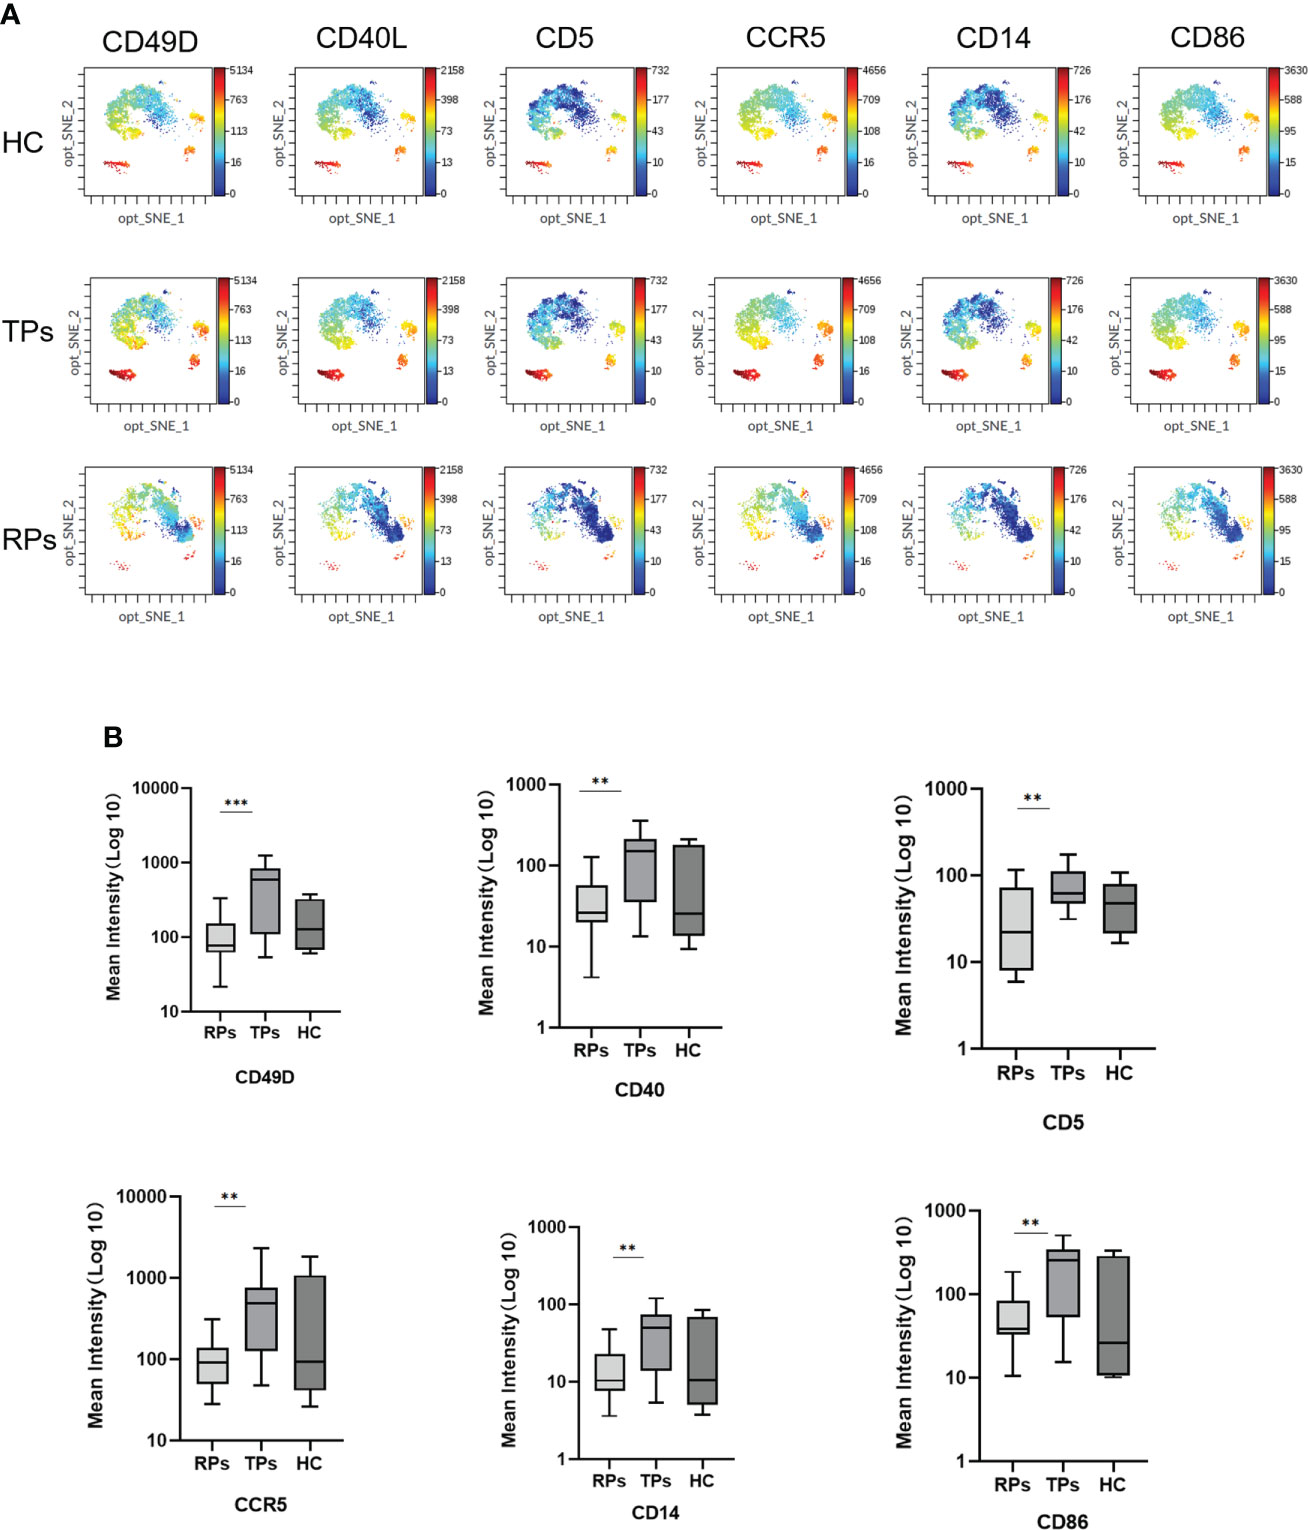
Figure 9 The mean intensity of six differential Exosomes membrane biomarkers. (A) The result of mass cytometry. (B) Quantification of the mean intensity. **p < 0.01, ***p < 0.001.
CD49D belongs to the family of integrin alpha subunits. In humans, the CD49D is associated with either CD29 or beta7 integrin and is mainly expressed in leukocytes (58). CD5 is majorly expressed in the T cell line and newborn B cells. CD5 positivity in B-cell lymphoproliferative disorders (LPD) is usually considered characteristic of chronic lymphocytic leukemia or mantle cell lymphoma (59). CCR5 is a cell membrane protein of a member of the G protein coupling factor superfamily (GPCR), expressed in multiple types of cells, and one of the main co-receptors for HIV-1 to invade the body’s cells. Besides, CCR5 can take part in the activation of T cells, so it exerts the normal function in the immune system (60).
CD14 is generally expressed in monocytes, macrophages, granulocytes, and dendritic cells (DCs). After lipopolysaccharide (LPS) or gram-negative bacteria enter the blood circulation, they bind to LPS-binding protein (LBP) to form an LPS/LBP complex. The LPS/LBP complex is then recognized and bound by mCD14 on the surface of monocytes (61). A previous study indicated that CD14 is a pattern recognition receptor (PRR) that enhances innate immune responses (61).
CD40 belongs to the costimulatory member of the tumor necrosis factor receptor (TNFR) superfamily. The interactions of B cell-expressed CD40 and its binding partner CD40L are mainly expressed in activated CD4+T cells, which have a significant role in promoting the germinal center formation and the production of class-switched antibodies (62). CD40 is also expressed in mature B cells, monocytes, Th cells, and dendritic cells. In Th cells, it can combine with CD40L and further co-stimulate B cell activation (62).
CD86 is expressed in professional antigen-presenting cells and can combine with CD28 to co-stimulate naïve T cells (63).
The correlation between the exosomes surface proteins and miRNAs
In this study, we used p<0.05 and r>0.6 or r<0.6 as inclusion criteria to select the correlation between the membrane proteins and miRNAs. We filtered out low-expressed miRNAs and used high-expressed miRNAs to conduct correlation analysis with membrane proteins. Our results showed that some miRNAs are significantly positively correlated with membrane proteins, suggesting they have the same cell origin. For example, miRNA 142-3p was correlated with CD14, CD40, CD49D, CD66B, CD80, CD86, and MHC II; miR-19a-3p, miR-19b-3p, miR-148b-3p and miR-425-5p were correlated with CD49D (Figure 10A). CD66B is mainly expressed on neutrophils; its main functions are involved in cell adhesion and neutrophil activation (64, 65). CD80 is an essential membrane antigen for T lymphocyte activation. CD80 on the tumor is considered an essential part of antitumor CTL effector function (66). The distribution of MHC II is relatively limited, and they are mainly expressed on antigen-presenting cells such as B cells, monocytes-macrophages, and dendritic cells, and CD4+ T cells can only recognize antigen fragments bound by MHC II (67).
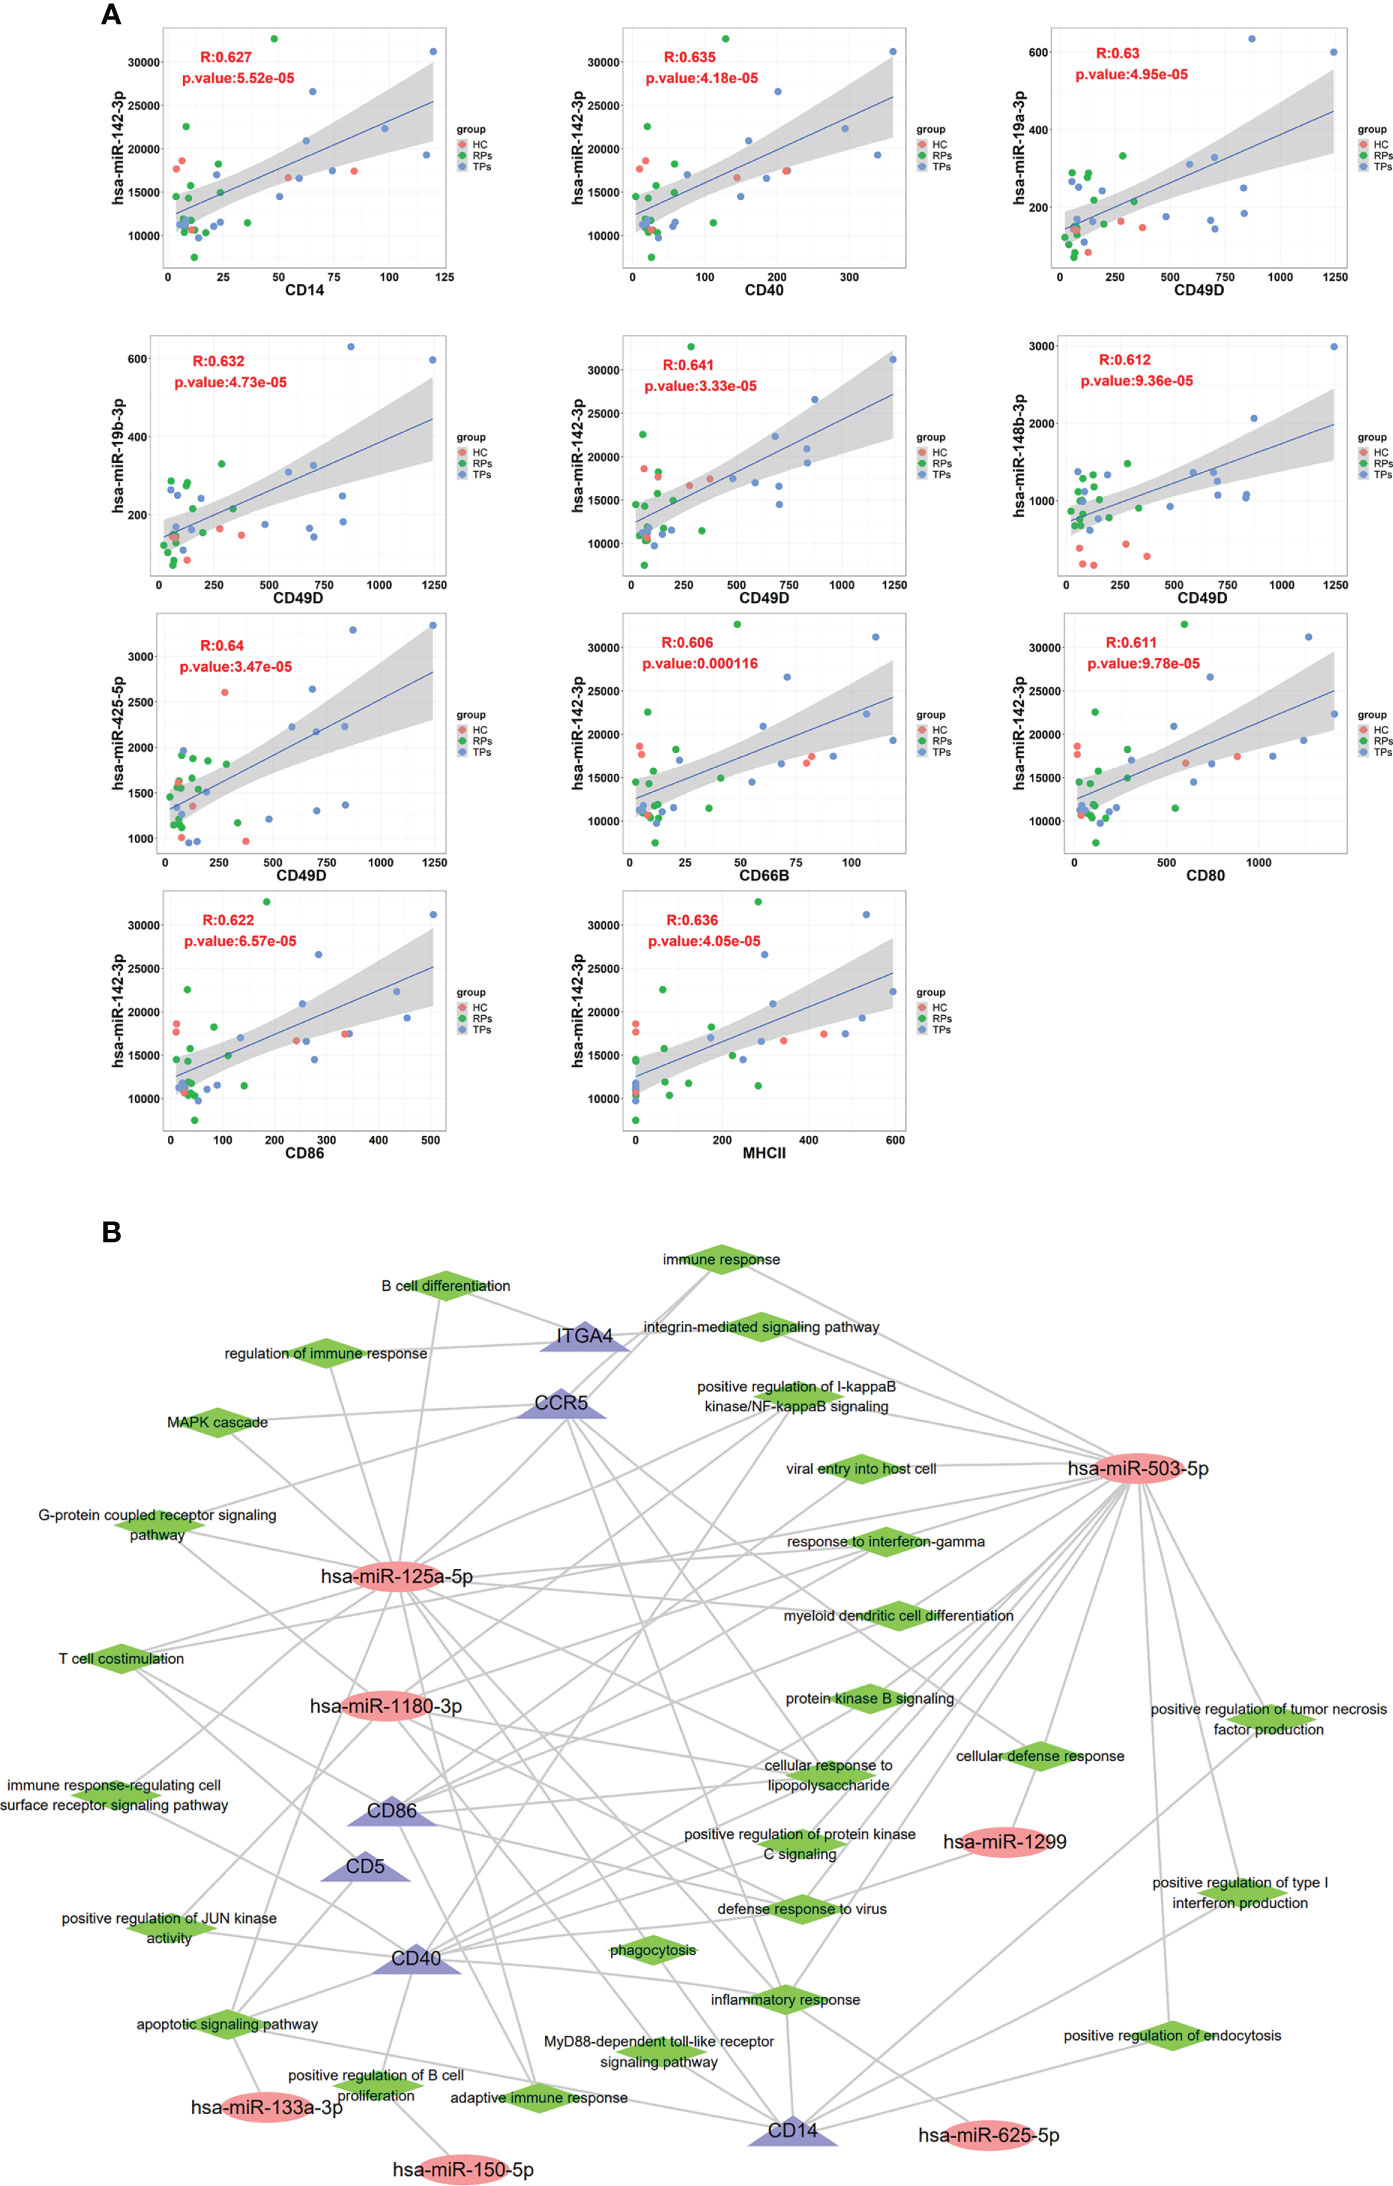
Figure 10 The correlation between exosome surface proteins and miRNAs. (A) The scatter plot of exosome surface proteins and miRNAs. (B) Exosomal miRNAs and surface proteins target the interaction regulatory network diagram.
A previous study indicated that the overexpression of miR-142-3p can induce M2 macrophages apoptosis by transforming the growth factor-beta signaling pathway (68). Another study showed that miR-19a-3p could inhibit M1 macrophage polarization by suppressing the STAT1/IRF1 pathway (69). Lv et al. indicated exosomes miR-19b-3p could induce M1 macrophage polarization via NF-kappa B/SOCS-1 (70). Wang and colleagues indicated that exosomes miR-425-5p could activate PI3K/Akt signaling pathway to regulate PTEN and then induce M2 polarization of macrophages (71).
Finally, we performed an exosomes miRNA and surface protein target interaction regulatory network diagram to depict the function of miRNA and member proteins (Figure 10B). CD86, CD5, CD40 and CCR5 were highly correlated with miR-125a-5p, miR-1180-3p and miR-503-5p. In innate immunity, these miRNAs and member proteins are mainly involved in positive regulation of the production of type 1 interferon, interferon-γ, and inflammation response. In adaptive immunity, miRNAs are mainly involved in T cell costimulation, B cell differentiation, and positively regulating B cell proliferation. The key pathways include the integrin-mediated signaling pathway, positive regulation of NF-kappa B, MAPK cascade, G-protein coupled receptor, immune response-regulating cell surface receptor, JUN kinase, apoptotic, MyD88-dependent toll-like receptor, and positive regulation of protein kinase B and C.
Discussion
Recently studies demonstrated that exosomes have a significant role in HIV pathology by regulating viral assembly and outflow pathways of HIV (72). Exosomes can transport viruses from infected to uninfected cells and further regulate the host’s immune response to infection (73, 74). Furthermore, exosomes can transmit disease-related products and affect the outcome of virus infections (75). Garcia-Martin et al. found that miRNAs in exosomes have tissue- or cell type-specific enrichment signatures and that exosomal member proteins can be used to trace the source of tissues or cells (76). However, so far, only a few studies have performed comprehensive exosomal miRNAs and member proteins analysis in HIV patients. Herein, we performed exosomal miRNAs sequencing and mass spectrometry to select the hub specificity exosomal miRNAs and surface protein in the progression of the RPs and the TPs, and we further explored their function.
In this study, the peak size of exosomes was gradually increased from 1 month to 12 months of HIV infection and also gradually increased from HC to TPs to RPs (Figure 2G), further suggesting that the peak size of exosomes may be a new marker to evaluate the progression of this disease. Moreover, by comparing the function of differential miRNAs in HC and acute HIV-infected patients, the change mainly involved cytokines, chemokines, macrophage differentiation, an intestinal immune network for IgA production, and B and T cells activity. The main pathways involved include Notch, BMP, AMPK, TGF-beta, Ras, MAPK, and TNF signal pathways. Our data suggested that decreased autophagy, amino acid metabolism, immune response, and IL-6 may be key factors associated with RPs. The function of progression in RPs and TPs related miRNA was mainly concerned with T cells, M2 macrophages, and NK cells. WGCNA was performed to select hub modules; 3 TFs (SP1, RUNX1, and ERG) were selected in the brown module and 3 TFs (CEBPB, MAZ, and CREB1) in the blue module.
Next, mass spectrometry was performed to search for the member proteins of exosomes. Next, we studied the correlation between exosome surface proteins and miRNAs. Totally six differential exosome surface proteins (CD49D, CD40, CD5, CCR5, CD14, and CD86) were identified by mass spectrometry. miRNA-142-3p was correlated with CD14, CD40, CD49D, CD66B, CD80, CD86, CD63, and MHC II; miR-19a-3p, miR-19b-3p, miR-148b-3p and miR-425-5p were correlated with CD49D. Former exosomal miRNAs were proven to be correlated with T cells and M2 macrophages, and the member proteins are mainly correlated with T cells. The infected T cells release exosomal miRNAs to affect T cells, and M2 macrophages could be the underlying mechanism. MiRNAs and proteins network show NF-kappaB signal may be the potential pathway to affect the different progression of acute HIV-infected people.
The present study has some limitations. Only bioinformatics analysis was used to examine exosomal miRNAs sequencing data and exosome surface protein. Further studies should include cell and animal experiments.
This study provides a comprehensive analysis of two different patterns of HIV progression. Our results indicated that disease-related TF has a significant role in HIV transcription alteration, metabolic alteration, innate immunity alteration, and adaptive immunity alteration. Also, disease-related miRNAs have a significant role in metabolic alteration, innate immunity, and adaptive immunity alteration, while disease-related proteins expressed in the exosome outer membrane may provide a new mechanism for clarifying the progression of acute HIV infection.
Data availability statement
The datasets presented in this study can be found in online repositories. The name of the repository and accession number can be found below: NCBI Sequence Read Archive, PRJNA838770.
Ethics statement
This study was approved by the Ethics Committee (seal) of Beijing Youan Hospital, Capital Medical University. Written informed consent was obtained from each subject in accordance with the Declaration of Helsinki.
Author contributions
XL, WW and JC contributed equally to this work. WL and XL designed the experiment and wrote the manuscript. LW and CL conceived the idea and performed data analysis. JC, CC and XL conducted experiments. SL and DC revised the manuscript. All authors contributed to the article and approved the submitted version.
Funding
This work was supported by the Natural Science Foundation of Beijing (7212172), High-level Public Health Technical Talents of Beijing(2022-2-024), National Natural Science Foundation of China(81603552), Pilot Project of Public Welfare Development and Reform of Beijing Municipal Medical Research Institutes (2019-6).
Acknowledgments
Hongyu Liu provided helpful comments for this article.
Conflict of interest
The authors declare that the research was conducted in the absence of any commercial or financial relationships that could be construed as a potential conflict of interest.
Publisher’s note
All claims expressed in this article are solely those of the authors and do not necessarily represent those of their affiliated organizations, or those of the publisher, the editors and the reviewers. Any product that may be evaluated in this article, or claim that may be made by its manufacturer, is not guaranteed or endorsed by the publisher.
Supplementary material
The Supplementary Material for this article can be found online at: https://www.frontiersin.org/articles/10.3389/fimmu.2022.939504/full#supplementary-material
References
1. Fisher JD, Fisher WA. Changing AIDS-risk behavior. Psychol Bull (1992) 111:455–74. doi: 10.1037/0033-2909.111.3.455
2. Sharp PM, Hahn BH. Origins of HIV and the AIDS pandemic. Cold Spring Harb Perspect Med 1 (2011) 1(1):a006841. doi: 10.1101/cshperspect.a006841
3. Nyamweya S, Hegedus A, Jaye A, Rowland-Jones S, Flanagan KL, Macallan DC. Comparing HIV-1 and HIV-2 infection: Lessons for viral immunopathogenesis. Rev Med Virol (2013) 23:221–40. doi: 10.1002/rmv.1739
4. Zhao G, Perilla JR, Yufenyuy EL, Meng X, Chen B, Ning J, et al. Mature HIV-1 capsid structure by cryo-electron microscopy and all-atom molecular dynamics. Nature (2013) 497:643–6. doi: 10.1038/nature12162
5. Gao F, Bailes E, Robertson DL, Chen Y, Rodenburg CM, Michael SF, et al. Origin of HIV-1 in the chimpanzee pan troglodytes troglodytes. Nature (1999) 397:436–41. doi: 10.1038/17130
6. Flynn NM, Forthal DN, Harro CD, Judson FN, Mayer KH, Para MF. Placebo-controlled phase 3 trial of a recombinant glycoprotein 120 vaccine to prevent HIV-1 infection. J Infect Dis (2005) 191:654–65. doi: 10.1086/428404
7. Pitisuttithum P, Gilbert P, Gurwith M, Heyward W, Martin M, van Griensven F, et al. Randomized, double-blind, placebo-controlled efficacy trial of a bivalent recombinant glycoprotein 120 HIV-1 vaccine among injection drug users in Bangkok, Thailand. J Infect Dis (2006) 194:1661–71. doi: 10.1086/508748
8. Iaccino E, Schiavone M, Fiume G, Quinto I, Scala G. The aftermath of the merck’s HIV vaccine trial. Retrovirology (2008) 5:56. doi: 10.1186/1742-4690-5-56
9. Gray GE, Allen M, Moodie Z, Churchyard G, Bekker LG, Nchabeleng M, et al. Safety and efficacy of the HVTN 503/Phambili study of a clade-b-based HIV-1 vaccine in south Africa: a double-blind, randomised, placebo-controlled test-of-concept phase 2b study. Lancet Infect Dis (2011) 11:507–15. doi: 10.1016/S1473-3099(11)70098-6
10. Hammer SM, Sobieszczyk ME, Janes H, Karuna ST, Mulligan MJ, Grove D, et al. Efficacy trial of a DNA/rAd5 HIV-1 preventive vaccine. New Engl J Med (2013) 369:2083–92. doi: 10.1056/NEJMoa1310566
12. Chen R, Xu X, Tao Y, Qian Z, Yu Y. Exosomes in hepatocellular carcinoma: a new horizon. Cell Commun Signal (2019) 17:1. doi: 10.1186/s12964-018-0315-1
13. Roma-Rodrigues C, Raposo LR, Cabral R, Paradinha F, Baptista PV, Fernandes AR. Tumor microenvironment modulation via gold nanoparticles targeting malicious exosomes: implications for cancer diagnostics and therapy. Int J Mol Sci 18 (2017) 18(1):162. doi: 10.3390/ijms18010162
14. Li X, Li C, Zhang L, Wu M, Cao K, Jiang F, et al. The significance of exosomes in the development and treatment of hepatocellular carcinoma. Mol Cancer (2020) 19:1. doi: 10.1186/s12943-019-1085-0
15. Png KJ, Halberg N, Yoshida M, Tavazoie SF. A microRNA regulon that mediates endothelial recruitment and metastasis by cancer cells. Nature (2011) 481:190–4. doi: 10.1038/nature10661
16. Gee HE, Camps C, Buffa FM, Colella S, Sheldon H, Gleadle JM, et al. MicroRNA-10b and breast cancer metastasis. Nature (2008) 455:E8–9. doi: 10.1038/nature07362
17. Tay Y, Zhang J, Thomson AM, Lim B, Rigoutsos I. MicroRNAs to nanog, Oct4 and Sox2 coding regions modulate embryonic stem cell differentiation. Nature (2008) 455:1124–8. doi: 10.1038/nature07299
18. Kota J, Chivukula RR, O’Donnell KA, Wentzel EA, Montgomery CL, Hwang HW, et al. Therapeutic microRNA delivery suppresses tumorigenesis in a murine liver cancer model. Cell (2009) 137:1005–17. doi: 10.1016/j.cell.2009.04.021
19. Ma L, Teruya-Feldstein J, Weinberg RA. Tumour invasion and metastasis initiated by microRNA-10b in breast cancer. Nature (2007) 449:682–8. doi: 10.1038/nature06174
20. Zhang J, Li S, Li L, Li M, Guo C, Yao J, et al. Exosome and exosomal microRNA: trafficking, sorting, and function. Genomics Proteomics Bioinf (2015) 13:17–24. doi: 10.1016/j.gpb.2015.02.001
21. Kuroiwa T, Lee EG, Danning CL, Illei GG, McInnes IB, Boumpas DT. CD40 ligand-activated human monocytes amplify glomerular inflammatory responses through soluble and cell-to-cell contact-dependent mechanisms. J Immunol (1999) 163:2168–75.
22. Harvey S, Martinez-Moreno CG, Luna M, Aramburo C. Autocrine/paracrine roles of extrapituitary growth hormone and prolactin in health and disease: An overview. Gen Comp Endocrinol (2015) 220:103–11. doi: 10.1016/j.ygcen.2014.11.004
23. Maisano D, Mimmi S, Dattilo V, Marino F, Gentile M, Vecchio E, et al. A novel phage display based platform for exosome diversity characterization. Nanoscale (2022) 14:2998–3003. doi: 10.1039/D1NR06804K
24. Okulicz JF, Marconi VC, Landrum ML, Wegner S, Weintrob A, Ganesan A, et al. Clinical outcomes of elite controllers, viremic controllers, and long-term nonprogressors in the US department of defense HIV natural history study. J Infect Dis (2009) 200:1714–23. doi: 10.1086/646609
25. Thery C, Amigorena S, Raposo G, Clayton A. Isolation and characterization of exosomes from cell culture supernatants and biological fluids. Curr Protoc Cell Biol Chapter 3 (2006) Unit 3, 22. doi: 10.1002/0471143030.cb0322s30
26. Langfelder P, Horvath S. WGCNA: an r package for weighted correlation network analysis. BMC Bioinf (2008) 9:559. doi: 10.1186/1471-2105-9-559
27. Zhang B, Horvath S. A general framework for weighted gene co-expression network analysis. Stat Appl Genet Mol Biol 4 (2005) 4:17. doi: 10.2202/1544-6115.1128
28. Sadri Nahand J, Bokharaei-Salim F, Karimzadeh M, Moghoofei M, Karampoor S, Mirzaei HR, et al. MicroRNAs and exosomes: key players in HIV pathogenesis. HIV Med (2020) 21:246–78. doi: 10.1111/hiv.12822
29. Banerjee S, Cui H, Xie N, Tan Z, Yang S, Icyuz M, et al. miR-125a-5p regulates differential activation of macrophages and inflammation. J Biol Chem (2013) 288:35428–36. doi: 10.1074/jbc.M112.426866
30. Li Y, Yu J, Wang F, Guo R, Xing H, Chen Y, et al. MiR-150-5p regulate T cell activation in severe aplastic anemia by targeting Bach2. Cell Tissue Res (2021) 384:423–34. doi: 10.1007/s00441-020-03373-9
31. Huang Z, Yao F, Liu J, Xu J, Guo Y, Su R, et al. Up-regulation of circRNA-0003528 promotes mycobacterium tuberculosis associated macrophage polarization via down-regulating miR-224-5p, miR-324-5p and miR-488-5p and up-regulating CTLA4. Aging (Albany NY) (2020) 12:25658–72. doi: 10.18632/aging.104175
32. Pitangui NS, de Lacorte Singulani J, Sardi JCO, de Souza PC, Rodriguez-Arellanes G, Garcia-Perez BE, et al. Differential miRNA expression in human macrophage-like cells infected with histoplasma capsulatum yeasts cultured in planktonic and biofilm forms. J Fungi (Basel) 7 (2021) 7(1):60. doi: 10.3390/jof7010060
33. Wang C, Li X, Zhang L, Chen Y, Dong R, Zhang J, et al. miR-194-5p down-regulates tumor cell PD-L1 expression and promotes anti-tumor immunity in pancreatic cancer. Int Immunopharmacol (2021) 97:107822. doi: 10.1016/j.intimp.2021.107822
34. Zhou G, Li Y, Ni J, Jiang P, Bao Z. Role and mechanism of miR-144-5p in LPS-induced macrophages. Exp Ther Med (2020) 19:241–7. doi: 10.3892/etm.2019.8218
35. Sun YL, Guan XL, Zhang P, Li MF, Zhang J, Sun L. Pol-miR-363-3p plays a significant role in the immune defense of Japanese flounder paralichthys olivaceus against bacterial and viral infection. Fish Shellfish Immunol (2020) 104:439–46. doi: 10.1016/j.fsi.2020.06.016
36. Ni F, Guo C, Sun R, Fu B, Yang Y, Wu L, et al. MicroRNA transcriptomes of distinct human NK cell populations identify miR-362-5p as an essential regulator of NK cell function. Sci Rep (2015) 5:9993. doi: 10.1038/srep09993
37. Okamoto M, Fukushima Y, Kouwaki T, Daito T, Kohara M, Kida H, et al. MicroRNA-451a in extracellular, blood-resident vesicles attenuates macrophage and dendritic cell responses to influenza whole-virus vaccine. J Biol Chem (2018) 293:18585–600. doi: 10.1074/jbc.RA118.003862
38. Specjalski K, Jassem E. MicroRNAs: Potential biomarkers and targets of therapy in allergic diseases? Arch Immunol Ther Exp (Warsz) (2019) 67:213–23. doi: 10.1007/s00005-019-00547-4
39. Qian FH, Deng X, Zhuang QX, Wei B, Zheng DD. miR6255p suppresses inflammatory responses by targeting AKT2 in human bronchial epithelial cells. Mol Med Rep (2019) 19:1951–7. doi: 10.3892/mmr.2019.9817
40. Zhang R, Shang L, Nan J, Niu K, Dai J, Jin X, et al. Circ-METTL15 contributes to the proliferation, metastasis, immune escape and restrains apoptosis in lung cancer by regulating miR-1299/PDL1 axis. Autoimmunity (2022) 55:8–20. doi: 10.1080/08916934.2021.2001801
41. Schiavinato J, Haddad R, Saldanha-Araujo F, Baiochi J, Araujo AG, Santos Scheucher P, et al. TGF-beta/atRA-induced tregs express a selected set of microRNAs involved in the repression of transcripts related to Th17 differentiation. Sci Rep (2017) 7:3627. doi: 10.1038/s41598-017-03456-8
42. Tanaka T, Narazaki M, Kishimoto T. Interleukin (IL-6) immunotherapy. Cold Spring Harb Perspect Biol 10 (2018) 10(8):a028456. doi: 10.1101/cshperspect.a028456
43. Lopes TRR, Goncales JP, Silva Junior JVJ, Lorena VMB, Toscano A, Akamatsu SM, et al. Association of IL-6, IL-10 and CXCL10 serum concentrations with visceral kaposi’s sarcoma in people living with HIV/AIDS. Hum Immunol (2020) 81:26–31. doi: 10.1016/j.humimm.2019.11.007
44. Briggs MR, Kadonaga JT, Bell SP, Tjian R. Purification and biochemical characterization of the promoter-specific transcription factor, Sp1. Science (1986) 234:47–52. doi: 10.1126/science.3529394
45. Hotter D, Bosso M, Jonsson KL, Krapp C, Sturzel CM, Das A, et al. IFI16 targets the transcription factor sp1 to suppress hiv-1 transcription and latency reactivation. Cell Host Microbe (2019) 25:858–872 e13. doi: 10.1016/j.chom.2019.05.002
46. Sood R, Kamikubo Y, Liu P. Role of RUNX1 in hematological malignancies. Blood (2017) 129:2070–82. doi: 10.1182/blood-2016-10-687830
47. Huan C, Li Z, Ning S, Wang H, Yu XF, Zhang W. Long noncoding RNA uc002yug.2 activates HIV-1 latency through regulation of mRNA levels of various RUNX1 isoforms and increased tat expression. J Virol 92 (2018) 92(9):e01844–17. doi: 10.1128/JVI.01844-17
48. Sharrocks AD, Brown AL, Ling Y, Yates PR. The ETS-domain transcription factor family. Int J Biochem Cell Biol (1997) 29:1371–87. doi: 10.1016/S1357-2725(97)00086-1
49. Anderson MK, Hernandez-Hoyos G, Diamond RA, Rothenberg EV. Precise developmental regulation of ets family transcription factors during specification and commitment to the T cell lineage. Development (1999) 126:3131–48. doi: 10.1242/dev.126.14.3131
50. Lefebvre JM, Haks MC, Carleton MO, Rhodes M, Sinnathamby G, Simon MC, et al. Enforced expression of spi-b reverses T lineage commitment and blocks beta-selection. J Immunol (2005) 174:6184–94. doi: 10.4049/jimmunol.174.10.6184
51. Nikolova-Krstevski V, Yuan L, Le Bras A, Vijayaraj P, Kondo M, Gebauer I, et al. ERG is required for the differentiation of embryonic stem cells along the endothelial lineage. BMC Dev Biol (2009) 9:72. doi: 10.1186/1471-213X-9-72
52. Stankiewicz MJ, Crispino JD. ETS2 and ERG promote megakaryopoiesis and synergize with alterations in GATA-1 to immortalize hematopoietic progenitor cells. Blood (2009) 113:3337–47. doi: 10.1182/blood-2008-08-174813
53. Jakobsen JS, Waage J, Rapin N, Bisgaard HC, Larsen FS, Porse BT. Temporal mapping of CEBPA and CEBPB binding during liver regeneration reveals dynamic occupancy and specific regulatory codes for homeostatic and cell cycle gene batteries. Genome Res (2013) 23:592–603. doi: 10.1101/gr.146399.112
54. Dai J, Kumbhare A, Youssef D, Yao ZQ, McCall CE, El Gazzar M. Expression of C/EBPbeta in myeloid progenitors during sepsis promotes immunosuppression. Mol Immunol (2017) 91:165–72. doi: 10.1016/j.molimm.2017.09.008
55. Andlauer TF, Buck D, Antony G, Bayas A, Bechmann L, Berthele A, et al. Novel multiple sclerosis susceptibility loci implicated in epigenetic regulation. Sci Adv (2016) 2:e1501678. doi: 10.1126/sciadv.1501678
56. Zaal A, Dieker M, Oudenampsen M, Turksma AW, Lissenberg-Thunnissen SN, Wouters D, et al. Anaphylatoxin C5a regulates 6-sulfo-lacnac dendritic cell function in human through crosstalk with toll-like receptor-induced creb signaling. Front Immunol (2017) 8:818. doi: 10.3389/fimmu.2017.00818
57. Tomalka JA, Pelletier AN, Fourati S, Latif MB, Sharma A, Furr K, et al. The transcription factor CREB1 is a mechanistic driver of immunogenicity and reduced HIV-1 acquisition following ALVAC vaccination. Nat Immunol (2021) 22:1294–305. doi: 10.1038/s41590-021-01026-9
58. Voura EB, Billia F, Iscove NN, Hawley RG. Expression mapping of adhesion receptor genes during differentiation of individual hematopoietic precursors. Exp Hematol (1997) 25(11):1172–79.
59. Burgueno-Bucio E, Mier-Aguilar CA, Soldevila G. The multiple faces of CD5. J Leukoc Biol (2019) 105:891–904. doi: 10.1002/JLB.MR0618-226R
60. Xu L, Yang H, Gao Y, Chen Z, Xie L, Liu Y, et al. CRISPR/Cas9-mediated CCR5 ablation in human hematopoietic stem/progenitor cells confers hiv-1 resistance in vivo. Mol Ther (2017) 25:1782–9. doi: 10.1016/j.ymthe.2017.04.027
61. Wu Z, Zhang Z, Lei Z, Lei P. CD14: Biology and role in the pathogenesis of disease. Cytokine Growth Factor Rev (2019) 48:24–31. doi: 10.1016/j.cytogfr.2019.06.003
62. Karnell JL, Rieder SA, Ettinger R, Kolbeck R. Targeting the cd40-cd40l pathway in autoimmune diseases: humoral immunity and beyond. Adv Drug Delivery Rev (2019) 141:92–103. doi: 10.1016/j.addr.2018.12.005
63. Tanaka S, Ise W, Inoue T, Ito A, Ono C, Shima Y, et al. Tet2 and Tet3 in b cells are required to repress CD86 and prevent autoimmunity. Nat Immunol (2020) 21:950–61. doi: 10.1038/s41590-020-0700-y
64. Cong X, Zhang Y, Zhu Z, Li S, Yin X, Zhai Z, et al. CD66b(+) neutrophils and alpha-SMA(+) fibroblasts predict clinical outcomes and benefits from postoperative chemotherapy in gastric adenocarcinoma. Cancer Med (2020) 9:2761–73. doi: 10.1002/cam4.2939
65. Futosi K, Fodor S, Mocsai A. Neutrophil cell surface receptors and their intracellular signal transduction pathways. Int Immunopharmacol (2013) 17:638–50. doi: 10.1016/j.intimp.2013.06.034
66. Takenoyama M, Yoshino I, Eifuku R, So T, Imahayashi S, Sugaya M, et al. Successful induction of tumor-specific cytotoxic T lymphocytes from patients with non-small cell lung cancer using CD80-transfected autologous tumor cells. Jpn J Cancer Res (2001) 92:309–15. doi: 10.1111/j.1349-7006.2001.tb01096.x
67. Rock KL, Reits E, Neefjes J. Present yourself! by mhc class i and mhc class ii molecules. Trends Immunol (2016) 37:724–37. doi: 10.1016/j.it.2016.08.010
68. Xu S, Wei J, Wang F, Kong LY, Ling XY, Nduom E, et al. Effect of miR-142-3p on the M2 macrophage and therapeutic efficacy against murine glioblastoma. J Natl Cancer Inst 106 (2014) 106(8):dju162. doi: 10.1093/jnci/dju162
69. Zhu X, Guo Q, Zou J, Wang B, Zhang Z, Wei R, et al. MiR-19a-3p suppresses m1 macrophage polarization by inhibiting stat1/irf1 pathway. Front Pharmacol (2021) 12:614044. doi: 10.3389/fphar.2021.614044
70. Lv LL, Feng Y, Wu M, Wang B, Li ZL, Zhong X, et al. Exosomal miRNA-19b-3p of tubular epithelial cells promotes M1 macrophage activation in kidney injury. Cell Death Differ (2020) 27:210–26. doi: 10.1038/s41418-019-0349-y
71. Wang D, Wang X, Si M, Yang J, Sun S, Wu H, et al. Exosome-encapsulated miRNAs contribute to CXCL12/CXCR4-induced liver metastasis of colorectal cancer by enhancing M2 polarization of macrophages. Cancer Lett (2020) 474:36–52. doi: 10.1016/j.canlet.2020.01.005
72. Chen J, Li C, Li R, Chen H, Chen D, Li W. Exosomes in HIV infection. Curr Opin HIV AIDS (2021) 16:262–70. doi: 10.1097/COH.0000000000000694
73. Li P, Kaslan M, Lee SH, Yao J, Gao Z. Progress in exosome isolation techniques. Theranostics (2017) 7:789–804. doi: 10.7150/thno.18133
74. Gallo A, Vella S, Miele M, Timoneri F, Di Bella M, Bosi S, et al. Global profiling of viral and cellular non-coding RNAs in Epstein-Barr virus-induced lymphoblastoid cell lines and released exosome cargos. Cancer Lett (2017) 388:334–43. doi: 10.1016/j.canlet.2016.12.003
75. Shi Y, Du L, Lv D, Li Y, Zhang Z, Huang X, et al. Emerging role and therapeutic application of exosome in hepatitis virus infection and associated diseases. J Gastroenterol (2021) 56:336–49. doi: 10.1007/s00535-021-01765-4
Keywords: HIV, exosomal miRNAs, exosomal member proteins, rapid progressors, typical progressors
Citation: Li X, Wang W, Chen J, Xie B, Luo S, Chen D, Cai C, Li C and Li W (2022) The potential role of exosomal miRNAs and membrane proteins in acute HIV-infected people. Front. Immunol. 13:939504. doi: 10.3389/fimmu.2022.939504
Received: 09 May 2022; Accepted: 21 July 2022;
Published: 12 August 2022.
Edited by:
Haitao Wen, The Ohio State University, United StatesReviewed by:
Ludmila Rodrigues Pinto Ferreira, Universidade Federal de Minas Gerais, BrazilEnrico Iaccino, Magna Græcia University of Catanzaro, Italy
Copyright © 2022 Li, Wang, Chen, Xie, Luo, Chen, Cai, Li and Li. This is an open-access article distributed under the terms of the Creative Commons Attribution License (CC BY). The use, distribution or reproduction in other forums is permitted, provided the original author(s) and the copyright owner(s) are credited and that the original publication in this journal is cited, in accordance with accepted academic practice. No use, distribution or reproduction is permitted which does not comply with these terms.
*Correspondence: Weihua Li, liweihua@163.com; Chao Cai, fangzecai@126.com; Chuanyun Li, lichuany0388@163.com
†These authors have contributed equally to this work