 Jie-ling Chen1†
 Hui-fang Dai
 Xin-chen Kan
 Jie Wu
 Hong-Wu Chen
- 1Brain Function and Disease Laboratory, Shantou University Medical College, Shantou, Guangdong, China
- 2Department of Physiology, Shantou University Medical College, Shantou, Guangdong, China
- 3Department of Neurosurgery, The First Affiliated Hospital of Shantou University Medical College, Shantou, Guangdong, China
Background: Gestational diabetes mellitus (GDM), a transient disease, may lead to short- or long-term adverse influences on maternal and fetal health. Therefore, its potential functions, mechanisms and related molecular biomarkers must be comprehended for the control, diagnosis and treatment of GDM.
Methods: The differentially expressed genes (DEGs) were identified using GSE49524 and GSE87295 associated with GDM from the Gene Expression Omnibus database, followed by function enrichment analysis, protein-protein interactions network construction, hub DEGs mining, diagnostic value evaluation and immune infiltration analysis. Finally, hub DEGs, the strongest related to immune infiltration, were screened as immune-related biomarkers.
Results: A hundred and seven DEGs were identified between patients with GDM and healthy individuals. Six hub genes with high diagnostic values, including ALDH1A1, BMP4, EFNB2, MME, PLAUR and SLIT2, were identified. Among these, two immune-related genes (PLAUR and SLIT2) with the highest absolute correlation coefficient were considered immune-related biomarkers in GDM.
Conclusion: Our study provides a comprehensive analysis of GDM, which would provide a foundation for the development of diagnosis and treatment of GDM.
Introduction
Gestational diabetes mellitus (GDM), which is the most prevalent pregnancy-related metabolic disturbance, refers to glucose intolerance that first becomes evident at some point during pregnancy (1). Approximately 2 to 10% of pregnancies in the United States and about 13.9% of pregnancies worldwide are complicated by GDM (2). The etiology of GDM is complex, owing to both genetic and environmental factors (3, 4). Several studies have revealed the critical short- and long-term adverse health consequences of GDM on both the mother and their offspring (4). Women with GDM are at risk for short- and long-term health complications, including type 2 diabetes (T2DM), cardiovascular disease (CVD) later in life and adverse cardiometabolic phenotypes in subsequent offspring (5, 6). Furthermore, GDM leads to a significant financial burden on society and healthcare resources (7, 8). Currently, the onset and progression of GDM are uncertain and complex and pathogenesis remains uncertain (9). Consequently, revealing new diagnostic and therapeutic molecular biomarkers for GDM patients for individualized and effective treatment is crucial.
The interaction between immune response and GDM has been extensively studied. The GDM’s etiopathogenesis is ambiguous, and the existing studies suggest dysregulated maternal immune systems and low -grade inflammation as critical factors in the pathophysiology of GDM (10). The maternal-fetal interface in patients with GDM demonstrates a higher proportion of cytotoxic NK cells (11) and dysregulated functions of Tregs (12, 13) and Th17 cells (14, 15) compared to normal pregnant women. Previous studies also demonstrated that immune cells and secreted cytokines might play an important role in GDM. IL-6 (16, 17), IL-1β (18), IL-38 (19) and TNF-α (18, 20) secreted by placental tissue aggravate the chronic inflammatory reaction and degree of maternal insulin resistance (IR), thus, contributing to the development of GDM. However, our understanding of the immune microenvironment in GDM is highly limited to date.
In recent years, the data generated by microarray technology have been used to study the pathophysiology of various diseases. In our study, our aim is to search for immune-related hub biomarkers with diagnostic significance for the patients with GDM through a comprehensive bioinformatic analysis, which may help develop targeted drugs for the treatment and provide a research foundation for preclinical research of GDM therapy. Firstly, an integrated bioinformatic analysis for transcriptome sequencing data of umbilical cord HUVEC cells from GDM patients was performed to identify the hub immune-related molecules or GDM biomarkers as strong evidence. The gene expression profiles of GSE49524 and GSE87295 from the Gene Expression Omnibus (GEO) database (https://www.ncbi.nlm.nih.gov/geo/) were downloaded and analyzed in this study. A hundred and seven genes (68 upregulated and 39 downregulated genes) were identified as the hub differentially expressed genes (DEGs), followed by functional enrichment analysis through Gene Ontology (GO) term, Kyoto Encyclopedia of Genes and Genomes (KEGG) pathway enrichment analysis and disease ontology (DO) enrichment analysis. Then, Six algorithms of cytoHubaa plug-in performance and Receiver operating characteristic (ROC) curve analysis, six hub DEGs with the area under the ROC curve >0.8, which have remarkable diagnostic value, after protein-protein interaction (PPI) network construction were significantly correlated with GDM. Subsequently, the relationship between these six hub genes and immune cell infiltration was analyzed. Finally, the two immune-related genes with the highest absolute correlation coefficient were screened.
Materials and methods
Data collection and normalization
In the present study, GDM datasets (GSE49524 and GSE87295) from the GEO database (Table 1) were downloaded. The GSE49524 contained three umbilical cords HUVEC sample of 3 women with GDM and three umbilical cords HUVEC sample of 3 women without GDM matching for age and Body Mass Index, and the GSE87295 contained five HUVECs samples from GDM background and five HUVECs samples from the mothers with no GDM. We pooled these two datasets and divided them into GDM group (n=8) and control group (n=8). Data preprocessing and normalization were performed through the R package “inSilicoMerging” and “combat” algorithms. The GDM datasets (GSE49524 and GSE87295) were first combined into a gene expression profile, and then the batch effect between the two datasets was removed to obtain the normalized gene expression matrix used in the subsequent analysis.
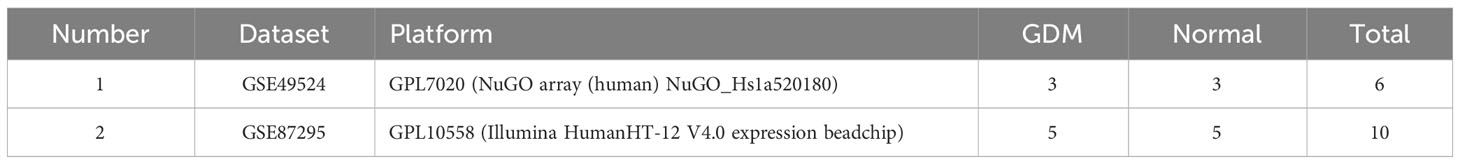
Table 1 Dataset characteristics of selected GEO datasets.
Differential expression analysis
R package “Limma” was employed to screen the DEGs using |log2 Fold change (FC)| >0.5 and p < 0.05 as the cutoff criteria to investigate the differentially expressed genes (DEGs) in GDM and normal samples. The volcano and ranking plots were used to visualize the DEG distribution.
Functional enrichment analysis
The Kyoto Encyclopedia of Genes and Genomes (KEGG) pathway enrichment analysis; Gene Ontology (GO) enrichment analysis (including biological process [BP], cellular component [CC] and molecular function [MF]); and disease ontology (DO) enrichment analysis were performed through R package “clusterProfiler” with p-value < 0.05 as the cutoff, to comprehensively obtain the functional annotation for the DEGs.
Protein-protein interaction network analysis and hub gene identification
The STRING database (https://string-db.org) and Cytoscape software (version 3.8.2) was employed to obtain the potential PPI information and visualize the PPI network to investigate the protein-protein interaction (PPI) network of DEGs. Furthermore, the Molecular Complex Detection (MCODE) algorithm was used for the hub gene cluster analysis. Moreover, five algorithms (Degree, MNC, DMNC, EPC and MCC) of the cytoHubaa plug-in were employed to identify the hub DEGs of the PPI network in Cytoscape software. The Wilcoxon test was used to analyze the gene expression levels, and Spearman’s correlation analysis was used to depict the correlation between each of identified hub genes.
Receiver operating characteristic curve analysis
To evaluate the accuracy of identified hub genes as the diagnostic biomarkers of patients with GDM, the ROC curve and areas under the ROC curve (AUC) were used for the evaluation of candidate biomarkers in patients with GDM through the R package “pROC”.
Immune cell infiltration analysis
The infiltration level of 22 immune infiltrating cells in GDM and normal samples was determined using the CIBERSORT algorithm by R package “IOBR,” and the significant difference in the immune infiltration between GDM and normal samples passed the Wilcoxon test. Spearman’s correlation analysis was used to depict the correlation between each of the immune cells and between the immune cells and identified hub genes in GDM samples.
Statistical analysis
The aforementioned bioinformatics analysis and R package were implemented using R software (v4.0.3) and Sangerbox, a comprehensive, interaction-friendly clinical bioinformatics analysis platform. Spearman’s correlation analysis was utilized to determine the correlation, and the significance of the two groups was assessed using the Wilcox test. Statistical significance was defined as p<0.05.
Results
Identification of differentially expressed genes in GDM samples
The study design is presented in Supplementary Figure 1. The box plot shows that the expression profiles of GSE49524 and GSE87295 are normalized (Figures 1A, B). The density plot also revealed that the batch effect of the GSE49524 and GSE87295 meta-cohort was well removed (Figures 1C, D). Subsequently, according to the criteria (|log2 Fold change [FC]| >0.5 and p < 0.05), a total of 107 genes (68 upregulated and 39 down-regulated genes) were identified as the DEGs (Table 2), as shown in Figures 2A, B.
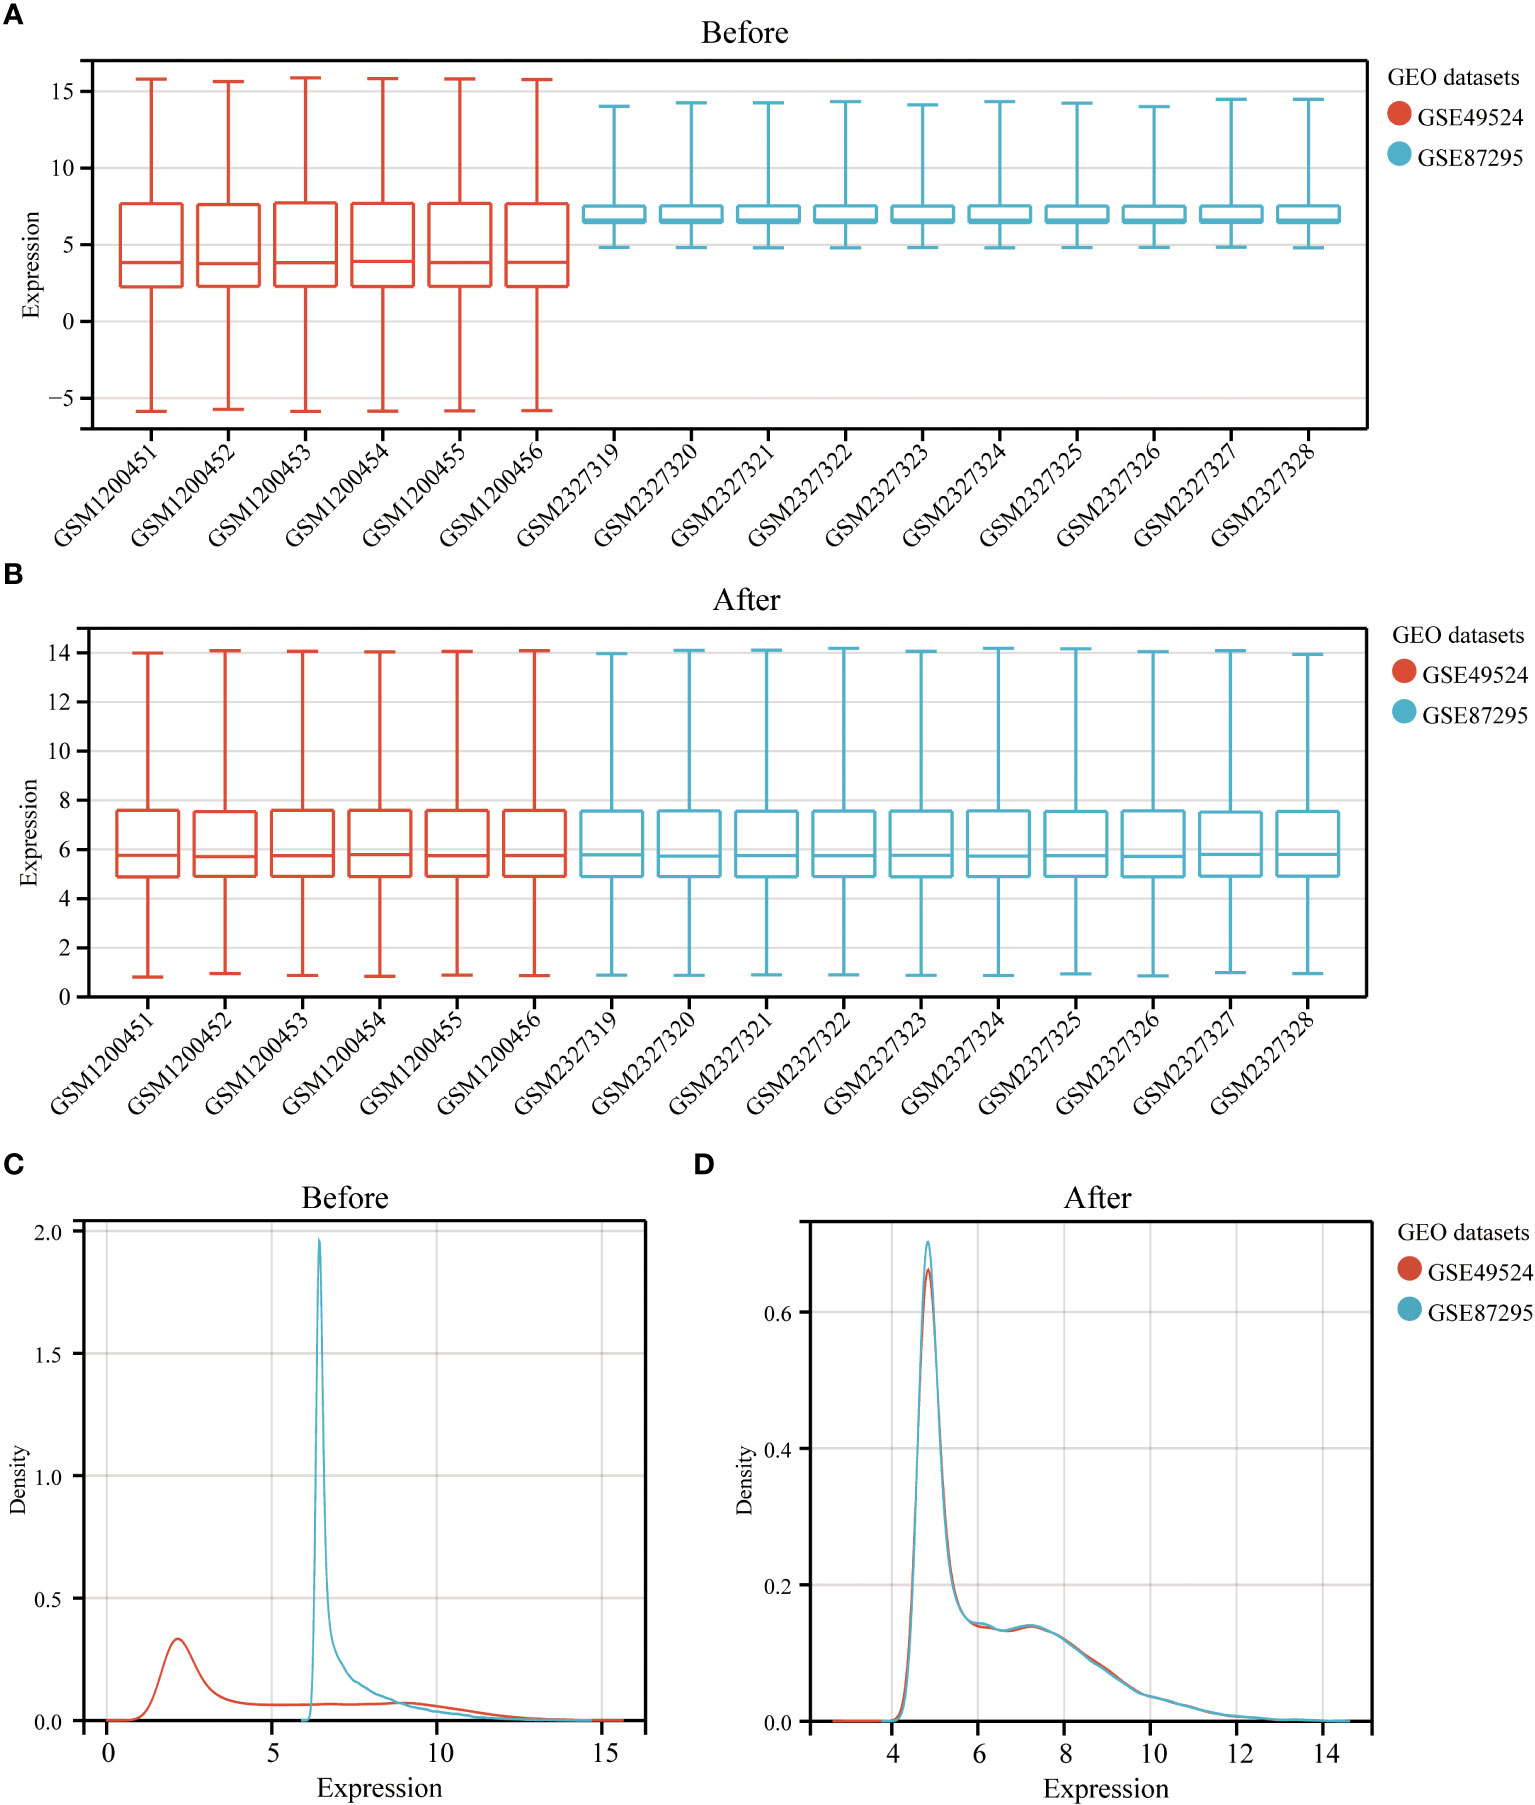
Figure 1 Normalization of GDM samples in selected GEO datasets. The box plots (A, B) and density curves (C, D) showed the gene expression distribution level in each GDM sample before and after removing the batch effect and normalization of samples.
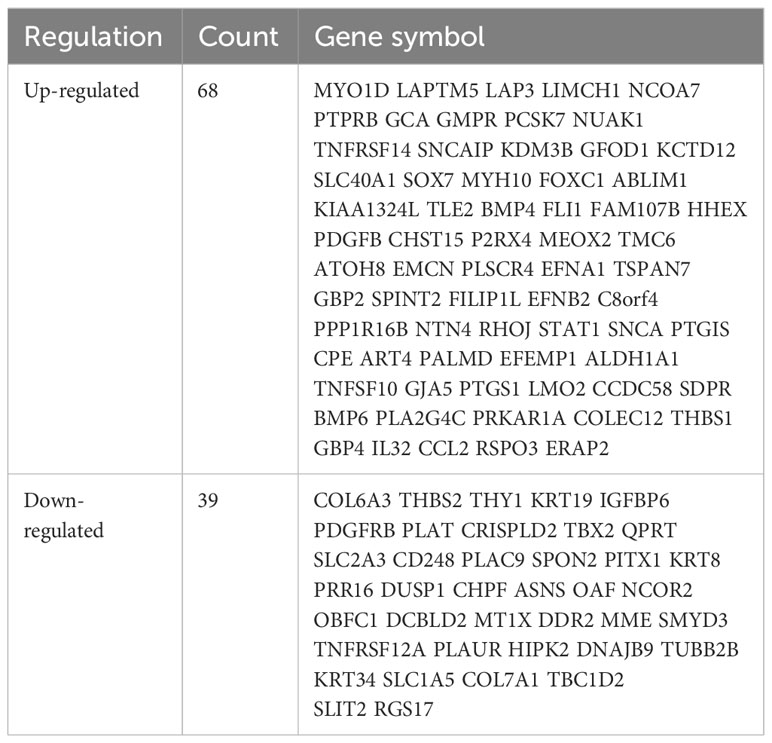
Table 2 The summary of differentially expressed genes (DEGs) in GDM.
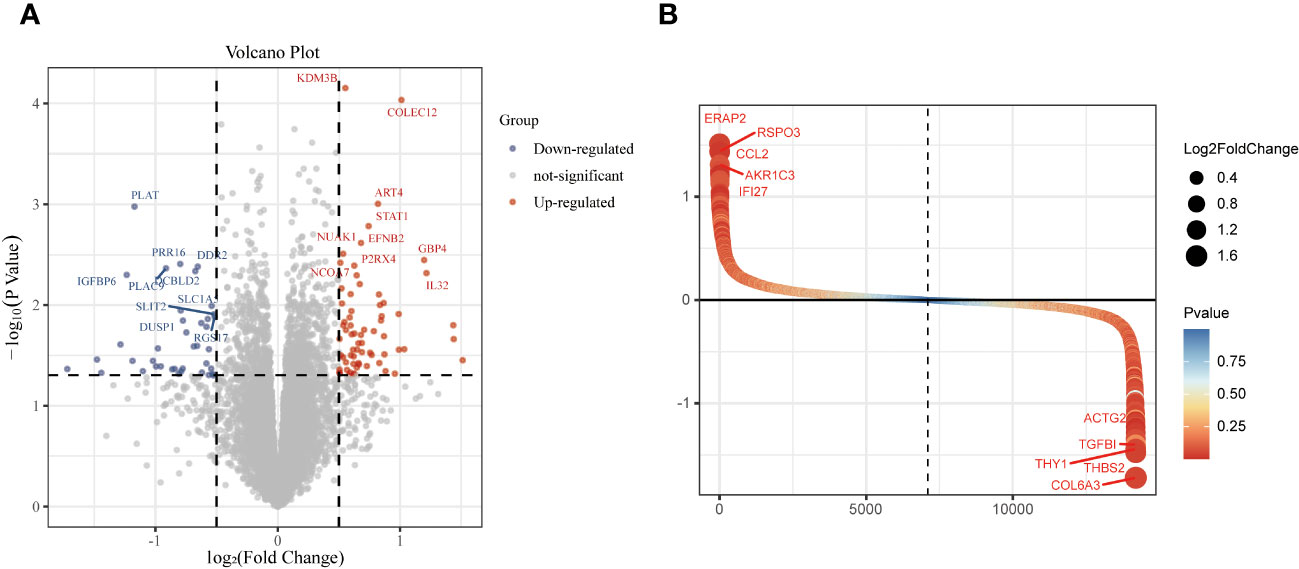
Figure 2 Identification of differentially expressed genes (DEGs) in GDM samples. The DEGs of GDM samples were shown in the volcano plot (A) and gene rank plot (B).
Functional enrichment analysis for DEGs
To identify the underlying molecular mechanism in GDM, the R package “clusterProfiler” was used to perform functional enrichment analysis, including KEGG pathway enrichment analysis (Table 3), three categories of GO functional enrichment analyses (BP, CC, MF) (Table 4) and DO enrichment analysis (Table 5), to further analyze the function of 107 DEGs. As illustrated in Figure 3A, the KEGG pathway analysis indicated that cytokine-cytokine receptor interaction, fluid shear stress and atherosclerosis, axon guidance, transcriptional misregulation in cancer and focal adhesion were the primarily enriched pathways in the DEGs (Figure 3A). The top 10 enriched KEGG pathway terms associations via ribbons to the participating DEGs genes are shown in a chord plot (Figure 3B). Then, these top 10 enriched KEGG pathways were mapped to their KEGG classes. As illustrated in Figure 3C, the KEGG enrichment bar plot showed that the DEGs covered the KEGG main class, involving cellular processes, environmental information processing, human disease, metabolism and organismal systems. The enriched GO terms for DEGs primarily included regulation of vasculature, embryonic organ, reproductive structure and reproductive system developments in the BP category; endoplasmic reticulum lumen, secretory granule membrane, platelet alpha granule and specific granule membrane in the CC category; and extracellular matrix, heparin, laminin and sulfur compound binding in the MM category (Figures 4, 5).
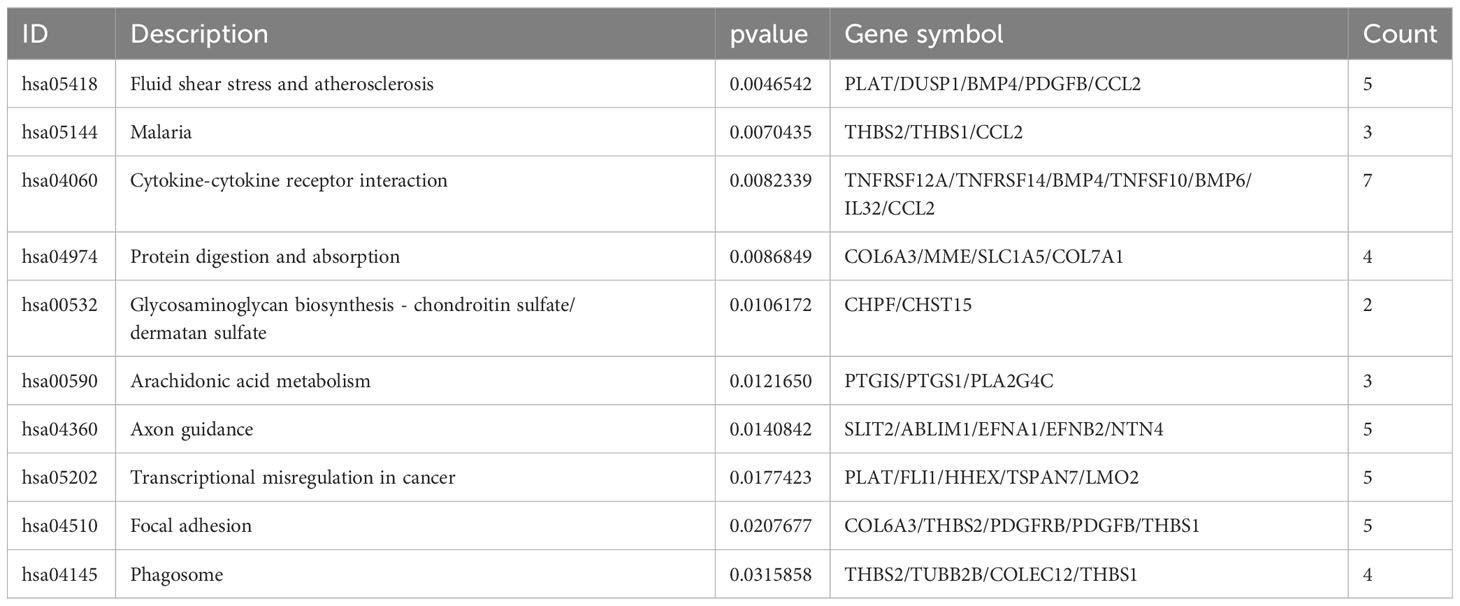
Table 3 The results of enriched KEGG pathways.
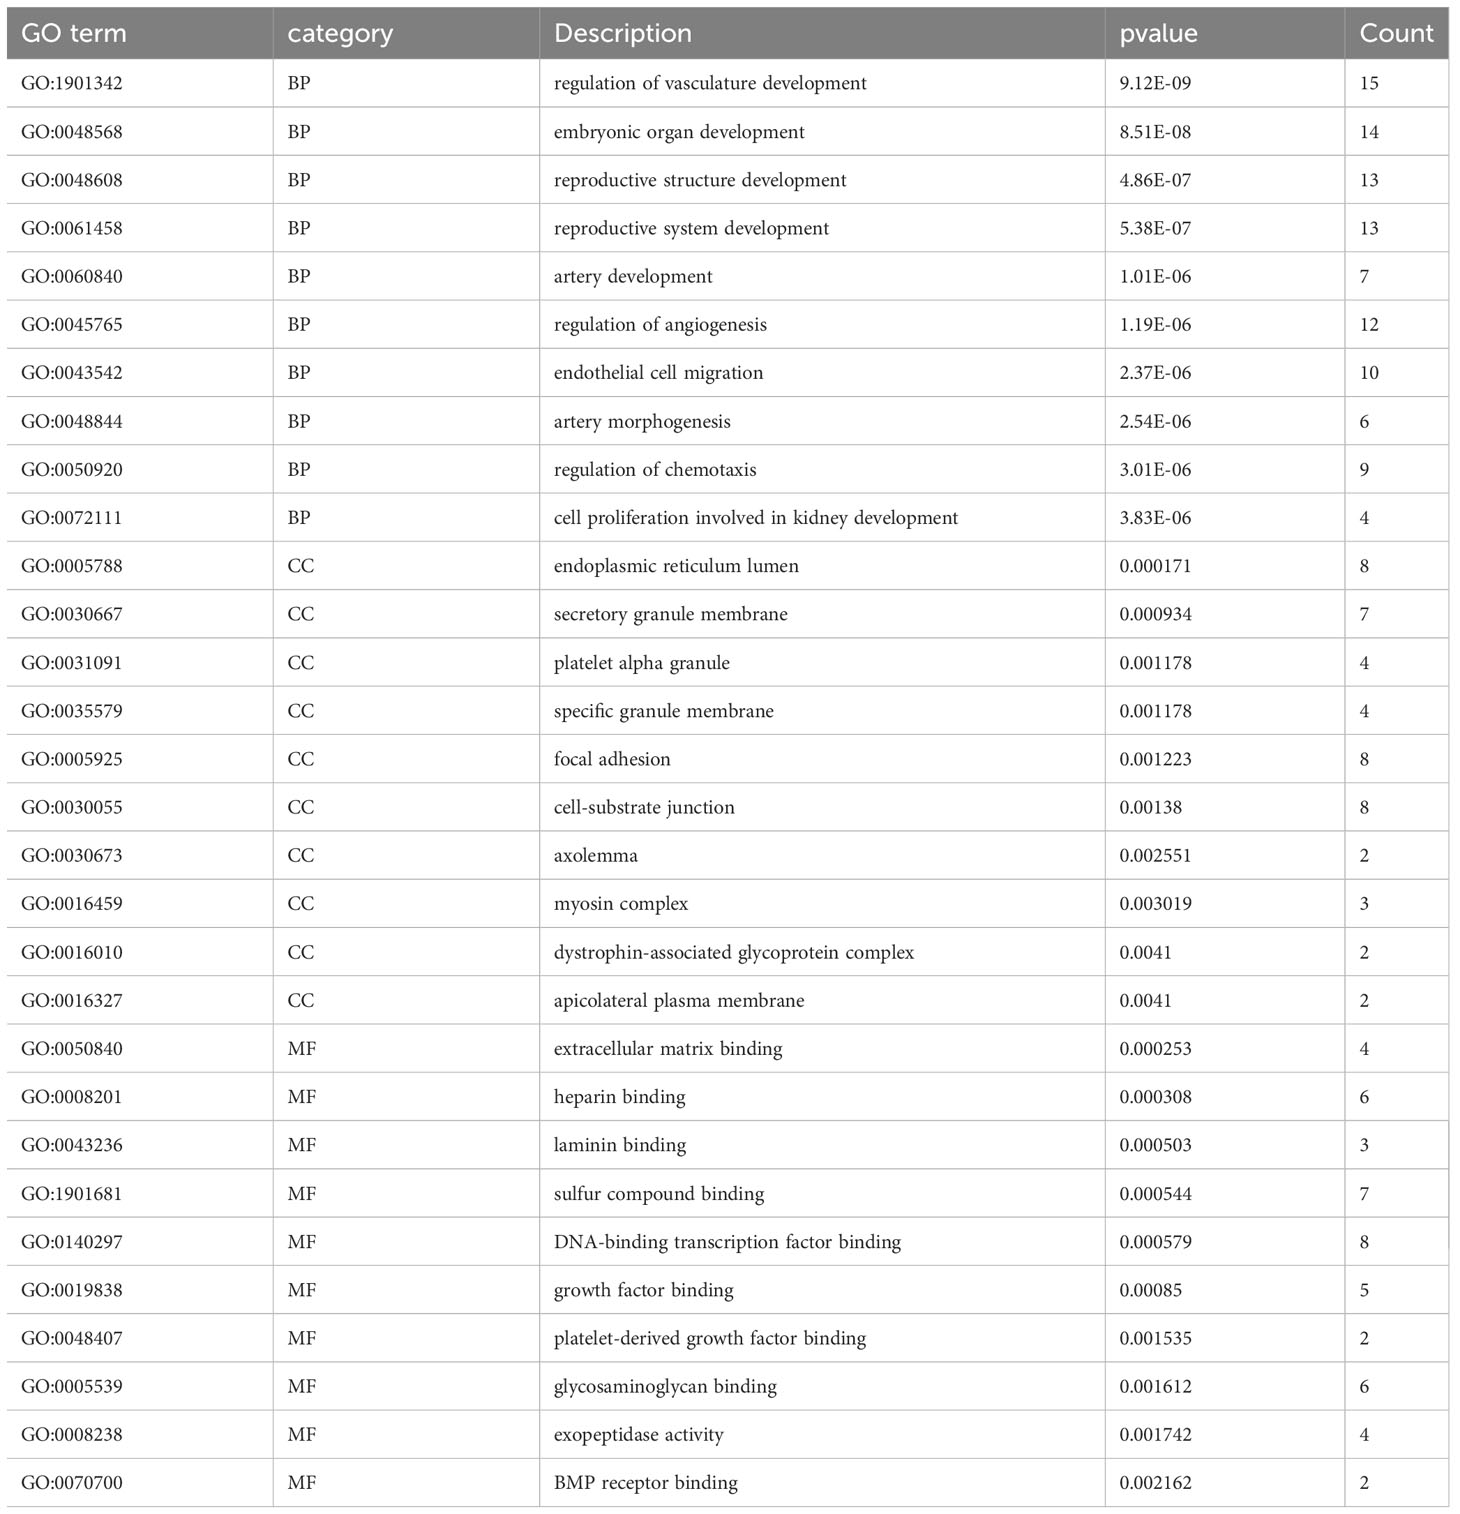
Table 4 The results of enriched GO terms.
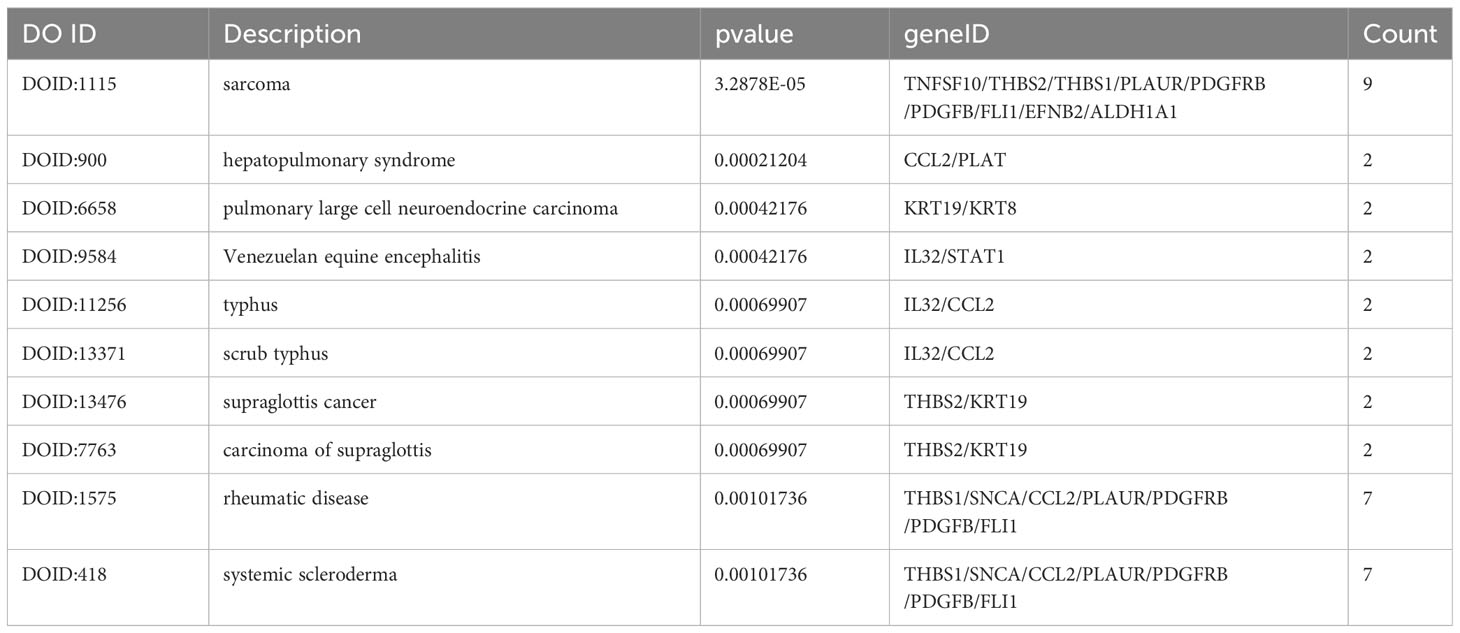
Table 5 The results of enriched DO.
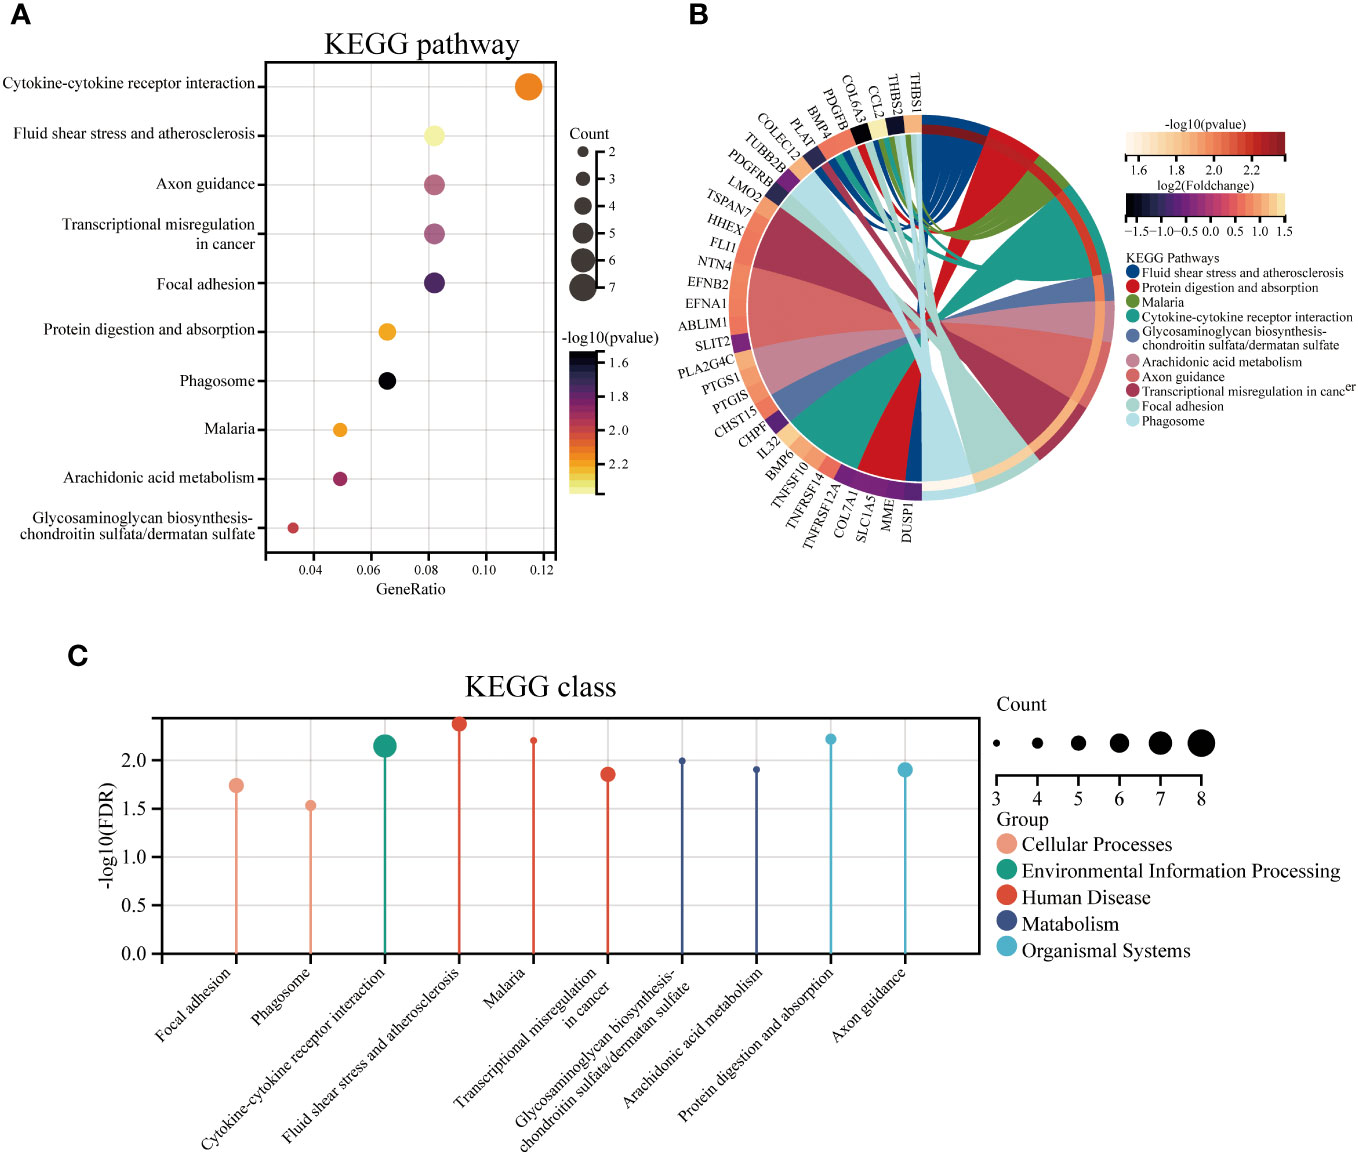
Figure 3 The top 10 enriched KEGG pathways for DEGs. The KEGG enrichment buddle diagram (A), gene-pathway chord plot (B) and KEGG class lollipop plot (C).
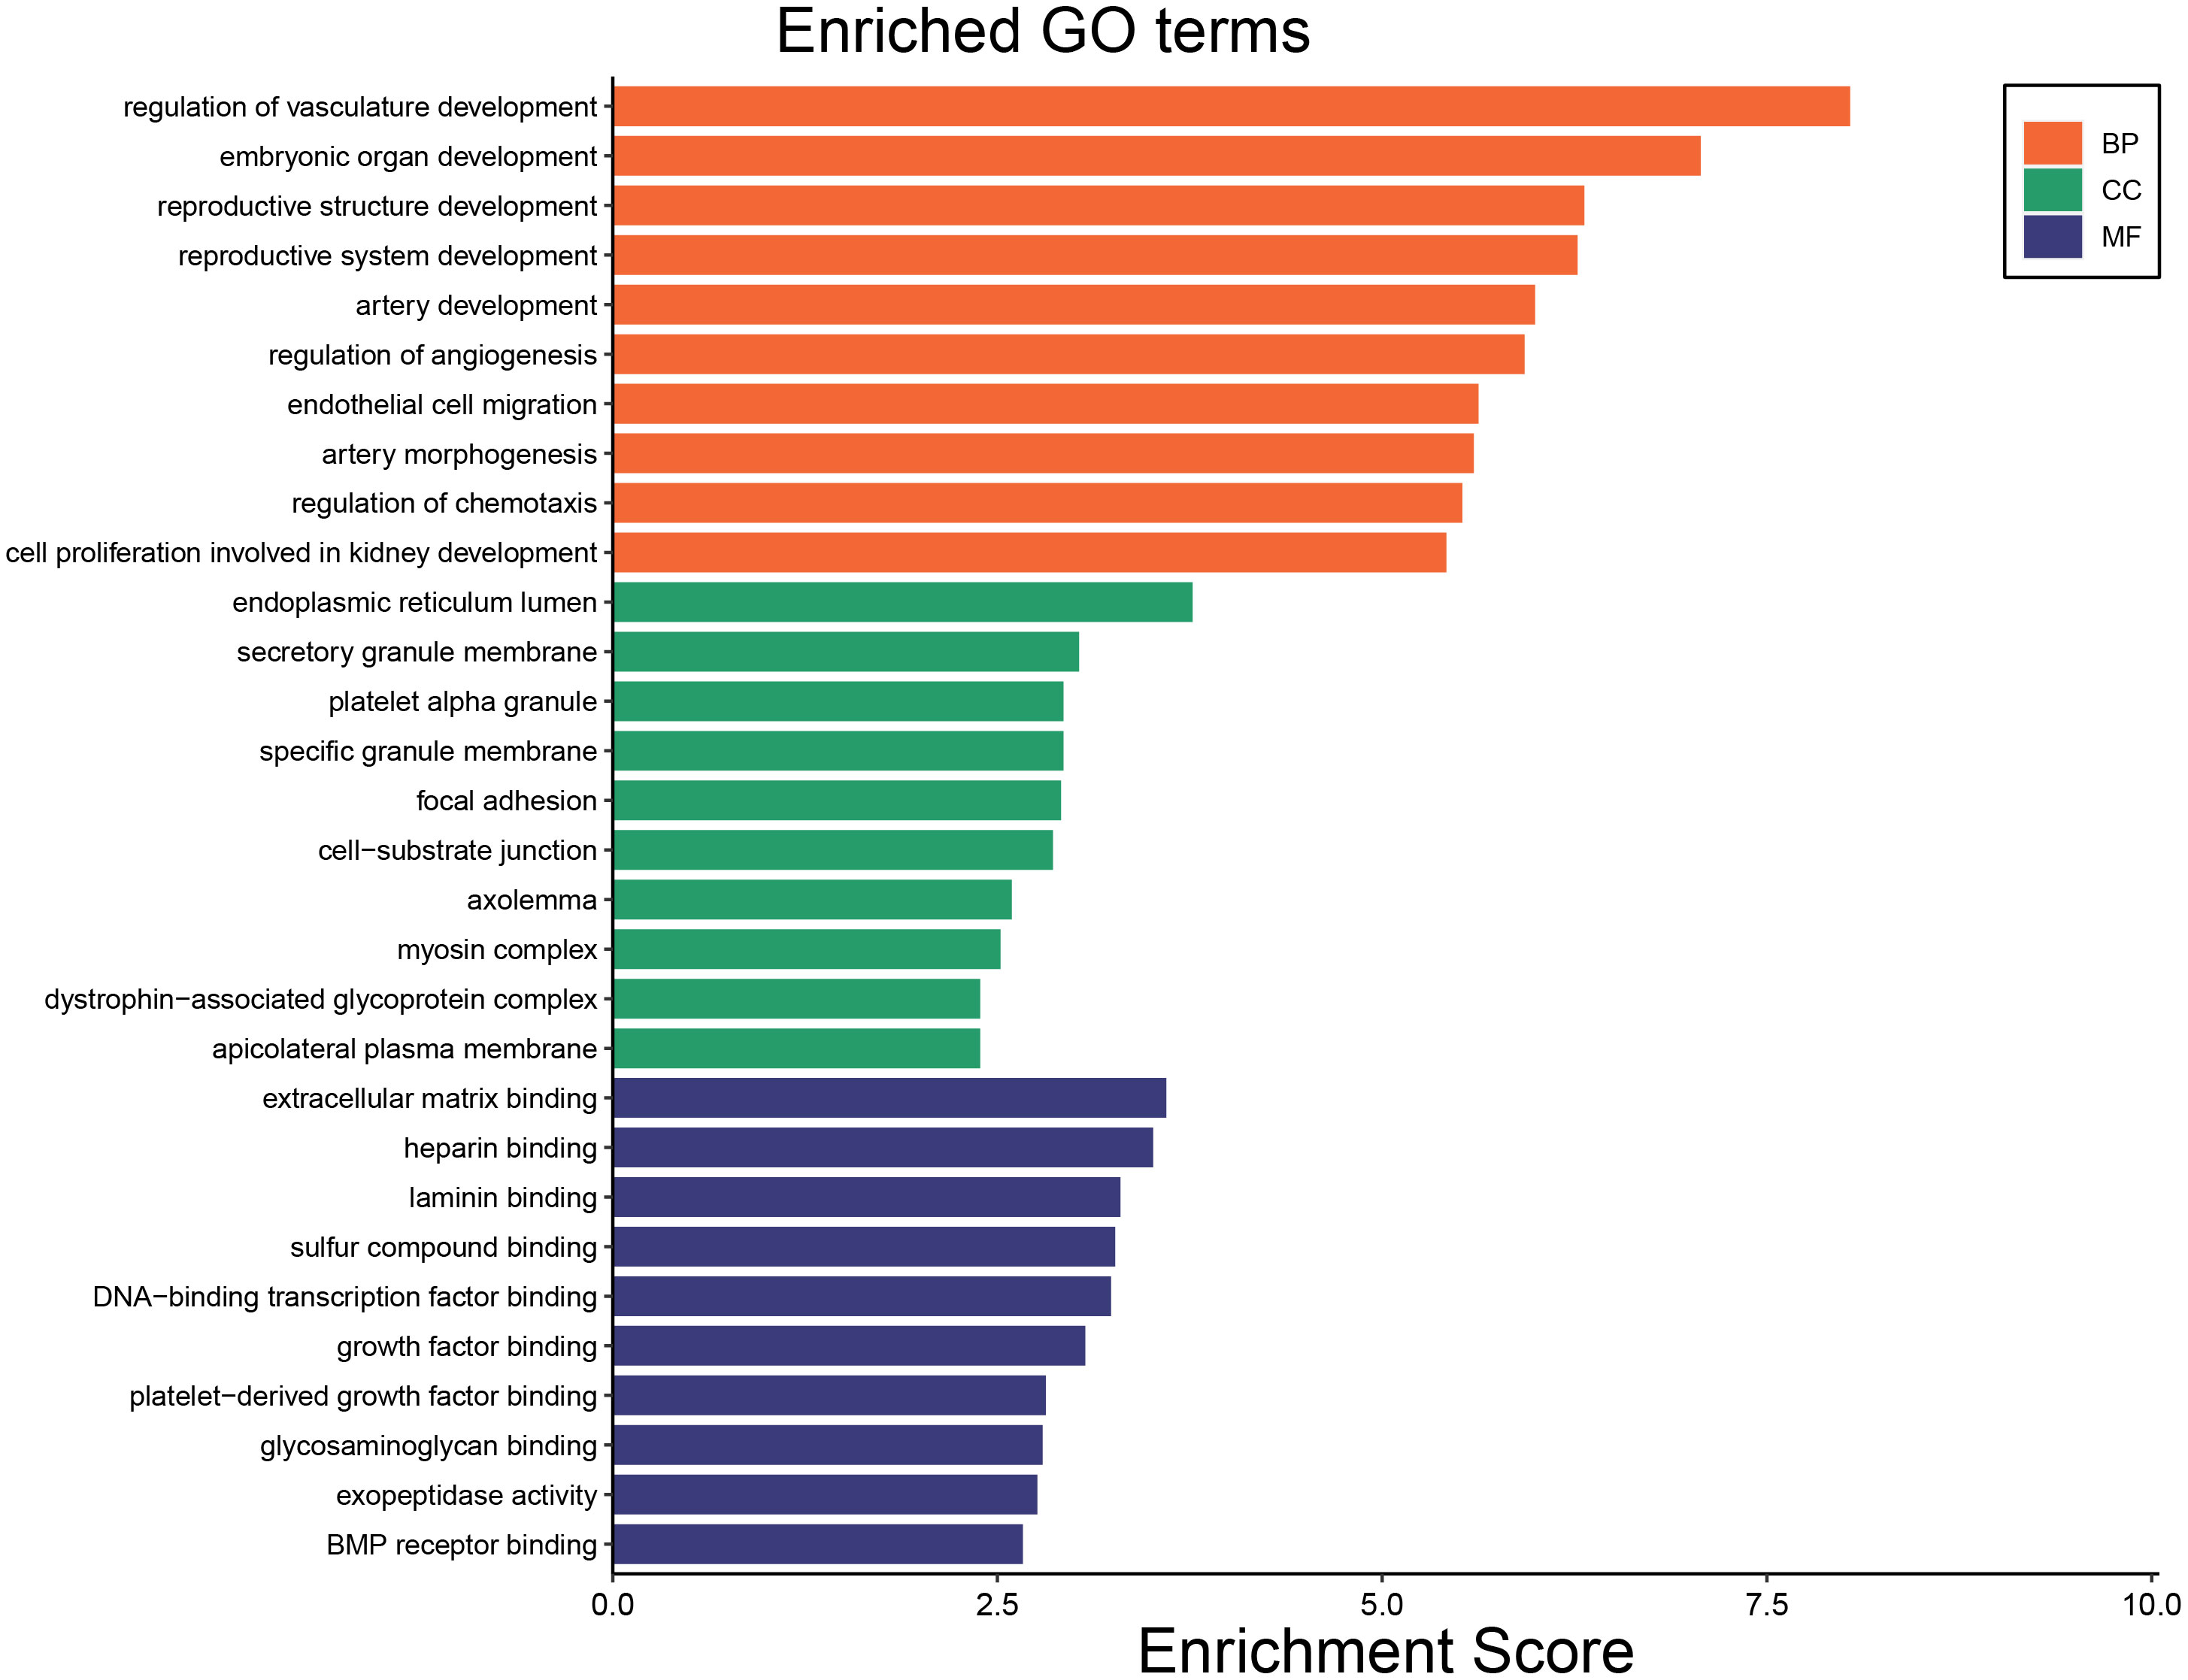
Figure 4 The top 10 enriched GO terms including GO BP, GO CC and GO MF.
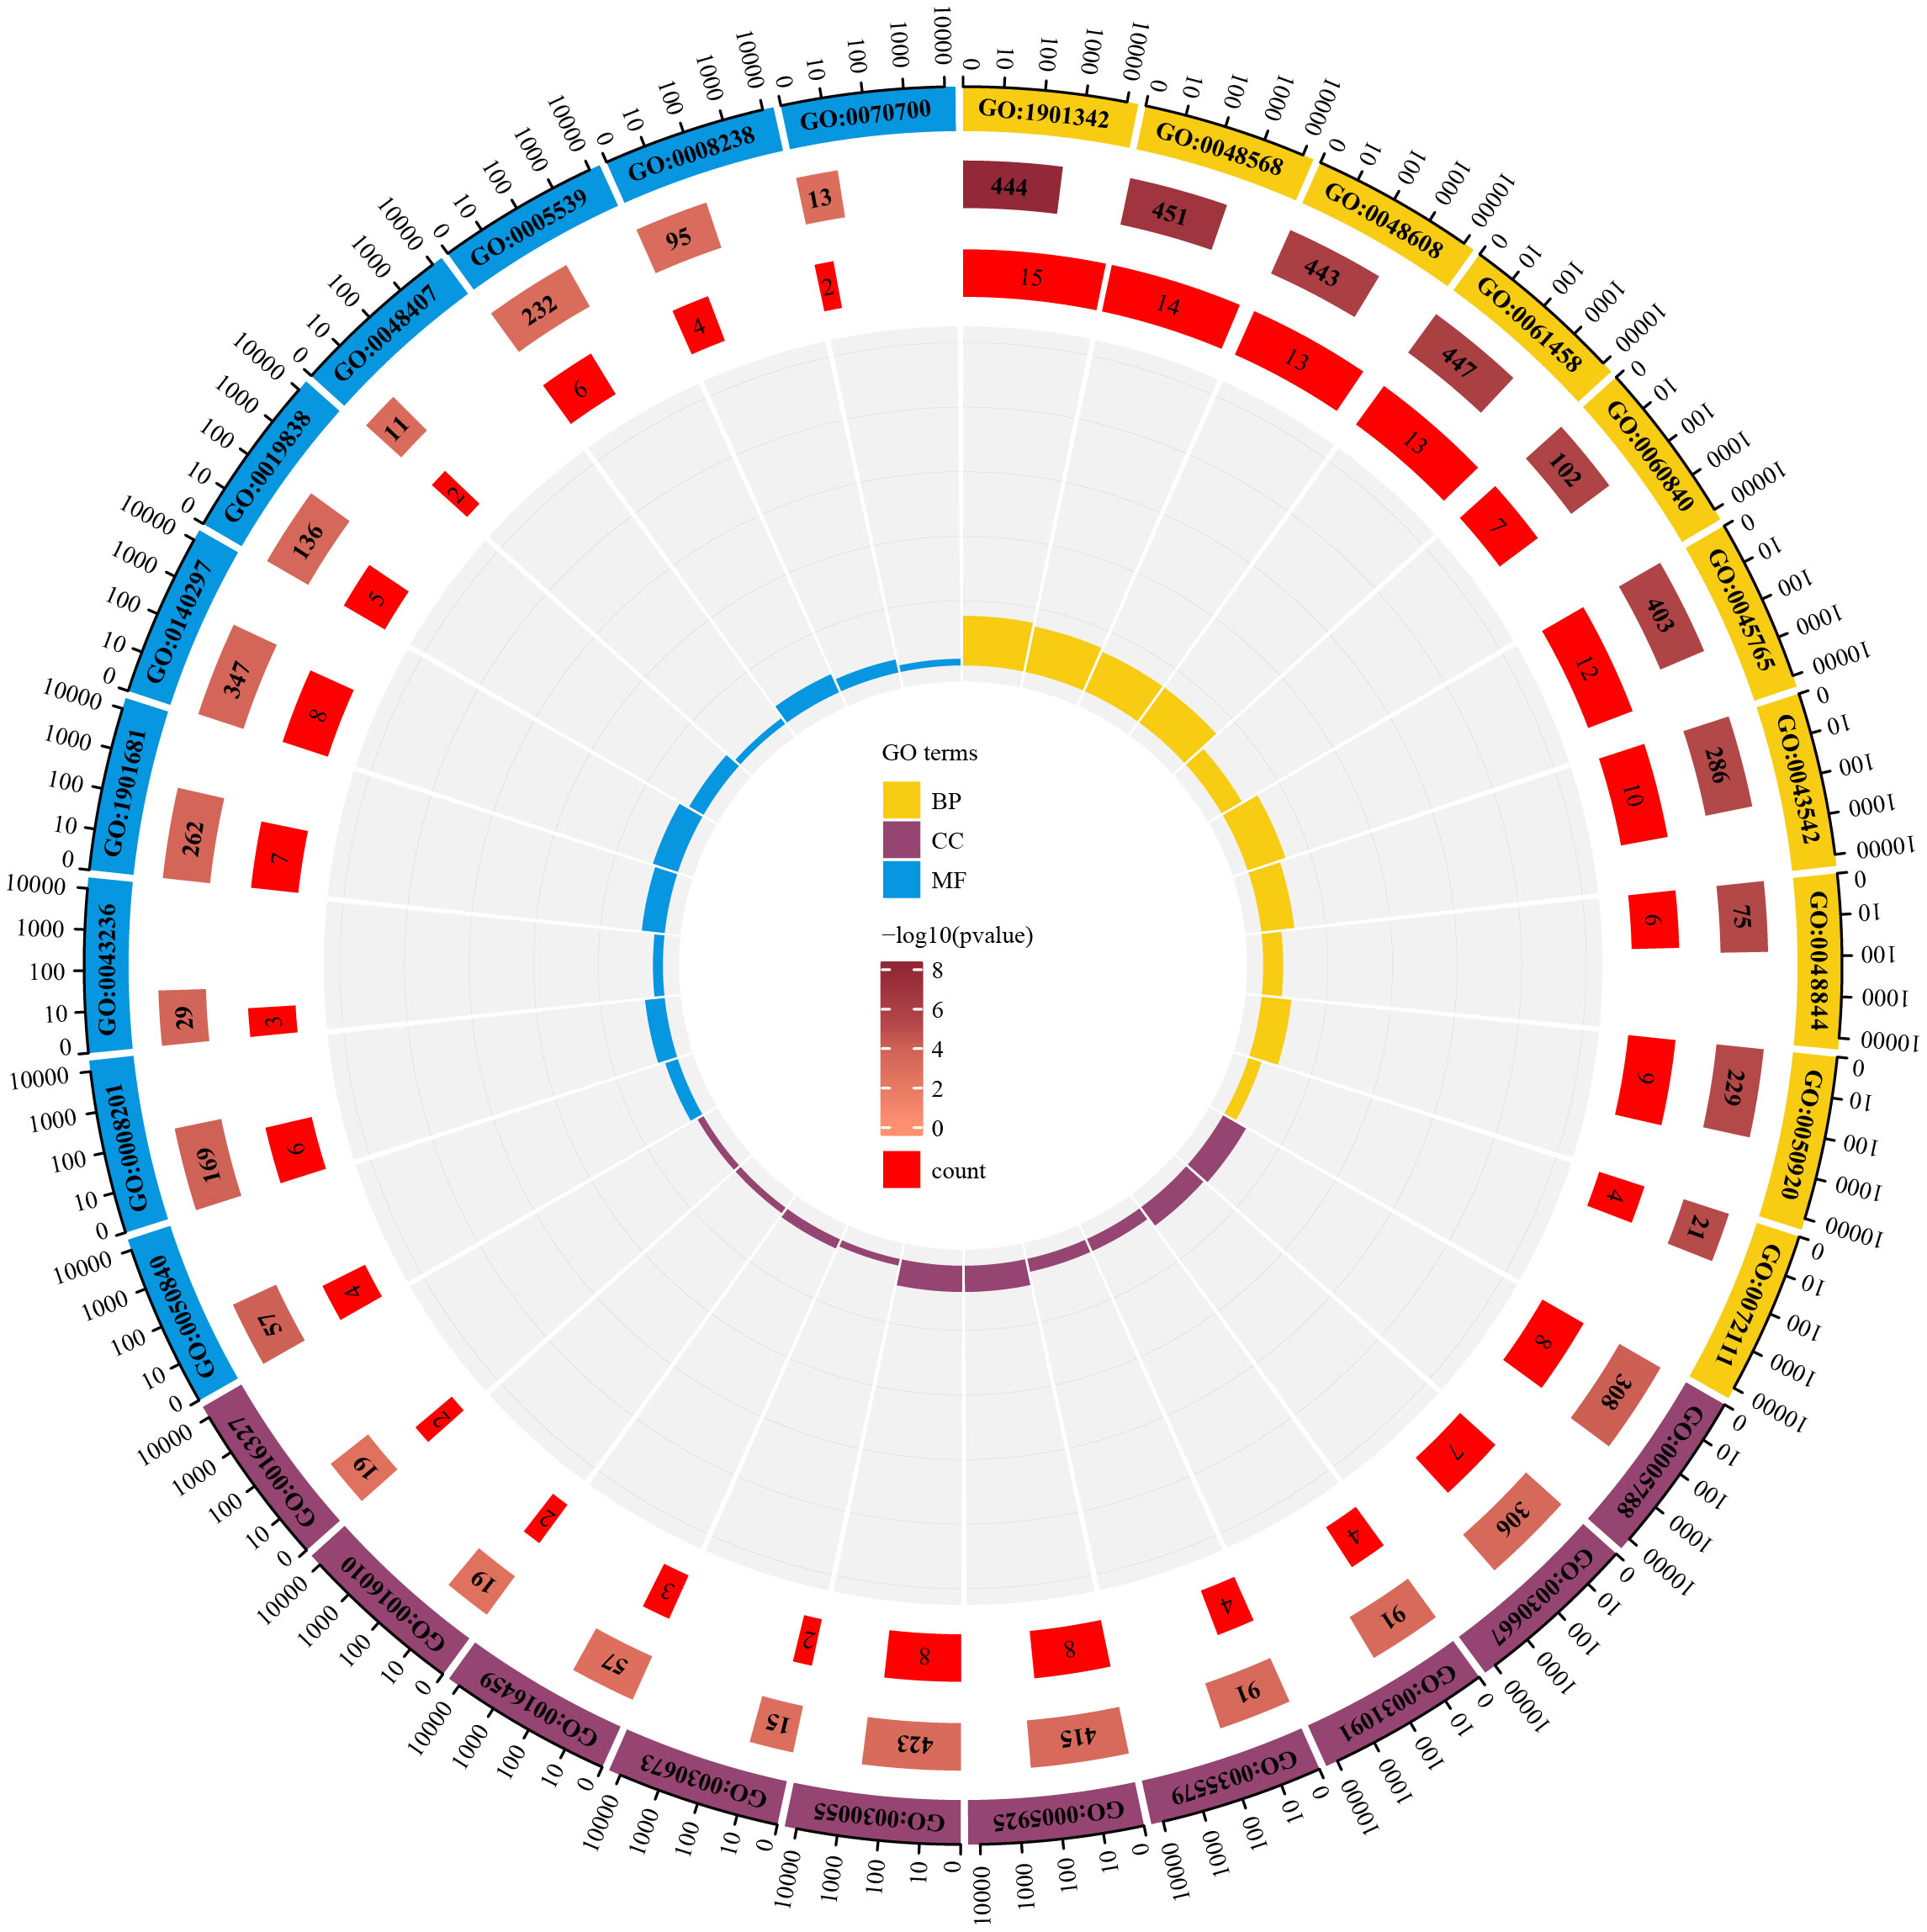
Figure 5 The enrichment circle map for enriched GO terms.
The DO analysis of DEGs depicted that sarcoma, rheumatic disease and systemic scleroderma are mainly enriched (Figure 6A). The top 10 enriched DO pathway terms associations via ribbons to the participating DEGs genes were shown in a chord plot (Figure 6B). The tree plot was used to classify enriched DO. As shown in Figure 6C, the DO enrichment tree plot demonstrated that the DEGs covered the DO main class, involving arthropathy, hepatopulmonary syndrome, scrub typhus, Venezuelan equine encephalitis, supraglottis cancer, collagen disease, scleroderma and arteriovenous malformation.
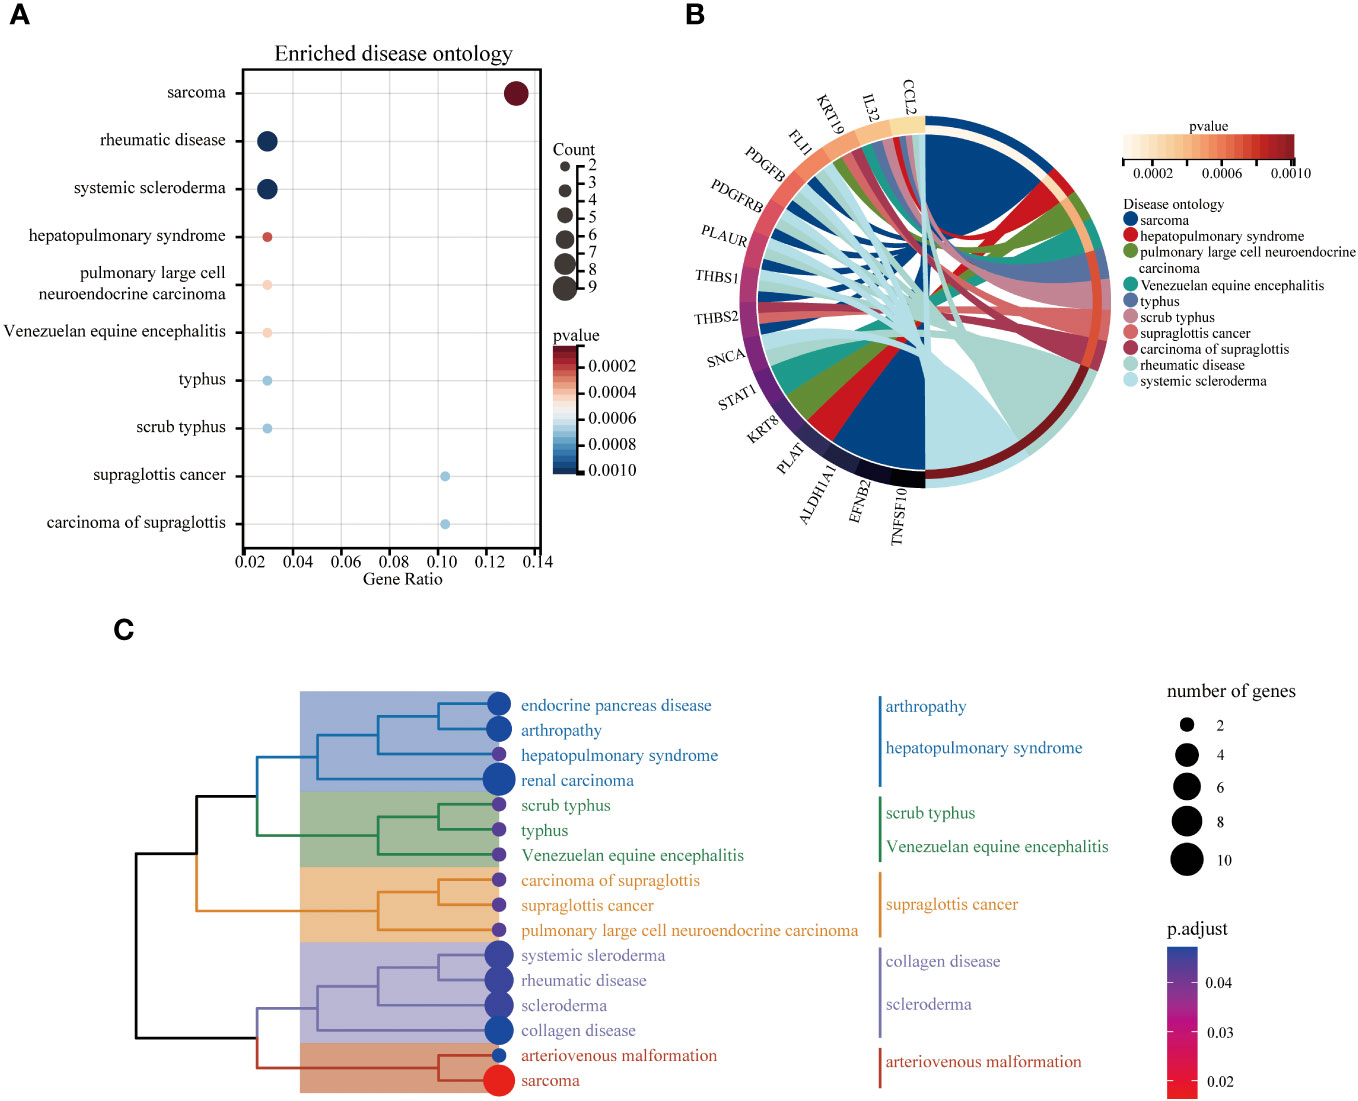
Figure 6 The top 10 enriched DO. The bubble plot showed the top 10 enriched DO for DEGs (A). The chord plot showed the correlation between DEGs and DO (B), and the tree plot showed the enriched DO classification (C).
The PPI network analysis
The STRING database and Cytoscape software were utilized to construct the PPI network of DEGs in GDM, as illustrated in Figure 7A. The six common hub DEGs (including ALDH1A1, BMP4, EFNB2, MME, PLAUR and SLIT2) were ascertained using six algorithms (including MCODE, MCC, Degree, DMNC, MNC and EPC) in cytoHubba, as shown in Figure 7B, Table 6. Subsequently, the relative expressions of these six common hub DEGs were assessed and compared in the GDM and normal samples. Analysis of expression profiles indicated that ALDH1A1, BMP4 and EFNB2 were significantly higher in the patients with GDM compared with the normal samples (P<0.05 for ALDH1A1 and BMP4; P<0.01 for EFNB2) and MME, PLAUR and SLIT2 expression in normal samples was higher than that in patients with GDM (P<0.05 for MME, PLAUR and SLIT2) (Figure 7C). The function of these six hub genes and expression distribution of six identified hub genes in GDM were further investigated, and results showed the expression degree of these six hub genes s in patients with GDM in the following order as ALDH1A1 > EFNB2 > BMP4 > PLAUR > SLIT2 > MME (Figure 7D).
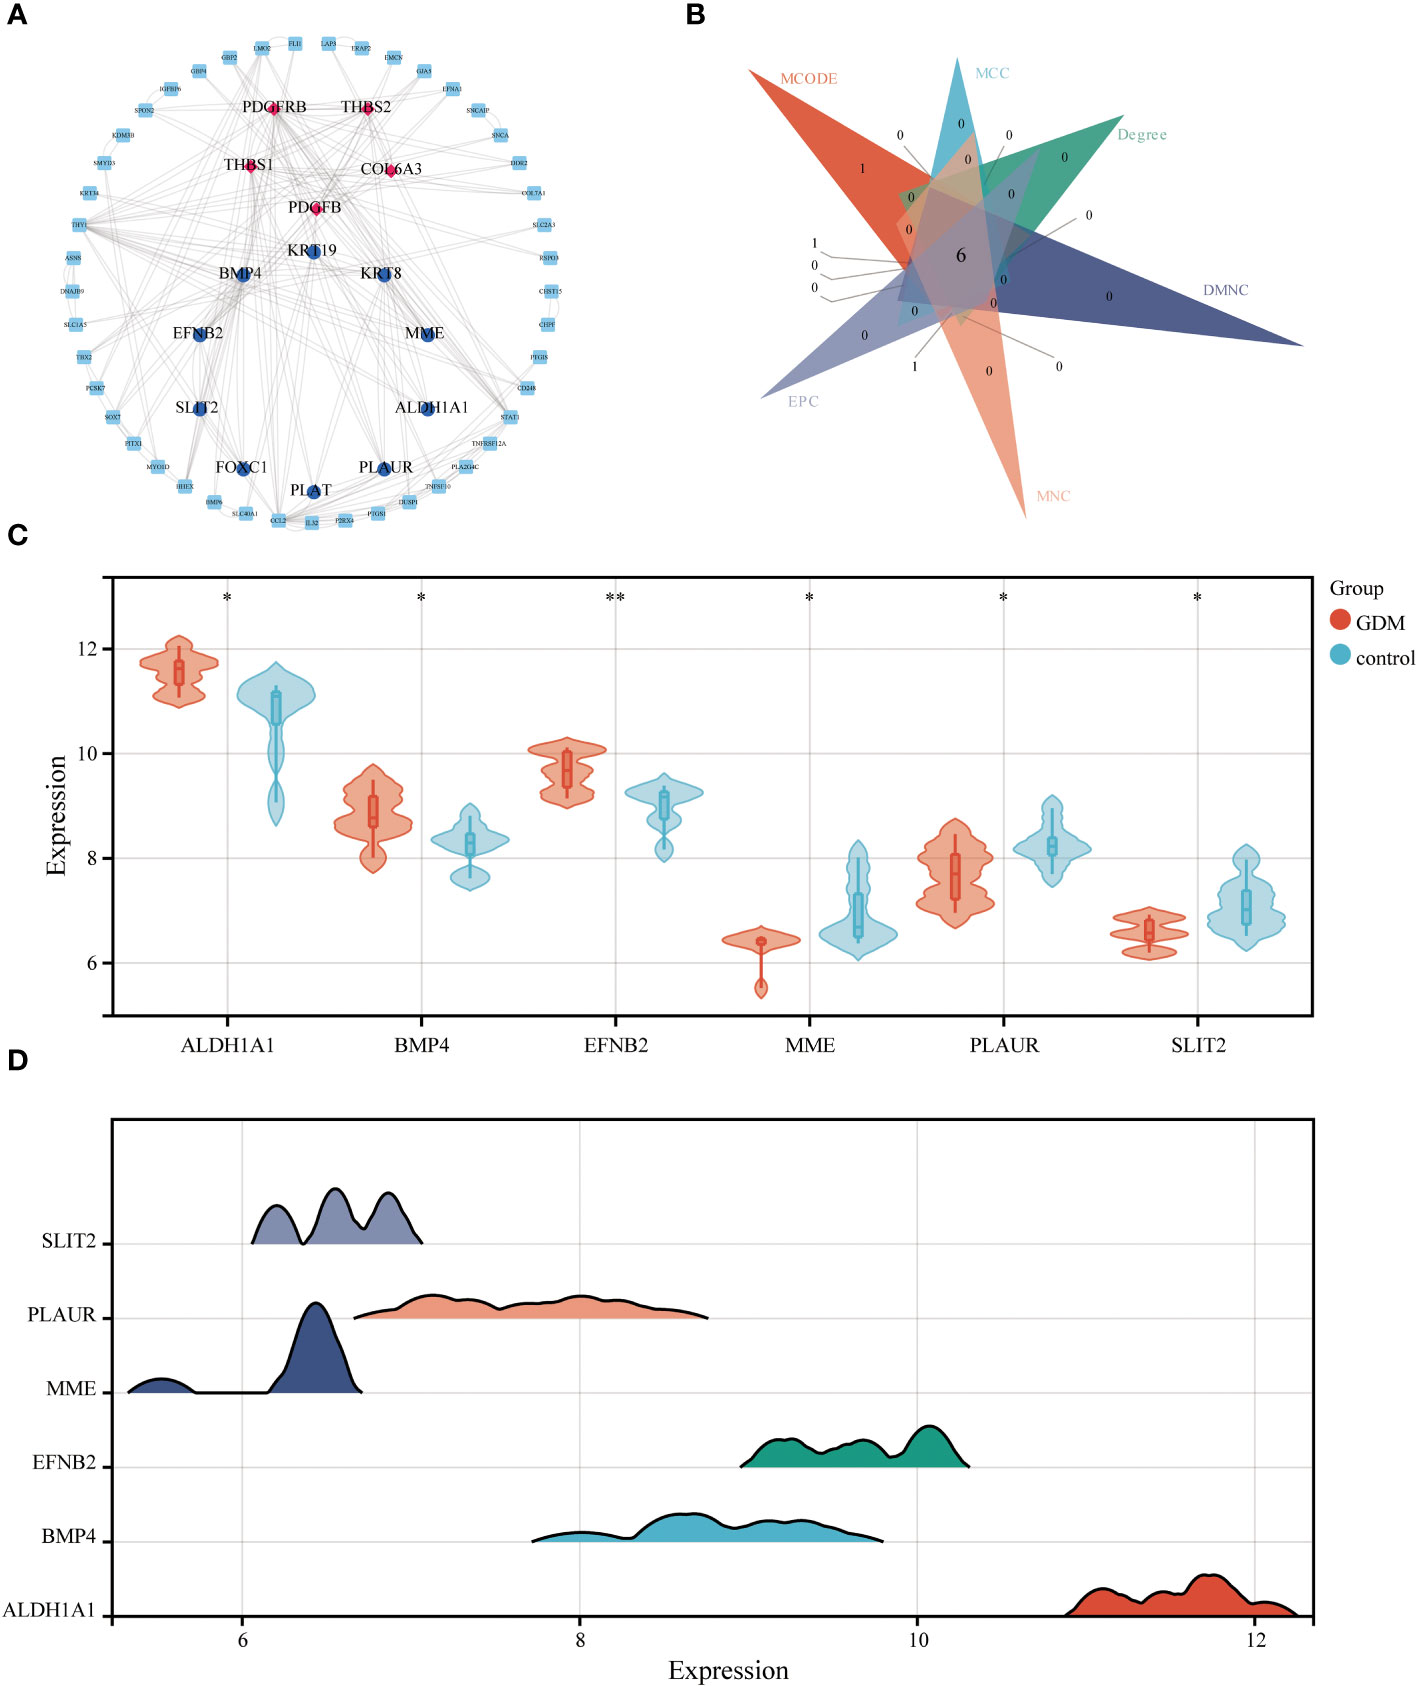
Figure 7 The PPI network analysis. The PPI network of DEGs, the genes with red (Cluster 1) and blue (Cluster 2) identified through MCODE algorithms (A). Six algorithms were utilized to identify hub genes for GDM (B). The differential expression level of 6 identified hub genes in GDM and control samples (C). The expression distribution of 6 identified hub genes in GDM (D) (*p<0.05, **p<0.01).
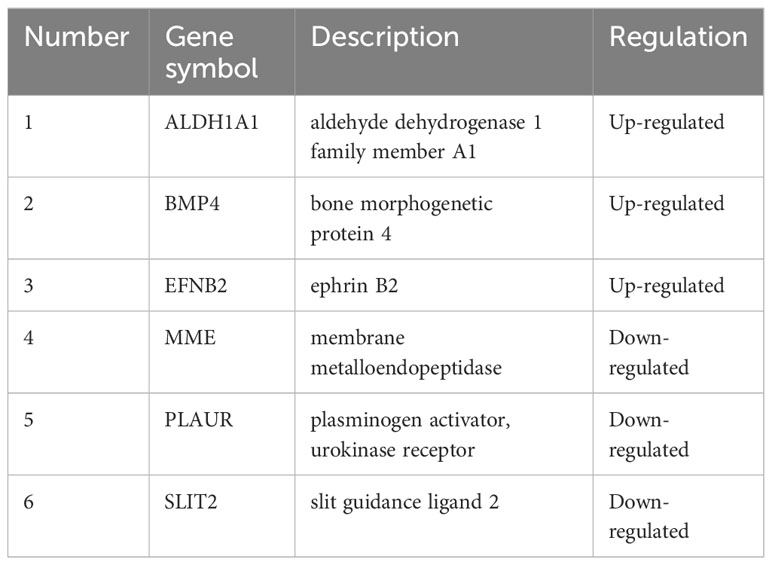
Table 6 The information of identified hub genes.
Correlation between each of the hub genes
After identifying these six hub DEGs, the relationship between the expression levels of hub genes was analyzed and depicted using Spearman’s correlation analysis. As shown in Figures 8A, B, both the correlation heatmap and circle plot indicated that six hub genes were all significantly correlated with each other.
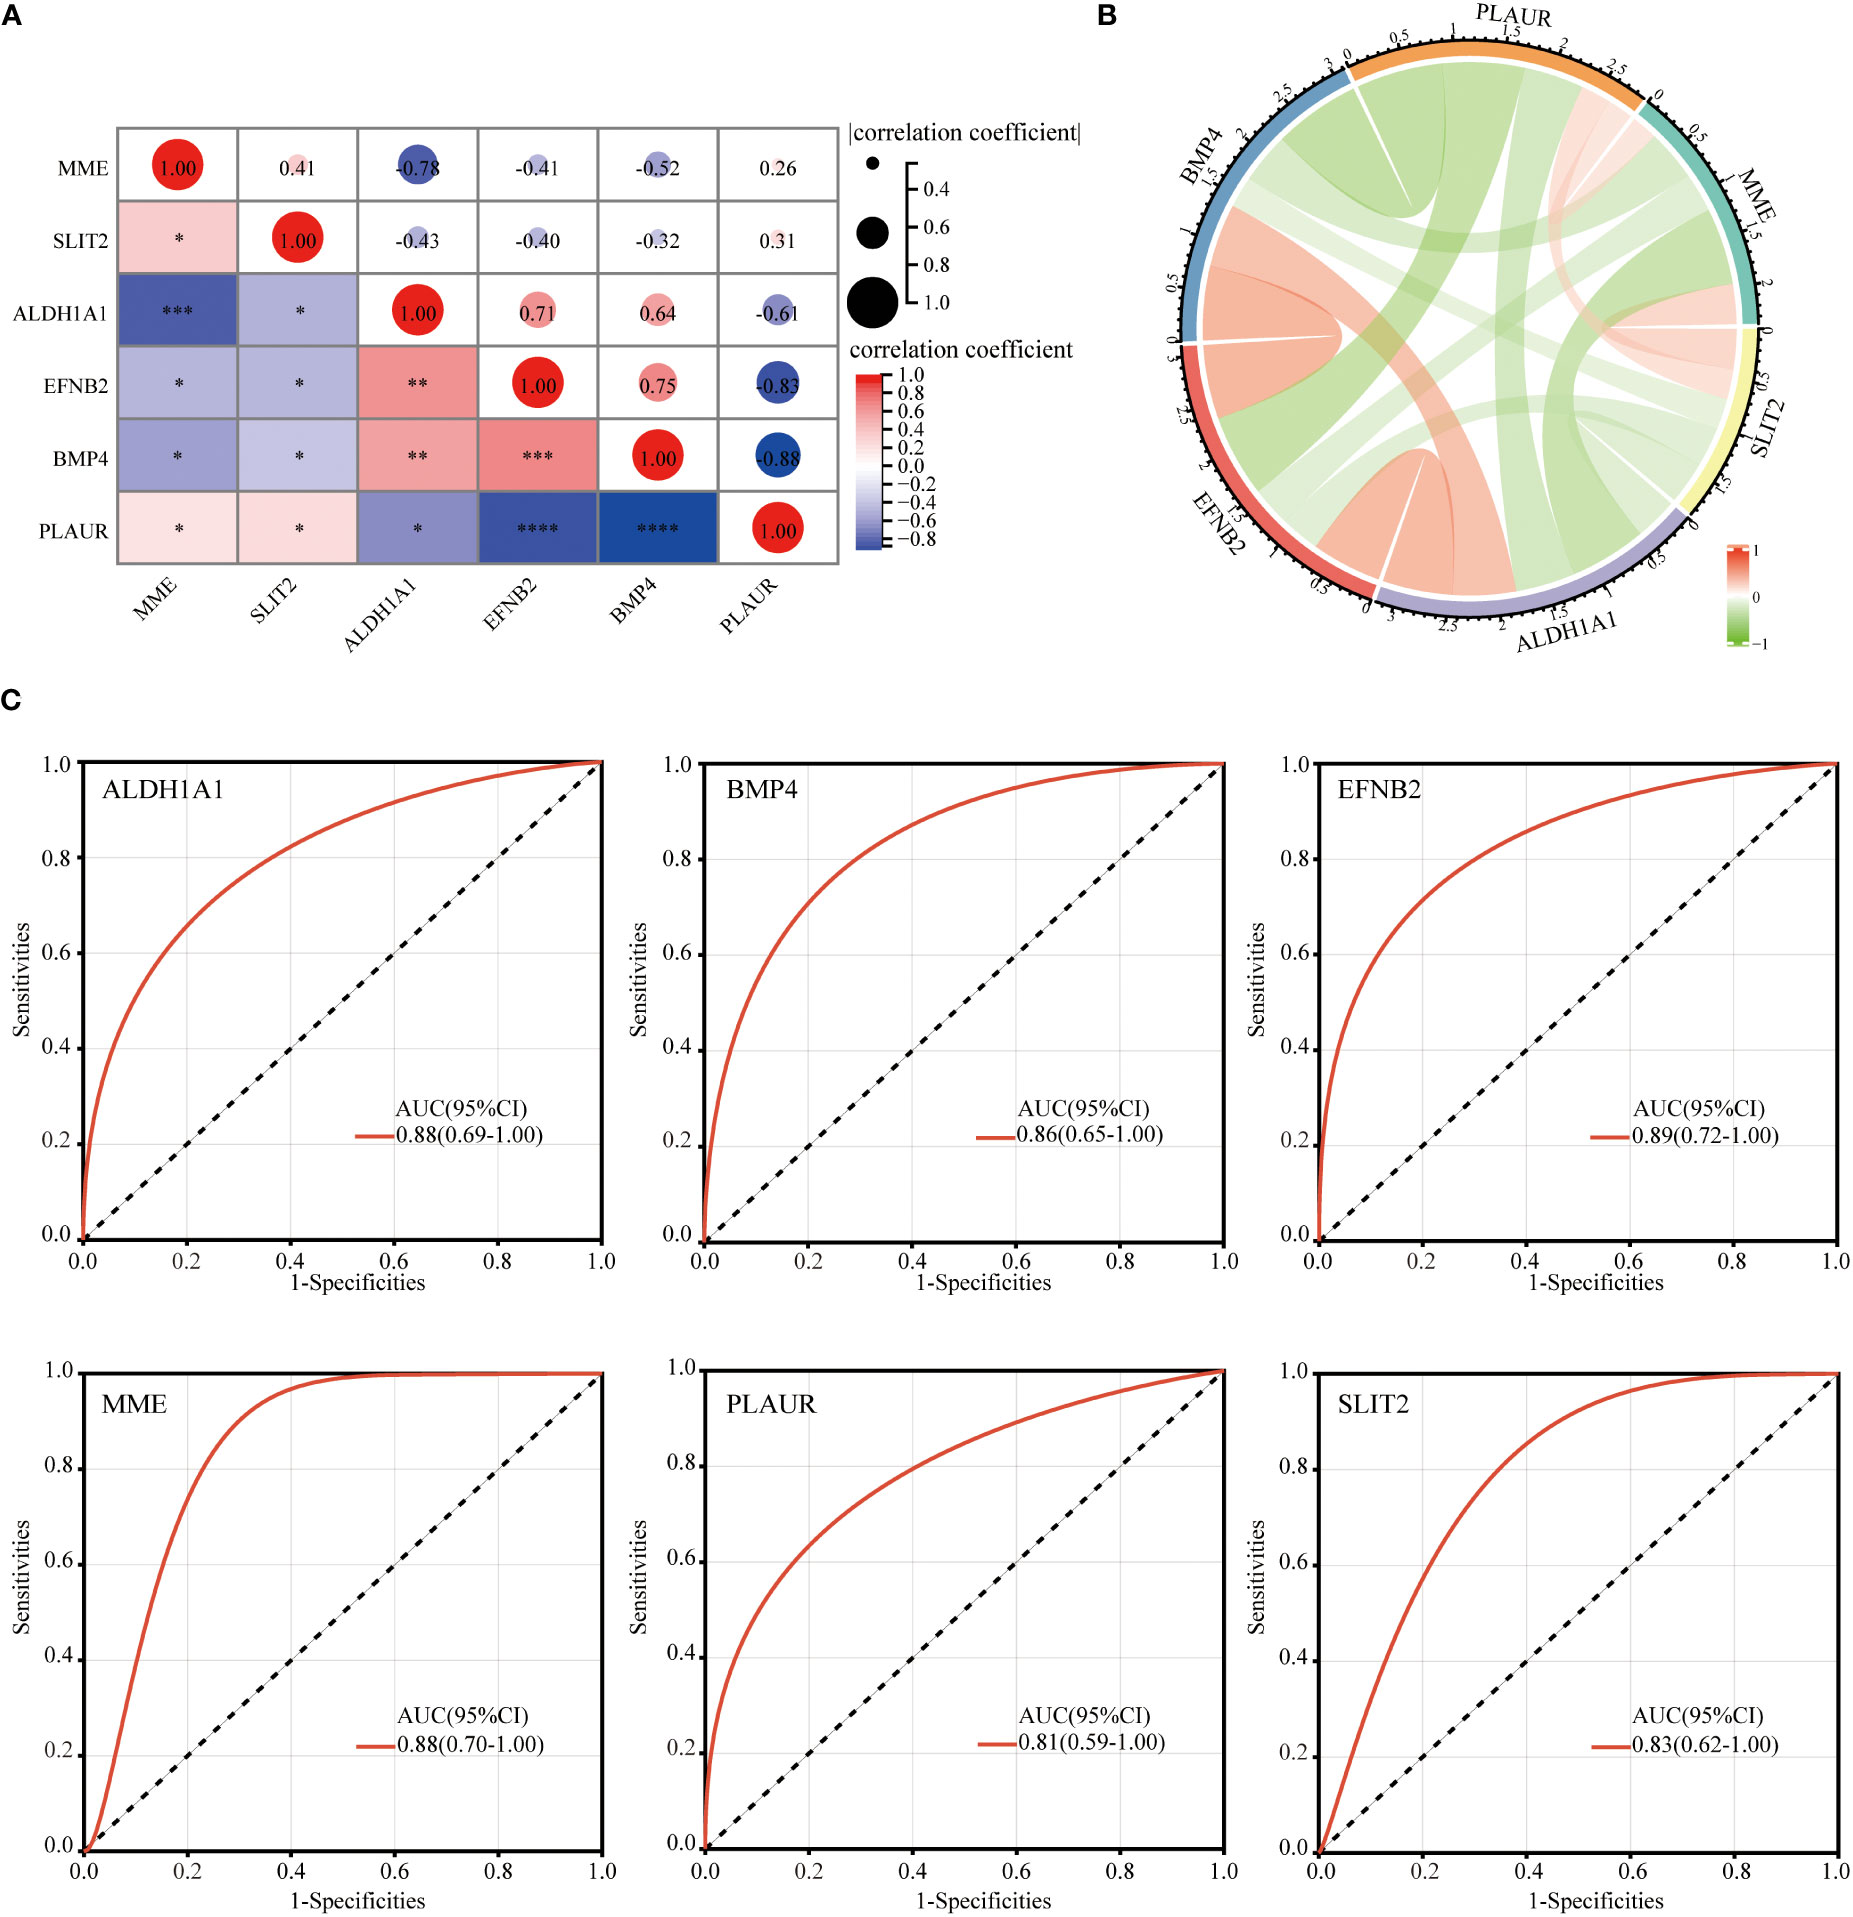
Figure 8 Correlation between each of hub genes and ROC curve analysis. The correlation heatmap (A) and circle plot (B) of 6 identified hub genes. ROC curve diagnostic analysis for evaluating 6 identified hub genes as GDM biomarkers (C) (*p<0.05, **p<0.01, ***p<0.005, ****p<0.001).
ROC curve analysis
The ROC analysis was performed to evaluate the potential of these six hub DEGs as biomarkers for GDM. ROC curve analysis confirmed that AUC was 0.88 (95% confidence interval [CI], 0.69–1.00) for ALDH1A1, 0.86 (95% CI, 0.65–1.00) for BMP4, 0.89 (95% CI, 0.72–1.00) for EFNB2, 0.88 (95% CI, 0.70–1.00) for MME, 0.81 (95% CI, 0.59–1.00) for PLAUR and 0.83 (95% CI, 0.62–1.00) for SLIT2 (Figure 8C). AUC value >0.8 was considered to be statistically significant, which confirmed the accuracy of our risk model.
Immune infiltration analysis of the six hub DEGs in GDM
The CIBERSORT algorithm by R package “IOBR” was performed to accomplish the quantitative immune infiltration analysis of 22 immune cells in GDM and normal samples to further explore the differences in immune cell infiltration in GDM samples and normal tissues. The result demonstrated that the GDM group had higher infiltration of plasma cells, resting CD4+ memory cells, T follicular helper cells, activated NK cells, monocytes, M2 macrophage cells and activated dendritic cells than the normal group, while the normal group had higher naive B cells, M0 macrophage cells and regulatory T cells (Tregs) (Figure 9A). The relative abundance of the 22 kinds of immune cells in the GDM was also analyzed (Figure 9B). In addition, Spearman’s correlation analysis of immune cell abundance revealed the relationship between immune cells (Figure 9C). From the correlation matrix, the positive correlation between B cells memory and NK cells resting was the strongest, while the obvious negative correlation existed between plasma cells and macrophage M2, between T cell CD8 and dendritic cells activated (Figure 9C).
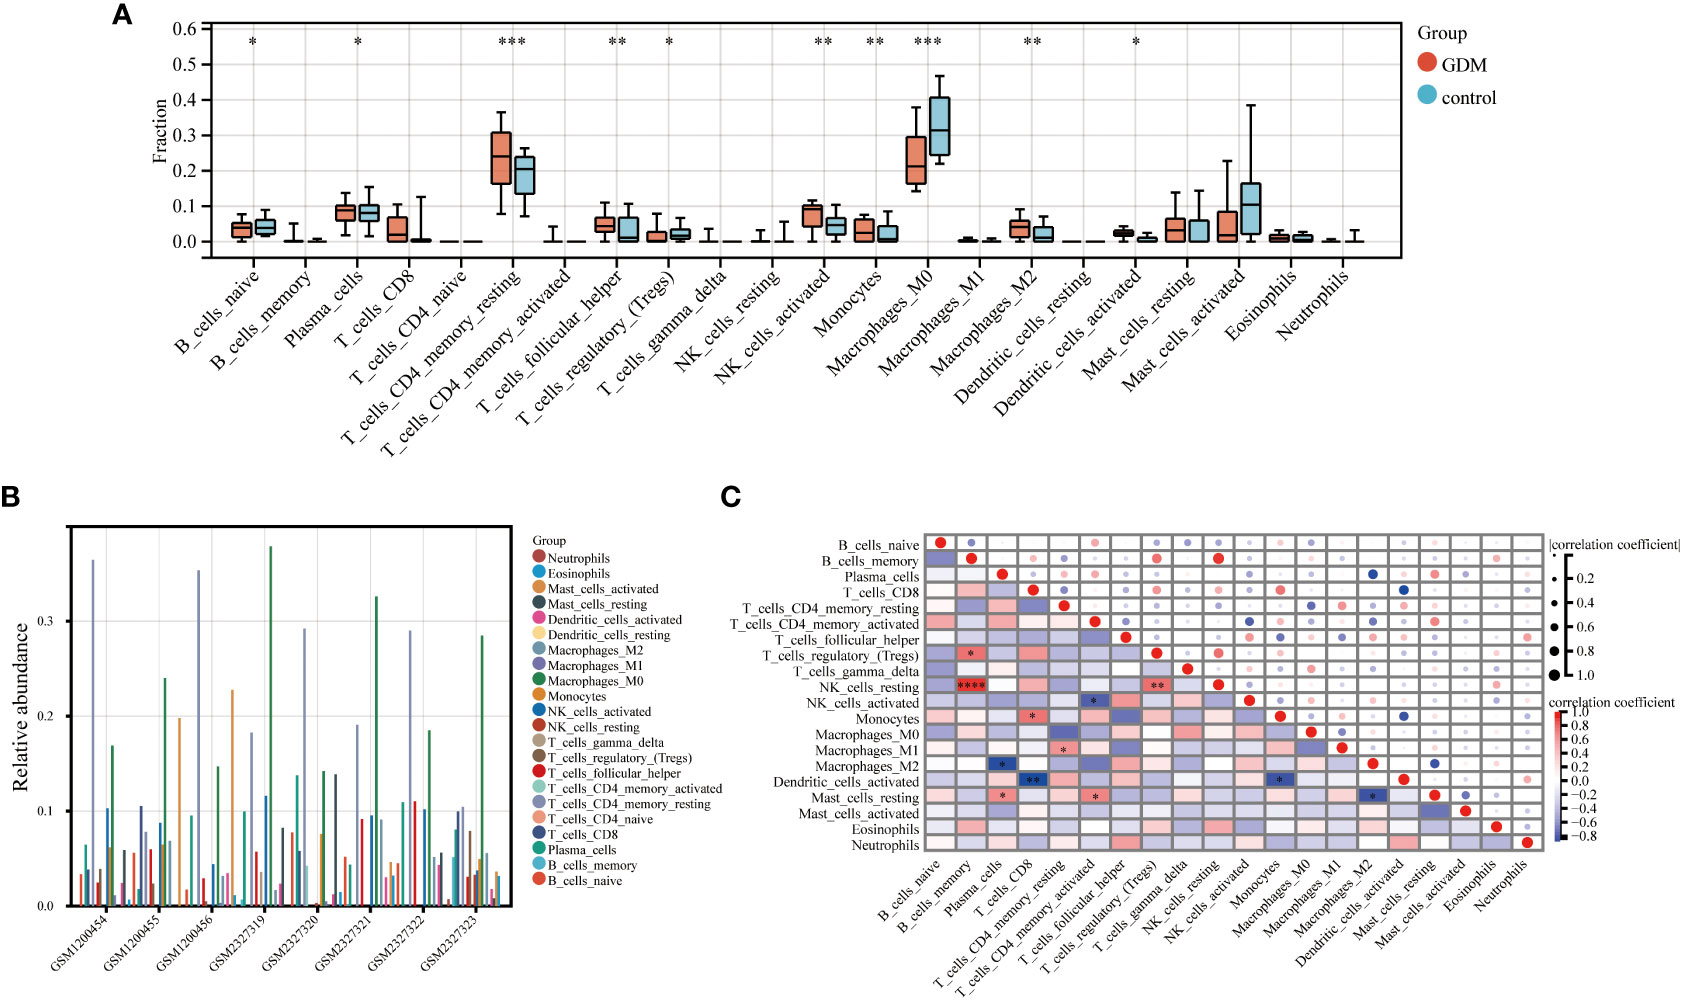
Figure 9 Immune infiltration analysis. The immune infiltration level of 22 immune cells in GDM and control samples (A). The relative abundance of 22 immune cells in GDM samples (B). The correlation between each of 22 immune cells in GDM samples (C). (*p<0.05, **p<0.01, ***p<0.005, ****p<0.001)..
The correlation between the hub genes and immune cells
Spearman’s correlation analysis was used to depict the correlation between the immune cells and these six hub genes to further investigate immune microenvironment-related potential biomarkers for patients with GDM (Figure 10A). Based on the results of correlation analysis, PLAUR displayed the strongest positive correlation with B cells naive (r = 0.83, p = 0.01) (Figure 10B) and strongest negative correlation with T cells follicular helper (r = −0.83, p = 0.02) (Figure 10C).
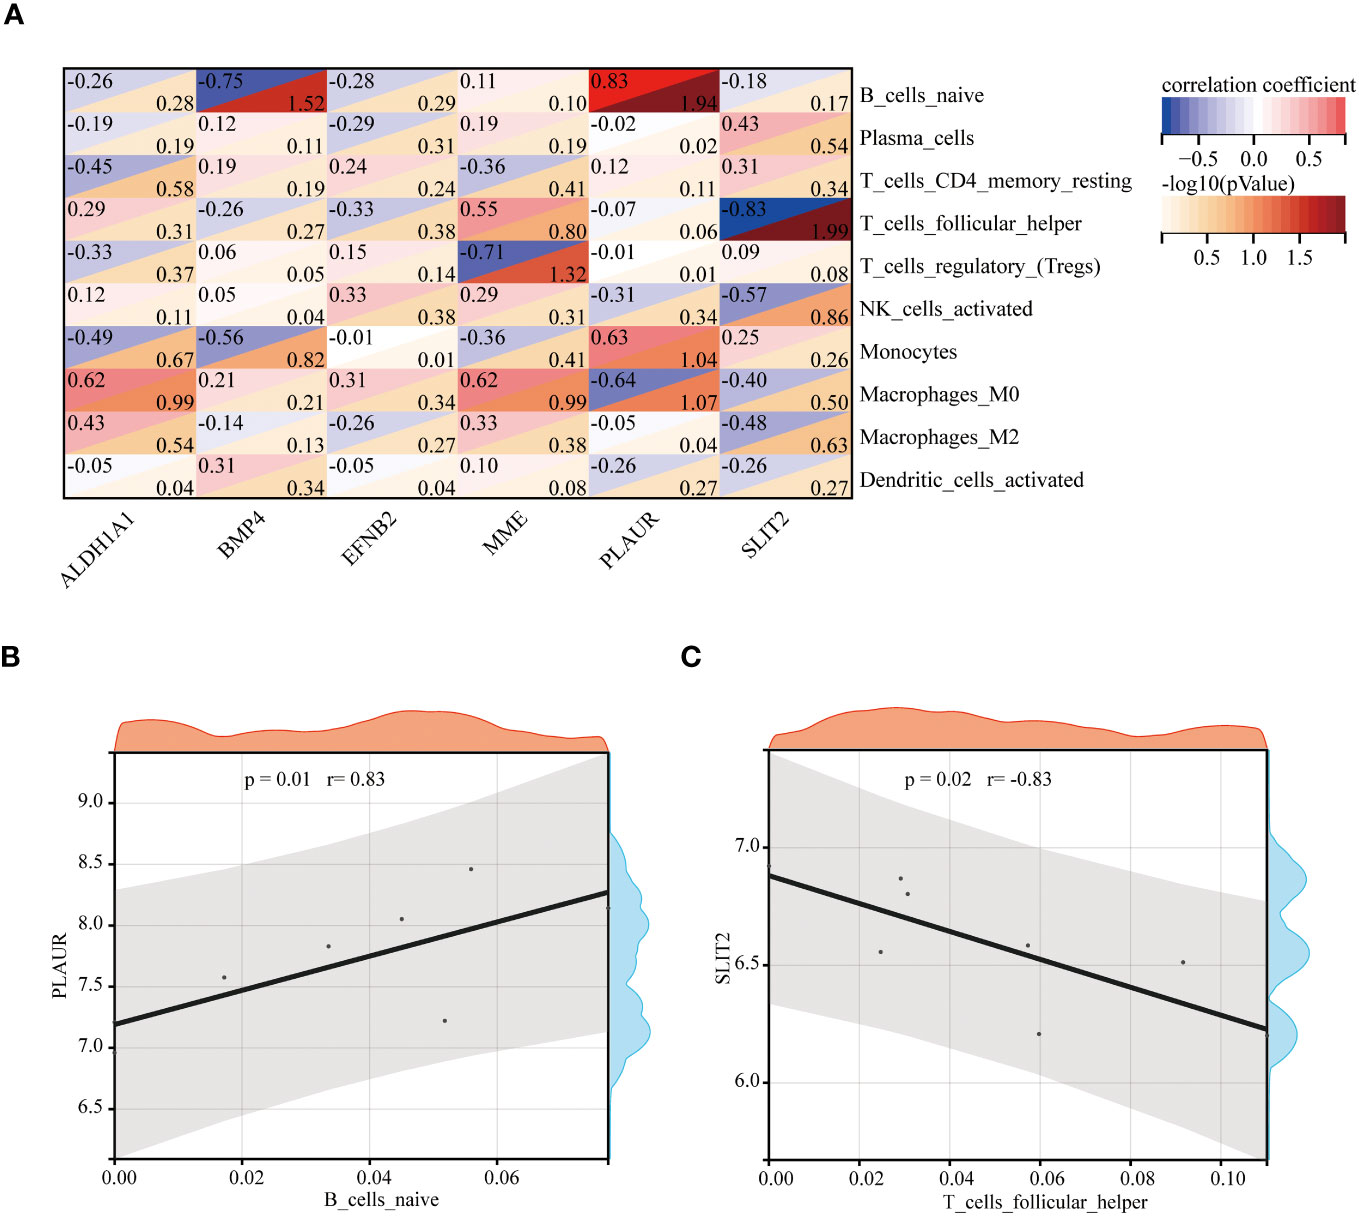
Figure 10 The correlation between the hub genes and the immune cells. The correlation heatmap of 6 hub genes and 10 differentially infiltrating immune cells (A). The strongest positive (B) and negative (C) correlation between hub gene and immune cell.
Discussion
GDM is a critical obstetric complication of pregnancy caused by both genetic and environmental factors (21). Maternal exposure to hyperglycemia leads to glucose stress response and concurrent systemic low-grade inflammation, which involves altered infiltration, differentiation and activation of maternal innate and adaptive immune cells (22). Many studies demonstrated that immune dysfunction induced by hyperglycemia plays a vital role in the development of GDM (23). However, the significance of immune dysfunction and immune-related hub genes in the GDM pathophysiology remains ambiguous. Thus, identifying novel immune-related molecular mechanisms and effective molecular targeted therapies is essential in determining effective GDM treatment strategies along with GDM prevention programs.
In the long term, sustained hyperglycemia can trigger glucose homeostasis, chronic dysregulation (24) and maternal immune imbalance owing to chronic hyperglycemia. This leads to the deterioration of the disease and the further reduction of maternal insulin sensitivity (22). From this point of view, the human primary endothelial cells (HUVECs) collected from the umbilical cord of GDM mothers are an expedient measure to study the hub immune-related biomarkers and their impact on immunity in patients with GDM. In our study, the evidence from the analysis of differential expression profiles of HUVECs from umbilical cords of GDM demonstrated that 107 DEGs were identified between GDM mothers and the mother without GDM. The KEGG analysis depicted that these DEGs were the most significantly enriched in cytokine-cytokine receptor interaction, which was similar to previous studies showing that the interaction pathway was elevated in the fecal microbiota of patients with GDM (25). Moreover, these DEGs were also enriched in fluid shear stress and atherosclerosis, axon guidance, transcriptional misregulation in cancer and focal adhesion in the KEGG pathway analysis. Zhu et al. demonstrated that axon guidance enriched the KEGG pathway in GDM arterial endothelial cell samples (26). The GO analysis revealed that its molecular function was related to the vasculature, embryonic organ, reproductive structure and reproductive system development, suggesting that sustained hyperglycemia in patients with GDM was related to embryonic development. We also performed the DO analysis to explore the function of 107 DEGs, and the results revealed these DEGs also were the most significantly enriched in sarcoma. Currently, no studies have shown a correlation between sarcoma and GDM. A case report indicated that an infant whose mother had diabetes had inborn cardiac sarcomas (27). Although there is a lack of evidence, it undoubtedly further suggests that maternal GDM may have harmful effects on embryonic development.
After identifying the function of 107 DEGs, the scope was narrowed down using six algorithms of cytoHubaa to further determine the hub DEGs and performed the ROC analysis to assess the accuracy of the hub DEGs as the diagnostic biomarkers in patients with GDM. The results showed that the AUC value of these six hub DEGs (ALDH1A1, BMP4, EFNB2, MME, PLAUR and SLIT2) was > 0.8, which suggested these six hub DEGs can serve as diagnostic biomarkers for distinguishing patients with GDM from normal individuals. To further screen hub genes related to the immune microenvironment, we evaluated the association between the expression of hub genes and immune cell infiltration. According to the analysis, PLAUR was the most significant and strongest positive correlation with naive B cells, and SLIT2 was the most significant and strongest negative with T follicular helper cells. In this study, PLAUR and SLIT2 were considered as the two potential immune-related biomarkers. Compared to the umbilical cords sample from the mother without GDM, PLAUR and SLIT2 were down-regulated in the GDM samples, and naive B cell, as well as T cells follicular helper, were upregulated, which suggested PLAUR may be a promoting factor for B cell naive, while SLIT2 may be a negative factor for T cells follicular helper in GDM samples.
The PLAUR participates in regulating various physiological and pathological processes, including cellular adhesion, cell motility and angiogenesis (28). Few reports showed the relationship between PLAUR and GDM. Our study first proposed the relationship between PLAUR and immune regulation in GDM. SLIT2 is a regulator of inflammatory response and glucose metabolism. Kang et al. indicated that circulating SLIT2 level was negatively correlated with serum glucose in patients with diabetes (29). Kang et al. reported that SLIT2 level in the maternal peripheral blood in patients with GDM was negatively associated with blood glucose in neonates (30). Our study also proposed the relationship between SLIT2 and immune regulation in GDM.
In conclusion, we comprehensively analyzed the gene expression profile based on the RNA-seq data with umbilical cords of eight GDM and eight mothers without GDM from the GEO database and evaluated the function, diagnostic value and immune infiltration of hub DEGs in GDM. Our analysis pointed out six hub DEGs with high diagnostic value, and among them, PLAUR and SLIT2 were considered as two biomarkers, which had the strongest correlation with B cells naïve and T cells follicular helper, respectively. However, these results should be further validated in animal models with GDM in the future, and further investigation into the molecular functions of immune-related hub genes may facilitate a better understanding of more efficient treatment strategies against GDM.
Data availability statement
The datasets presented in this study can be found in online repositories. The names of the repository/repositories and accession number(s) can be found in the article/Supplementary Material.
Author contributions
JC: Data curation, Formal analysis, Writing – original draft. HD: Data curation, Formal analysis, Writing – original draft. XK: Formal analysis, Writing – original draft. HC: Writing –original draft, Writing – review & editing. JW: Writing – review & editing, Writing – original draft.
Funding
The author(s) declare financial support was received for the research, authorship, and/or publication of this article. This research was supported by the Natural Science Foundation of Guangdong Province, grant number 2114050001690 and 2020 Li Ka Shing Foundation Cross-Disciplinary Research Grant (Project Number: 2020LKSFG11B).
Conflict of interest
The authors declare that the research was conducted in the absence of any commercial or financial relationships that could be construed as a potential conflict of interest.
Publisher’s note
All claims expressed in this article are solely those of the authors and do not necessarily represent those of their affiliated organizations, or those of the publisher, the editors and the reviewers. Any product that may be evaluated in this article, or claim that may be made by its manufacturer, is not guaranteed or endorsed by the publisher.
Supplementary material
The Supplementary Material for this article can be found online at: https://www.frontiersin.org/articles/10.3389/fimmu.2024.1296855/full#supplementary-material
Supplementary Figure 1 | The study design.
Abbreviations
AUC, Areas under the ROC curve; BP, Biological process; CC, Cellular component; CVD, Cardiovascular disease; DEGs, Differentially expressed genes; DO, Disease ontology; GDM, Gestational diabetes mellitus; GEO, Gene Expression Omnibus; GO, Gene Ontology; IR, Insulin resistance; KEGG, Kyoto Encyclopedia of Genes and Genomes; MCODE, Molecular Complex Detection; MF, Molecular function; PPI, Protein-protein interaction; ROC, Receiver operating characteristic; T2DM, Type 2 diabetes.
References
1. Tan YX, Hu SM, You YP, Yang GL, Wang W. Replication of previous genome-wide association studies of HKDC1, BACE2, SLC16A11 and TMEM163 SNPs in a gestational diabetes mellitus case-control sample from Han Chinese population. Diabetes Metab Syndr Obes (2019) 12:983–9. doi: 10.2147/dmso.S207019
2. Alduayji MM, Selim M. Risk factors of gestational diabetes mellitus among women attending an antenatal care clinic in prince sultan military medical city (PSMMC), Riyadh, kingdom of Saudi Arabia: A case-control study. Cureus (2023) 15(8):e44200. doi: 10.7759/cureus.44200
3. Szmuilowicz ED, Josefson JL, Metzger BE. Gestational diabetes mellitus. Endocrinol Metab Clin North Am (2019) 48(3):479–93. doi: 10.1016/j.ecl.2019.05.001
4. Johns EC, Denison FC, Norman JE, Reynolds RM. Gestational diabetes mellitus: mechanisms, treatment, and complications. Trends Endocrinol Metab (2018) 29(11):743–54. doi: 10.1016/j.tem.2018.09.004
5. Li S, Zhang Y, Sun Y, Zhang G, Bai J, Guo J, et al. Naringenin improves insulin sensitivity in gestational diabetes mellitus mice through AMPK. Nutr Diabetes (2019) 9(1):28. doi: 10.1038/s41387-019-0095-8
6. de la Torre NG, Assaf-Balut C, Jiménez Varas I, Del Valle L, Durán A, Fuentes M, et al. Effectiveness of following Mediterranean diet recommendations in the real world in the incidence of gestational diabetes mellitus (GDM) and adverse maternal-foetal outcomes: A prospective, universal, interventional study with a single group. The St Carlos study. Nutrients (2019) 11(6):1210. doi: 10.3390/nu11061210
7. Gortazar L, Flores-Le Roux JA, Benaiges D, Sarsanedas E, Payà A, Mañé L, et al. Trends in prevalence of gestational diabetes and perinatal outcomes in Catalonia, Spain, 2006 to 2015: the Diagestcat Study. Diabetes Metab Res Rev (2019) 35(5):e3151. doi: 10.1002/dmrr.3151
8. Ovesen PG, Jensen DM, Damm P, Rasmussen S, Kesmodel US. Maternal and neonatal outcomes in pregnancies complicated by gestational diabetes. a nation-wide study. J Matern Fetal Neonatal Med (2015) 28(14):1720–4. doi: 10.3109/14767058.2014.966677
9. Fan HM, Mitchell AL, Bellafante E, McIlvride S, Primicheru LI, Giorgi M, et al. Sulfated progesterone metabolites that enhance insulin secretion via TRPM3 are reduced in serum from women with gestational diabetes mellitus. Diabetes (2022) 71(4):837–52. doi: 10.2337/db21-0702
10. Sharma S, Banerjee S, Krueger PM, Blois SM. Immunobiology of gestational diabetes mellitus in post-medawar era. Front Immunol (2021) 12:758267. doi: 10.3389/fimmu.2021.758267
11. De Luccia TPB, Pendeloski KPT, Ono E, Mattar R, Pares DBS, Yazaki Sun S, et al. Unveiling the pathophysiology of gestational diabetes: Studies on local and peripheral immune cells. Scand J Immunol (2020) 91(4):e12860. doi: 10.1111/sji.12860
12. Zhang Z, Kang X, Guo Y, Zhang J, Xie J, Shao S, et al. Association of circulating galectin-3 with gestational diabetes mellitus, progesterone, and insulin resistance. J Diabetes (2021) 13(1):54–62. doi: 10.1111/1753-0407.13088
13. Cao W, Wang X, Chen T, Xu W, Feng F, Zhao S, et al. Maternal lipids, BMI and IL-17/IL-35 imbalance in concurrent gestational diabetes mellitus and preeclampsia. Exp Ther Med (2018) 16(1):427–35. doi: 10.3892/etm.2018.6144
14. Smith SE, Li J, Garbett K, Mirnics K, Patterson PH. Maternal immune activation alters fetal brain development through interleukin-6. J Neurosci (2007) 27(40):10695–702. doi: 10.1523/jneurosci.2178-07.2007
15. Lee Y, Awasthi A, Yosef N, Quintana FJ, Xiao S, Peters A, et al. Induction and molecular signature of pathogenic TH17 cells. Nat Immunol (2012) 13(10):991–9. doi: 10.1038/ni.2416
16. Hauguel-de Mouzon S, Guerre-Millo M. The placenta cytokine network and inflammatory signals. Placenta (2006) 27(8):794–8. doi: 10.1016/j.placenta.2005.08.009
17. Amirian A, Mahani MB, Abdi F. Role of interleukin-6 (IL-6) in predicting gestational diabetes mellitus. Obstet Gynecol Sci (2020) 63(4):407–16. doi: 10.5468/ogs.20020
18. Radaelli T, Varastehpour A, Catalano P, Hauguel-de Mouzon S. Gestational diabetes induces placental genes for chronic stress and inflammatory pathways. Diabetes (2003) 52(12):2951–8. doi: 10.2337/diabetes.52.12.2951
19. Yu Z, Liu J, Zhang R, Huang X, Sun T, Wu Y, et al. IL-37 and 38 signalling in gestational diabetes. J Reprod Immunol (2017) 124:8–14. doi: 10.1016/j.jri.2017.09.011
20. Mrizak I, Grissa O, Henault B, Fekih M, Bouslema A, Boumaiza I, et al. Placental infiltration of inflammatory markers in gestational diabetic women. Gen Physiol Biophys (2014) 33(2):169–76. doi: 10.4149/gpb_2013075
21. Behboudi-Gandevani S, Amiri M, Bidhendi Yarandi R, Ramezani Tehrani F. The impact of diagnostic criteria for gestational diabetes on its prevalence: a systematic review and meta-analysis. Diabetol Metab Syndr (2019) 11:11. doi: 10.1186/s13098-019-0406-1
22. McElwain CJ, McCarthy FP, McCarthy CM. Gestational diabetes mellitus and maternal immune dysregulation: what we know so far. Int J Mol Sci (2021) 22(8):4261. doi: 10.3390/ijms22084261
23. Berbudi A, Rahmadika N, Tjahjadi AI, Ruslami R. Type 2 diabetes and its impact on the immune system. Curr Diabetes Rev (2020) 16(5):442–9. doi: 10.2174/1573399815666191024085838
24. Ambra R, Manca S, Palumbo MC, Leoni G, Natarelli L, De Marco A, et al. Transcriptome analysis of human primary endothelial cells (HUVEC) from umbilical cords of gestational diabetic mothers reveals candidate sites for an epigenetic modulation of specific gene expression. Genomics (2014) 103(5-6):337–48. doi: 10.1016/j.ygeno.2014.03.003
25. Dong L, Han L, Duan T, Lin S, Li J, Liu X. Integrated microbiome-metabolome analysis reveals novel associations between fecal microbiota and hyperglycemia-related changes of plasma metabolome in gestational diabetes mellitus. RSC Adv (2020) 10(4):2027–36. doi: 10.1039/c9ra07799e
26. Zhu W, Shen Y, Liu J, Fei X, Zhang Z, Li M, et al. Epigenetic alternations of microRNAs and DNA methylation contribute to gestational diabetes mellitus. J Cell Mol Med (2020) 24(23):13899–912. doi: 10.1111/jcmm.15984
27. Vakrilova L, Marinov R, Hitrova-Nikolova S, Dobrev D, Denev M, Lazarov S. Cardiac myosarcoma in a newborn infant-A case report and literature review. Front Cardiovasc Med (2021) 8:675202. doi: 10.3389/fcvm.2021.675202
28. Caiolfa VR, Zamai M, Malengo G, Andolfo A, Madsen CD, Sutin J, et al. Monomer dimer dynamics and distribution of GPI-anchored uPAR are determined by cell surface protein assemblies. J Cell Biol (2007) 179(5):1067–82. doi: 10.1083/jcb.200702151
29. Kang YE, Choung S, Lee JH, Kim HJ, Ku BJ. The role of circulating slit2, the one of the newly Batokines, in human diabetes mellitus. Endocrinol Metab (Seoul) (2017) 32(3):383–8. doi: 10.3803/EnM.2017.32.3.383
Keywords: gestational diabetes mellitus, diagnostic value, immune-related hub DEGs, PLAUR, SLIT2
Citation: Chen J-l, Dai H-f, Kan X-c, Wu J and Chen H-W (2024) The integrated bioinformatic analysis identifies immune microenvironment-related potential biomarkers for patients with gestational diabetes mellitus. Front. Immunol. 15:1296855. doi: 10.3389/fimmu.2024.1296855
Received: 20 September 2023; Accepted: 22 January 2024;
Published: 21 February 2024.
Edited by:
Giovanni Tossetta, Marche Polytechnic University, ItalyReviewed by:
Eleni Hadjigeorgiou, Cyprus University of Technology, CyprusFederica Piani, University of Bologna, Italy
Copyright © 2024 Chen, Dai, Kan, Wu and Chen. This is an open-access article distributed under the terms of the Creative Commons Attribution License (CC BY). The use, distribution or reproduction in other forums is permitted, provided the original author(s) and the copyright owner(s) are credited and that the original publication in this journal is cited, in accordance with accepted academic practice. No use, distribution or reproduction is permitted which does not comply with these terms.
*Correspondence: Jie Wu, Jiewu@stu.edu.cn; Hong-Wu Chen, chenhw_2022@163.com
†These authors have contributed equally to this work