 Ying Li
 Xin Wang
 Zitong Zhang
 Lei Shi
 Liang Cheng
 Xue Zhang
- 1Human Molecular Genetics Group, National Health Commission (NHC) Key Laboratory of Molecular Probes and Targeted Diagnosis and Therapy, The Fourth Affiliated Hospital, Harbin Medical University, Harbin, China
- 2Department of Child and Adolescent Health, School of Public Health, Harbin Medical University, Harbin, China
- 3National Health Commission (NHC) Key Laboratory of Molecular Probes and Targeted Diagnosis and Therapy, Harbin Medical University, Harbin, China
- 4College of Bioinformatics Science and Technology, Harbin Medical University, Harbin, China
- 5Department of Medical Genetics, College of Basic Medical Sciences, Harbin Medical University, Harbin, China
Background: Obesity is a metabolic and chronic inflammatory disease involving genetic and environmental factors. This study aimed to investigate the causal relationship among gut microbiota abundance, plasma metabolomics, peripheral cell (blood and immune cell) counts, inflammatory cytokines, and obesity.
Methods: Summary statistics of 191 gut microbiota traits (N = 18,340), 1,400 plasma metabolite traits (N = 8,299), 128 peripheral cell counts (blood cells, N = 408,112; immune cells, N = 3,757), 41 inflammatory cytokine traits (N = 8,293), and 6 obesity traits were obtained from publicly available genome-wide association studies. Two-sample Mendelian randomization (MR) analysis was applied to infer the causal links using inverse variance-weighted, maximum likelihood, MR-Egger, weighted median, weighted mode, and Wald ratio methods. Several sensitivity analyses were also utilized to ensure reliable MR results. Finally, we used mediation analysis to identify the pathway from gut microbiota to obesity mediated by plasma metabolites, peripheral cells, and inflammatory cytokines.
Results: MR revealed a causal effect of 44 gut microbiota taxa, 281 plasma metabolites, 27 peripheral cells, and 8 inflammatory cytokines on obesity. Among them, five shared causal gut microbiota taxa belonged to the phylum Actinobacteria, order Bifidobacteriales, family Bifidobacteriaceae, genus Lachnospiraceae UCG008, and species Eubacterium nodatum group. Furthermore, we screened 42 shared causal metabolites, 7 shared causal peripheral cells, and 1 shared causal inflammatory cytokine. Based on known causal metabolites, we observed that the metabolic pathways of D-arginine, D-ornithine, linoleic acid, and glycerophospholipid metabolism were closely related to obesity. Finally, mediation analysis revealed 20 mediation relationships, including the causal pathway from gut microbiota to obesity, mediated by 17 metabolites, 2 peripheral cells, and 1 inflammatory cytokine. Sensitivity analysis represented no heterogeneity or pleiotropy in this study.
Conclusion: Our findings support a causal relationship among gut microbiota, plasma metabolites, peripheral cells, inflammatory cytokines, and obesity. These biomarkers provide new insights into the mechanisms underlying obesity and contribute to its prevention, diagnosis, and treatment.
1 Introduction
Obesity, a complex metabolic disease, arises from an imbalance between energy intake and expenditure, leading to excess energy storage in adipose tissues. Its etiology is multifaceted, involving both genetic and environmental factors. Presently, approximately one-third of the global population is overweight (defined as a body mass index [BMI] between 25 and 29 kg/m²), with 10% classified as obese (BMI ≥ 30 kg/m2) (1). This global epidemic poses significant risks to physical and mental health, being a primary contributor to various diseases, including cardiovascular issues, allergic conditions, hypertension, type 2 diabetes (T2D), cancer, and mood-related disorders (2–4). Thus, obesity is a serious public health concern.
In recent years, increasing evidence has shown that an imbalance in the gut microbiota may play a major role in obesity (5). The gut microbiota is a microbial community living in the human intestine that plays an important role in human metabolic regulation and immunomodulation via interactions with the host (6, 7). The diversity and richness of the gut microbiota in obese patients are reduced, and the composition of the gut microbiota changes to varying degrees (8, 9). For example, an increased Firmicutes to Bacteroidetes ratio may play a role in the development of obesity (8, 10). A case-control study found that Enterobacteriaceae levels were increased, whereas Desulfovibrio and Akkermansia muciniphila levels were decreased in overweight and obese children (11).
Metabolomics can reveal correlations between metabolites or metabolic pathways and physiological and pathological changes, thus providing new information for research on disease mechanisms (12). Multiple studies have shown that metabolites and metabolic pathways are closely associated with obesity and that obese patients have metabolic disorders (13, 14). For example, a study using targeted serum metabolomics identified metabolites significantly associated with obesity. In that study, serum concentrations of glycine, glutamine, and glycero-phosphatidylcholine (Pcaa) 42:0 were positively correlated, whereas those of PCaa 32:0, PCaa 32:1, and PCaa 40:5 were negatively correlated with obesity (14). In addition, plasma metabolites, such as branched-chain amino acids and glutamate, may mediate the relationship between the gut microbiota and obesity (15).
Obesity is a chronic inflammatory disease closely related to the immune system and inflammatory responses (16). Adipose tissue macrophages are key contributors to obesity-related inflammation, accounting for less than 10% of the immune cells in lean individuals and up to 50% in obese individuals (17). Additionally, a higher white blood cell count may be associated with an increased risk of obesity. After weight loss, total white blood cells, major components, neutrophils, and lymphocytes significantly decrease (18, 19). There is also an increasing number of reports on the relationship between inflammatory cytokines and the risk of obesity. Previous studies have shown that the increase in the levels of pro-inflammatory cytokines interleukin (IL)-1, IL-6, and tumor necrosis factor alpha is closely related to the occurrence and development of obesity (20, 21). In addition, research has shown decreased serum levels of IL-27 in obese individuals. IL-27 can act directly on adipocytes and lead to adipocyte differentiation and thermogenesis, thus reducing weight and improving metabolic diseases, such as T2D (22).
While previous studies have identified associations between the gut microbiome, metabolome, immune inflammation, and obesity, the precise causal relationships and their respective mediation proportions remain unclear. Mendelian randomization (MR) analysis is an effective method that uses genetic variation as an instrumental variable (IV) to evaluate the potential causal relationship between exposures and outcomes (23). This minimizes the impact of confounding factors on causal estimation, as genetic variations are randomly assigned at conception. Mediation analysis is used to evaluate the effects of an exposure on an outcome through a mediator (24). Therefore, we conducted MR analyses based on publicly available genome-wide association study (GWAS) summary data to evaluate the causal relationship among the gut microbiota, plasma metabolites, peripheral cells, inflammatory cytokines, and obesity, and to identify pathways from the gut microbiota to obesity mediated by plasma metabolites, peripheral cells, and inflammatory cytokines.
2 Methods
2.1 Study design
The study flowchart is illustrated in Figure 1. First, we obtained published GWAS summary data that included traits such as gut microbiota, plasma metabolites, peripheral cells, inflammatory cytokines, and obesity (Supplementary Table S1). Second, two-sample MR analyses were used to evaluate the causal relationship among gut microbiota, plasma metabolites, peripheral cells, inflammatory cytokines, and obesity. Finally, two-step and multivariable MR (MVMR) analyses were used to identify the mediation effect of plasma metabolites, peripheral cells, and inflammatory cytokines on the relationship between gut microbiota and obesity. Our MR study was conducted in accordance with the STROBE-MR guidelines (Supplementary Table S2) (25).
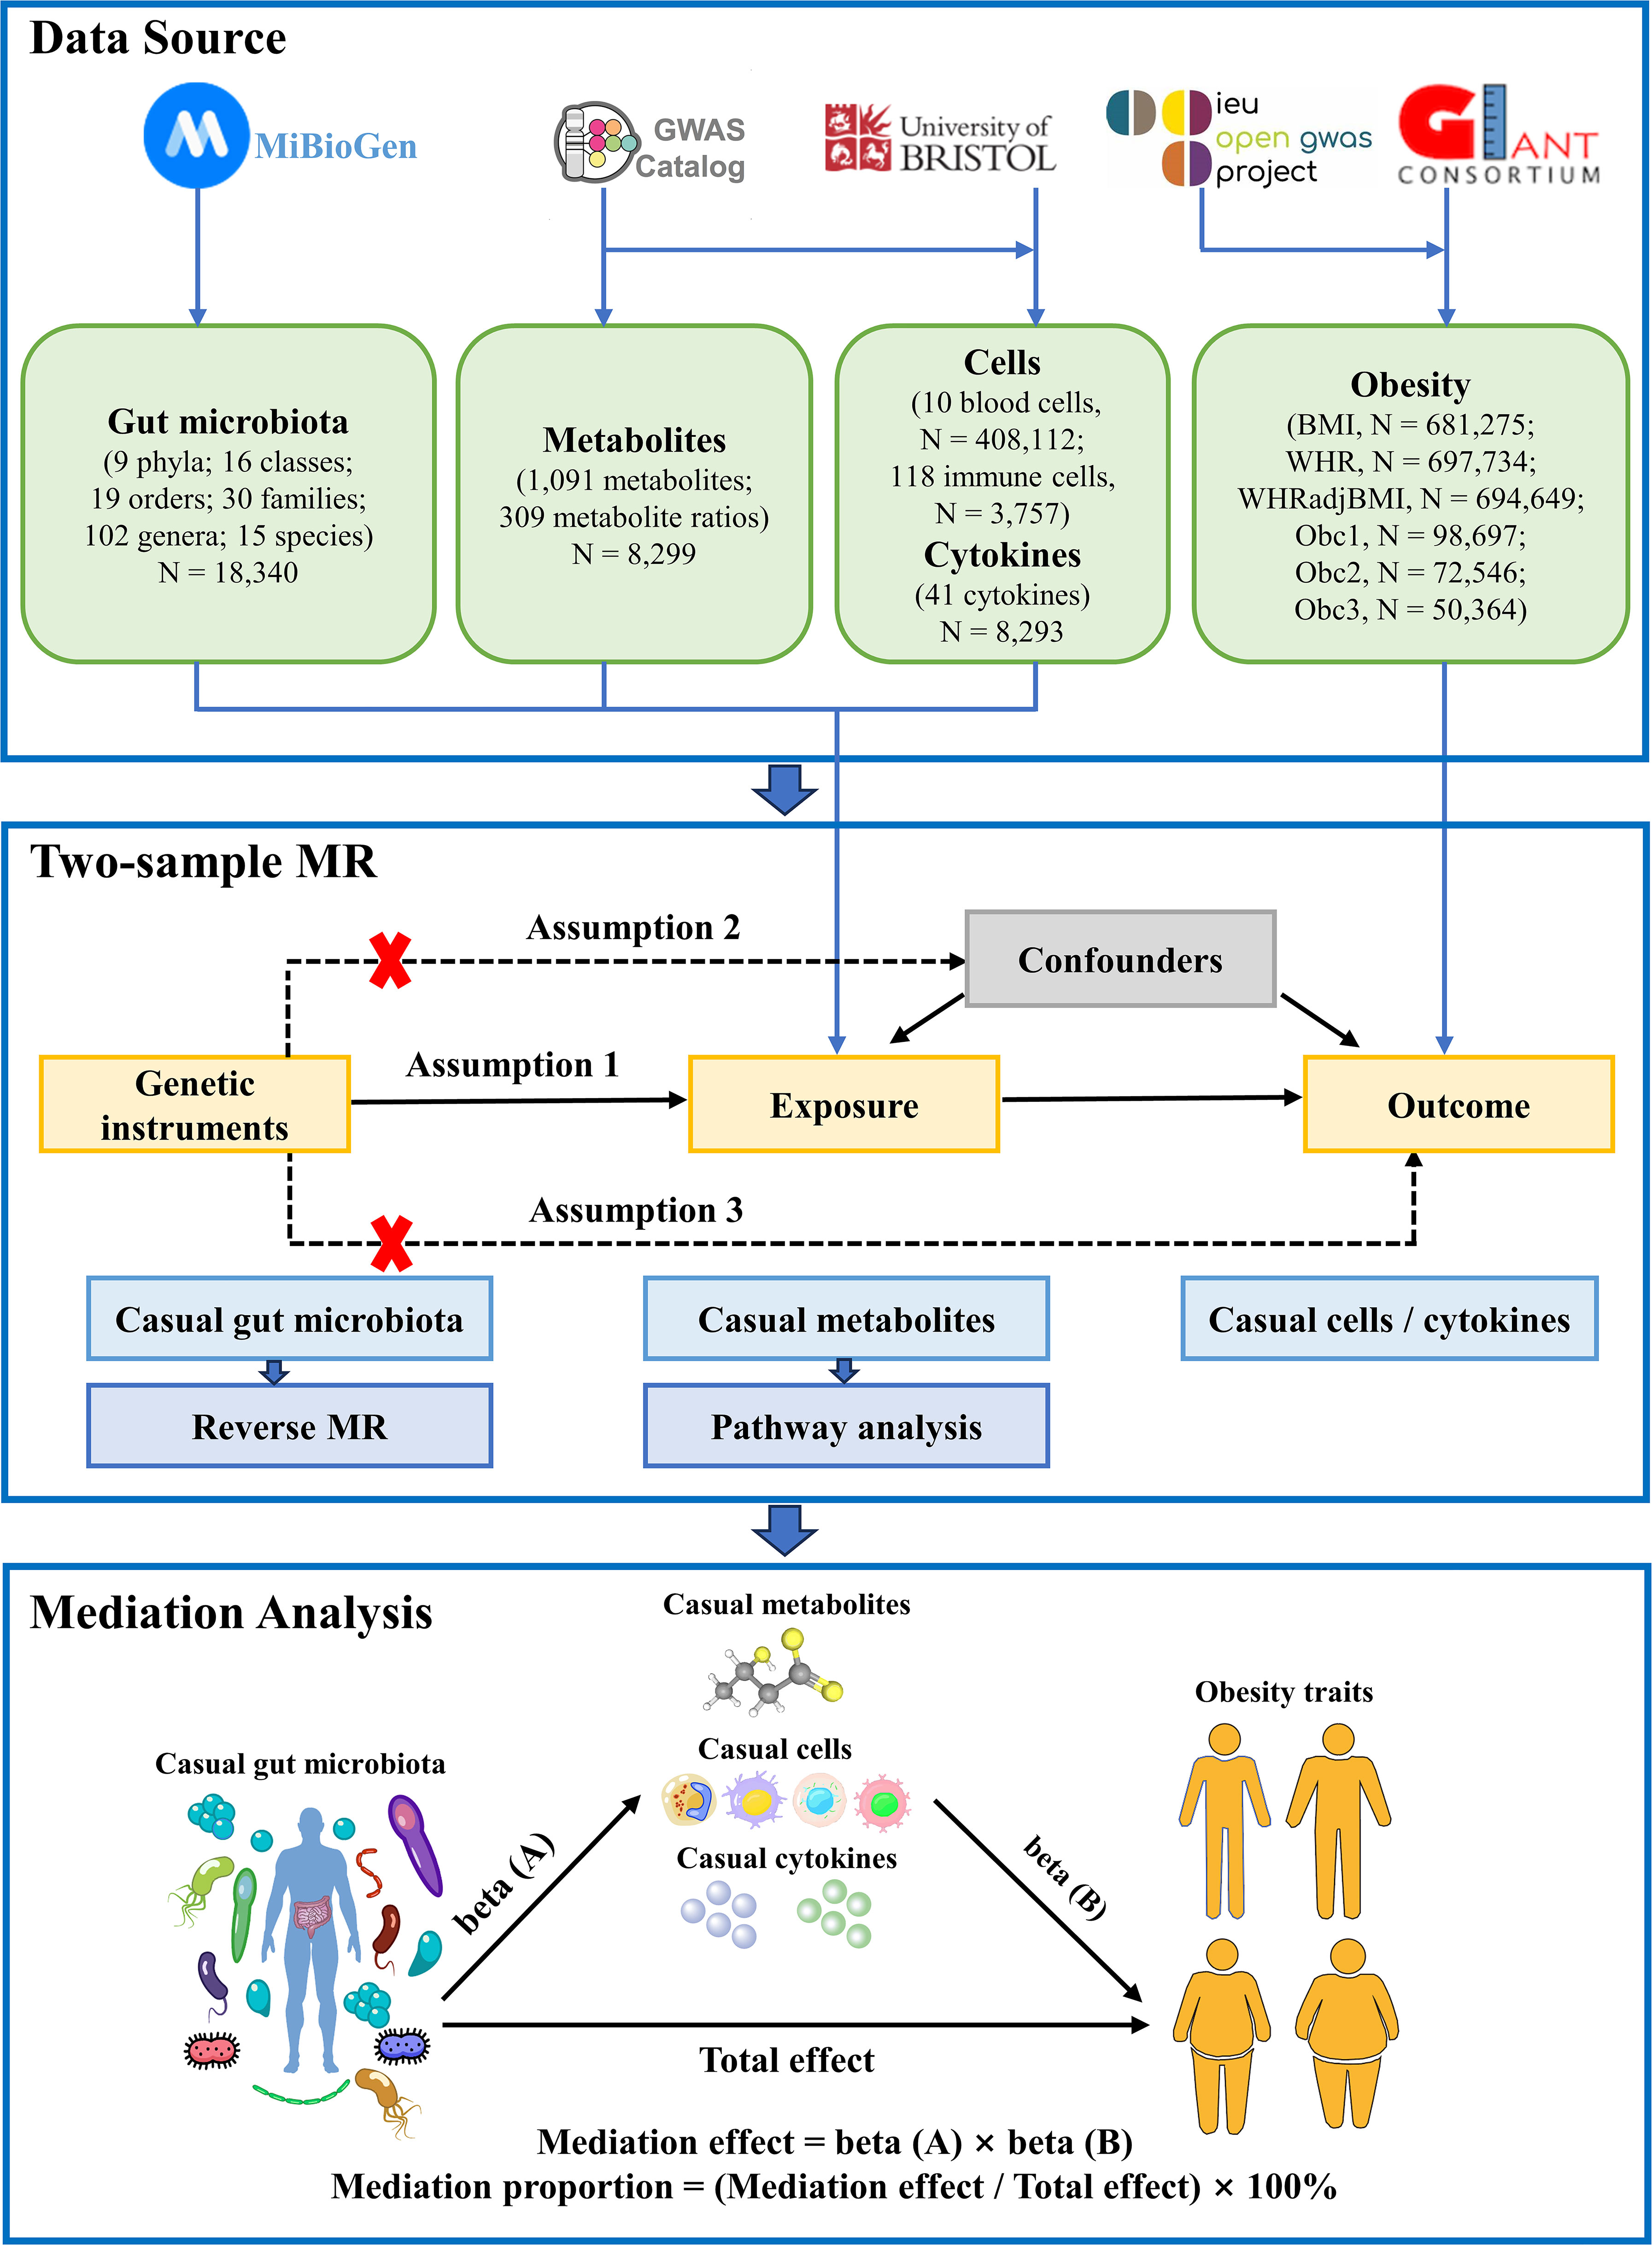
Figure 1 Flow chart of the study. Mendelian randomization study rationale: assumption 1, genetic instruments are associated with exposure; assumption 2, genetic instruments are not associated with confounders; assumption 3, genetic instruments are not associated with outcome, and genetic instruments act on outcome only through exposure. BMI, body mass index; WHR, waist-to-hip ratio; WHRadjBMI, WHR adjusted for BMI; Obc1, Obesity class 1; Obc2, Obesity class 2; obc3, Obesity class 3; MR, Mendelian randomization.
2.2 Data sources
The summary statistics of gut microbiota were retrieved from the largest multi-ethnic GWAS meta-analysis exploring the host genetic impact on gut microbiota, which was based on the MiBioGen consortium (https://mibiogen.gcc.rug.nl/), including 18,340 individuals from 24 cohorts (26). The gut microbiota was identified using 16S rRNA sequencing, and the patients were genotyped using a genome-wide single nucleotide polymorphism (SNP) microarray to determine the genetic locus affecting the relative abundance of the gut microbiota. The GWAS summary data of 191 gut microbiome components (including 9 phyla, 16 classes, 19 orders, 30 families, 102 genera, and 15 species) were included in this study for subsequent MR analyses.
Summary statistics of plasma metabolomics were acquired on the GWAS Catalog (https://www.ebi.ac.uk/gwas/) under the study accession numbers GCST90199621–GCST90201020, which included 1,091 plasma metabolites and 309 metabolite ratios from 8,299 European individuals (27). In that study, there were 850 known metabolites among 1,091 plasma metabolites, which could be divided into 8 broad metabolic groups: lipid (395), amino acid (210), xenobiotics (130), nucleotides (33), cofactors and vitamins (31), carbohydrates (22), peptides (21), and energy (8); the remaining metabolites were partially characterized molecules (21) and unknown (220).
Summary statistics for blood cell traits included 408,112 European participants (28); summary statistics for peripheral immune cells included that of 3,757 European individuals analyzed using flow cytometry (29). The GWAS data were downloaded from the GWAS Catalog, and we selected 10 blood cell count traits and 118 immune cell absolute count traits for subsequent analyses (accession numbers for each trait can be found in Supplementary Table S1). GWAS data for 41 inflammatory cytokines were collected from the University of Bristol (https://data.bris.ac.uk/data/dataset), including three Finnish cohort studies (N = 8,293): the Cardiovascular Risk in Young Finns Study, FINRISK1997, and FINRISK2002 (30, 31).
GWAS summary data for obesity-related traits were collected from large-scale GWAS or the corresponding meta-analyses. Obesity-related traits included BMI, waist-to-hip ratio (WHR), WHR adjusted for BMI (WHRadjBMI), and Obesity classes 1, 2, and 3. GWAS summary data on BMI (32), WHR (33), and WHRadjBMI (33) were obtained from the meta-analysis of UK Biobank and Genetic Investigation of Anthropometric Traits (GIANT) consortium (https://portals.broadinstitute.org/collaboration/giant/index.php/GIANT_consortium_data_files), which contained approximately 700,000 European individuals. Three obesity clinical classification datasets were downloaded at the IEU OpenGWAS database (https://gwas.mrcieu.ac.uk/) and obtained from a genome-wide meta-analysis (34), which contained 263,407 European individuals: Obesity class 1 (BMI ≥ 30 kg/m2) contained 32,858 patients and 65,839 controls; Obesity class 2 (BMI ≥ 35 kg/m2) included 9,889 patients and 62,657 controls; and Obesity class 3 (BMI ≥ 40 kg/m2) included 2,896 patients and 47,468 controls. Control was defined as an individual with a BMI < 25 kg/m2.
2.3 Instrumental variable selection
To estimate causal effects using genetic variation, three basic assumptions of IVs must be satisfied: 1) IVs are related to exposure factors; 2) IVs are not associated with confounding factors; and 3) IVs are not related to outcome variables and only act on outcome variables through exposure factors. Specifically, the IVs included in this study were screened to meet the following conditions: 1) The SNP obtained at the locus-wide significance threshold of P < 1 × 10⁻⁵ is used when there are too few whole-genome significance loci in the original GWAS results (35), or the genome-wide significance threshold of P < 5 × 10⁻⁸ is used as a potential tool variable related to each exposure trait. 2) SNPs related to outcome variables were excluded (P < 0.05). 3) The clumping process was performed to avoid the impact of linkage disequilibrium (r2 < 0.01, window size = 500 kb; or r2 < 0.001, window size = 10,000 kb). 4) The MR pleiotropy residual sum and outlier (MR-PRESSO) test was applied to detect horizontal pleiotropy, and the pleiotropy effect was eliminated by removing the outliers (36). In summary, the SNPs were sorted in ascending order according to the P-values of the MR-PRESSO outlier test, and the remaining were eliminated one by one until there was no pleiotropy (MR-PRESSO global test P-value > 0.05). 5) The strength of the selected SNPs was evaluated using F-statistic, where SNPs with F-statistic < 10 were excluded to avoid weak instrument bias in the MR analysis (37). The F statistic formula is F = [R2 × (n − k − 1)] / [k × (1 − R2)], where R2 is the portion of the exposure variance explained by the IVs, n is the sample size, and k represents the number of IVs (37). 6) IVs with a stronger association with the outcome than exposure were removed by Steiger filtering.
2.4 Statistical analysis
2.4.1 Two-sample Mendelian randomization
The MR method was used to evaluate the causal relationship among the gut microbiota, plasma metabolites, peripheral cells, inflammatory cytokines, and obesity. The Wald ratio was used to infer the causality for exposure, which included only one IV. For exposure comprising multiple IVs, inverse variance-weighted (IVW), maximum likelihood, MR-Egger, weighted median, and weighted mode methods were used to infer causality. IVW usually provides the highest statistical power (38); therefore, it is preferred, whereas other methods are used as supplements. IVW uses a meta-analysis to combine the Wald ratio estimates of each IV, where the intercept is limited to zero (38). In the absence of horizontal pleiotropy, IVW can provide an unbiased causal estimate (39). When there was heterogeneity, the random-effect IVW test provided more conservative and robust estimates; otherwise, a fixed-effect model was used. Similar to IVW, the maximum likelihood method assumes a linear relationship between exposure and outcome (40). MR-Egger verifies the existence of multiple horizontal effects; when pleiotropy exists, it can provide an effective causal estimation (41). Even when up to 50% of the IVs are ineffective, the weighted median can provide effective causal estimates (42). The weighted mode approach is still valid if most IVs with similar causal estimates are valid instruments, even if other IVs do not meet the requirements of the MR analysis (43).
Sensitivity analysis was performed to assess the robustness of causality. MR-Egger regression and MR-PRESSO were used to assess the horizontal pleiotropy. The non-zero intercept of the MR-Egger regression suggested directional pleiotropy (41). Cochran’s Q test was used to assess the heterogeneity among the IVs. Additionally, leave-one-out sensitivity analysis was used to assess whether a single SNP drove the causal estimation. MR Steiger analysis was used to assess the direction of the potential causal association between exposure and outcomes. Only causal microbial characteristics, plasma metabolites, peripheral cells, and inflammatory cytokines with no heterogeneity or pleiotropy were included in the subsequent analysis when the IVW MR method results reached a significance threshold of P < 0.05.
Furthermore, considering the potential chance to increase the overall type I error during multiple comparisons, we implemented the false discovery rate (FDR) correction using the Benjamini–Hochberg procedure (44) on the primary IVW results. A significance threshold of FDR < 0.1 indicates a significant association, whereas PIVW < 0.05 but FDR > 0.1 implies a suggestive association.
All MR analyses were performed in R (version 4.3.1) software, using the “TwoSampleMR” (version 0.5.7) (https://github.com/MRCIEU/TwoSampleMR) (39) and “MR-PRESSO” (version 1.0) (https://github.com/rondolab/MR-PRESSO) (36) packages.
2.4.2 Reverse Mendelian randomization analysis
To explore whether obesity had a causal effect on the identified gut microbiota (PIVW < 0.05), a reverse MR analysis was performed. In this scenario, obesity-related SNPs were regarded as IVs, obesity as the exposure, and gut microbiota taxa as the outcomes. The reverse MR analysis procedure was similar to that used for the MR analysis.
2.4.3 Metabolic pathway analysis
For identified known plasma metabolites (PIVW < 0.05), we used MetaboAnalyst 5.0 (https://www.metaboanalyst.ca/) (45) to conduct metabolic pathway analysis to identify potential metabolic pathways that may be related to the biological processes of obesity. This study used two libraries: the Small Molecule Pathway Database (SMPDB) (46) and the Kyoto Encyclopedia of Genes and Genomes (KEGG) database (47).
2.4.4 Mediation analysis
Mediation analysis aims to evaluate the pathway from exposure to outcome through a mediator, which helps explore the potential mechanisms by which exposure affects outcome (24). The mediation analysis in this study focused on obesity-related gut microbiota, plasma metabolites, peripheral cells, and inflammatory cytokines. First, the causal relationship between gut microbiota and plasma metabolites, peripheral cells, and inflammatory cytokines was evaluated using two-sample MR methods to obtain beta (A). Second, MVMR was used to screen plasma metabolites, peripheral cells, and inflammatory cytokines that still had a causal relationship with obesity after correction for gut microbiota to obtain beta (B) and ensure that the mediating effects on outcomes are independent of exposure (24). The mediation effect was calculated using a two-step MR: mediation effect = beta (A) × beta (B). The total effect of the gut microbiota on obesity was obtained in the previous two-sample MR, and direct effect = (total effect − mediation effect). The mediation proportion used the following formula: mediation proportion = (mediation effect / total effect) × 100%. The 95% confidence intervals (CI) for the mediation effects and proportions mediated were estimated using the delta method (24). Based on the results, we categorized the identified mediators into different levels of evidence. When only a triangular relationship existed, representing that exposure was causally associated with outcome, mediator was causally associated with outcome, and exposure was causally associated with mediator. The identified metabolites, peripheral cells, or cytokines were considered to have potential mediation effects in the pathway from gut microbiota to obesity. If the identified metabolites, peripheral cells, or cytokines did not only exist in a triangular relationship but also had mediation effects significantly different from 0, they were considered as mediators with strong evidence.
3 Results
3.1 Causal effects of gut microbiota on obesity
Using two-sample MR, we identified 50 suggestive associations between gut microbiota and obesity (PIVW < 0.05, FDR > 0.1; corresponding to 44 unique gut microbiota taxa). The causal microbial counts of the obesity traits BMI, WHR, WHRadjBMI, Obesity classes 1, 2, and 3 were 13, 12, 9, 9, 4, and 3, respectively (Figure 2; Supplementary Table S3). Five bacterial features were associated with more than one obesity trait, which may be a common molecular mechanism in the GWAS datasets of different obesity phenotypes. The phylum Actinobacteria (BMI; Obesity class 3), order Bifidobacteriales (BMI; WHR), and family Bifidobacteriaceae (BMI; WHR) had a negative causal relationship with obesity. In contrast the genus Lachnospiraceae UCG008 (WHR; WHRadjBMI) and species Eubacterium nodatum (BMI; WHR; WHRadjBMI) had a positive causal relationship with obesity (Supplementary Figure S1). Lachnospiraceae is closely related to obesity, and we found that the genus Lachnospiraceae FCS020 may increase the risk of obesity (BMI), whereas the family Lachnospiraceae and genus Lachnospiraceae NK4A136 may reduce the risk (WHRadjBMI). Moreover, the family belonged to the order subcategory; therefore, SNP sets included in families and their relevant orders might heavily overlap. These include SNPs of the family Bifidobacteriales and order Bifidobacteriaceae when applying MR analysis between the gut microbiota and obesity. Sensitivity analysis further verified the robustness of the MR results (Supplementary Table S4). The Q statistics showed no evidence of heterogeneity. Furthermore, the results of MR-Egger regression and MR-PRESSO analyses suggested no evidence of horizontal pleiotropy. Based on the MR-Steiger test, we did not find any reverse causality.
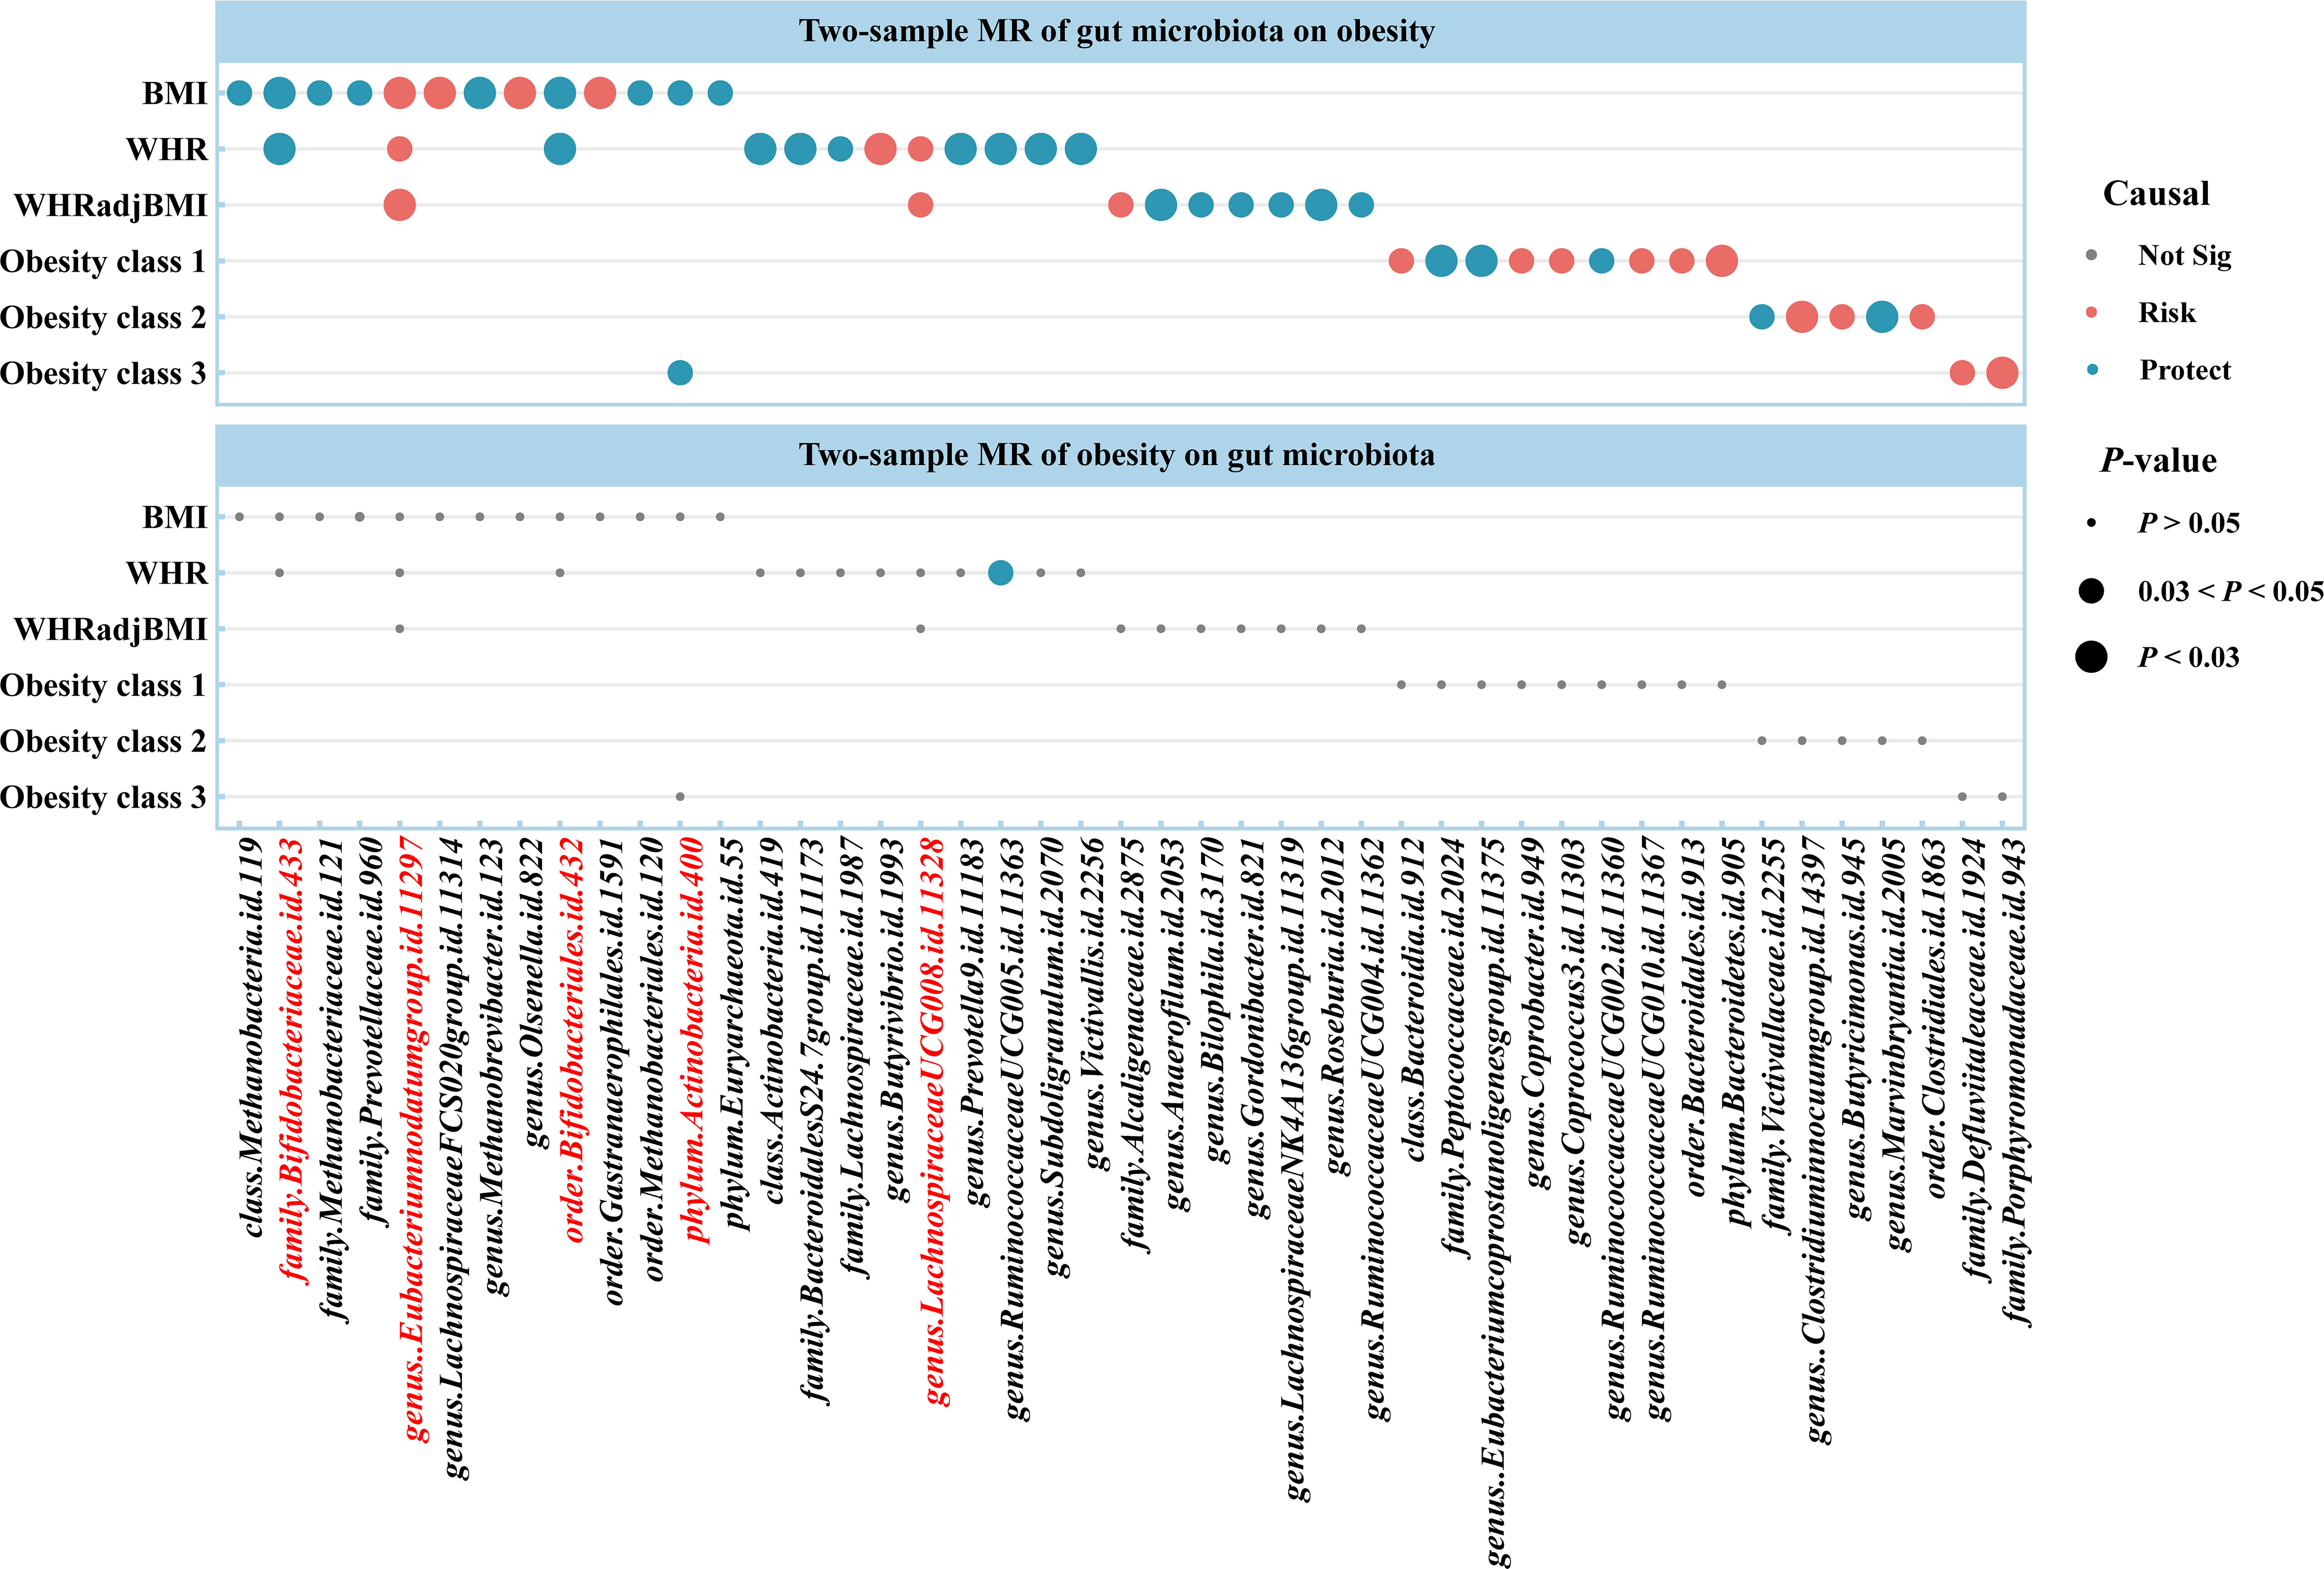
Figure 2 Causal estimates of bidirectional MR between gut microbiota and obesity. Top: Estimates from the IVW analysis of gut microbiota on obesity. Bottom: Estimates from the IVW analysis of obesity on gut microbiota. The bacterial features underlined in red were related to more than one obesity traits. BMI, body mass index; WHR, waist-to-hip ratio; WHRadjBMI, WHR adjusted for BMI; MR, Mendelian randomization; Not Sig, not significant.
For causal associations between gut microbiota and obesity identified above, we conducted reverse MR and found a negative causal relationship between WHR and the genus Ruminococcaceae UCG005 (odds ratio [OR] = 0.877, 95% CI [0.776–0.992], P = 0.037) (Figure 2; Supplementary Tables S5, S6).
3.2 Causal effects of plasma metabolites on obesity
Based on the IVW method, the results suggested 327 causal relationships between plasma metabolomics and obesity (PIVW < 0.05, corresponding to 281 unique plasma metabolites, 229 unique plasma metabolite levels, and 52 unique metabolic ratios). Among BMI, WHR, WHRadjBMI, Obesity classes 1, 2, and 3, there were 84 (73 metabolites and 11 ratios), 82 (67 metabolites and 15 ratios), 54 (44 metabolites and 10 ratios), 41 (34 metabolites and 7 ratios), 29 (20 metabolites and 9 ratios), and 37 (27 metabolites and 10 ratios) associations detected, respectively (Figure 3; Supplementary Table S7). Additionally, we observed 32 shared causal metabolites and 10 shared causal ratios for different obesity traits. Among them, plasma metabolites included lipids (13), amino acids (7), xenobiotics (2), nucleotide (1), cofactor and vitamins (1), carbohydrates (1), peptide (21), energy (1), partially characterized molecules (1), and unknown (4) (Figure 3). For example, 2-oxoarginine* had a positive causal relationship with WHR (OR = 1.0145, 95% CI [1.0035–1.0256], P = 0.0093), WHRadjBMI (OR = 1.0113, 95% CI [1.0001–1.0.225], P = 0.0471), and Obesity class 1 (OR = 1.1374, 95% CI [1.0190–1.2696], P = 0.0217). However, following FDR correction, only 1-(1-enyl-palmitoyl)-2-oleoyl-GPC (P-16:0/18:1)* maintained a significant negative causal relationship with BMI (OR = 0.9744, 95% CI [0.9619–0.9870], P = 0.0001, FDR = 0.0874) (Supplementary Table S7). These results were validated no heterogeneity and horizontal pleiotropy using sensitivity analyses (Supplementary Table S8).
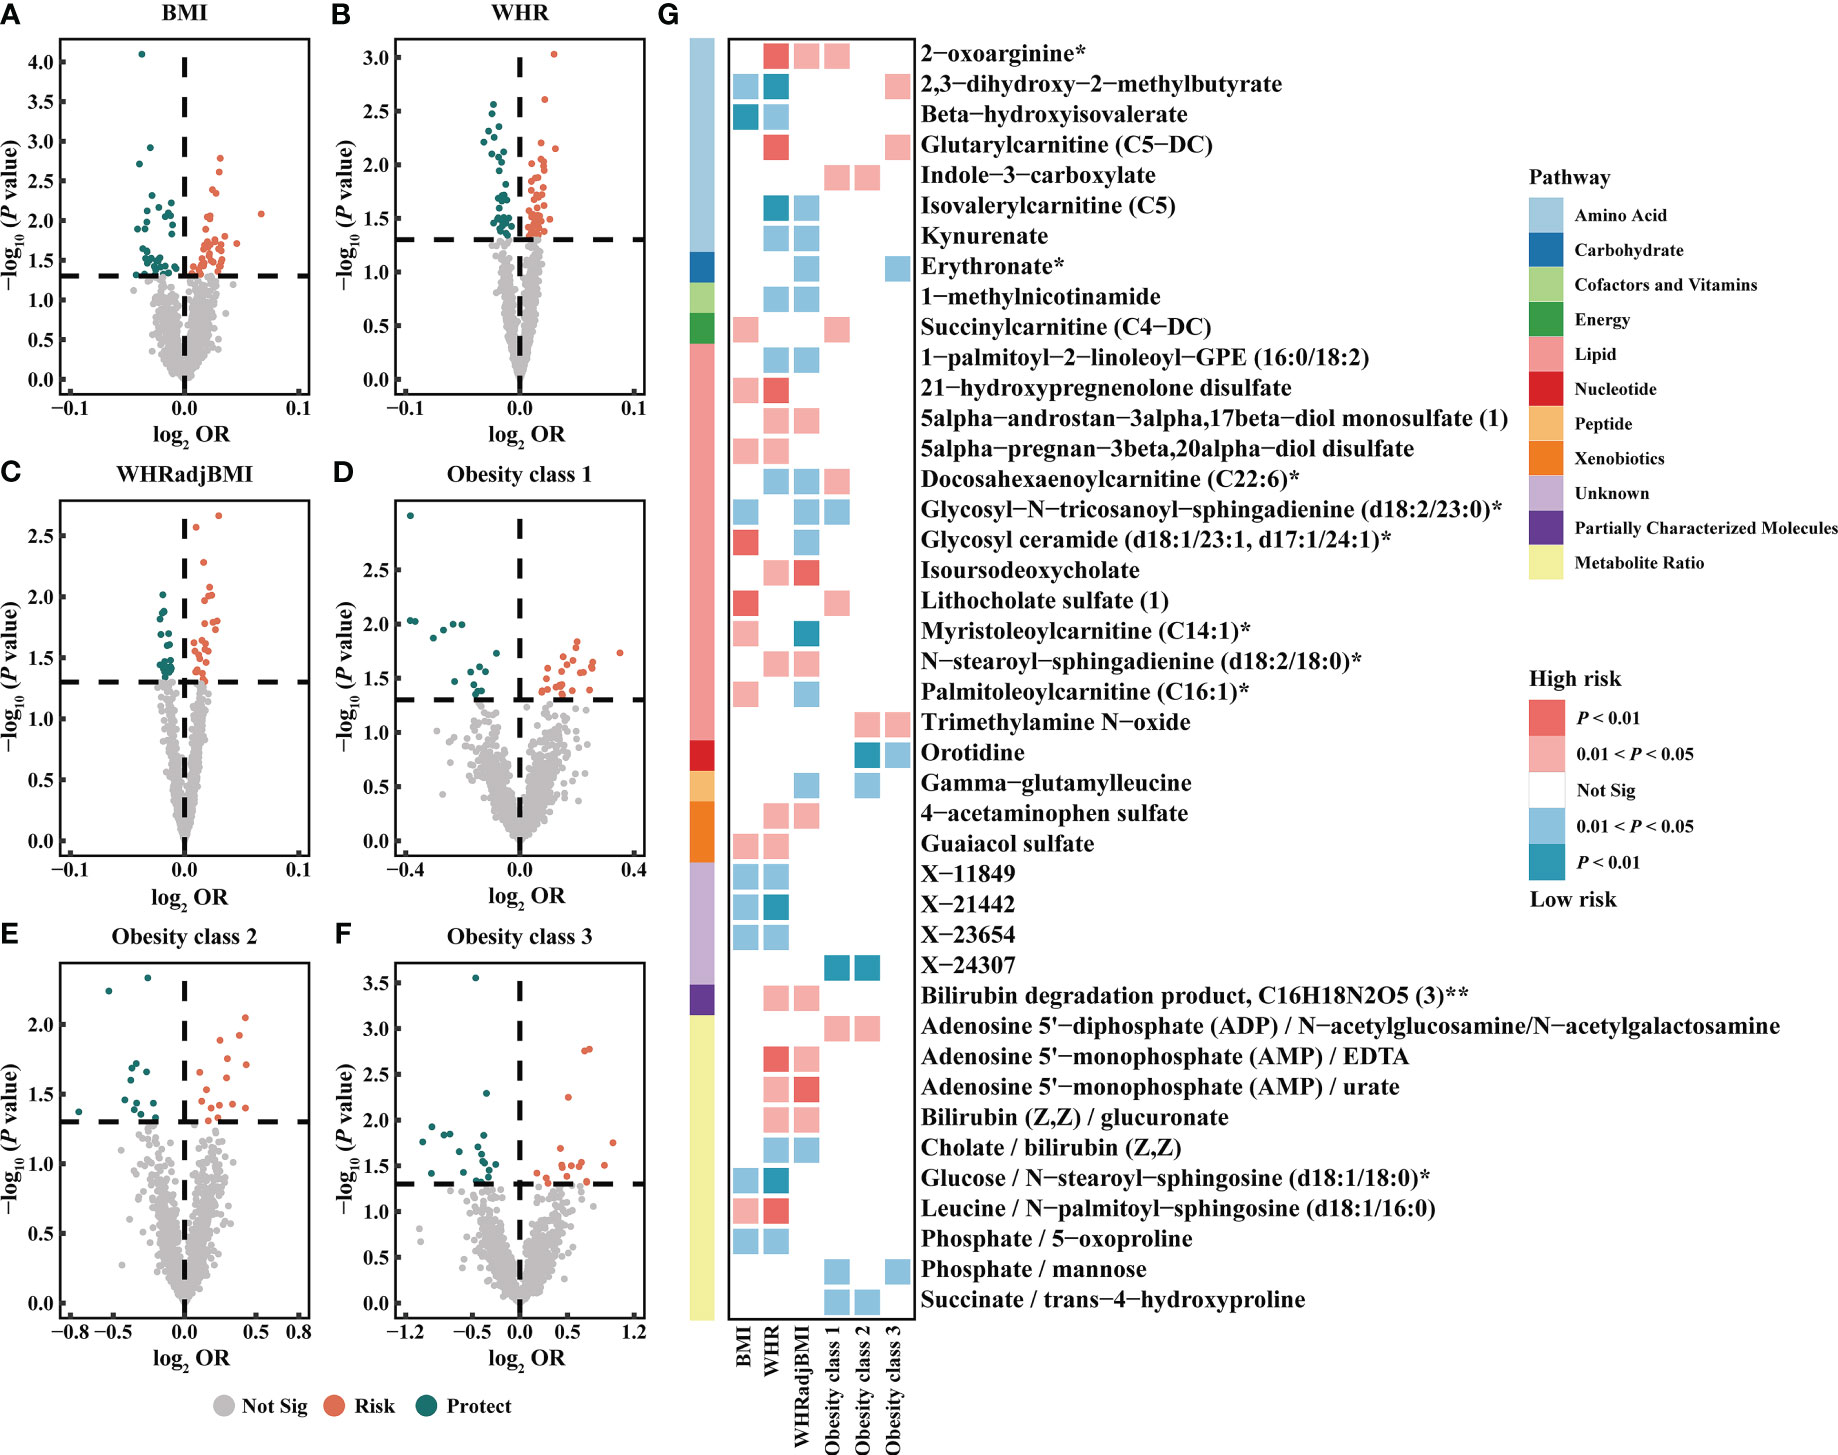
Figure 3 Causal estimates of plasma metabolites on obesity. (A–F) Volcano plots of the IVW MR for the associations between plasma metabolites and each obesity trait. (G) Heatmap of the 42 shared plasma metabolites that showed a causal association with more than one obesity trait at nominal significance (PIVW < 0.05). BMI, body mass index; WHR, waist-to-hip ratio; WHRadjBMI, WHR adjusted for BMI; OR, odds ratio; Not Sig, not significant.
The metabolic pathway analysis identified 17 significant metabolic pathways (12 unique pathways) (Supplementary Figure S2). We discovered metabolic pathways shared between different obesity phenotypes: “D-Arginine and D-ornithine metabolism” for WHR (P = 0.0332), WHRadjBMI (P = 0.0154), and Obesity class 1 (P = 0.0205); “Linoleic acid metabolism” for BMI (P = 0.0382), Obesity classes 1 (P = 0.0256), and 3 (P = 0.0192); “Glycerophospholipid metabolism” for BMI (P = 0.0299) and WHR (P = 0.0348) (Supplementary Table S9).
3.3 Causal effects of blood cells, peripheral immune cells, and inflammatory cytokines on obesity
The IVW method revealed 35 associations between peripheral cells and obesity (PIVW < 0.05, corresponding to 27 unique peripheral cells: 7 unique blood cells and 20 unique immune cells), including BMI, WHR, WHRadjBMI, Obesity classes 1, 2, and 3, with 6, 9, 9, 5, 3, and 3 associations, respectively (Figure 4; Supplementary Table S10). We identified seven shared causal cells, of which six cell traits had consistent causal effects among multiple obesity traits. The risk of obesity may be increased by two blood cell traits, high light scatter reticulocyte count (WHR, WHRadjBMI) and platelet count (WHR, WHRadjBMI), and three immune cell traits, CD14+ CD16– monocyte absolute count (BMI, WHR), CD28– CD8+ T cell absolute count (Obesity classes 1 and 3), and monocytic myeloid-derived suppressor cells absolute count (Obesity classes 1 and 2). One immune cell trait, effector memory CD4+ T cell absolute count (WHR, WHRadjBMI), may reduce the risk of obesity. Next, we performed FDR correction on the results of the IVW method for blood cell and immune cell traits separately. The results indicate that after correction, five blood cell traits still exhibit a positive causal relationship with WHRadjBMI: high light scatter reticulocyte count (OR = 1.0113, 95% CI [1.0018–01.0209], P = 0.0194, FDR = 0.0484), neutrophil count (OR = 1.0159, 95% CI [1.0035–1.0285], P = 0.0119, FDR = 0.0396), platelet count (OR = 1.0109, 95% CI [1.0025–1.0194], P = 0.0112, FDR = 0.0396), reticulocyte count (OR = 1.0137, 95% CI [1.0038–1.0236], P = 0.0066, FDR = 0.0396), and white blood cell count (OR = 1.0116, 95% CI [1.0002–1.0232], P = 0.0469, FDR = 0.0938) (Supplementary Table S10). Additionally, the findings indicate that the immune cell trait IgD+ CD24– B cell absolute count continues to demonstrate a negative causal relationship with BMI (OR = 0.9774, 95% CI [0.9651–0.9899], P = 0.0004, FDR = 0.0477) (Supplementary Table S10). The MR results remained stable in the sensitivity analyses, suggesting the absence of significant heterogeneity and horizontal pleiotropy (Supplementary Table S11).
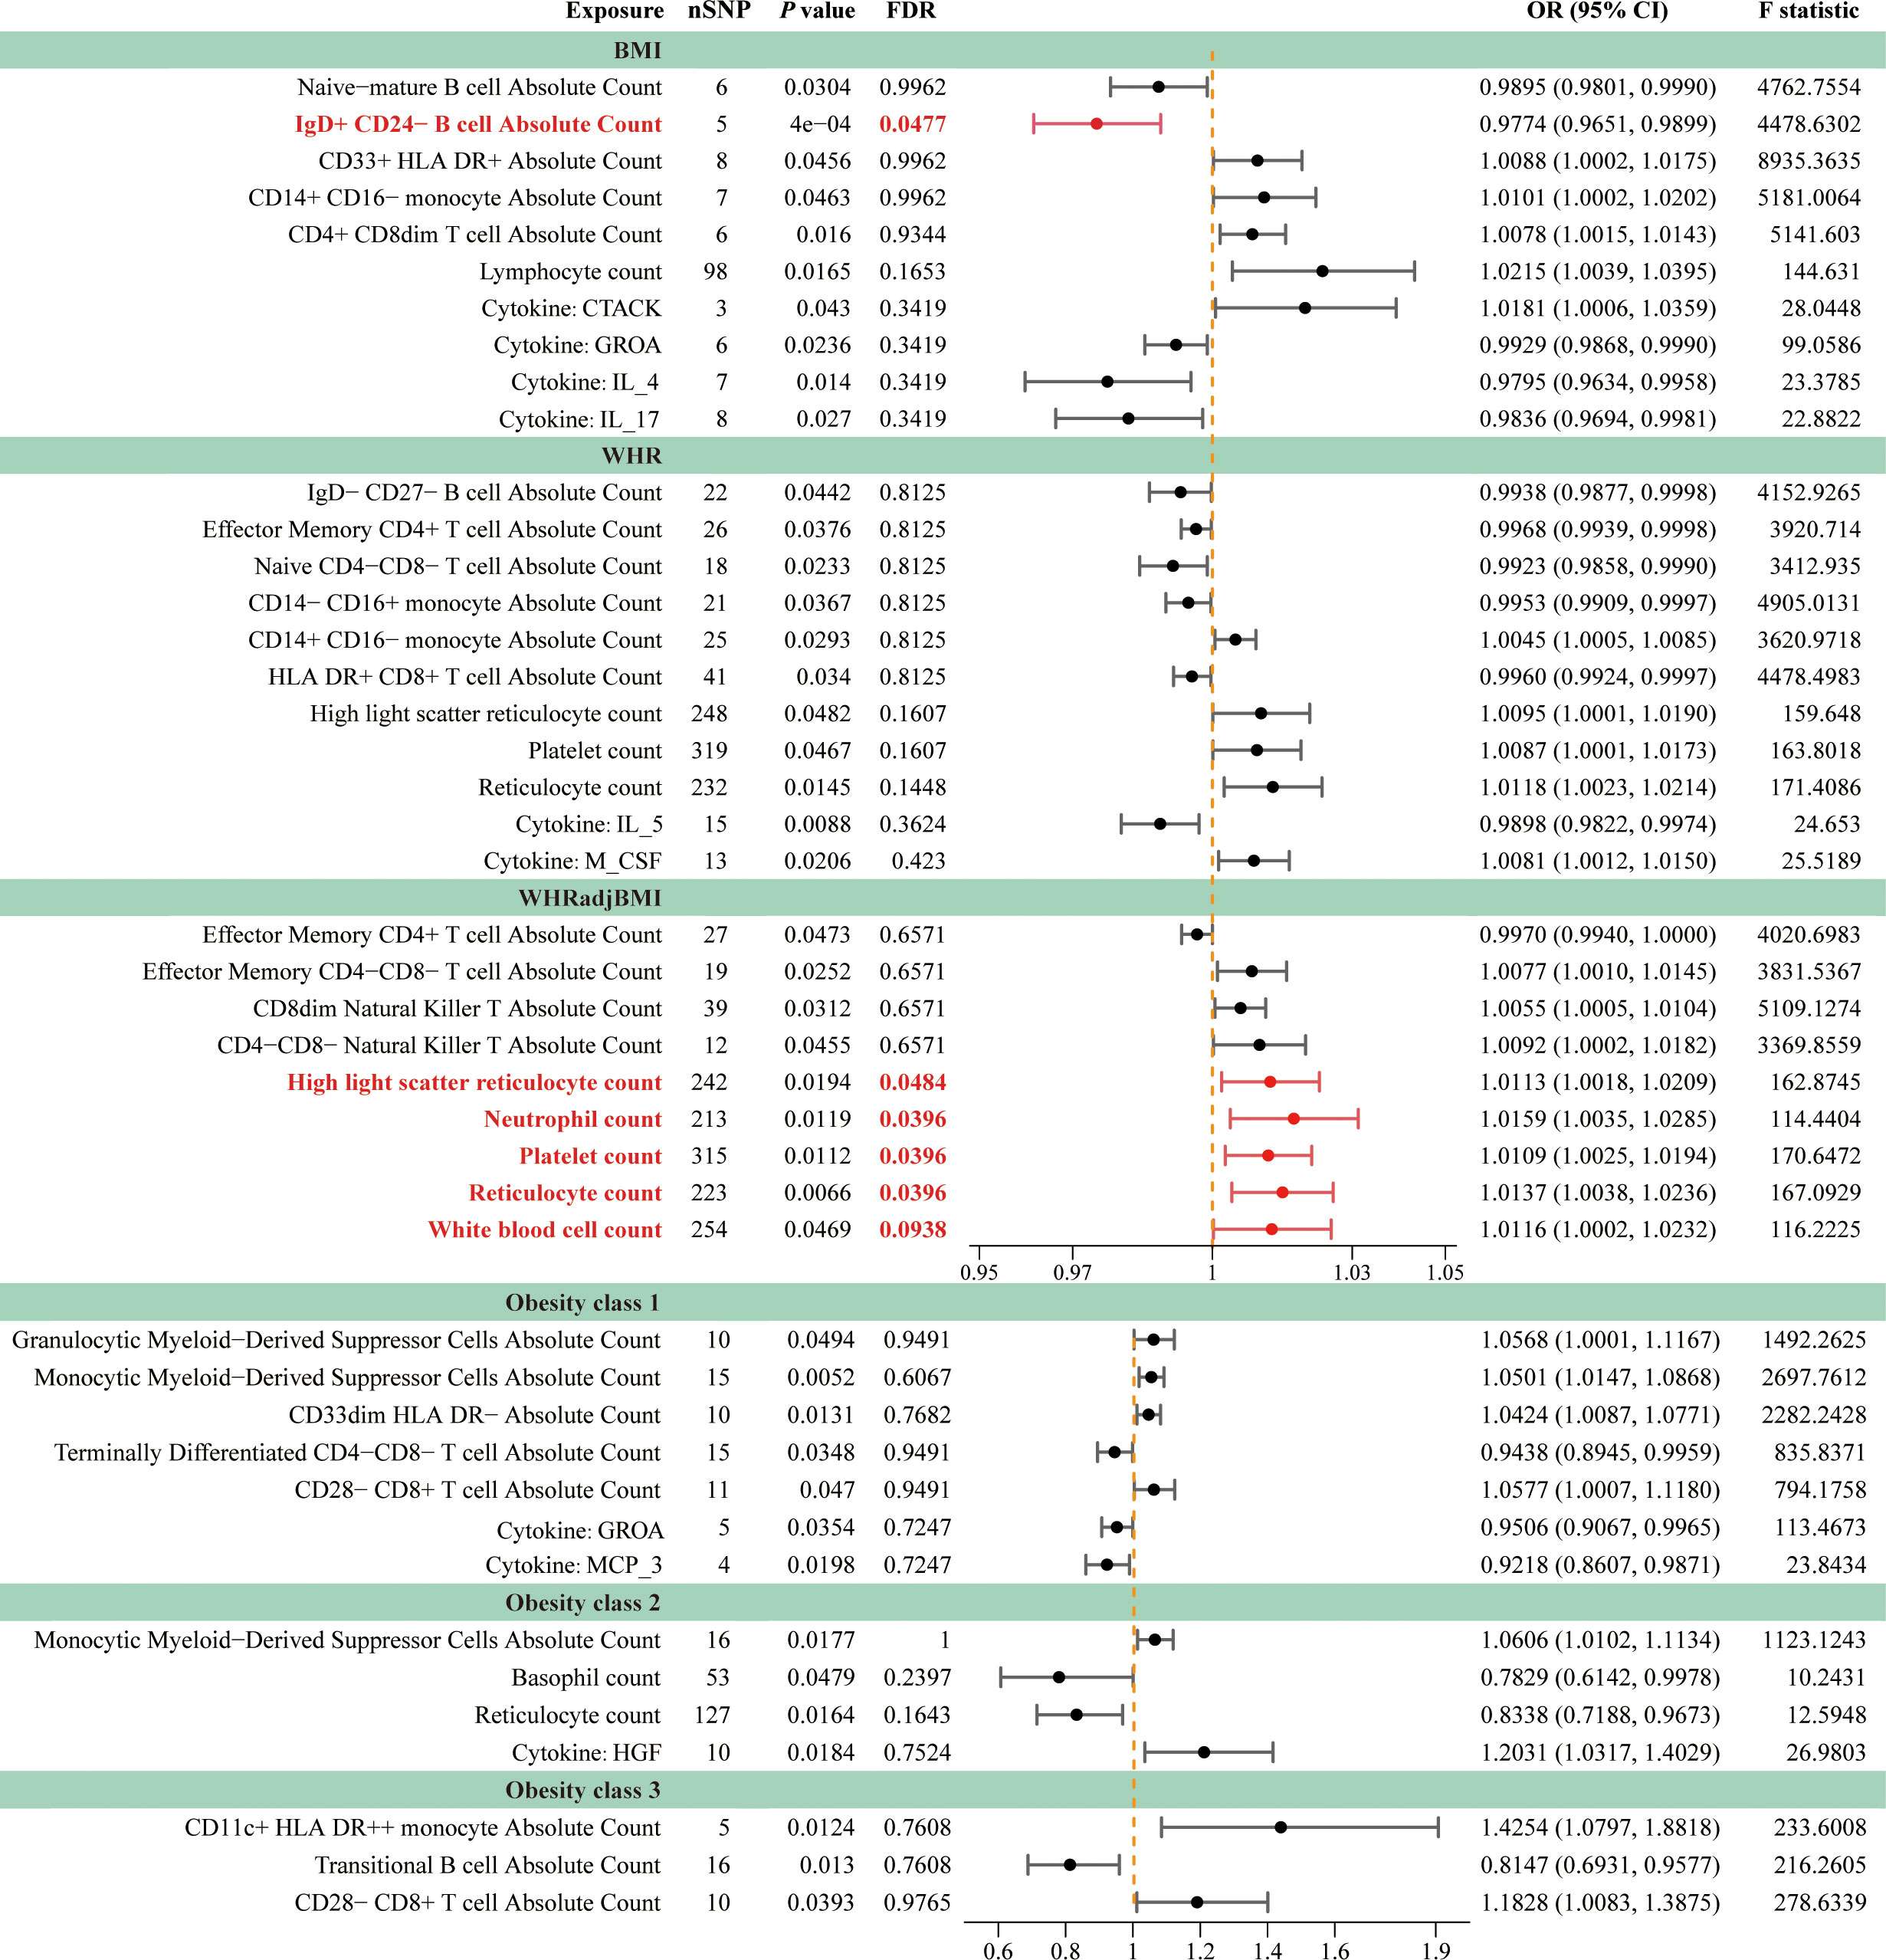
Figure 4 Forest plots for causal effects of peripheral cells and inflammatory cytokines on obesity. The horizontal bars correspond to the estimated OR with 95% CI using the IVW method for peripheral cells and inflammatory cytokines on obesity. Causal relationships that remain statistically significant after FDR correction were emphasized using red font and lines. FDR, false discovery rate; BMI, body mass index; WHR, waist-to-hip ratio; WHRadjBMI, WHR adjusted for BMI; OR, odds ratio; CI, confidence interval.
Moreover, the causal relationship between cytokines and obesity was evaluated using MR, and the results supported the existence of nine suggestive associations between cytokines and obesity (PIVW < 0.05, FDR > 0.1; corresponding to eight unique cytokines), including four, four, two, and one association of BMI, WHR, Obesity classes 1, and 2, respectively (Figure 4; Supplementary Table S12). We found that growth-regulated alpha protein (GROA) (BMI: OR = 0.9929, 95% CI [0.9868–0.9990], P = 0.0236; Obesity class 1: OR = 0.9506, 95% CI [0.9067–0.9965], P = 0.0354) was the only shared causal cytokine that could reduce the risk of obesity. The sensitivity analyses further indicated the absence of heterogeneity and horizontal pleiotropy in these MR analyses (Supplementary Table S13).
3.4 Mediation analysis results
To explore the potential mechanisms of obesity occurrence and development, we conducted a mediation analysis to identify the causal pathway from gut microbiota to obesity mediated by plasma metabolites, peripheral cells, and inflammatory cytokines (please refer to the Mediation analysis section of Methods for details). This analysis focused on previously identified gut microbiota, metabolites, cells, and cytokines associated with obesity in the two-sample MR (Supplementary Tables S3, S7, S10, S12).
Firstly, the causal relationship among causal gut microbiota, metabolites, cells, and cytokines was evaluated via two-sample MR. We identified 95 associations of gut microbiota to metabolites (BMI, 41; WHR, 31; WHRadjBMI, 9; Obesity class 1, 8; Obesity class 2, 5; Obesity class 3, 1), 10 associations to cells (WHR, 2; WHRadjBMI, 4; Obesity class 1, 1; Obesity class 2, 1; Obesity class 3, 2), and 2 associations to cytokines (WHR, 1; Obesity class 1, 1) (Supplementary Table S14). Furthermore, MVMR analysis was used to screen for metabolites, cells, and cytokines that exhibit a causal relationship with obesity after correcting for the gut microbiota. The results showed that after microbial adjustment, there were 34 metabolite–obesity associations (BMI, 14; WHR, 14; WHRadjBMI, 5; Obesity class 2, 1), 7 cell–obesity associations (WHR, 2; WHRadjBMI, 4; Obesity class 2, 1), and 2 cytokine–obesity associations (WHR, 1; Obesity class 1, 1) (Supplementary Figure S3; Supplementary Table S15). These MR results were validated through the sensitivity analysis, further suggesting the absence of heterogeneity and horizontal pleiotropy (Supplementary Tables S16, S17).
In summary, we identified 20 mediating relationships (1 with strong evidence, 19 with potential evidence), including 17, 2, and 1 gut microbiota–obesity causal pathways mediated by metabolites, cells, and cytokines, respectively (Table 1). The mediation analysis reveals that only 1-(1-enyl-palmitoyl)-2-oleoyl-GPC (p-16:0/18:1) levels exhibit significant negative mediation effects (beta = −0.0043, 95% CI [−0.0085, −0.0001], P = 0.0462) on phylum Actinobacteria and BMI with 13.55% (95% CI: 0.23%, 26.87%) proportion. The pathway from phylum Actinobacteria to BMI was also potentially mediated by 1-(1-enyl palmitoyl)-2-palmitoyl-GPC (P-16:0/16:1) levels with 4.97% proportion. Additionally, three additional microbial features exhibited more than one mediator. The mediation ratios from class Actinobacteria to WHR through methionine sulfone and X-16935 (an unknown metabolite) levels were 12.29% and 15.06%, respectively. The mediating ratios of genus Lachnospiraceae UCG008 to WHR through 1-palmitoyl-2-oleoyl-GPE (16:0/18:1) and 1,2-dilinoleoyl-GPE (18:2/18:2) levels were 7.21% and 8.24%, respectively. The mediating ratios of family Alcaliginaceae to WHRadjBMI through gamma-glutamylvaline levels and high light scatter reticulocyte count were 12.89% and 2.15%, respectively. Two mediators mediated more than one relationship: metabolite 3-hydroxybutyrate levels mediated class Metanobacteria, order Metanobacteriales, and family Metanobacteriaceae to BMI, all with a mediation ratio of 10.74%. The ratios of myo-inositol levels mediated order Bifidobacteriaceae and family Bifidobacteriaceae to WHR (both 8.14%). White cells are a very important type of immune cell in human blood. The white blood cell counts mediated genus Anaerofilum to WHRadjBMI, with 1.87% proportion. GROA is a typical inflammatory chemokine with a mediating ratio of 8.64% between the genus Ruminococcaceae UCG010 and Obesity class 1. These results showed the consistent direction of the total, indirect, and direct effects, and that the leave-one-out analysis supported the reliable causal relationship in the two-sample MR study of exposure to outcome, exposure to mediator, and mediator to outcome (Table 1; Supplementary Figure S4; Supplementary Table S18).
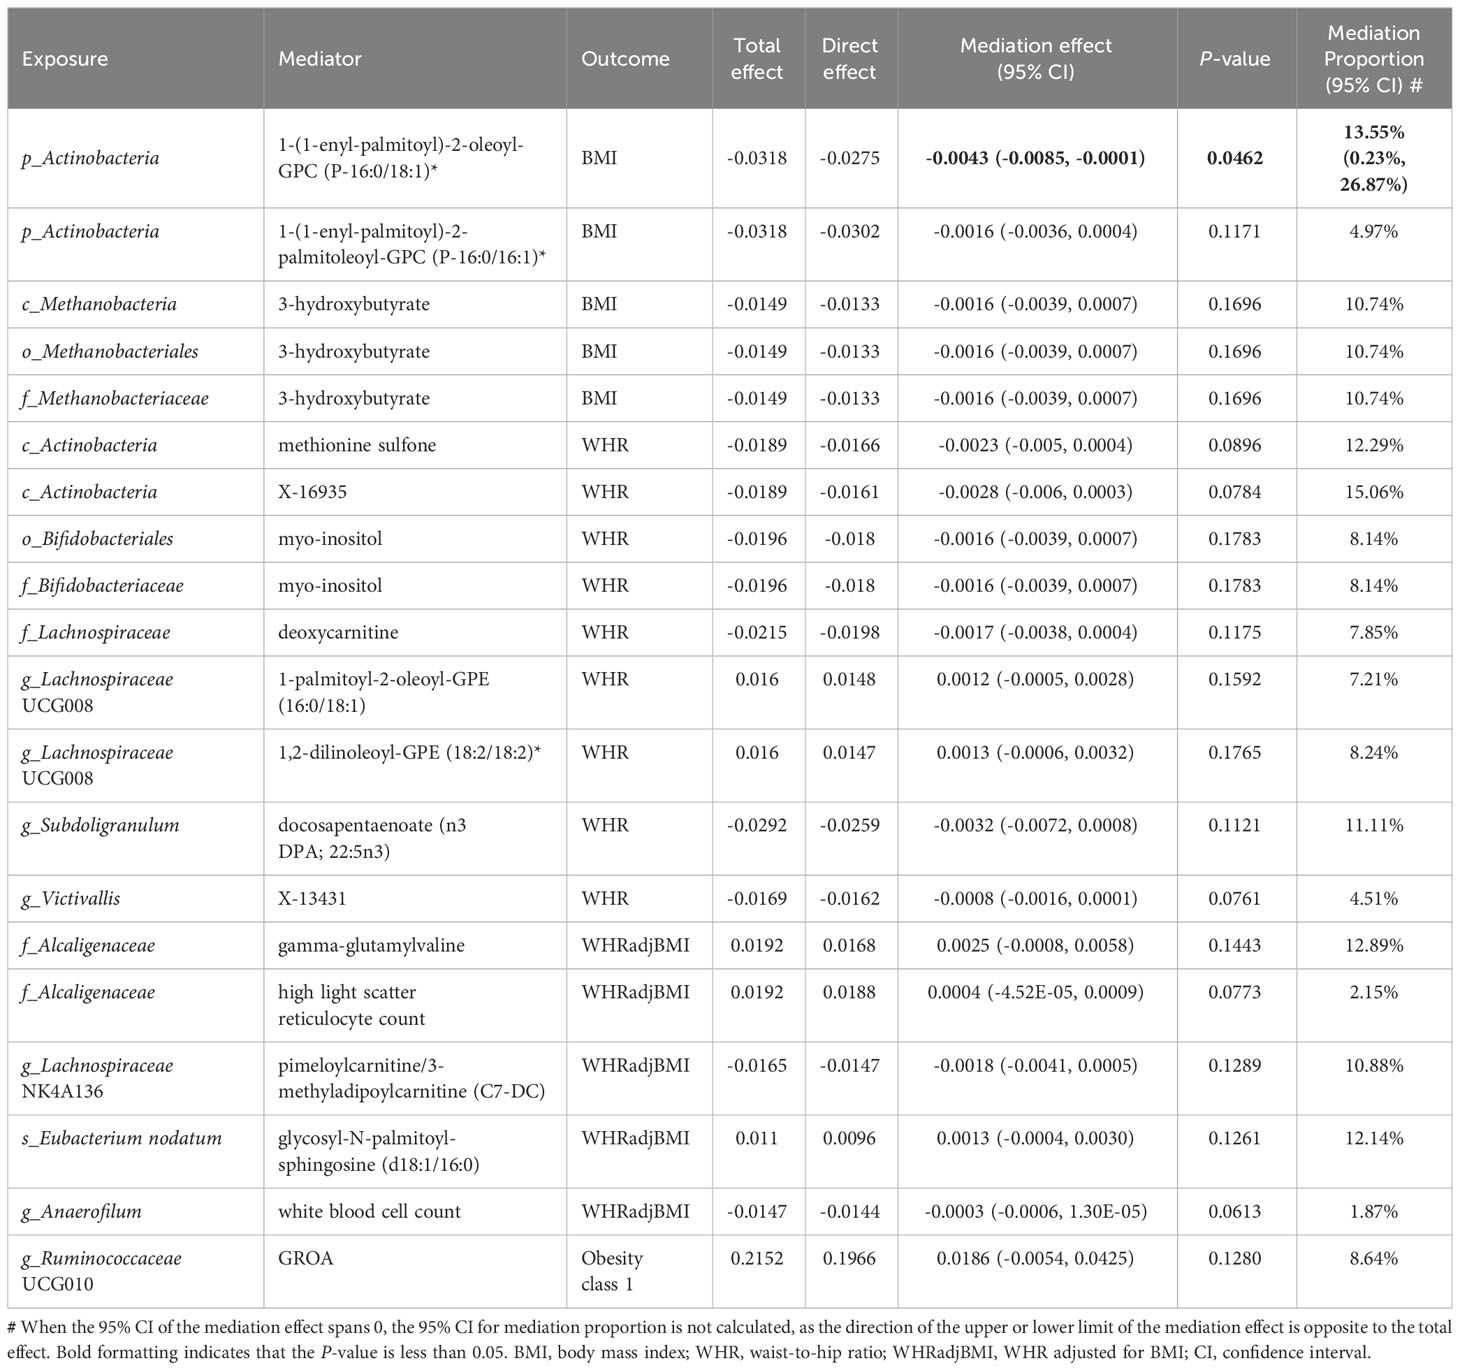
Table 1 Mediation effect of gut microbiota on obesity via plasma metabolites, peripheral cells and inflammatory cytokines.
4 Discussion
This study comprehensively evaluated the causal relationship among gut microbiota, plasma metabolome, blood cells, peripheral immune cells, inflammatory cytokines, and obesity using MR analysis. We found potential causal associations between 44 bacterial features, 281 plasma metabolites (229 metabolites and 52 ratios), 27 peripheral cells (7 blood and 20 immune cells), and 8 inflammatory cytokines and obesity. Pathway analysis of known plasma metabolites indicated that D-arginine, D-ornithine, linoleic acid, and glycerophospholipid metabolism play important roles in the occurrence and development of obesity. In addition, the mediation analysis results supported the mediating effects of plasma metabolites, peripheral cells, and inflammatory cytokines on the gut microbiota in obesity pathogenesis.
Our findings suggest that higher bacterial abundance within phylum Actinobacteria, order Bifidobacteriales (the subcategory of phylum Actinobacteria), and family Bifidobacteriaceae (the subcategory of order Bifidobacteriales), may confer protection against obesity (48, 49). The abundance of Bifidobacterium (a subcategory of the family Bifidobacteriaceae) decreased significantly in individuals with increased visceral adipose tissue, BMI, blood triglycerides, and fatty liver (49). Obese patients can reduce their total blood sugar after short-term Bifidobacterium-based probiotic treatment and adjust the gut microbiota structure by increasing beneficial and decreasing pathogenic or opportunistic bacteria (50). In addition, many studies have shown that some strains of Bifidobacterium can function as probiotics to protect against obesity (51), such as Bifidobacterium animalis subsp. Lactis GCL2505, Bifidobacterium breve strain B-3, Bifidobacterium breve BR03, and Bifidobacterium breve B632 strains (52–54). Bifidobacterium can absorb sugars and produce short-chain fatty acids, especially acetate, which modulates host energy metabolism (e.g., inhibits fat accumulation in adipose tissue, increases insulin sensitivity, and enhances fatty acid / glucose metabolism) via the short-chain fatty acid receptor, G protein-coupled receptor 43, which is a common mechanism of probiotic activity (52).
The family Lachnospiraceae (phylum Firmicutes, class Clostridia) is one of the most important families of the intestinal microbiota in healthy adults, including 58 genera and several unclassified strains with complex functions and controversial roles in diseases (55, 56). Most human and mouse studies have revealed that an increased abundance of Lachnospiraceae is associated with metabolic diseases (57); however, certain controversies remain. For instance, some reports indicate positive and negative correlations between Lachnospiraceae ND3007, Lachnospiraceae NK4A136, and obesity, respectively (58). Lachnospiraceae bacterium 3_1_57FAA_cT1 is a potentially beneficial microorganism that is inversely proportional to homeostatic model assessment of insulin resistance (HOMA-IR) and fasting insulin levels and may mediate the impact of obesity on insulin resistance (59). The beneficial effects of Lachnospiraceae NK4A136 and Lachnospiraceae bacterium 3_1_57FAA_cT1 can be explained by the production of butyrate in the intestine (56, 58, 59). The genus Lachnospiraceae UCG008 emerged as a shared-risk bacterium across multiple obesity-related traits, consistent with its association with an elevated risk of various diseases, such as hemorrhagic stroke and periodontitis (60–62). Our findings suggest that genera Lachnospirace UG008 and Lachnospirace FCS020 may increase the risk of obesity, while the family Lachnospiraceae and genus Lachnospiraceae NK4A136 may reduce this risk.
Contrary to a previous study highlighting statistical associations between Enterobacteriaceae, Desulfovibrio, and Akkermansia with obesity (11), our MR results did not support these findings. This disparity in interpretation may be partly attributed to residual confounding and reverse causation observed in observational studies, rather than a validated causal correlation. It’s worth noting that the gut microbiota encompasses not only the bacteriome but also the mycobiome and virome, both of which contribute to obesity pathogenesis (63, 64). While our present study solely focuses on the gut bacteriome, future research will explore the relationship between fungi, viruses, and obesity. Nonetheless, controversies persist regarding the relationship between gut microbiota and obesity (65).
We found that D-arginine, D-ornithine, linoleic acid, and glycophospholipid metabolism were key pathways associated with obesity. Previous studies have shown that these metabolic pathways are mainly affected by gestational diabetes (66) and that D-arginine and D-ornithine metabolism are the main pathways associated with perinatal obesity (67). Linoleic acid is an omega-6 polyunsaturated fatty acid commonly found in the diet and is crucial for human health. Moderate intake of linoleic acid has a positive effect on maintaining cell membrane health and nervous system function. However, a high intake of linoleic acid may contribute to the obesity epidemic as the rich content of omega-6 fatty acids in modern diets is generally imbalanced by the intake of omega-3 fatty acids. Moreover, linoleic acid is converted into arachidonic acid in the body, which plays a role in inducing inflammation and fat synthesis (68, 69). Glycerophospholipid metabolism involves the synthesis, degradation, and remodeling of glycerophospholipids. Glycerophospholipids are the most abundant phospholipids in mammalian cell membranes and can be divided into subcategories, such as phosphatidylcholine (PC), phosphatidylethanolamine (PE), and phosphatidylserine. Animal studies have shown that abnormal levels and proportions of PC and PE can lead to dyslipidemia (70), obesity (71), and insulin resistance (72). Human studies have also shown that PC and PE are associated with T2D (73) and the risk of metabolic syndrome (74).
Myo-inositol is a sugar alcohol containing six carbon atoms that helps improve insulin sensitivity, and its deficiency may be related to the pathogenesis of metabolic diseases, such as metabolic syndrome, polycystic ovary syndrome, and diabetes (75). Myo-inositol has potential therapeutic effects on metabolic diseases (76). Our study supports a negative causal relationship between myo-inositol and obesity. Additionally, the mediation ratio of the myo-inositol-mediated order Bifidobacteriales and family Bifidobacteriaceae to the obesity trait WHR was 8.14%. 3-Hydroxybutyrate is a normal metabolic product of fatty acid oxidation and can be used as an energy source without sufficient blood sugar. It is also an important regulatory molecule that can affect gene expression, lipid metabolism, neuronal function, and the overall metabolic rate (77). The levels of 3-hydroxybutyrate are high in obese patients and decrease after weight loss surgery (78, 79). Our study supports a positive causal relationship between 3-hydroxybutyrate and obesity. Mediation analysis showed that the mediating proportion of the 3-hydroxybutyrate mediating class Methanobacteria, order Methanobacteriales, and family Methanobacteriaceae to the obesity trait BMI was 10.74%.
Obesity is a chronic inflammatory disease, and an increase in the white blood cell count has been widely associated with these diseases. Observational research has shown that the white blood cell count is positively correlated with the incidence of diabetes, hypertension, obesity, dyslipidemia, and metabolic syndrome (19). White blood cell count is a marker of inflammation and an indicator of whether obesity increases the risk of T2D. A high white blood cell count is associated with reduced insulin sensitivity (80, 81). This study indicated a positive causal relationship between white blood cell counts and obesity, and white blood cell counts mediated 1.87% of the effect of genus Anaerofilum on obesity trait WHRadjBMI. The pro-inflammatory cytokine GROA, also known as C-X-C motif chemokine ligand 1 (CXCL1), is a CXC chemotactic factor that helps in the recruitment and migration of various immune cells and plays an important role in regulating immune and inflammatory responses (82). Previous studies have shown that an increase in serum CXCL1 is associated with obesity, hyperglycemia, and pancreatic dysfunction (83). However, using MR, we found that CXCL1 may reduce the risk of obesity. In addition, a mediating ratio of 8.64% was observed for the CXCL1, which mediated genus Ruminococcaceae UCG010 to the obesity trait Obesity class 1.
This is the first time that a comprehensive MR framework has been used to analyze the causal relationship among gut microbiota, plasma metabolites, blood cells, peripheral immune cells, inflammatory cytokines, and obesity. Furthermore, a pathway from the gut microbiota to obesity was constructed through a two-step MR and mediation analysis via plasma metabolites, blood cells, peripheral immune cells, and inflammatory factors. This study used a series of sensitivity analyses to maximize the robustness of the MR results. However, this study has certain limitations. First, the lack of demographic information, such as age and sex, in the initial study hindered further subgroup analyses. Second, the majority of people studied by the GWAS were of European ancestry; therefore, the generalizability of the research results to other populations is limited. In addition, although the MR method is effective in evaluating the causal relationship between exposure factors and outcomes, this result needs to be further validated based on more experimental and clinical studies.
5 Conclusion
In summary, our MR study identified 44 gut microbiota taxa, 281 plasma metabolites, 27 peripheral cells, and 8 inflammatory cytokines that were causally linked to obesity; among them, 5 shared bacterial features, 42 shared metabolites, 7 shared cells, and 1 shared cytokine. Pathway analysis revealed 12 obesity-related metabolic pathways, with particular emphasis on D-arginine, D-ornithine, linoleic acid, and glycerophospholipid metabolism which were closely related to obesity. Moreover, we found 20 mediating relationships, including the causal pathways mediated by 17 metabolites, 2 peripheral cells, and 1 inflammatory cytokine from gut microbiota to obesity.
This MR analysis supports the causal effects of the gut microbiota, plasma metabolites, peripheral cells, and inflammatory cytokines on obesity. In addition, mediation analysis revealed that plasma metabolites, peripheral cells, and inflammatory cytokines mediate the pathway from the gut microbiota to obesity. The identified gut microbiota, plasma metabolites, and cellular and inflammatory factors may serve as biomarkers for the diagnosis and treatment of obesity and contribute to the study of obesity mechanisms.
Data availability statement
The original contributions presented in the study are included in the article/Supplementary Material. Further inquiries can be directed to the corresponding authors.
Ethics statement
All analyses were based on publicly available summary statistics, which do not require ethical approval and consent.
Author contributions
YL: Investigation, Methodology, Software, Writing – original draft, Formal analysis. XW: Methodology, Software, Validation, Visualization, Writing – original draft, Formal analysis. ZZ: Data curation, Resources, Writing – original draft. LS: Conceptualization, Funding acquisition, Methodology, Supervision, Writing – original draft, Project administration. LC: Conceptualization, Methodology, Writing – review and editing. XZ: Conceptualization, Funding acquisition, Writing – review and editing.
Funding
The author(s) declare that financial support was received for the research, authorship, and/or publication of this article. This study was funded by the National Key R&D Program of China (2020YFA0804000) and the Tou-Yan Innovation Team Program of Heilongjiang Province (2019–15).
Acknowledgments
The authors are grateful to MiBioGen consortium, UK Biobank, GIANT consortium, GWAS Catalog, and IEU OpenGWAS project for their selfless public sharing of GWAS summary data, which provides us with great convenience to carry out this research.
Conflict of interest
The authors declare that the research was conducted in the absence of any commercial or financial relationships that could be construed as a potential conflict of interest.
Publisher’s note
All claims expressed in this article are solely those of the authors and do not necessarily represent those of their affiliated organizations, or those of the publisher, the editors and the reviewers. Any product that may be evaluated in this article, or claim that may be made by its manufacturer, is not guaranteed or endorsed by the publisher.
Supplementary material
The Supplementary Material for this article can be found online at: https://www.frontiersin.org/articles/10.3389/fimmu.2024.1348347/full#supplementary-material
References
1. Collaborators GBDO, Afshin A, Forouzanfar MH, Reitsma MB, Sur P, Estep K, et al. Health effects of overweight and obesity in 195 countries over 25 years. N Engl J Med. (2017) 377:13–27. doi: 10.1056/NEJMoa1614362
2. Fruh SM. Obesity: risk factors, complications, and strategies for sustainable long-term weight management. J Am Assoc Nurse Pract. (2017) 29:S3–S14. doi: 10.1002/2327-6924.12510
3. Pischon T, Boeing H, Hoffmann K, Bergmann M, Schulze MB, Overvad K, et al. General and abdominal adiposity and risk of death in europe. N Engl J Med. (2008) 359:2105–20. doi: 10.1056/NEJMoa0801891
4. Morag B, Kozubek P, Gomulka K. Obesity and selected allergic and immunological diseases-etiopathogenesis, course and management. Nutrients. (2023) 15(17):3813. doi: 10.3390/nu15173813
5. Gomes AC, Hoffmann C, Mota JF. The human gut microbiota: metabolism and perspective in obesity. Gut Microbes. (2018) 9:308–25. doi: 10.1080/19490976.2018.1465157
6. Ursell LK, Haiser HJ, Van Treuren W, Garg N, Reddivari L, Vanamala J, et al. The intestinal metabolome: an intersection between microbiota and host. Gastroenterology. (2014) 146:1470–6. doi: 10.1053/j.gastro.2014.03.001
7. Jandhyala SM, Talukdar R, Subramanyam C, Vuyyuru H, Sasikala M, Nageshwar Reddy D. Role of the normal gut microbiota. World J Gastroenterol. (2015) 21:8787–803. doi: 10.3748/wjg.v21.i29.8787
8. Ley RE, Backhed F, Turnbaugh P, Lozupone CA, Knight RD, Gordon JI. Obesity alters gut microbial ecology. Proc Natl Acad Sci USA. (2005) 102:11070–5. doi: 10.1073/pnas.0504978102
9. Meijnikman AS, Aydin O, Prodan A, Tremaroli V, Herrema H, Levin E, et al. Distinct differences in gut microbial composition and functional potential from lean to morbidly obese subjects. J Intern Med. (2020) 288:699–710. doi: 10.1111/joim.13137
10. Ley RE, Turnbaugh PJ, Klein S, Gordon JI. Microbial ecology: human gut microbes associated with obesity. Nature. (2006) 444:1022–3. doi: 10.1038/4441022a
11. Karlsson CL, Onnerfalt J, Xu J, Molin G, Ahrne S, Thorngren-Jerneck K. The microbiota of the gut in preschool children with normal and excessive body weight. Obes (Silver Spring). (2012) 20:2257–61. doi: 10.1038/oby.2012.110
12. Johnson CH, Ivanisevic J, Siuzdak G. Metabolomics: beyond biomarkers and towards mechanisms. Nat Rev Mol Cell Biol. (2016) 17:451–9. doi: 10.1038/nrm.2016.25
13. Ho JE, Larson MG, Ghorbani A, Cheng S, Chen MH, Keyes M, et al. Metabolomic profiles of body mass index in the framingham heart study reveal distinct cardiometabolic phenotypes. PloS One. (2016) 11:e0148361. doi: 10.1371/journal.pone.0148361
14. Oberbach A, Bluher M, Wirth H, Till H, Kovacs P, Kullnick Y, et al. Combined proteomic and metabolomic profiling of serum reveals association of the complement system with obesity and identifies novel markers of body fat mass changes. J Proteome Res. (2011) 10:4769–88. doi: 10.1021/pr2005555
15. Ottosson F, Brunkwall L, Ericson U, Nilsson PM, Almgren P, Fernandez C, et al. Connection between bmi-related plasma metabolite profile and gut microbiota. J Clin Endocrinol Metab. (2018) 103:1491–501. doi: 10.1210/jc.2017-02114
16. Lee YS, Wollam J, Olefsky JM. An integrated view of immunometabolism. Cell. (2018) 172:22–40. doi: 10.1016/j.cell.2017.12.025
17. Russo L, Lumeng CN. Properties and functions of adipose tissue macrophages in obesity. Immunology. (2018) 155:407–17. doi: 10.1111/imm.13002
18. Dixon JB, O’Brien PE. Obesity and the white blood cell count: changes with sustained weight loss. Obes Surg. (2006) 16:251–7. doi: 10.1381/096089206776116453
19. Kim DJ, Noh JH, Lee BW, Choi YH, Chung JH, Min YK, et al. The associations of total and differential white blood cell counts with obesity, hypertension, dyslipidemia and glucose intolerance in a korean population. J Korean Med Sci. (2008) 23:193–8. doi: 10.3346/jkms.2008.23.2.193
20. Popko K, Gorska E, Stelmaszczyk-Emmel A, Plywaczewski R, Stoklosa A, Gorecka D, et al. Proinflammatory cytokines il-6 and tnf-alpha and the development of inflammation in obese subjects. Eur J Med Res. (2010) 15 Suppl 2:120–2. doi: 10.1186/2047-783x-15-s2-120
21. Schmidt FM, Weschenfelder J, Sander C, Minkwitz J, Thormann J, Chittka T, et al. Inflammatory cytokines in general and central obesity and modulating effects of physical activity. PloS One. (2015) 10:e0121971. doi: 10.1371/journal.pone.0121971
22. Wang Q, Li D, Cao G, Shi Q, Zhu J, Zhang M, et al. Il-27 signalling promotes adipocyte thermogenesis and energy expenditure. Nature. (2021) 600:314–8. doi: 10.1038/s41586-021-04127-5
23. Emdin CA, Khera AV, Kathiresan S. Mendelian randomization. JAMA. (2017) 318:1925–6. doi: 10.1001/jama.2017.17219
24. Carter AR, Sanderson E, Hammerton G, Richmond RC, Davey Smith G, Heron J, et al. Mendelian randomisation for mediation analysis: current methods and challenges for implementation. Eur J Epidemiol. (2021) 36:465–78. doi: 10.1007/s10654-021-00757-1
25. Skrivankova VW, Richmond RC, Woolf BAR, Yarmolinsky J, Davies NM, Swanson SA, et al. Strengthening the reporting of observational studies in epidemiology using mendelian randomization: the strobe-mr statement. JAMA. (2021) 326:1614–21. doi: 10.1001/jama.2021.18236
26. Kurilshikov A, Medina-Gomez C, Bacigalupe R, Radjabzadeh D, Wang J, Demirkan A, et al. Large-scale association analyses identify host factors influencing human gut microbiome composition. Nat Genet. (2021) 53:156–65. doi: 10.1038/s41588-020-00763-1
27. Chen Y, Lu T, Pettersson-Kymmer U, Stewart ID, Butler-Laporte G, Nakanishi T, et al. Genomic atlas of the plasma metabolome prioritizes metabolites implicated in human diseases. Nat Genet. (2023) 55:44–53. doi: 10.1038/s41588-022-01270-1
28. Vuckovic D, Bao EL, Akbari P, Lareau CA, Mousas A, Jiang T, et al. The polygenic and monogenic basis of blood traits and diseases. Cell. (2020) 182:1214–31 e11. doi: 10.1016/j.cell.2020.08.008
29. Orru V, Steri M, Sidore C, Marongiu M, Serra V, Olla S, et al. Complex genetic signatures in immune cells underlie autoimmunity and inform therapy. Nat Genet. (2020) 52:1036–45. doi: 10.1038/s41588-020-0684-4
30. Ahola-Olli AV, Wurtz P, Havulinna AS, Aalto K, Pitkanen N, Lehtimaki T, et al. Genome-wide association study identifies 27 loci influencing concentrations of circulating cytokines and growth factors. Am J Hum Genet. (2017) 100:40–50. doi: 10.1016/j.ajhg.2016.11.007
31. Kalaoja M, Corbin LJ, Tan VY, Ahola-Olli AV, Havulinna AS, Santalahti K, et al. The role of inflammatory cytokines as intermediates in the pathway from increased adiposity to disease. Obes (Silver Spring). (2021) 29:428–37. doi: 10.1002/oby.23060
32. Yengo L, Sidorenko J, Kemper KE, Zheng Z, Wood AR, Weedon MN, et al. Meta-analysis of genome-wide association studies for height and body mass index in approximately 700000 individuals of european ancestry. Hum Mol Genet. (2018) 27:3641–9. doi: 10.1093/hmg/ddy271
33. Pulit SL, Stoneman C, Morris AP, Wood AR, Glastonbury CA, Tyrrell J, et al. Meta-analysis of genome-wide association studies for body fat distribution in 694 649 individuals of european ancestry. Hum Mol Genet. (2019) 28:166–74. doi: 10.1093/hmg/ddy327
34. Berndt SI, Gustafsson S, Magi R, Ganna A, Wheeler E, Feitosa MF, et al. Genome-wide meta-analysis identifies 11 new loci for anthropometric traits and provides insights into genetic architecture. Nat Genet. (2013) 45:501–12. doi: 10.1038/ng.2606
35. Sanna S, van Zuydam NR, Mahajan A, Kurilshikov A, Vich Vila A, Vosa U, et al. Causal relationships among the gut microbiome, short-chain fatty acids and metabolic diseases. Nat Genet. (2019) 51:600–5. doi: 10.1038/s41588-019-0350-x
36. Verbanck M, Chen CY, Neale B, Do R. Detection of widespread horizontal pleiotropy in causal relationships inferred from mendelian randomization between complex traits and diseases. Nat Genet. (2018) 50:693–8. doi: 10.1038/s41588-018-0099-7
37. Pierce BL, Ahsan H, Vanderweele TJ. Power and instrument strength requirements for mendelian randomization studies using multiple genetic variants. Int J Epidemiol. (2011) 40:740–52. doi: 10.1093/ije/dyq151
38. Burgess S, Butterworth A, Thompson SG. Mendelian randomization analysis with multiple genetic variants using summarized data. Genet Epidemiol. (2013) 37:658–65. doi: 10.1002/gepi.21758
39. Hemani G, Zheng J, Elsworth B, Wade KH, Haberland V, Baird D, et al. The mr-base platform supports systematic causal inference across the human phenome. Elife. (2018) 7:e34408. doi: 10.7554/eLife.34408
40. Pierce BL, Burgess S. Efficient design for mendelian randomization studies: subsample and 2-sample instrumental variable estimators. Am J Epidemiol. (2013) 178:1177–84. doi: 10.1093/aje/kwt084
41. Bowden J, Davey Smith G, Burgess S. Mendelian randomization with invalid instruments: effect estimation and bias detection through egger regression. Int J Epidemiol. (2015) 44:512–25. doi: 10.1093/ije/dyv080
42. Bowden J, Davey Smith G, Haycock PC, Burgess S. Consistent estimation in mendelian randomization with some invalid instruments using a weighted median estimator. Genet Epidemiol. (2016) 40:304–14. doi: 10.1002/gepi.21965
43. Hartwig FP, Davey Smith G, Bowden J. Robust inference in summary data mendelian randomization via the zero modal pleiotropy assumption. Int J Epidemiol. (2017) 46:1985–98. doi: 10.1093/ije/dyx102
44. Benjamini Y, Hochberg Y. Controlling the false discovery rate: A practical and powerful approach to multiple testing. J R Statist Soc B. (1995) 57:289–300. doi: 10.1111/j.2517-6161.1995.tb02031.x
45. Pang Z, Chong J, Zhou G, de Lima Morais DA, Chang L, Barrette M, et al. Metaboanalyst 5.0: narrowing the gap between raw spectra and functional insights. Nucleic Acids Res. (2021) 49:W388–W96. doi: 10.1093/nar/gkab382
46. Frolkis A, Knox C, Lim E, Jewison T, Law V, Hau DD, et al. Smpdb: the small molecule pathway database. Nucleic Acids Res. (2010) 38:D480–7. doi: 10.1093/nar/gkp1002
47. Kanehisa M, Goto S, Sato Y, Furumichi M, Tanabe M. Kegg for integration and interpretation of large-scale molecular data sets. Nucleic Acids Res. (2012) 40:D109–14. doi: 10.1093/nar/gkr988
48. Ignacio A, Fernandes MR, Rodrigues VA, Groppo FC, Cardoso AL, Avila-Campos MJ, et al. Correlation between body mass index and faecal microbiota from children. Clin Microbiol Infect. (2016) 22:258 e1–8. doi: 10.1016/j.cmi.2015.10.031
49. Kim G, Yoon Y, Park JH, Park JW, Noh MG, Kim H, et al. Bifidobacterial carbohydrate/nucleoside metabolism enhances oxidative phosphorylation in white adipose tissue to protect against diet-induced obesity. Microbiome. (2022) 10:188. doi: 10.1186/s40168-022-01374-0
50. Naumova N, Alikina T, Tupikin A, Kalmykova A, Soldatova G, Vlassov V, et al. Human gut microbiome response to short-term bifidobacterium-based probiotic treatment. Indian J Microbiol. (2020) 60:451–7. doi: 10.1007/s12088-020-00888-1
51. Ahmad J, Khan I, Zengin G, Mahomoodally MF. The gut microbiome in the fight against obesity: the potential of dietary factors. FASEB J. (2023) 37:e23258. doi: 10.1096/fj.202300864RR
52. Horiuchi H, Kamikado K, Aoki R, Suganuma N, Nishijima T, Nakatani A, et al. Bifidobacterium animalis subsp. Lactis gcl2505 modulates host energy metabolism via the short-chain fatty acid receptor gpr43. Sci Rep. (2020) 10:4158. doi: 10.1038/s41598-020-60984-6
53. Minami J, Kondo S, Yanagisawa N, Odamaki T, Xiao JZ, Abe F, et al. Oral administration of bifidobacterium breve B-3 modifies metabolic functions in adults with obese tendencies in a randomised controlled trial. J Nutr Sci. (2015) 4:e17. doi: 10.1017/jns.2015.5
54. Solito A, Bozzi Cionci N, Calgaro M, Caputo M, Vannini L, Hasballa I, et al. Supplementation with bifidobacterium breve br03 and B632 strains improved insulin sensitivity in children and adolescents with obesity in a cross-over, randomized double-blind placebo-controlled trial. Clin Nutr. (2021) 40:4585–94. doi: 10.1016/j.clnu.2021.06.002
55. Vacca M, Celano G, Calabrese FM, Portincasa P, Gobbetti M, De Angelis M. The controversial role of human gut lachnospiraceae. Microorganisms. (2020) 8(4):573. doi: 10.3390/microorganisms8040573
56. Meehan CJ, Beiko RG. A phylogenomic view of ecological specialization in the lachnospiraceae, a family of digestive tract-associated bacteria. Genome Biol Evol. (2014) 6:703–13. doi: 10.1093/gbe/evu050
57. Lippert K, Kedenko L, Antonielli L, Kedenko I, Gemeier C, Leitner M, et al. Gut microbiota dysbiosis associated with glucose metabolism disorders and the metabolic syndrome in older adults. Benef Microbes. (2017) 8:545–56. doi: 10.3920/BM2016.0184
58. Companys J, Gosalbes MJ, Pla-Paga L, Calderon-Perez L, Llaurado E, Pedret A, et al. Gut microbiota profile and its association with clinical variables and dietary intake in overweight/obese and lean subjects: A cross-sectional study. Nutrients. (2021) 13(6):2032. doi: 10.3390/nu13062032
59. Deng K, Shuai M, Zhang Z, Jiang Z, Fu Y, Shen L, et al. Temporal relationship among adiposity, gut microbiota, and insulin resistance in a longitudinal human cohort. BMC Med. (2022) 20:171. doi: 10.1186/s12916-022-02376-3
60. Shen Y, Liu H, Meng X, Gao A, Liu Y, Ma W, et al. The causal effects between gut microbiota and hemorrhagic stroke: A bidirectional two-sample mendelian randomization study. Front Microbiol. (2023) 14:1290909. doi: 10.3389/fmicb.2023.1290909
61. Luo S, Li W, Li Q, Zhang M, Wang X, Wu S, et al. Causal effects of gut microbiota on the risk of periodontitis: A two-sample mendelian randomization study. Front Cell Infect Microbiol. (2023) 13:1160993. doi: 10.3389/fcimb.2023.1160993
62. Ye X, Liu B, Bai Y, Cao Y, Lin S, Lyu L, et al. Genetic evidence strengthens the bidirectional connection between gut microbiota and periodontitis: insights from a two-sample mendelian randomization study. J Transl Med. (2023) 21:674. doi: 10.1186/s12967-023-04559-9
63. Zhou X, Zhang X, Yu J. Gut mycobiome in metabolic diseases: mechanisms and clinical implication. BioMed J. (2023), 100625. doi: 10.1016/j.bj.2023.100625
64. Ezzatpour S, Mondragon Portocarrero ADC, Cardelle-Cobas A, Lamas A, Lopez-Santamarina A, Miranda JM, et al. The human gut virome and its relationship with nontransmissible chronic diseases. Nutrients. (2023) 15(4):977. doi: 10.3390/nu15040977
65. Dalby MJ. Questioning the foundations of the gut microbiota and obesity. Philos Trans R Soc Lond B Biol Sci. (2023) 378:20220221. doi: 10.1098/rstb.2022.0221
66. Zhan Y, Wang J, He X, Huang M, Yang X, He L, et al. Plasma metabolites, especially lipid metabolites, are altered in pregnant women with gestational diabetes mellitus. Clin Chim Acta. (2021) 517:139–48. doi: 10.1016/j.cca.2021.02.023
67. Ding S, Chen M, Liao Y, Chen Q, Lin X, Chen S, et al. Serum metabolic profiles of chinese women with perimenopausal obesity explored by the untargeted metabolomics approach. Front Endocrinol (Lausanne). (2021) 12:637317. doi: 10.3389/fendo.2021.637317
68. Naughton SS, Mathai ML, Hryciw DH, McAinch AJ. Linoleic acid and the pathogenesis of obesity. Prostaglandins Other Lipid Mediat. (2016) 125:90–9. doi: 10.1016/j.prostaglandins.2016.06.003
69. Mamounis KJ, Yasrebi A, Roepke TA. Linoleic acid causes greater weight gain than saturated fat without hypothalamic inflammation in the male mouse. J Nutr Biochem. (2017) 40:122–31. doi: 10.1016/j.jnutbio.2016.10.016
70. Singh RK, Fullerton MD, Vine D, Bakovic M. Mechanism of hypertriglyceridemia in ctp : phosphoethanolamine cytidylyltransferase-deficient mice. J Lipid Res. (2012) 53:1811–22. doi: 10.1194/jlr.M021881
71. Jacobs RL, Zhao Y, Koonen DP, Sletten T, Su B, Lingrell S, et al. Impaired de novo choline synthesis explains why phosphatidylethanolamine N-methyltransferase-deficient mice are protected from diet-induced obesity. J Biol Chem. (2010) 285:22403–13. doi: 10.1074/jbc.M110.108514
72. Raubenheimer PJ, Nyirenda MJ, Walker BR. A choline-deficient diet exacerbates fatty liver but attenuates insulin resistance and glucose intolerance in mice fed a high-fat diet. Diabetes. (2006) 55:2015–20. doi: 10.2337/db06-0097
73. Shi L, Brunius C, Lehtonen M, Auriola S, Bergdahl IA, Rolandsson O, et al. Plasma metabolites associated with type 2 diabetes in a swedish population: A case-control study nested in a prospective cohort. Diabetologia. (2018) 61:849–61. doi: 10.1007/s00125-017-4521-y
74. Chen S, Wu Q, Zhu L, Zong G, Li H, Zheng H, et al. Plasma glycerophospholipid profile, erythrocyte N-3 pufas, and metabolic syndrome incidence: A prospective study in chinese men and women. Am J Clin Nutr. (2021) 114:143–53. doi: 10.1093/ajcn/nqab050
75. Kiani AK, Paolacci S, Calogero AE, Cannarella R, Di Renzo GC, Gerli S, et al. From myo-inositol to D-chiro-inositol molecular pathways. Eur Rev Med Pharmacol Sci. (2021) 25:2390–402. doi: 10.26355/eurrev_202103_25279
76. Croze ML, Soulage CO. Potential role and therapeutic interests of myo-inositol in metabolic diseases. Biochimie. (2013) 95:1811–27. doi: 10.1016/j.biochi.2013.05.011
77. Mierziak J, Burgberger M, Wojtasik W. 3-hydroxybutyrate as a metabolite and a signal molecule regulating processes of living organisms. Biomolecules. (2021) 11(3):402. doi: 10.3390/biom11030402
78. Htun KT, Pan J, Pasanta D, Tungjai M, Udomtanakunchai C, Chancharunee S, et al. Identification of metabolic phenotypes in young adults with obesity by (1)H nmr metabolomics of blood serum. Life (Basel). (2021) 11(6):574. doi: 10.3390/life11060574
79. Wijayatunga NN, Sams VG, Dawson JA, Mancini ML, Mancini GJ, Moustaid-Moussa N. Roux-en-Y gastric bypass surgery alters serum metabolites and fatty acids in patients with morbid obesity. Diabetes Metab Res Rev. (2018) 34:e3045. doi: 10.1002/dmrr.3045
80. Vozarova B, Weyer C, Lindsay RS, Pratley RE, Bogardus C, Tataranni PA. High white blood cell count is associated with a worsening of insulin sensitivity and predicts the development of type 2 diabetes. Diabetes. (2002) 51:455–61. doi: 10.2337/diabetes.51.2.455
81. Gu Y, Hu K, Huang Y, Zhang Q, Liu L, Meng G, et al. White blood cells count as an indicator to identify whether obesity leads to increased risk of type 2 diabetes. Diabetes Res Clin Pract. (2018) 141:140–7. doi: 10.1016/j.diabres.2018.04.041
82. Zhou C, Gao Y, Ding P, Wu T, Ji G. The role of cxcl family members in different diseases. Cell Death Discov. (2023) 9:212. doi: 10.1038/s41420-023-01524-9
Keywords: obesity, gut microbiota, plasma metabolites, peripheral cells, inflammatory cytokines, Mendelian randomization, mediation analysis
Citation: Li Y, Wang X, Zhang Z, Shi L, Cheng L and Zhang X (2024) Effect of the gut microbiome, plasma metabolome, peripheral cells, and inflammatory cytokines on obesity: a bidirectional two-sample Mendelian randomization study and mediation analysis. Front. Immunol. 15:1348347. doi: 10.3389/fimmu.2024.1348347
Received: 02 December 2023; Accepted: 26 February 2024;
Published: 15 March 2024.
Edited by:
Veronica I. Dodero, Bielefeld University, GermanyReviewed by:
Luis Rodrigo Macias Kauffer, Universität zu Lübeck, GermanyGeorge Grant, University of Aberdeen, United Kingdom
Akihiko Oka, Shimane University, Japan
Copyright © 2024 Li, Wang, Zhang, Shi, Cheng and Zhang. This is an open-access article distributed under the terms of the Creative Commons Attribution License (CC BY). The use, distribution or reproduction in other forums is permitted, provided the original author(s) and the copyright owner(s) are credited and that the original publication in this journal is cited, in accordance with accepted academic practice. No use, distribution or reproduction is permitted which does not comply with these terms.
*Correspondence: Lei Shi, shilei_0328@hrbmu.edu.cn; Liang Cheng, liangcheng@hrbmu.edu.cn; Xue Zhang, xuezhang@pumc.edu.cn
†These authors share first authorship