 Yue Liang1,2
 HanChen Wang1,2,3,4
 Noé Seija5,6
 Yun Hsiao Lin1,2
 Lin Tze Tung1,2,3,4
 Javier M. Di Noia5,6,7,8
 David Langlais2,3,4,8
 Anastasia Nijnik1,2*
- 1Department of Physiology, McGill University, Montreal, QC, Canada
- 2McGill University Research Centre on Complex Traits, McGill University, Montreal, QC, Canada
- 3McGill Genome Centre, Montreal, QC, Canada
- 4Department of Human Genetics, McGill University, Montreal, QC, Canada
- 5Institut de Recherches Cliniques de Montréal, Montreal, QC, Canada
- 6Molecular Biology Programs, Université de Montréal, Montreal, QC, Canada
- 7Department of Medicine, Université de Montréal, Montreal, QC, Canada
- 8Department of Microbiology and Immunology, McGill University, Montreal, QC, Canada
Introduction: BAP1 is a deubiquitinase (DUB) of the Ubiquitin C-terminal Hydrolase (UCH) family that regulates gene expression and other cellular processes, through its direct catalytic activity on the repressive epigenetic mark histone H2AK119ub, as well as on several other substrates. BAP1 is also a highly important tumor suppressor, expressed and functional across many cell types and tissues. In recent work, we demonstrated a cell intrinsic role of BAP1 in the B cell lineage development in murine bone marrow, however the role of BAP1 in the regulation of B cell mediated humoral immune response has not been previously explored.
Methods and results: In the current study, we demonstrate that a B-cell intrinsic loss of BAP1 in activated B cells in the Bap1fl/fl Cγ1-cre murine model results in a severe defect in antibody production, with altered dynamics of germinal centre B cell, memory B cell, and plasma cell numbers. At the cellular and molecular level, BAP1 was dispensable for B cell immunoglobulin class switching but resulted in an impaired proliferation of activated B cells, with genome-wide dysregulation in histone H2AK119ub levels and gene expression.
Conclusion and discussion: In summary, our study establishes the B-cell intrinsic role of BAP1 in antibody mediated immune response and indicates its central role in the regulation of the genome-wide landscapes of histone H2AK119ub and downstream transcriptional programs of B cell activation and humoral immunity.
Introduction
B lymphocytes are the central mediators of humoral immunity in response to infections and vaccinations (1). During humoral immune response naïve B cells make a multitude of cell fate decisions and differentiate into germinal center (GC) B cells, memory B cells, and plasma cells. Such differentiation pathways are tightly controlled by a complex network of transcriptional regulators, as for example PAX5 acts to maintain the B cell lineage identity, BCL6 drives GC transcriptional programs (2), and BLIMP1 and XBP1 promote plasma cell differentiation (3). Disruption of such transcriptional programs can result in life-threatening immunodeficiencies or carcinogenesis (1, 4).
Epigenetic regulators cooperate with transcription factors in the control of cellular gene expression. Polycomb repressive complexes (PRCs) are the central regulators of cell identity and differentiation (5, 6), and include the histone H3K27me3 methyltransferase PRC2 and the histone H2AK119ub E3 ubiquitin ligase PRC1 (7). While PRC2 is required for the normal induction of GC reaction and humoral immunity (8–11), and is widely investigated for its roles in lymphomagenesis and as a lymphoma drug target (4, 12, 13), the roles of PRC1 in humoral immunity are less well explored (14). The B-cell restricted loss of the PRC1 subunit BMI1 (also known as PCGF4) modulated GC reaction and enhanced humoral immunity in the context of chronic viral infections (15), while the loss of PRC1-binding transcription factor YY1 disrupted the progression of the GC reaction and impaired humoral immunity (16–18).
H2AK119ub is a highly abundant repressive epigenetic mark, estimated to occur on ~10% of nucleosomes in a typical mammalian cell (19). Thus, multiple chromatin-associated deubiquitinases are known to antagonize PRC1 by removing H2AK119ub from chromatin (H2A-DUBs) (20, 21). In previous work, we and others explored the roles of the DUB MYSM1 in B cell development (22, 23), humoral immune response (24), and B cell carcinogenesis (25), while others reported on the role of USP16 in hematopoiesis and the regulation of transcriptional programs in naïve B cells (26, 27). It is however important to stress that such DUBs are multifunctional proteins with many known substrates, and their specific roles in the regulation of the genome-wide H2AK119ub epigenetic landscapes or specific functions in the cell-fate decisions of the GC reaction and humoral immunity are poorly understood (20, 21).
BAP1 is a member of the ubiquitin C-terminal hydrolase (UCH) family of DUBs and is widely recognized as one of the major DUBs for H2AK119ub (28). At chromatin BAP1 acts in complex with ASXLs, HCF1 and OGT (29–32), and also interacts with transcription factors FOXK1/2 (33, 34), YY1 (35), KLF5 (36), and PGC1α (37). However, beyond the role of BAP1 as an epigenetic regulator of gene expression, it is known to have other substrates and functions both in the nucleus and the cytosol (28), as for example promoting apoptosis through its DUB catalytic activity on IP3R3 (38) and in DNA damage repair through the homologous recombination (HR) pathway (39).
BAP1 is an important tumor suppressor, mutated in sporadic uveal melanomas, mesotheliomas, renal cell carcinomas, hepatocellular carcinomas, and to a lesser extent other cancers (28, 40–42), while BAP1-interacting ASXL proteins are commonly mutated in myeloproliferative disorders (43, 44). Furthermore, rare BAP1 germline mutations result in the so called ‘BAP1 cancer syndrome’, with a high incidence of uveal melanoma, mesothelioma, and other malignancies (28, 45, 46). In mouse models, BAP1 is known to be essential for normal progression of embryonic development, and its constitutive loss results in lethality at E9.5 of gestation (47). Interestingly, an inducible loss of BAP in the Bap1fl/fl CreERT2 mouse model resulted in hematologic and immune pathology, including myelodysplastic syndrome (47), impaired thymocyte development (48), and defective peripheral T cell expansion (48), with global increases in the H2AK119ub levels in the affected cells.
In recent work, we analyzed the role of BAP1 in B cells using the Bap1fl/fl mb1-Cre mouse model, with a selective loss of BAP1 throughout the B cell lineage (49). We demonstrated the cell-intrinsic requirement for BAP1 in the normal progression of B cell development, and established its role as a DUB for histone H2AK119ub in the regulation of the transcriptional programs of cell proliferation in pre-B cells (49).While BAP1 remains highly expressed throughout the B cell lineage (50), its role in the regulation of B cell activation and humoral immune response remains unknown and is the focus of our current work.
Materials and methods
Mice
The Bap1tm1c(EUCOMM)Hmgu mouse strain carries a conditional (floxed) allele of the Bap1 gene; it was generated by the Wellcome Trust Sanger Institute Mouse Genetics Project and Infrafrontier/EMMA (www.infrafrontier.eu) (51–53), and described in our recent work (49). The strain was bred to the transgenic line expressing Cre recombinase under the control of the B cell lineage specific promoter mb1-Cre (from Prof. Michael Reth, MPI für Immunbiologie und Epigenetik, Germany) (54), and to the B6.129P2(Cg)-Ighg1tm1(cre)Cgn/J mouse strain (Jackson Labs: 010611, Cγ1-cre) expresses Cre recombinase from the endogenous immunoglobulin heavy constant gamma 1 locus (Ighg1) (55). As we previously described (49), the loxP sites flank exons 6-12 (ENSMUSE00000121807-00000121801) of the main ENSMUST00000022458.10 Bap1 transcript, and the Bap1Δ allele is predicted to disrupt BAP1 protein coding sequence from amino acid 126 (out of 728), precluding full expression of the N-terminal UCH catalytic domain and all the downstream domains of the protein. All lines were on the C57BL/6 genetic background. Both male and female animals were used in experiments, sex-matched between test and control groups. Experiments were in accordance with the guidelines of the Canadian Council on Animal Care and protocol MCGL-2011-6029 approved by the McGill Animal Care Committee. Genotyping was performed in house using the DreamTaq DNA Polymerase (Thermo Fisher Scientific) and primers from IDT Technologies.
Cell culture
Mouse B cell line CH12F3, which is a widely used model for the study of B cell activation and class switching (56), was maintained at 0.5-2 x10⁶ cells/mL in RPMI-1640 (Thermo Fisher Scientific) with 10% Fetal Calf Serum (FCS, Thermo Fisher Scientific), 2mM L-Glutamine, 100μg/mL streptomycin, 100U/mL penicillin (Thermo Fisher Scientific), and 5% NCTC (Sigma-Aldrich).
CRISPR-Cas9 gene targeting
Bap1Δ/Δ CH12F3 cells were generated through CRISPR-Cas9 gene editing according to our previously described protocols (49). gRNAs were designed with http://crispr.mit.edu online tools (57): gRNA_Bap1_Exon4_Chr14:32,066,155: gcaaatggatcgaagagcgc, gRNA_Bap1_Exon5_Chr14: 32,066,654: ggcgtgagtggcacaagagt, and cloned into the pSpCas9(BB)-2A-GFP (PX458) plasmid (Addgene, #48138). Sequence-verified plasmids were introduced into CH12F3 cells through nucleofection using the Amaxa Cell Line Nucleofector Kit V (Lonza) according to the manufacturer’s protocol. Single GFP+ IgA- cells were sorted on day-2, and expanded for further 14 days to generate single cell clones. Loss of BAP1 protein was validated with Western blotting and the following antibodies: anti-BAP1 (D7W7O, Cell Signaling Technology) and anti-β-Actin (D6A8, Cell Signaling Technology).
CH12F3 cell assays
AlamarBlue fluorogenic assay (ThermoFisher Scientific) was performed according to the manufacturer’s protocols, as we previously described (49). Cells were seeded into 96-well plates at 105/mL, rested overnight, and the AlamarBlue reagent added at 10% (v/v). Fluorescence intensity was recorded at the 4-hour timepoint on the EnSpire Plate reader (Perkin Elmer), at the 560nm excitation and 590nm emission wavelengths. For the CFSE-dilution assay, 5 × 10⁶ cells were incubated in 2 μM CellTrace™ CFSE (ThermoFisher Scientific) in 1mL of PBS for 10 min at 37°C. The cells were washed in PBS with 5% FBS, followed by a second wash in PBS. The cells were re-suspended in complete media at 2 × 10⁵/mL and maintained in culture overnight at 37°C 5% CO2. The cells were counterstained with Fixable Viability Dye eFluo780 (ThermoFisher Scientific), and the data were acquired on the BD Fortessa and analyzed with FlowJo (Tree Star, BD Biosciences) software. In some assays the CH12F3 cells were stimulated with TGF-β (1ng/ml, R&D Systems), IL-4 (10 ng/ml, Peprotech), and anti–CD40 (1μg/ml, BD Biosciences).
Primary B cell cultures
The protocols were as described in our recent work (58). Briefly, naïve primary mouse B cells were purified from splenocytes using EasySep™ Mouse B Cell Isolation Kit (19854, Stem Cell Technologies) and were cultured at 37°C with 5% CO2 in iGB media: RPMI-1640 (Wisent), supplemented with 10% FBS (Wisent), 1% penicillin/streptomycin (Wisent), 0.1 mM 2-mercaptoethanol (BioShop), 10 mM HEPES, and 1 mM sodium pyruvate. Mouse primary B cells were labeled with 2.5μM CellTrace™ Violet (C34557, Invitrogen) in PBS for 20 minutes at 37°C before quenching as recommended by the supplier. For switching to IgA, B cells were stimulated with mouse recombinant IL-21 (20ng/mL, Peprotech), TGF-β1 (5ng/mL), retinoic acid (1μM, Sigma), F(ab’)2 goat anti-mouse IgM (5μg/mL, Jackson ImmunoResearch) and anti-CD40 mAb FGK45 (5μg/mL, prepared in-house from hybridoma), as previously described (59). To measure class switching to IgA, cells were treated with mouse FcR blocking reagent (130-092-575, Miltenyi Biotec) then stained with anti IgA-PE (1040-09, Southern Biotech). Dead cells were excluded using eBioscience™ Fixable Viability Dye eFluor™ 780 (65-0865-14, Invitrogen). Induced GC B cells (iGBs) were generated on 40LB feeder cells (a gift from Dr. Daisuke Kitamura, Tokyo University of Science, Tokyo, Japan) (60). One day prior to B cell plating, 40LB cells were treated with 10μg/mL mitomycin C (SKU M-1108, AG Scientific) at 0.5 × 10⁶ cells per mL in 10cm dishes with DMEM media supplemented with 10% FBS (Wisent) and 1% penicillin/streptomycin (Wisent). After treatment, the cells were washed 6 times with 10 mL of PBS and plated at 1.3×10⁵ cells per well in 0.5 mL (24-well plate). Subsequently, purified naive B cells were plated onto the 40LB feeders at 2x10⁵ cells in 1mL of iGB media, supplemented with 1 ng/mL IL-4 (214-14, Peprotech). On days 3, 4 and 5, the cells were either harvested for downstream analyses in PBS with 0.5% BSA and 2 mM EDTA or fed with 1 mL of fresh iGB media with 1 ng/mL IL-4. Class switching to IgG1 was analyzed by flow cytometry, treating with mouse FcR blocking reagent and staining the cells with anti-IgG1 PE (550083, A85-1, BD Pharmingen) and anti-IgM BV421 (562595, R6-60.2, BD Pharmingen). For the analyses of cell division, iGBs were stained with 2.5μM CellTrace™ Violet on the day of plating, according to the manufacturer’s protocol. Cell numbers for the iGBs growth curves were calculated using Countess 3 Automated Cell Counter.
Mouse immunization
For the phycoerythrin (PE) immunization the mice were injected subcutaneously with immunogen emulsion comprising 100 μl CFA (Thermo Fisher Scientific), 15 μg of R-PE (ProZyme, Cedarlane), and 100 μl PBS, vortexed for 45 min prior to the injection. For the immunization with sheep red blood cells (SRBCs), the mice were injected intravenously with 109 SRBCs (Innovative Research IC10-0210, Cedarlane) in 300uls of PBS. Immunization protocols were previously described (24, 61).
Analyses of antibody titers
ELISA analyses of total immunoglobulin levels in the serum of naive mice (or in the supernatants from B cell cultures) used rat anti-mouse capture antibodies IgM II/41, IgG1 A85-3, and IgG3 R2-38 (BD Biosciences, 1 μg/ml) followed by detection with goat anti-mouse IgG(H+L)-HRP (Southern Biotechnologies). For the analysis of total IgG2c levels capture antibody goat anti-mouse Ig (H+L) and detection antibody goat anti-mouse IgG2c-biotin (Southern Biotechnologies), followed by streptavidin-HRP (Thermo Fisher Scientific) were used. Purified mouse IgM, IgG1, IgG2c, and IgG3 isotype control antibodies (BioLegend) were used as standards for the calculation of immunoglobulin concentrations. In the ELISA assays for the detection of PE-specific antibodies, the plates were coated with R-PE (10 μg/ml, ProZyme, Cedarlane), and developed with biotin goat anti-mouse IgM, IgG1, IgG2c, or IgG3 (Southern Biotechnologies), followed by streptavidin-HRP (Thermo Fisher Scientific). All the ELISAs were developed with SuperAquaBlue substrate (Thermo Fisher Scientific), and data acquired at 405 nm on EnSpire 2300 plate reader (PerkinElmer). Throughout the ELISA procedure, PBS with 0.05% Tween-20 was used as the Wash Buffer, PBS with 1% bovine serum albumin (Wisent) as the Blocking Buffer, and PBS with 0.1% bovine serum albumin (Wisent) as the Assay Diluent.
The detection of SRBC-specific antibodies was performed by flow cytometry, as described previously (62). Briefly, mouse serum samples were pre-diluted 1:60 in PBS and incubated with 3x 10⁵ SRBC for 30 min on ice. The SRBCs were washed and stained with goat anti-mouse IgG AlexaFluor488 (Poly4053, BioLegend, 1:200), or with goat anti-mouse IgM-biotin (1020-08, Southern Biotechnologies, 1:750), or IgG1-biotin (1070-08, Southern Biotechnologies, 1:750), followed by streptavidin – PerCP-Cy5.5 (BioLegend). Following thorough washing, the samples were analyzed on BD Fortessa and data processed with FlowJo software (Tree Star, BD Biosciences). SRBCs pre-incubated with serum of naive mice and stained as described above were analyzed as negative controls.
Flow cytometry
Cell suspensions of mouse tissues were prepared in RPMI-1640 (Thermo Fisher Scientific) with 2% (v/v) FCS, 100μg/ml streptomycin and 100U/ml penicillin (Thermo Fisher Scientific). The cells were stained for surface-markers in PBS with 2% FCS for 20 min on ice, with the following antibodies, as summarized in Supplementary Table S1: Alexa Fluor 488 anti-GL7 (GL7, Biolegend); APC anti-CD21/CD35 (7E9, Biolegend), anti-CD86 (GL-1, Biolegend), anti-CD267/TACI (ebio8F10-3, eBioscience), and anti-IgD (11-26c.2a, BioLegend); APC-eFluor780 anti-CD45R/B220 (RA3-6B2, ThermoFisher); APC-Cy7 anti-CD5 (53-7.3, Biolegend); Brilliant UltraViolet 395 anti-CD43 (S7, BD Biosciences); Brilliant Violet 421 anti-CD95/Fas (Jo2, BD Biosciences) and anti-CD138 (281-2, Biolegend); Brilliant Violet 650 anti-CD45R/B220 (RA3-6B2, BioLegend); Biotin anti-IgG1 (polyclonal, 1070-08, Southern Biotech); eFluor450 anti-CD45R/B220 (RA3-6B2, Thermo Fisher); FITC anti-CD23 (B3B4, Invitrogen) and anti-Ki67 (SolA15, eBioscience); Pacific Blue anti-IgD (11-26c.2a, BioLegend); PE anti-Blimp-1 (5E7, Biolegend), anti-CD184/CXCR4 (L276F12, Biolegend) and anti-IgM (II/41, Thermo Fisher); PE-Cy7 anti-CD19 (6D5, BioLegend), anti-CD21/CD35 (eBio8D9, Invitrogen), and anti-CD38 (90, Invitrogen); PerCP-Cy5.5 anti-CD4 (RM4-4, Biolegend), anti-CD8a (53-6.7, Biolegend), anti-CD11b (M1/70, eBioscience), anti-CD19 (1D3, Tonbo Biosciences), anti-CD45R/B220 (RA3-6B2, BioLegend), anti-IgD (11-26c.2a Biolegend), anti-CD93 (AA4.1, Biolegend), anti-NK1.1 (PK136, Biolegend), and anti-TER119 (Ly-76, Biolegend). Brilliant Violet 785 Streptavidin (Biolegend) was used to detect biotin-conjugated antibodies. Viability Dye eFluor® 506 (eBioscience) was used to discriminate dead cells. Compensation was performed with BD CompBeads (BD Biosciences). The data were acquired on BD Fortessa and analyzed with FlowJo software (Tree Star, BD Biosciences).
Cell isolation and sorting
Total B cells were isolated from mouse spleens via magnetic enrichment using with the EasySep Mouse CD19 Positive Selection Kit II (Stem Cell Technologies). For the FACS-sorting of B cell subsets, mouse spleens were mechanically dissociated in PBS with 0.1% BSA and 2mM EDTA, passed through 40 μm cell-strainers, and subjected to red blood cell lysis in ACK buffer (0.15M NH4Cl, 10mM KHCO3, 0.1mM EDTA). Cells were stained with the following antibodies, as summarized in Supplementary Table S2: Alexa Fluor 488 anti-GL7 (GL7, Biolegend), Brilliant Violet 421 anti-CD95/Fas (Jo2, BD Biosciences), and Brilliant Violet 650 anti-CD45R/B220 (RA3-6B2, BioLegend). Viability Dye 7-AAD (Biolegend) was used to discriminate dead cells. Sorting was performed on the FACSAria (BD Biosciences).
Chromatin immunoprecipitation
ChIP was performed as described previously (49, 63). Cells were fixed with 1% formaldehyde in cell culture media for 10 min at room temperature, followed by addition of 0.125 M glycine to stop the fixation. Nuclei were extracted with 5 min lysis in 0.25% Triton buffer, followed by 30 minutes in 200mM NaCl buffer. Nuclei were resuspended in sonication buffer and sonicated for 12 cycles of 30 sec with a digital sonifier (Branson Ultrasonics) at 80%, with 30 sec rest in cooled circulating water. Beads immunocomplexes were prepared overnight by conjugating 40μL of Dynabeads Protein G (Thermo Fisher Scientific) with antibodies anti-BAP1 (Cell Signaling Technology, D1W9B, 52.8 μg) or anti-H2AK119ub (Cell Signaling Technology, D27C4, 5 μg). Immunoprecipitation was performed with an overnight incubation of the antibody-bead matrices with sheared chromatin from the equivalent of 5x10⁶ cells. Six washes were performed with low-stringency buffers, and samples de-crosslinked by overnight incubation in 1% SDS buffer at 65°C. Following treatments with RNaseA and Proteinase K, ChIP DNA was purified using Qiaquick PCR Cleanup kit (Qiagen).
ChIP-seq libraries were prepared using the Illumina TruSeq kit and sequenced on the Illumina NovaSeq 6000 in a paired-end 100bp configuration, with input DNA from the same cells sequenced as the negative controls. The reads were mapped to the UCSC mouse mm9 reference genome with Bowtie 1.0.0 (64), and BAP1 binding sites identified using the MACS1.4 peak detection algorithm (65), comparing for read enrichment against input DNA from the same cells. Normalized sequence read density profiles (bigwig) were generated with Homer (66) and visualized with IGV (67). Gene ontology (GO) enrichment analysis on the genes associated with the BAP1 ChIP-Seq binding clusters was performed on GREAT 4.0.4 (68) with Basal plus extension, searching for genes within 2kb upstream, 2kb downstream, or 200kb in distal.
RNA sequencing
RNA-seq protocols were as previously described (49, 69). Briefly, RNA was isolated using the Mag-MAX total RNA kit (Ambion) and quality assessed using Bioanalyzer RNA Pico chips (Agilent). rRNA depletion and library preparation were performed using the SMARTer Stranded RNA-Seq kit (Takara Clontech). The libraries were sequenced on an Illumina Novaseq 6000 in a paired-end 100 bp configuration aiming for 50x106 reads per sample. The quality of the sequencing reads was confirmed using the FastQC tool (Babraham Bioinformatics), and low-quality bases were trimmed from the read extremities using Trimmomatic v.0.33 (70). The reads were then mapped to the mouse UCSC mm9 reference genome assembly using Hisat2 v2.2.1 (71–73). Gene expression was quantified by counting the number of uniquely mapped reads with featureCounts using default parameters (74). We retained genes that had an expression level of at least 5 counts per 106 reads (CPM) in at least 4 of the samples (75). TMM normalization and differential gene expression analyses were conducted using the edgeR Bioconductor package (76). Dimension reduction analysis was performed using the Principal Component and Partial Least Squares regression method (77). Pairwise comparisons were performed between genotypes or between treatments, and genes with changes in expression ≥ |2.0| fold and Benjamini-Hochberg adjusted p values ≤ 0.05 were considered significant. Gene ontology (GO) enrichment analyses on differentially expressed gene clusters were performed with DAVID Bioinformatics Resources 6.8 (78), and Gene Set Enrichment Analysis (GSEA) was performed with GSEA tool v4.3.2 using MSigDB v2022.1 with default configuration and permutation within gene sets (79). For the RNA-Seq data consolidation with the ChIP-Seq data, full gene annotations were obtained from UCSC mouse mm9 reference genome. An in-house Python script was developed to load the genomic locations of ChIP-Seq binding sites and RNA-Seq dysregulated genes, and search for gene TSS within a specific distance to each ChIP-Seq binding site, as previously described (80).
Statistical analyses
Statistical analyses used Prism 9.5.1 (GraphPad Inc.), with Student’s t-test for two datasets and ANOVA for multiple comparisons, with further information is provided in Figure Legends.
Results
B-cell specific loss of BAP1 results in impaired antibody production
Due to the high expression of Bap1 throughout the B cell lineage (Supplementary Figure S1) (50, 81) and its important role as a DUB for H2AK119ub in other cell types (28), we hypothesized that BAP1 may act as an important regulator of the transcriptional programs of B cell mediated immune response. In order to test this, we adopted the previously established Bap1fl/fl mb1-Cre mouse model, with the selective loss of BAP1 throughout the B cell lineage (49). We observed a strong reduction in total antibody titers in the serum of naïve Bap1fl/fl mb1-Cre mice, relative to control mice of Bap1fl/+ and Bap1fl/+ mb1-Cre genotypes, including both IgM antibodies and class-switched IgG1, IgG2c, and IgG3 antibodies (Figures 1A, B). We proceeded to challenge the mice with subcutaneous injections of phycoerythrin (PE) in CFA adjuvant and observed a strong reduction in the antigen specific antibody responses in Bap1fl/fl mb1-Cre relative to control mice, following both primary and boost immunizations, and affecting both IgM and class-switched IgG1, IgG2c and IgG3 isotypes (Figures 1C–E). Overall, this indicates the importance of BAP1 expression in the B cell lineage for the induction of B cell mediated immune response.
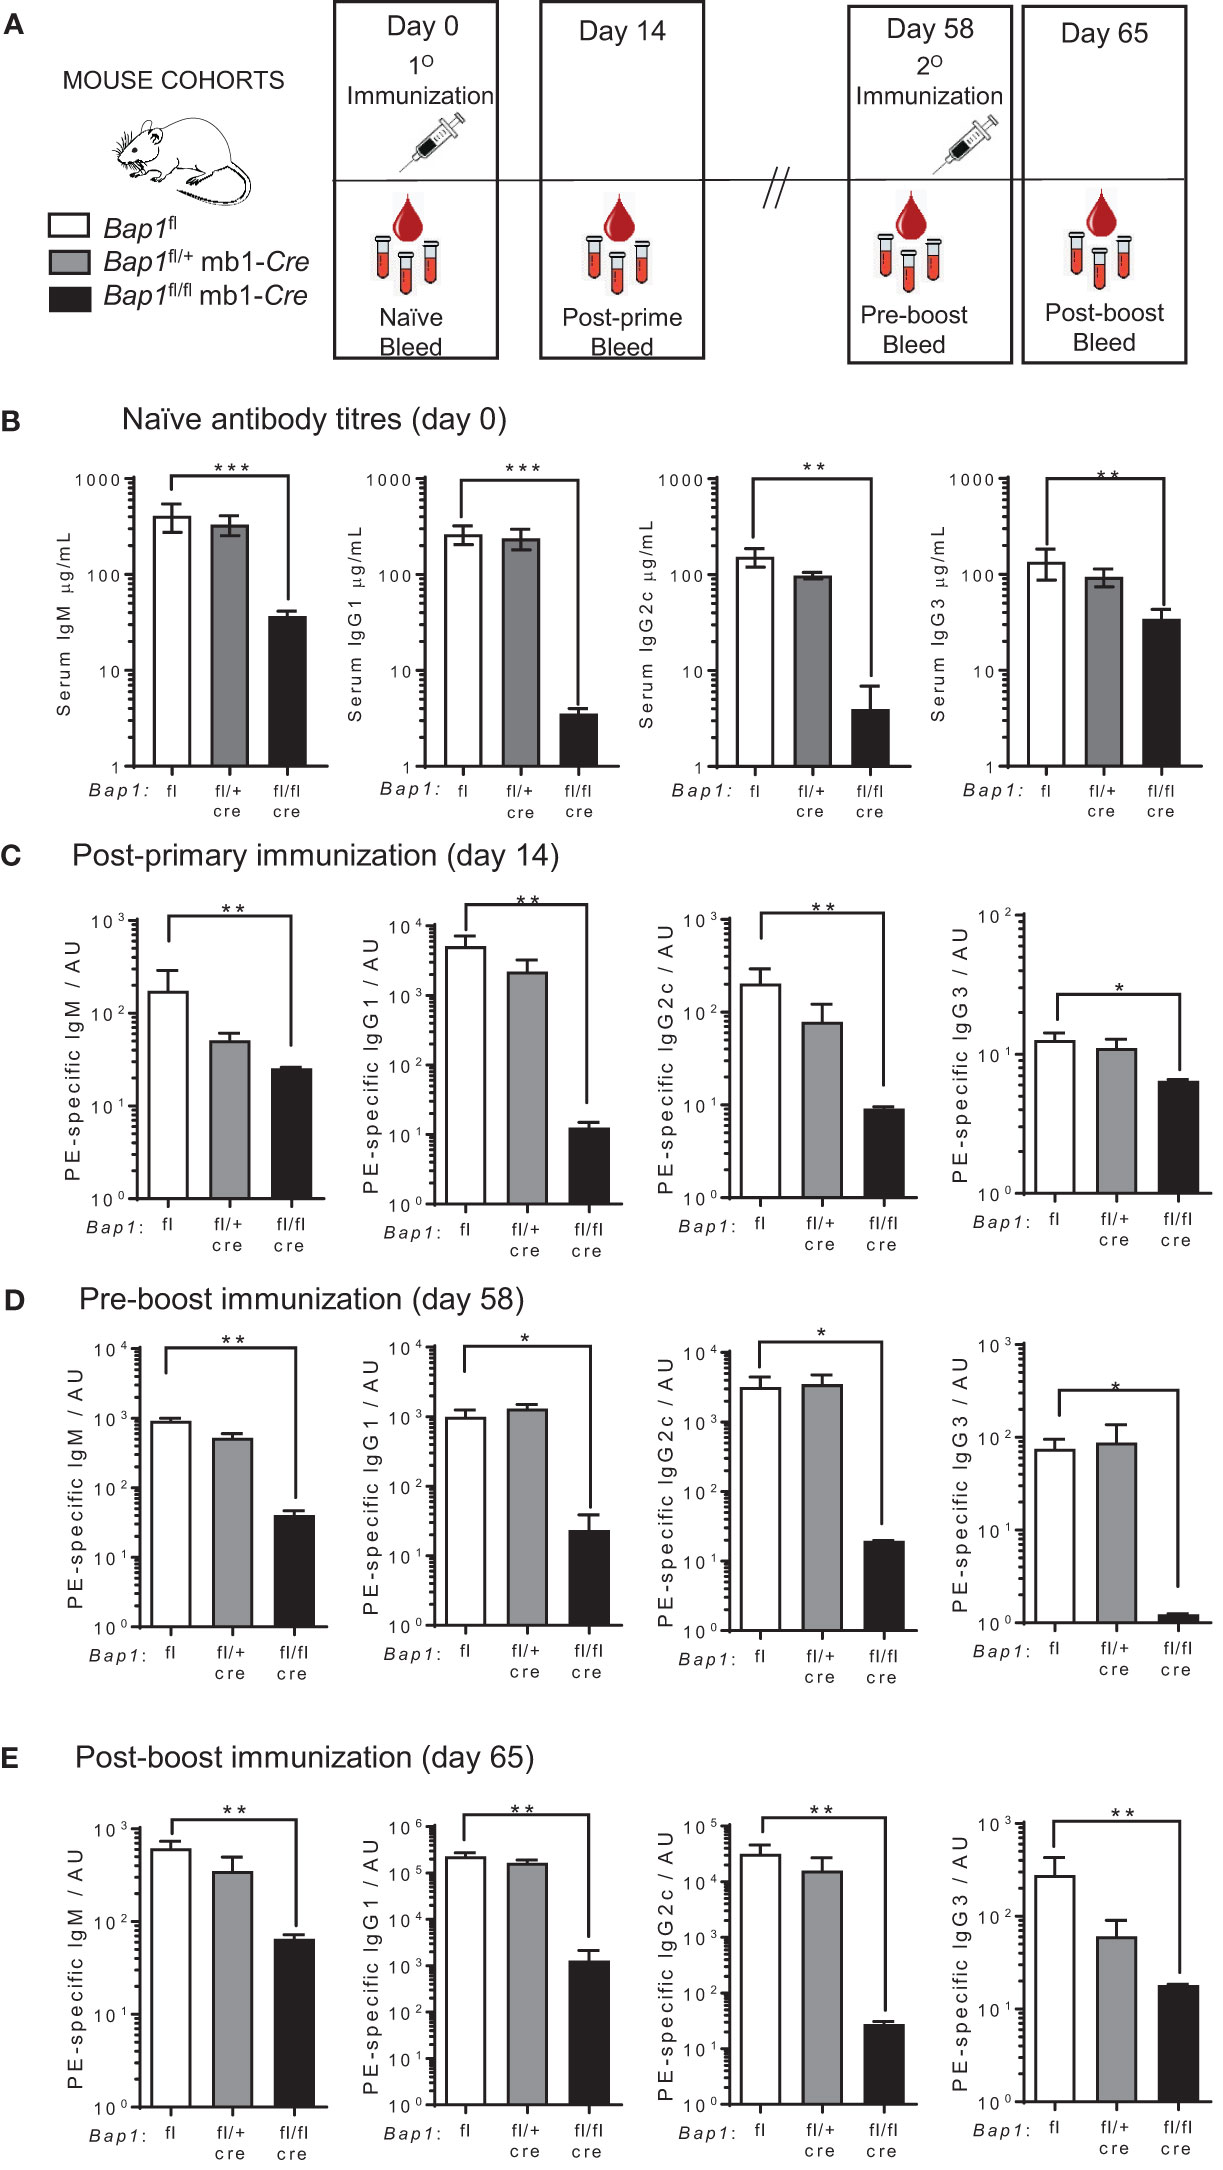
Figure 1 Reduced antibody levels and impaired antibody mediated immune response in Bap1fl/fl mb1-Cre mice. (A) Schematic of the experimental plan and timeline for the analyses of antibody production in Bap1fl/fl mb1-Cre and control Bap1fl and Bap1fl/+ mb1-Cre mice. The mice received primary (day 0) and boost (day 58) immunizations of PE in CFA; post-primary immunization serum samples were acquired on day 14, pre-boost serum samples on day 58, and post-boost serum samples on day 65. (B) Levels of total IgM, IgG1, IgG2c, and IgG3 antibody isotypes in the serum of naïve mice of Bap1fl/fl mb1-Cre and control Bap1fl and Bap1fl/+ mb1-Cre genotypes. The data for IgM, IgG1, and IgG3 is from 6-11 mice per genotype, and for IgG2c from 3-6 mice per genotype, consolidated from two independent experiments. (C–E) Antigen specific antibody titers in the mice of Bap1fl/fl mb1-Cre and control Bap1fl and Bap1fl/+ mb1-Cre genotypes, immunized and bled as outlined in (A). Data is from 3-6 mice per genotype. Bars represent means ± SEM; statistical analyses used non-parametric Kruskal-Wallis multiple comparison test with Dunn’s post-hoc test in GraphPad Prism 9.5.1; * p<0.05, ** p<0.01, *** p<0.001; AU - arbitrary units.
Cell-intrinsic role of BAP1 in mature activated B cells in humoral immunity and antibody production
Bap1fl/fl mb1-Cre mice lack BAP1 expression throughout the B cell lineage, resulting in impaired B cell development and reduced B cell numbers in lymphoid organs (49), which could in part account for the impaired antibody production in these mice. Our objective therefore was to test the direct role of BAP1 in the regulation of B cell mediated immune response, independently of its functions in B cell development. For this purpose, we generated the Bap1fl/fl Cγ1-cre mice, with Cre expression driven from the IgG1 heavy chain locus and Cre activity restricted to the activated, germinal center (GC), and downstream B cell populations (55). In contrast to the Bap1fl/fl mb1-Cre mice (49), naïve Bap1fl/fl Cγ1-cre mice had normal numbers of splenic pre-GC B cells, including the transitional, follicular, and marginal zone subsets (Supplementary Figure S2). At the same time, the effective Cre-mediated Bap1fl to Bap1Δ allele conversion was demonstrated by PCR-genotyping of the genomic DNA from ex vivo stimulated Bap1fl/fl Cγ1-cre and control Bap1+/+ Cγ1-cre B cells (Supplementary Figures S3A, B). Furthermore, RNA-seq analyses of splenic Bap1fl/fl Cγ1-cre GC B cells demonstrated a strong reduction in the transcript reads mapping to the Bap1 floxed exons 6-12, as compared to the GC B cells from mice of control Bap1+/+ Cγ1-cre genotype (Supplementary Figure S3C, D).
Cohorts of naïve Bap1fl/fl Cγ1-cre mice were analyzed for total serum antibody levels and demonstrated a significant reduction in IgG1 but not IgM titers relative to the Bap1+/+ Cγ1-cre control group (Figure 2A). Further cohorts of Bap1fl/fl Cγ1-cre and control Bap1+/+ Cγ1-cre mice were immunized, either subcutaneously with PE/CFA or intravenously with sheep red blood cells (SRBCs) and analyzed for antigen specific antibody titers over a time-course post-prime and post-boost immunization. A strong reduction in the antigen-specific antibody levels in Bap1fl/fl Cγ1-cre mice relative to the control Bap1+/+ Cγ1-cre group was observed across both immunization models and most time-points (Figures 2B–E). Overall, these findings demonstrate the direct and cell intrinsic role of BAP1 in the induction of B cell mediated immune response, independent of its previously reported functions in B cell development (49).
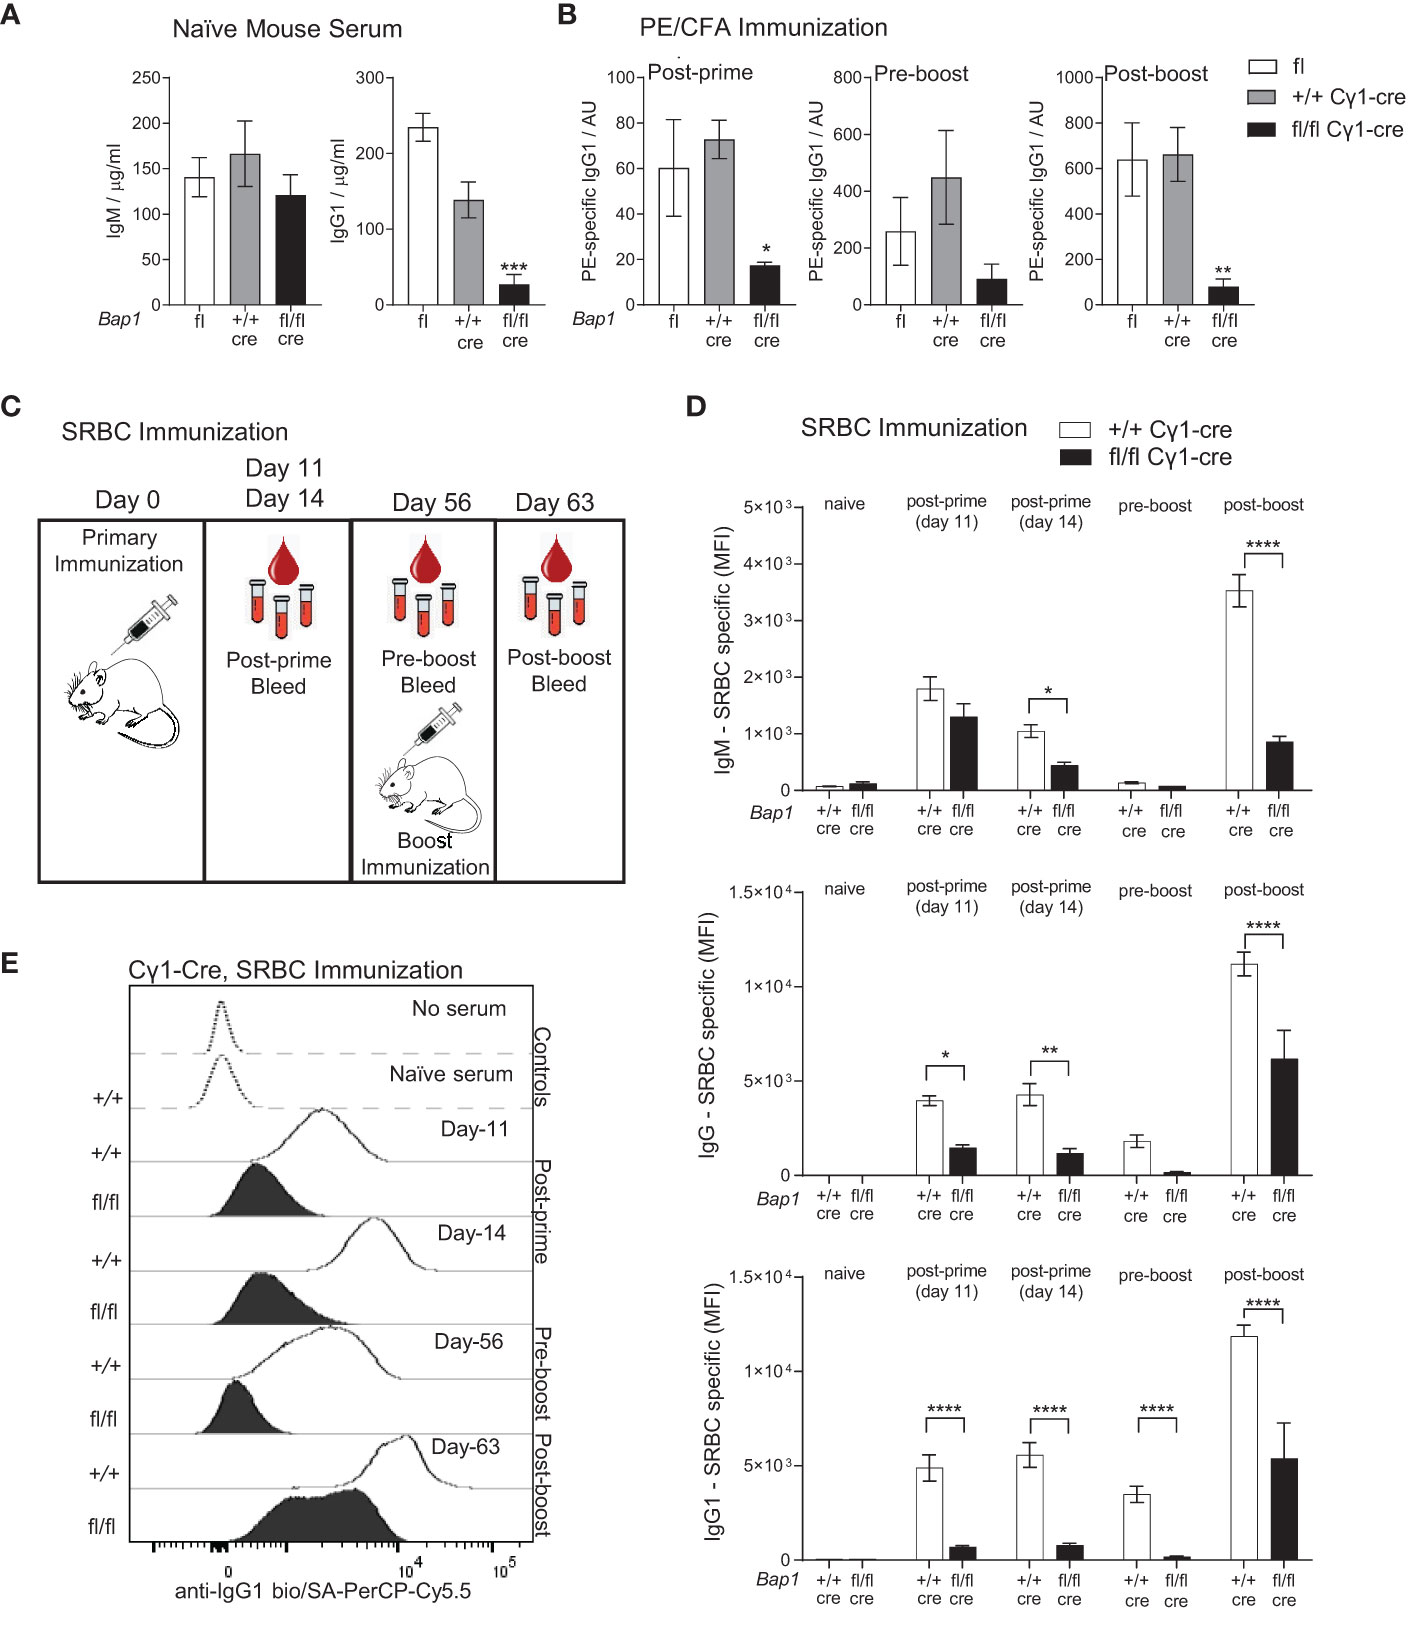
Figure 2 Reduced antibody levels and impaired antibody mediated immune response to immunization in Bap1fl/fl Cγ1-Cre mice. (A) Levels of total IgM and IgG1 antibody isotypes in the serum of naïve mice of Bap1fl/fl Cγ1-Cre and control Bap1fl and Bap1+/+ Cγ1-Cre genotypes, assessed by ELISA. Data are from 9-11 mice per genotype, consolidated from two independent experiments. (B) Antigen specific antibody titers in the mice of Bap1fl/fl Cγ1-Cre and control Bap1fl and Bap1+/+ Cγ1-Cre genotypes, immunized with PE in CFA adjuvant, as outlined above; data acquired with ELISA from 3-5 mice per genotype. (C) Experimental plan and timeline for the analyses of Bap1fl/fl Cγ1-Cre and control Bap1+/+ Cγ1-Cre mouse responses to sheep red blood cell (SRBC) immunization. (D) Antigen specific antibody titers in the serum of mice of Bap1fl/fl Cγ1-Cre and control Bap1+/+ Cγ1-Cre genotypes following SRBC immunization. Data are from 6-8 mice per genotype and reproduced in two independent experiments. Bars represent means ± SEM; statistical analyses used ANOVA with Sidak’s post-hoc test comparing Bap1fl/fl Cγ1-Cre and Bap1+/+ Cγ1-Cre groups; * p<0.05, ** p<0.01, *** p<0.001, **** p<0.0001, or not significant if not indicated; AU – arbitrary units; MFI – mean fluorescence intensity. (E) Representative flow cytometry analyses of mouse serum for SRBC-binding antibody levels, involving the incubation of SRBCs with the serum followed by the staining of SRBCs for antibody binding, as previously described (62).
Germinal center dysfunction and plasma cell depletion with the loss of BAP1
To understand the impact of BAP1-loss on the cellular dynamics of humoral immune response, mice of Bap1fl/fl Cγ1-Cre and control Bap1+/+ Cγ1-Cre genotypes, both naïve and challenged with SRBC-immunization (as shown in Figure 2C), were analyzed for the numbers of germinal center (GC) B cells, memory B cells, and plasma cells using flow cytometry (Figure 3). While there was no significant change in the absolute numbers of GC B cells in Bap1fl/fl Cγ1-Cre relative to control mice at day 11 following the SRBC-immunization (Figure 3A), we observed a significant reduction in the ratio of dark zone (DZ) to light zone (LZ) GC B cells (Figure 3B), primarily due to an expansion in the number of LZ B cells (data not shown). Importantly, Bap1fl/fl Cγ1-Cre mice showed a reduction in the numbers of class switched IgG1+ GC B cells (Figure 3C), with a significant depletion of IgG1+ cells within both the DZ and LZ subpopulations (data not shown), as well as a reduction in IgG1+ memory B cells (Figure 3D). Absolute numbers of plasma cells were also significantly reduced in both the spleen and bone marrow of Bap1fl/fl Cγ1-Cre mice (Figure 3F), with a particularly strong depletion of the IgG1+ class-switched plasma cells (Figure 3G). Further analysis of the plasma cell population demonstrated a more significant depletion of plasmablasts and early plasma cells as compared to late plasma cells in the Bap1fl/fl Cγ1-Cre mice (Supplementary Figures S4A, B), and a reduction in the proportion of plasma cells positive for the Ki-67 marker of cell proliferation at least in the bone marrow (Supplementary Figure S4C). Overall, the significant depletion of plasma cells likely contributes to the failure to produce and sustain normal antibody titers in the Bap1fl/fl Cγ1-Cre mice.
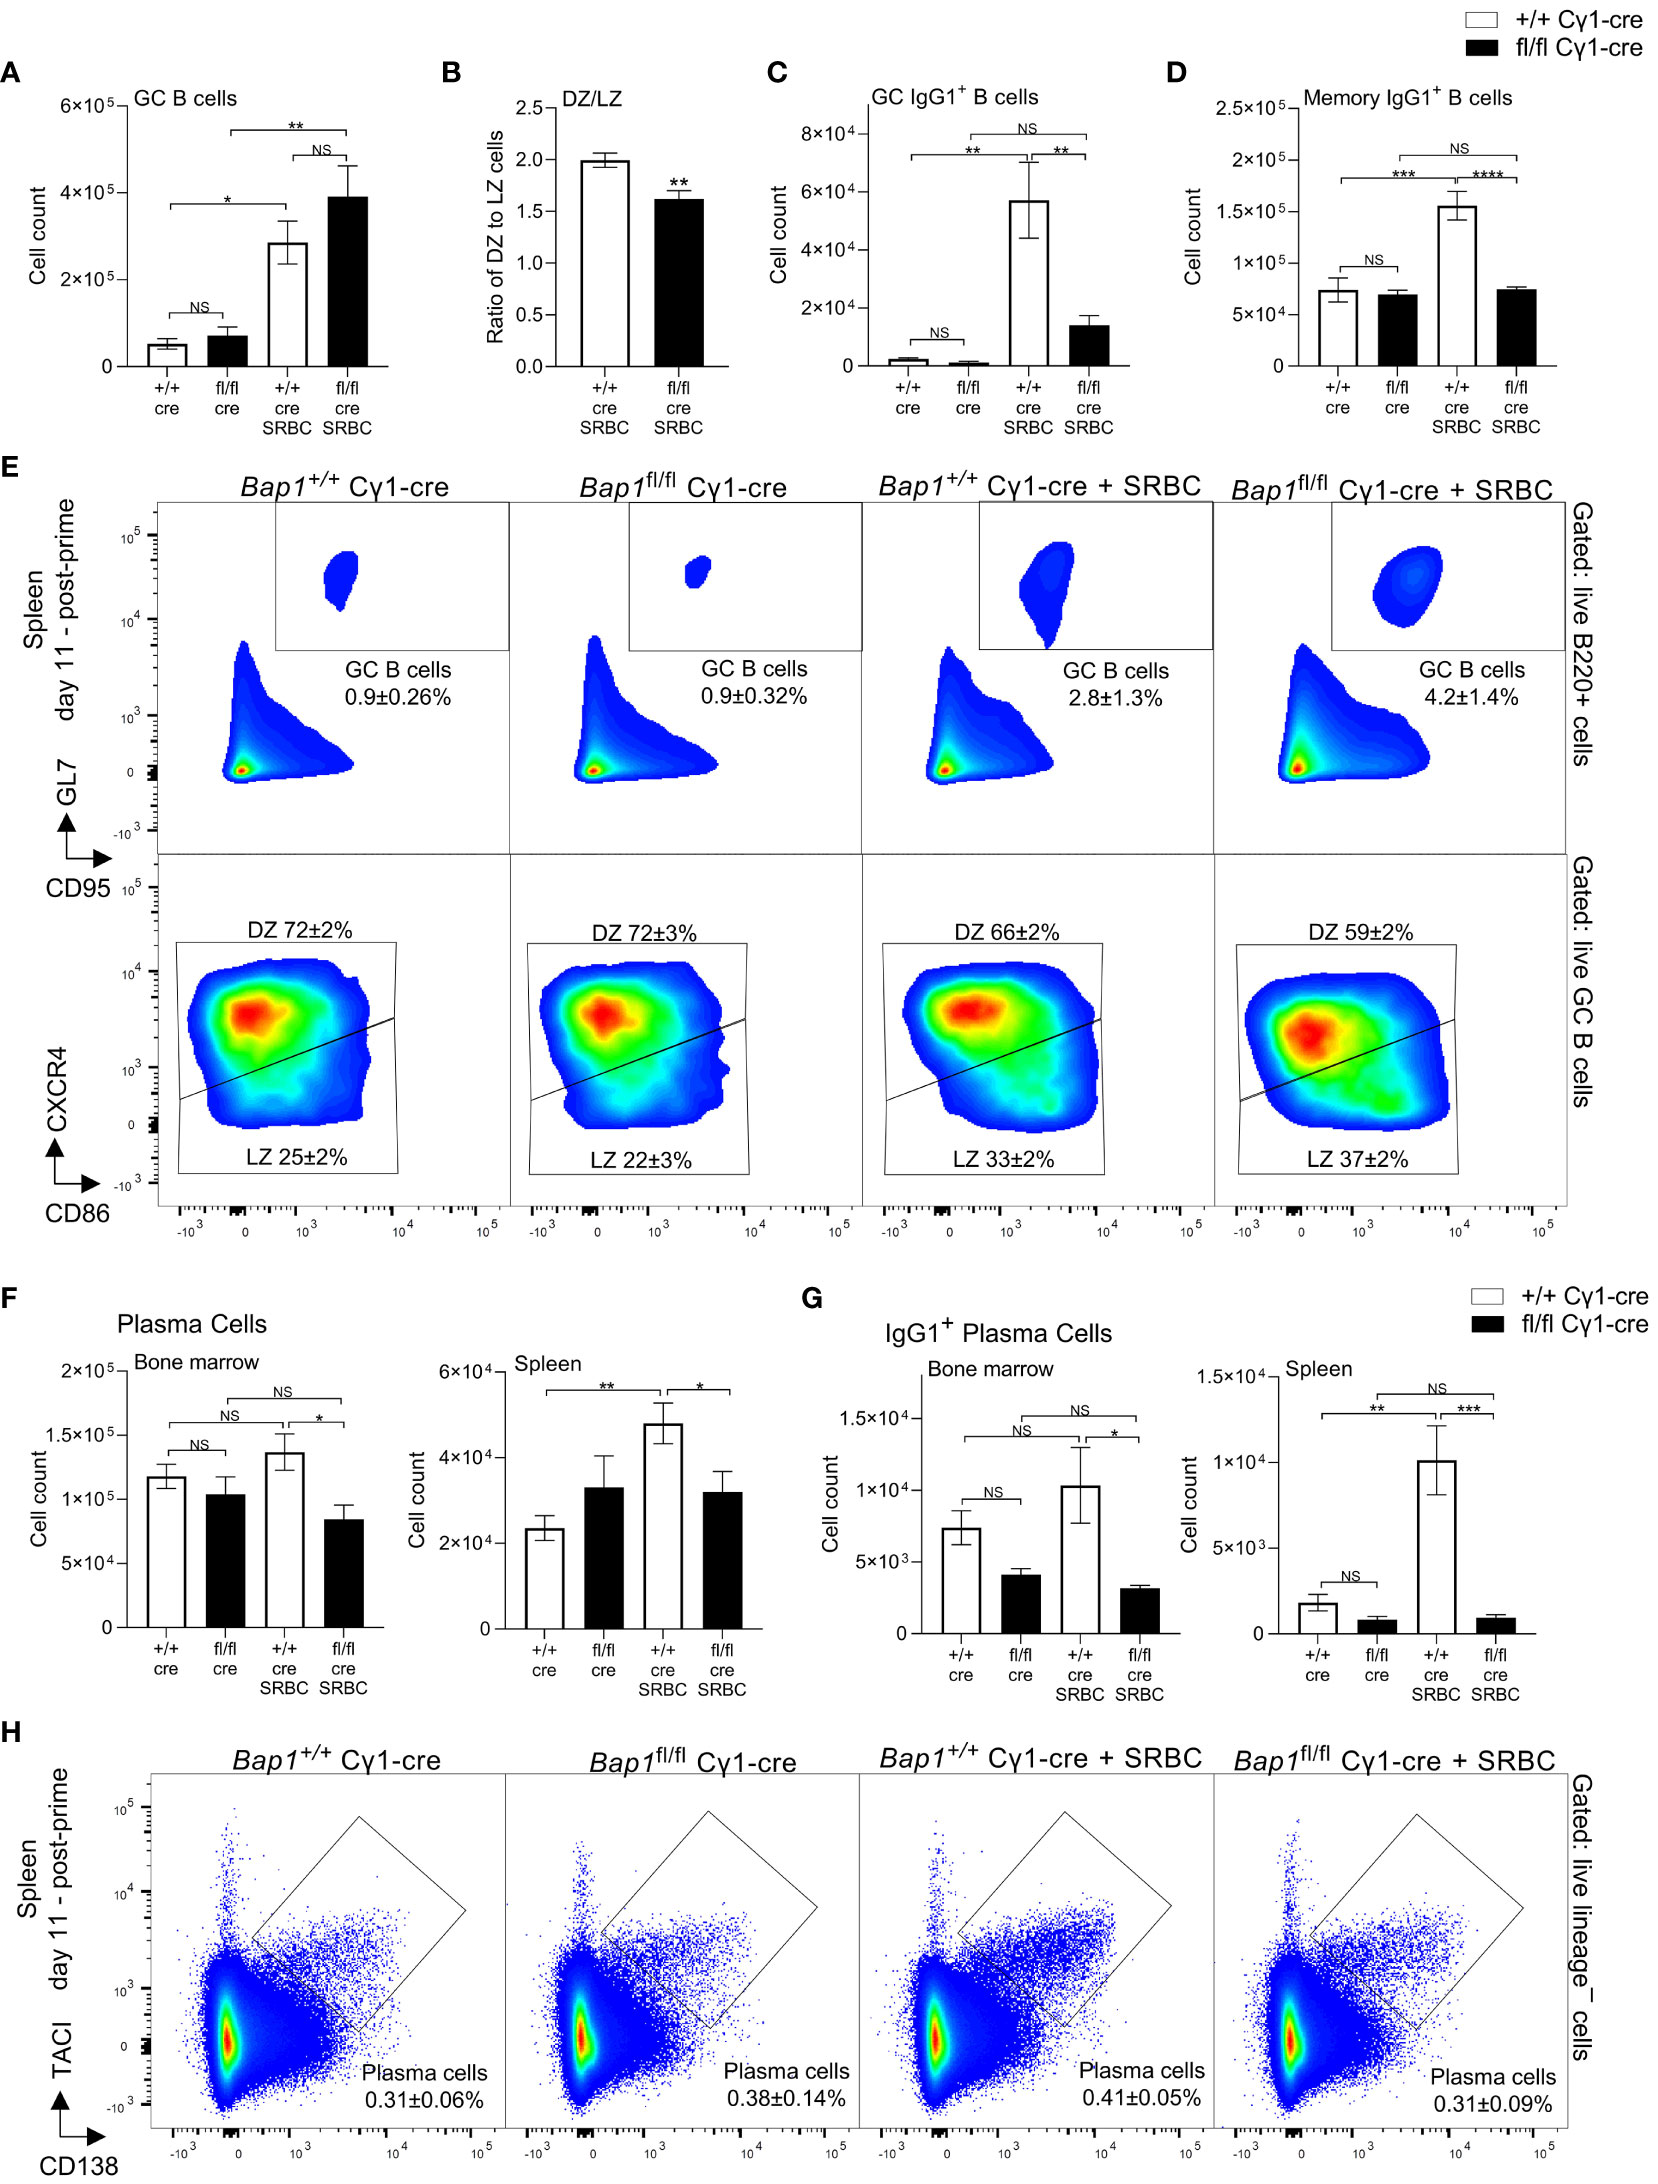
Figure 3 Analyses of germinal center (GC) B cells, memory B cells, and plasma cells in Bap1fl/fl Cγ1-Cre mice. Mice of Bap1fl/fl Cγ1-Cre and control Bap1+/+ Cγ1-Cre genotypes, both naïve and at day 11 post-primary SRBC-immunization, were analyzed by flow cytometry. (A) Absolute numbers of GC B cells per mouse spleen, (B) ratio of dark zone (DZ) to light zone (LZ) GC B cells, (C) absolute numbers of IgG1+ GC B cells per mouse spleen, and (D) absolute numbers of IgG1+ memory B cells per mouse spleen, comparing between the Bap1 genotypes and immunization conditions. (E) Representative flow cytometry plots analyzing splenic GC B cells; average percentage of cells in each gate relative to the parent gate for all the mice in each group is indicated as mean ± SD. (F, G) Absolute numbers of total plasma cells and IgG1+ plasma cells in the bone marrow and spleen, comparing between the Bap1 genotypes and immunization conditions. (H) Representative flow cytometry analyses of plasma cells in the spleen of Bap1fl/fl Cγ1-Cre and control Bap1+/+ Cγ1-Cre mice, both naïve and at day 11 post-primary SRBC-immunization; average percentage of cells in each gate relative to the parent gate for all the mice in each group is indicated as mean ± SD. Bars represent means ± SEM; statistical analyses used ANOVA with Sidak’s post-hoc test to compare between the Bap1fl/fl Cγ1-Cre and Bap1+/+ Cγ1-Cre genotypes and immunization conditions; NS stands for not-significant; * p<0.05, ** p<0.01, *** p<0.001, **** p<0.0001. GC B cells were gated as live B220+GL7+CD95+ cells and divided into CXCR4+CD86– dark zone (DZ) and CXCR4–CD86+ light zone (LZ) cell. Plasma cells were gated as live CD138 +TACI + cells, negative for the lineage markers CD11b, TER119, CD4, CD8, and NK1.1.
The mice were further analyzed for GC B cells, memory B cells, and plasma cells at day 7 after the boost SRBC immunization (Supplementary Figure S5). Surprisingly, an increase in GC B cells was observed in Bap1fl/fl Cγ1-Cre relative to control mice after the booster immunization (Supplementary Figure S5A), and this may reflect the modulatory effects of pre-existing high antibody titers on B cell recruitment into the GC in the control group (82). Furthermore, numbers of IgG1+ class-switched GC and memory B cells in the Bap1fl/fl Cγ1-Cre mice were restored to normal after the booster immunization (Supplementary Figures S5C, D), consistent with a considerable rise in their antibody titers at this time point (Figures 2D, E). However, the reduced ratio of DZ to LZ GC B cells and the significant depletion of class switched IgG1+ plasma cells persisted even after the booster immunization in Bap1fl/fl Cγ1-Cre mice (Supplementary Figures S5B, G). The persisting plasma cell phenotype likely contributes to the ongoing reduction in the antibody titers in Bap1fl/fl Cγ1-Cre mice.
Loss of BAP1 in primary B cells does not impair antibody class switching
While the more significant impact of BAP1-loss on the numbers of IgG1+ rather than total GC B cells and plasma cells in the Bap1fl/fl Cγ1-Cre model may reflect the higher expression of Cre in the IgG1+ cells (55), it may also suggest a role for BAP1 in immunoglobulin class switching. We therefore proceeded to directly test the effects of Bap1-loss on antibody class switching in vitro. Induced GC B cells (iGBs) of Bap1fl/fl Cγ1-Cre and control Bap1+/+ Cγ1-Cre genotypes were generated on the 40LB feeder cells that provide CD40L and BAFF, as described previously (58, 60). iGBs were analyzed at day 4 for class switching to IgG1 and demonstrated no significant differences between the Bap1fl/fl Cγ1-Cre and control Bap1+/+ Cγ1-Cre cultures (Figures 4A, B). We further analyzed B cell proliferation in the iGBs cultures, using either the CellTrace Violet (CTV) dilution method with flow cytometry (Figures 4C, D, day 4) or manual cell counting (Figure 4E, days 0-6). This demonstrated a significant impairment in the proliferation for Bap1fl/fl Cγ1-Cre relative to control Bap1+/+ Cγ1-Cre B cells under these culture conditions (Figures 4C–E). Further analyses of the antibody class switching rates per cell division in this model confirmed that the loss of Bap1 does not directly interfere with class switching, and any reduction in class switched Bap1fl/fl Cγ1-Cre B cells can be attributed to impaired B cell proliferation (Figures 4C, F).
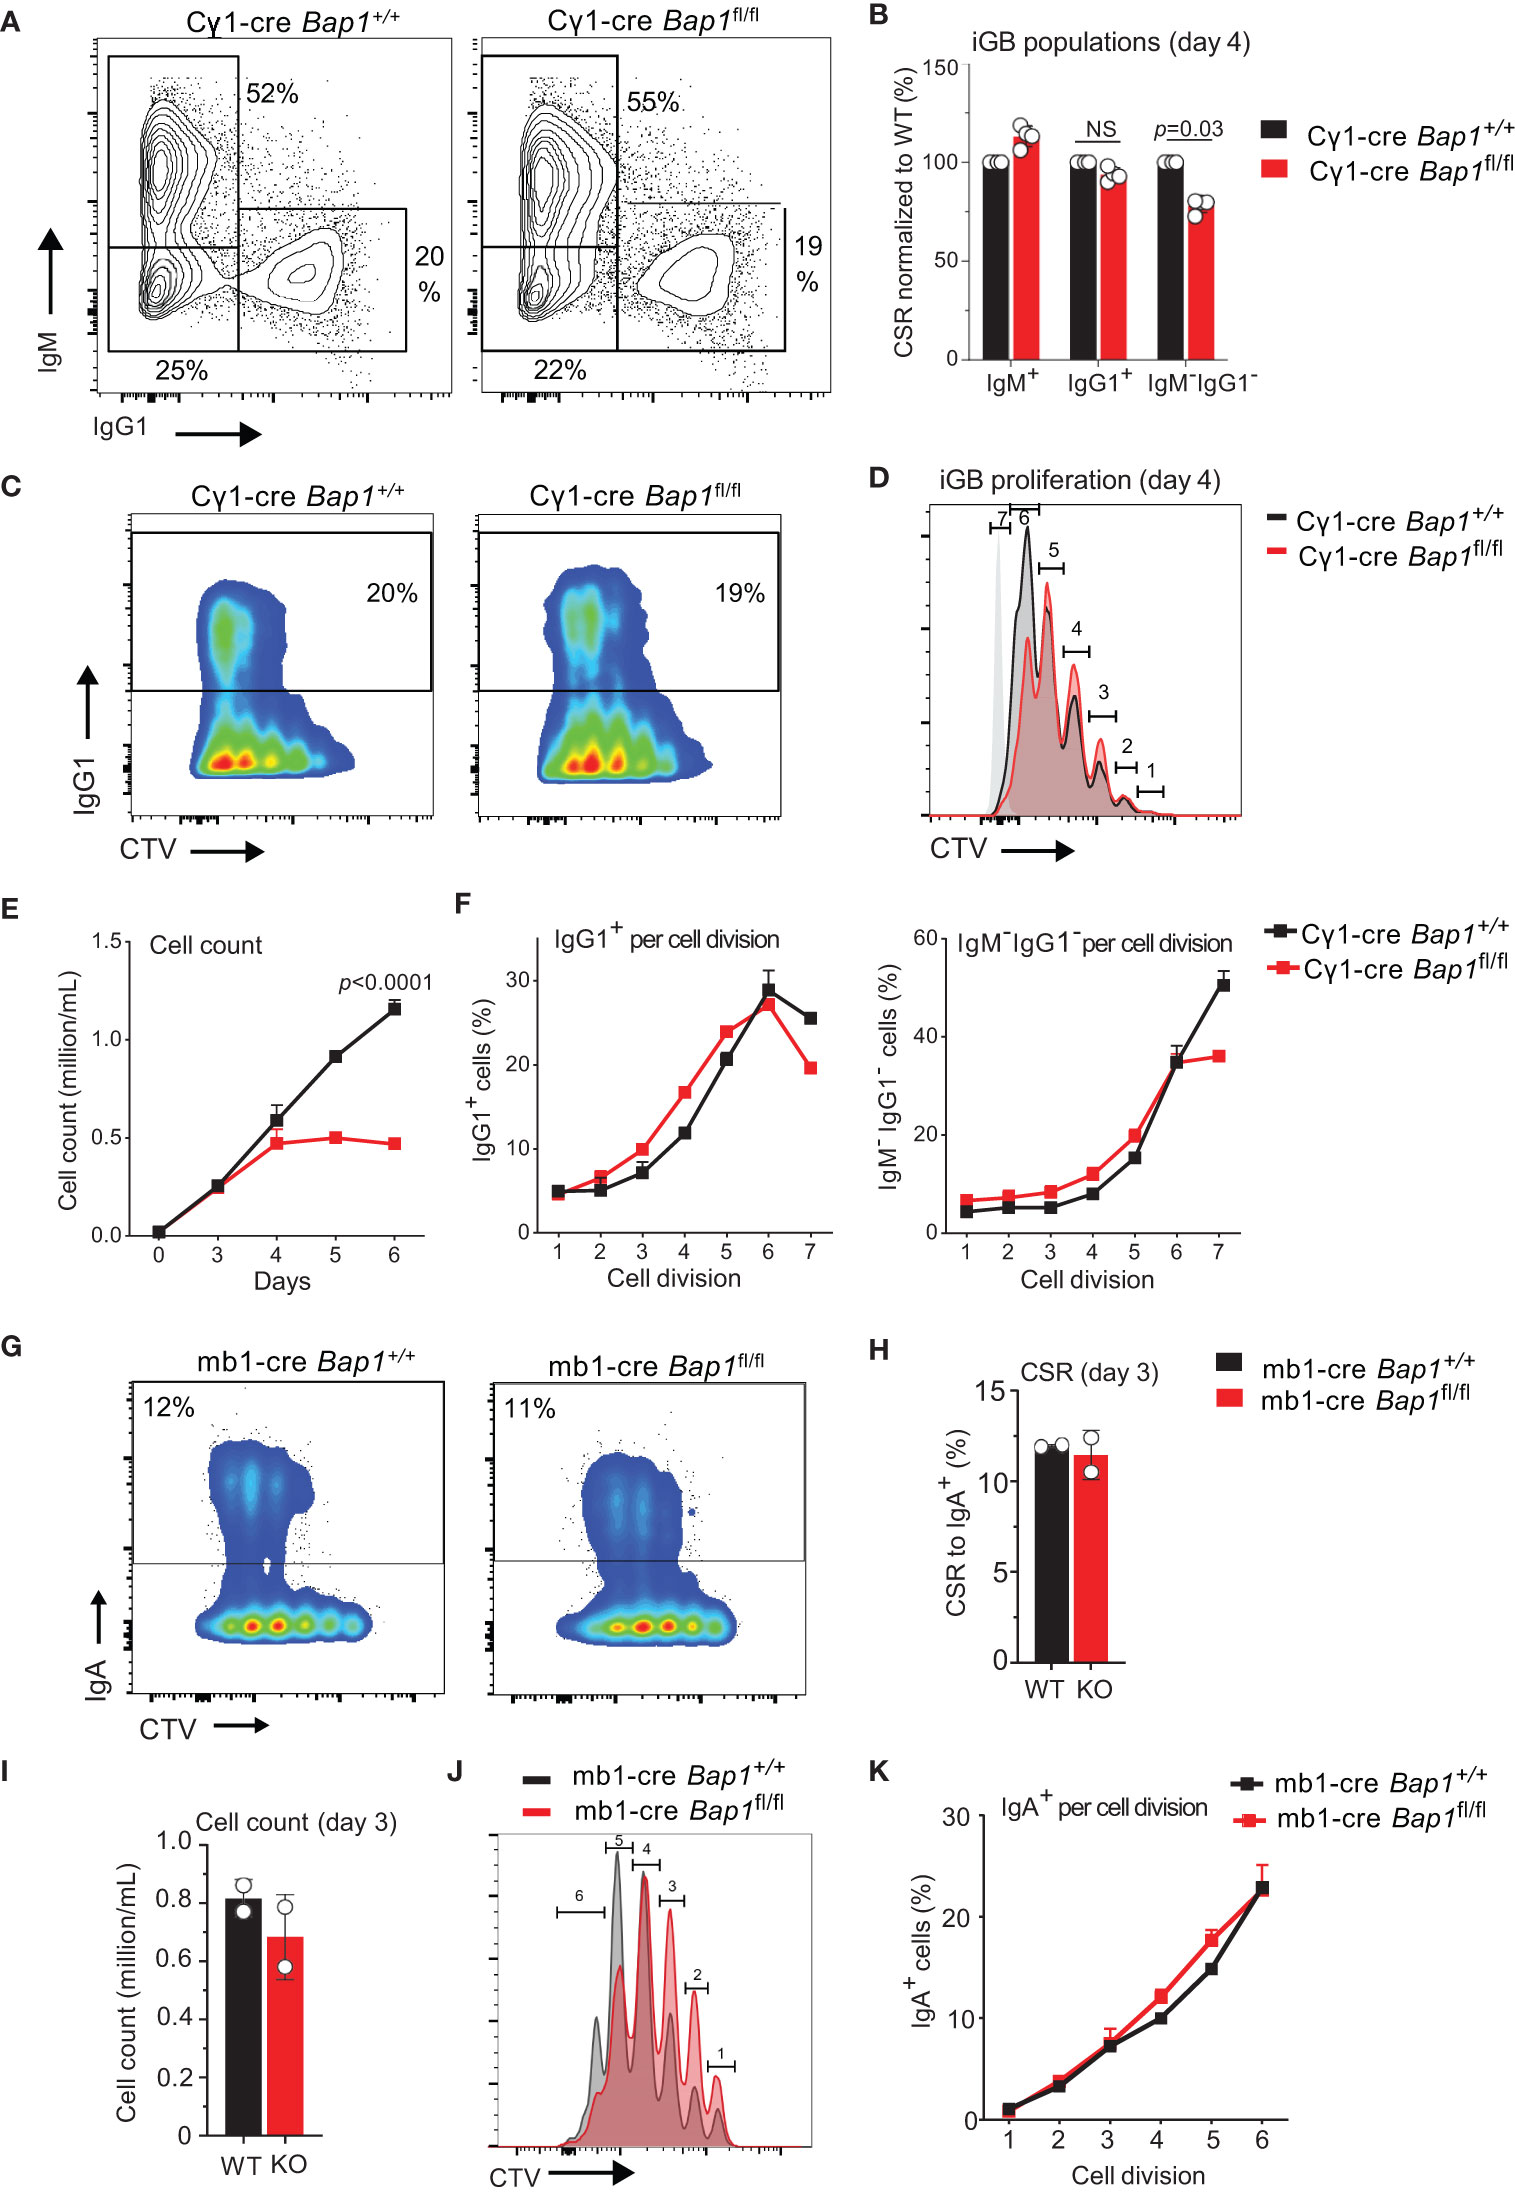
Figure 4 Loss of BAP1 does not impair immunoglobulin class switching in primary B cells. (A–F) Induced GC B cells (iGB) of Bap1fl/fl Cγ1-Cre and control Bap1+/+ Cγ1-Cre genotypes were generated on 40LB feeders, as described previously (58, 60), and analyzed at day 4 of culture for (A–C) immunoglobulin class switching to IgG1, and (C, D) cell proliferation using the CellTrace Violet (CTV) dilution method. (E) Growth curves of iGBs of Bap1fl/fl Cγ1-Cre and control Bap1+/+ Cγ1-Cre genotypes over a 6-day time course, evaluated with cell counting and demonstrating the impaired proliferation of Bap1-deficient B cells. (F) Antibody class switching per cell division, comparing Bap1fl/fl Cγ1-Cre and control Bap1+/+ Cγ1-Cre iGBs at day 4 and showing no differences between the genotypes. Bars represent means ± SEM, with two mice per genotype. (G–K) Primary splenic B cells of Bap1fl/fl mb1-Cre and control Bap1+/+ mb1-Cre genotypes were stimulated in culture to induce class switching to IgA. (G) Analyses of the cultures at day 3 of stimulation for class-switching to IgA and for cell proliferation using the CTV-dilution method demonstrated no differences in class switching between the Bap1-genotypes. (H) Quantification of the B cell cultures for class-switching to IgA demonstrated no differences between the Bap1-genotypes. (I, J) Analyses of B cell proliferation using (I) cell counting or (J) CTV-dilution method demonstrated a trend toward decreased proliferation of Bap1fl/fl mb1-Cre relative to the control Bap1+/+ mb1-Cre B cells. (K) Antibody class switching per cell division comparing Bap1fl/fl mb1-Cre and control Bap1+/+ mb1-Cre B cells showed no differences between the genotypes. Bars represent means ± SEM with two mice per genotype. Statistical analyses used (B, H, I) unpaired two-tailed Student’s t-test or (E, K) two-way ANOVA with Sidak’s multiple comparison test; p-values are indicated in the figure or not-significant (NS) if not indicated.
Primary B cells from Bap1fl/fl Cγ1-Cre and control Bap1+/+ Cγ1-Cre mice were also stimulated in culture to class-switch to IgA with IL-21, anti-CD40, anti-IgM, TGF-β, and retinoic acid, as reported previously (59). Again, Bap1fl/fl Cγ1-Cre B cells demonstrated normal levels of class switching over 4 days in culture (Supplementary Figures S6A, B), though Cre-mediated Bap1fl to Bap1Δ allele conversion was observed as early as days 3, albeit without full loss of the Bap1fl allele (Supplementary Figures S6C, D). It is notable that no loss of cell proliferation was observed in these cultures, and this may reflect biological differences in the responses of Bap1-deficient B cells to different stimulation conditions or the lower efficiency of Cγ1-Cre in the cells undergoing class switching to IgA relative to IgG1, as shown by the persistent detection of the Bap1fl allele in these cells (Supplementary Figure S6D).
We further evaluated class switching using splenic B cells from Bap1fl/fl mb1-Cre and control Bap1+/+ mb1-Cre mice, as in this model the Cre-mediated Bap1-allele deletion takes place from the early stages in B cell lineage development, and the full loss of BAP1 protein in Bap1fl/fl mb1-Cre splenic B cells has been validated through Western blotting in our previously published studies (49). Thus, to further assess the role of BAP1 in antibody class switching, Bap1fl/fl mb1-Cre and control Bap1+/+ mb1-Cre B cells were stimulated in culture with IL-21, anti-CD40, anti-IgM, TGF-β, and retinoic acid to class-switch to IgA and analyzed at day 3 (Figures 4G–K). While Bap1fl/fl mb1-Cre B cells showed a trend toward impaired cell proliferation relative to the control B cells (Figures 4G, I, J), there were no differences in class switching per cell division between the Bap1-genotypes (Figure 4K), consistent with our findings with the Bap1fl/fl Cγ1-Cre B cells (Figure 4F, Supplementary Figure S6B). Overall, we conclude that BAP1 is not directly required for the normal progression of antibody class switching.
Given the impaired proliferation of Bap1-deficient B cells under some of the stimulation conditions presented above, we further analyzed the effects of BAP1 on B cell viability. No significant differences in cell viability were observed between Bap1fl/fl Cγ1-Cre and control Bap1+/+ Cγ1-Cre germinal center B cells, memory B cells, or plasma cells, freshly isolated from naive mice or from mice at day 11 post-SRBC immunization (Supplementary Figures S7A–D). Further analysis of the plasma cell populations as plasmablasts, early plasma cells, and mature plasma cells also demonstrated no differences in viability based on the Bap1-genotype of the cells (data not shown). However, such analyses may not detect subtle changes in cell viability due to the rapid clearance of dead cells in healthy tissues, and we therefore further analyzed the viability of primary B cells of Bap1fl/fl Cγ1-Cre and control Bap1+/+ Cγ1-Cre genotypes in culture, stimulated over 5 days with either anti-CD40 and IL-4, or with LPS and IL-4. This demonstrated a mild but statistically significant reduction in the viability of Bap1fl/fl Cγ1-Cre relative to control Bap1+/+ Cγ1-Cre B cells under both stimulation conditions (Supplementary Figure S7E). Overall, we conclude that the loss of BAP1 can impair the viability of activated B cells.
Impaired proliferation in Bap1 CRISPR/Cas9 gene targeted CH12F3 B cells
To further explore the roles and mechanisms of BAP1 activity in B cells, we targeted Bap1 gene using CRISPR/Cas9 in the CH12F3 B cell lymphoma line (56), which is a commonly used model for the analyses of B cell activation, class switching, and associated cellular processes. gRNAs were designed to target Bap1 exons 4 and 5 that encode the N-terminal catalytic domain of the protein (Figure S8A), and single-cell clones screened by PCR for deletions within the targeted regions of the Bap1 locus. Further analyses of five Bap1Δ/Δ single-cell clones by Western blotting confirmed the full loss of BAP1 protein expression (Supplementary Figure S8B).
Based on the impaired proliferation of Bap1fl/fl Cγ1-Cre primary B cells in the iGB cultures (Figure 4) and on our previous report of impaired proliferation in Bap1fl/fl mb1-Cre pre-B cells (49), we analyzed the Bap1Δ/Δ CH12F3 cell clones for defects in proliferation, using the AlamarBlue resazurin/resorufin-based assay in bulk cell cultures, and the flow cytometry based CFSE dilution method. The assays demonstrated a significant reduction in cell proliferation for the Bap1Δ/Δ CH12F3 cell clones relative to control wild type CH12F3 cells (Supplementary Figures S8C–E), as well as the reduced viability of Bap1Δ/Δ CH12F3 cell at least under unstimulated culture conditions (Supplementary Figure S8F). This demonstrates the conservation of Bap1-deficiency phenotypes between CH12F3 cells and primary B cells and establishes the Bap1Δ/Δ CH12F3 cells as a model for further analyses of BAP1 functions in B cell biology.
BAP1 genome-wide binding in B lymphocytes
To identify the genomic regions directly regulated by BAP1 in mature B cells, we conducted ChIP-seq to map BAP1 genome-wide DNA-binding sites using an anti-BAP1 antibody and wild type CH12F3 cells, with and without stimulation with TGF-β, IL-4, and anti-CD40 over 72 hours. While there are limitations to using CH12F3 cells as a model of primary GC B cells, BAP1 is a challenging target, with most previously published ChIP-seq datasets using cells that express an epitope-tagged BAP1 protein (47, 83, 84). We have therefore also repeated the ChIP-seq analysis using CH12F3 cells stably expressing 3xFLAG-tagged BAP1 with an antibody against the FLAG epitope, as previously described (47, 49). We identified a total of 1,499 BAP1 binding sites (or peaks) across the genome (Figure 5A, Supplementary Figure S9A, Supplementary Table S3A), with the high concordance between the dataset from unstimulated and stimulated CH12F3 cells, indicating that BAP1 recruitment to chromatin is constitutive rather than induced with B cell stimulation. Among the BAP1 binding sites 88% were classified as gene-proximal based on their distance to the nearest gene transcription start site (≤1kb to TSS, Supplementary Table S3A). To gain insights into the biological functions of the BAP1 transcriptional target genes, ontology analyses were performed on the genes in the vicinity of the BAP1 binding sites using the Genomic Regions Enrichment of Annotations Tool (GREAT) (68). This demonstrated a highly significant association of the gene-proximal BAP1 binding sites with the genes involved in proteosome-dependent protein degradation, DNA damage response, and protein trafficking, and the association of the gene-distal BAP1 binding sites with the genes involved in the regulation of transcription and RNA processing (Figure 5B, Supplementary Tables S3B, C). This suggests the role of BAP1 in the regulation of many transcriptional programs essential for normal cell physiology, as well as for the induction of B cell activation and humoral immune response.
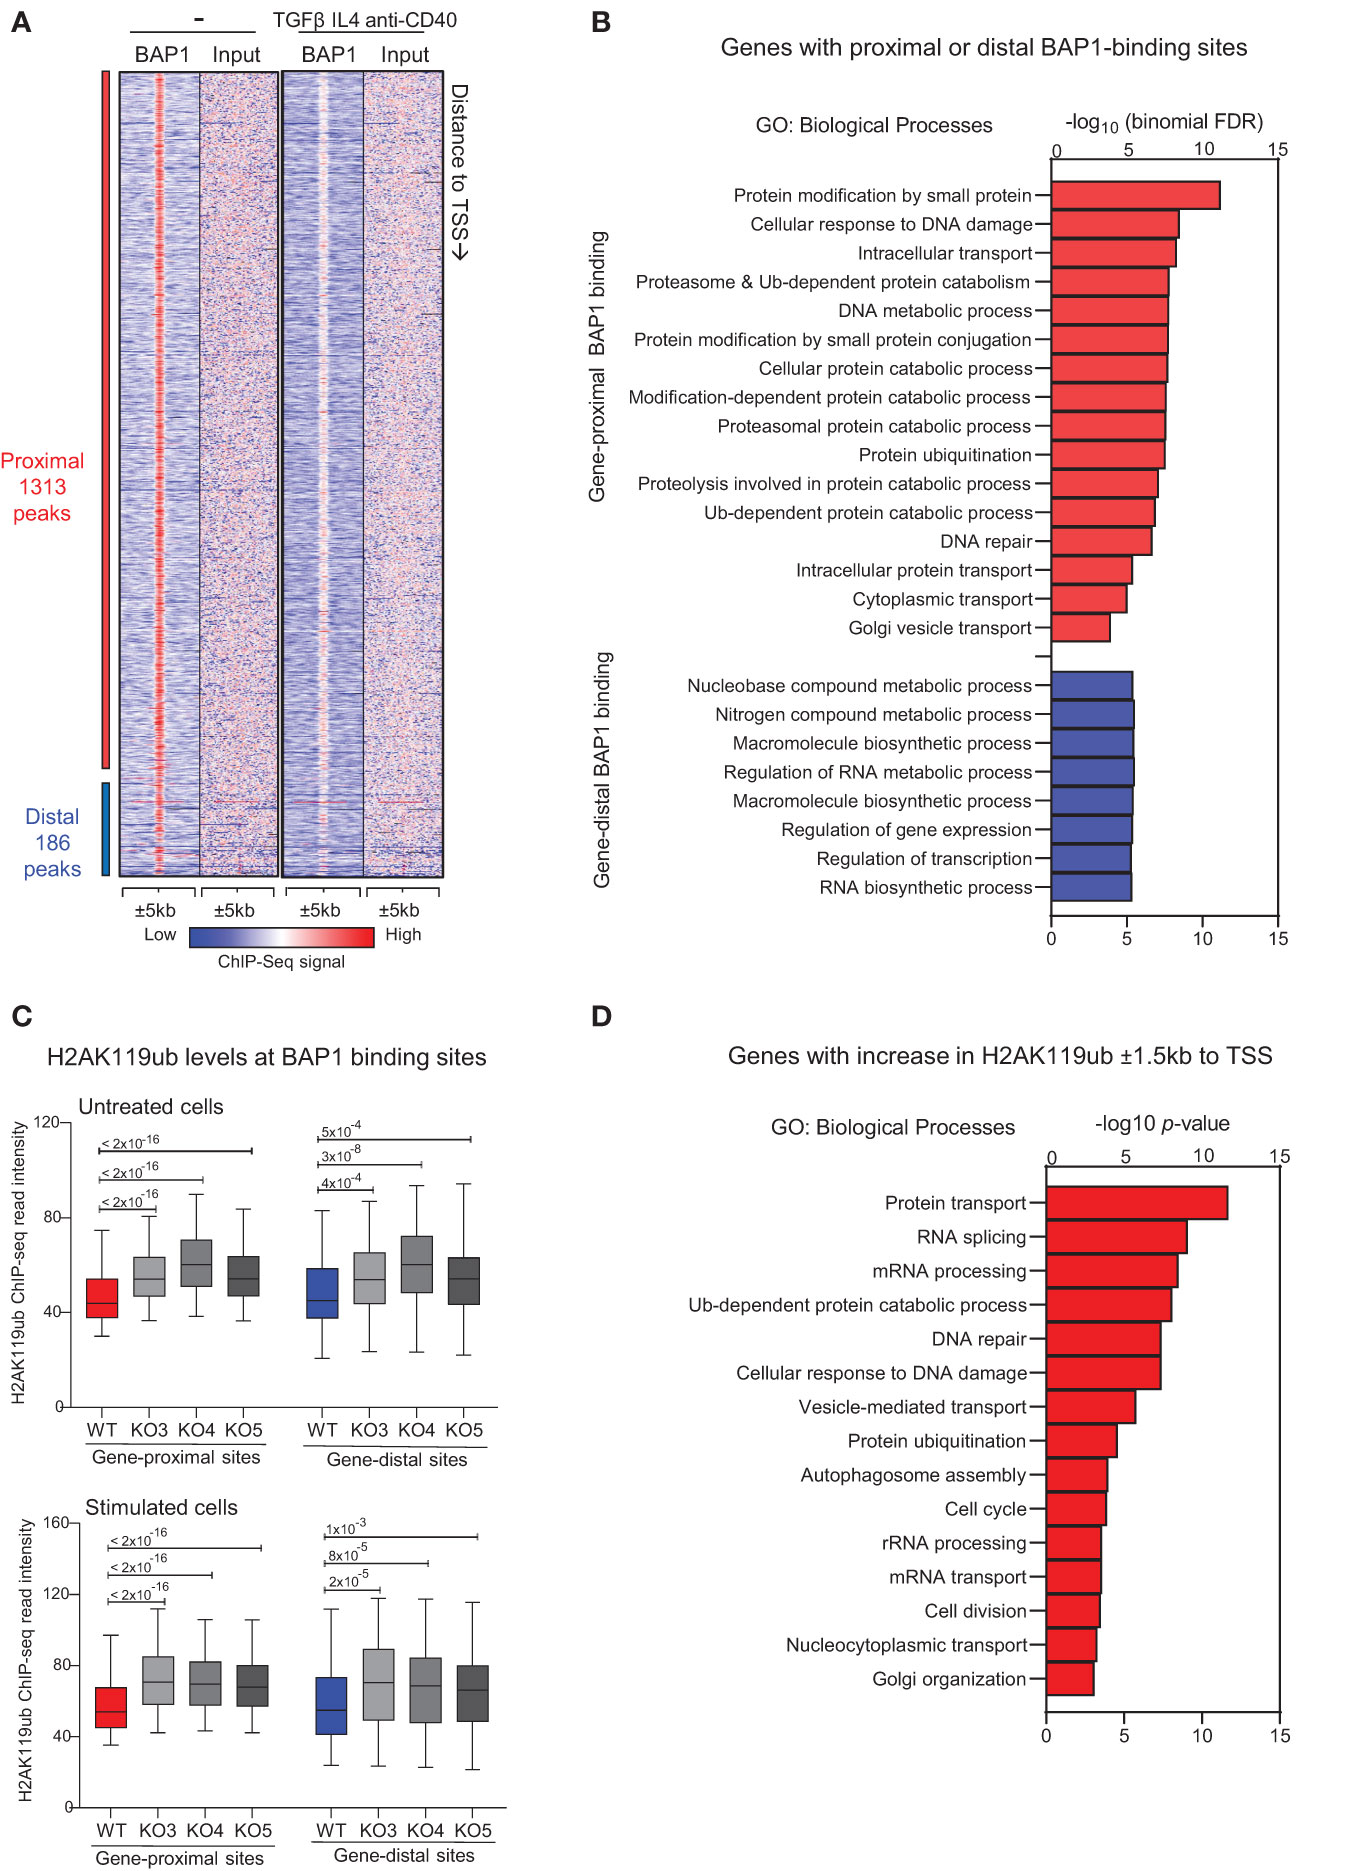
Figure 5 ChIP-seq analyses of BAP1 genome-wide binding and the effects of BAP1-loss on the histone H2AK119ub levels in CH12F3 B cells. (A) Heat-map showing the tag densities of 1,499 BAP1 binding sites identified in the ChIP-Seq experiments from wild type CH12F3 cells, untreated and at 72-hours of stimulation with TGFβ, IL-4, and anti-CD40. The sites are ranked based on their distance to the nearest gene transcription start site (TSS), and the gene-proximal sites are defined based on their location within 1kb to the nearest gene TSS. (B) Gene ontology (GO) analysis performed on the GREAT website, showing the biological process GO-terms enriched for the genes nearest to each BAP1 binding site, plotting the -log10(binomial FDR) for each GO-term. (C) ChIP-Seq analyses of histone H2AK119ub levels at the BAP1 binding sites in CH12F3 cells, including wild type (WT) control cells and three independent clones of CRISPR/Cas9 edited BAP1-knockout cells (KO3-4-5). Box plots show the H2AK119ub read intensities ±5kb to the gene-proximal and gene-distal BAP1 binding sites, comparing WT and KO cells; the p-values are calculated using Mann-Whitney U-test. (D) Gene ontology enrichment analyses on the genes that undergo an increase in the levels of histone H2AK119ub (fold change ≥ 2.0) around their transcription start sites ( ± 1.5kb to TSS) in Bap1Δ/Δ versus control CH12F3 B cells; the -log10(p-values) are listed for selected top GO-terms.
To compare the role of BAP1 as a transcriptional regulator in mature B cells to its role in other cell types, we consolidated our newly acquired BAP1 ChIP-Seq with the previously published BAP1 ChIP-Seq datasets from Ba/F3 pro-B cells (49), ES cells (85), and macrophages (47). This indicated a considerable overlap in BAP1 genomic binding and suggested shared BAP1 functions in the regulation of housekeeping transcriptional programs across many cell types (Supplementary Figures S9A, Supplementary Tables S3D, E). To gain further insights into the cross-talk between BAP1 and other transcriptional regulators, we also consolidated our BAP1 ChIP-Seq data with the public ChIP-Seq datasets for BAP1-associated transcriptional regulators, including HCF1 and OGT in macrophages (47), and ASXL1 in hematopoietic stem and progenitor cells (HSPC) (86). A significant overlap in the genomic localization was observed between BAP1 and BAP1-interacting proteins ASXL1, HCF1, and to a lesser extent OGT (Supplementary Figure S9B, Supplementary Tables S3D, E), indicating that BAP1 may act in cooperation with these transcriptional regulators in B cells, as in other cell types. Furthermore, we consolidated our BAP1 ChIP-seq data with the public ChIP-seq datasets from primary murine B cells for the other major regulators of the histone H2AK119ub epigenetic mark, including polycomb proteins RING1B, CBX7, YY1, EZH2 and deubiquitinase USP16 (18, 27). We observed an overlap in the genomic binding of BAP1 with components of the polycomb repressive complex 1 (PRC1), including its E3 ubiquitin ligase catalytic subunit RING1B (Supplementary Figure S9B, Supplementary Table S3D). This suggests that BAP1 and PRC1 may co-regulate histone H2AK119ub levels and turnover at shared genomic locations. Interestingly, we also observed an overlap in the genomic binding of BAP1 and another well-known H2AK119ub-deubiquitinase USP16 (Supplementary Figure S9B, Supplementary Table S3D), suggesting their cooperative or complementary functions.
Non-redundant role of BAP1 as a deubiquitinase for histone H2AK119ub in B cells
To assess the role of BAP1 as a DUB for histone H2AK119ub in activated B cells, consistent with its reported function in other cell types (28), further ChIP-Seq analyses were performed to quantify the histone mark H2AK119ub. The study compared control wild type (WT) and BAP1-deficient Bap1Δ/Δ CH12F3 B cell lines, analyzing three independent clones of CH12F3 cells (KO3-4-5) and repeating the analyses at steady-state and following cell activation (TGFβ, IL-4, anti-CD40, 72 hours). ChIP-Seq data demonstrated that the loss of BAP1 resulted in a highly significant increase in histone H2AK119ub levels at the BAP1 binding sites and surrounding genomic regions ( ± 5kb) in all the three Bap1Δ/Δ clones and under both untreated and stimulated conditions (Figures 5C). This establishes the non-redundant role of BAP1 as a DUB for histone H2AK119ub in B lymphocytes.
Next, we set out to interrogate the biological functions of the genes regulated via the BAP1 DUB-activity for H2AK119ub. We therefore re-analyzed our ChIP-seq datasets to identify the genes with a >2-fold increase in H2AK119ub within ±1.5kb to their TSS in the Bap1Δ/Δ relative to control CH12F3 B cells (Supplementary Table S4A). GO-term analysis on this gene-set indicated that the genes undergoing an increase in H2AK119ub with the loss of BAP1 encode regulators of protein transport, Ub-dependent protein degradation, DNA damage response and repair, RNA processing, as well as autophagosome assembly and cell cycle progression (Figure 5D, Supplementary Table S4B). This demonstrates a strong concordance in the biological functions of this gene-set with the genes marked by BAP1-binding (Figures 5B, D). Overall, we conclude that BAP1 acts as a DUB for H2AK119ub in B cells to regulate many transcriptional programs essential for normal cell physiology, but also for B cell activation and the induction of humoral immune response.
For further insights into BAP1 functions as a DUB for H2AK119ub in the transcriptional networks of B cell mediated immune response, we performed supplementary analyses to consolidate our ChIP-seq datasets with the published RNA-seq data characterizing the transcriptional response of wild type CH12F3 cells to stimulation (87), and the transcriptional change with the transition from follicular to GC in primary B cells (81). In both cases, we identified a subset of differentially expressed genes that in our datasets have proximal BAP1 binding and sustain an increase in H2AK119ub with the loss of BAP1 (Supplementary Tables S4D-F). Such datasets may represent a starting point for future studies to validate and characterize genes under the direct transcriptional control of BAP1 in activated B cells.
BAP1-regulated transcriptional programs of germinal center B cells
To further analyze the role of BAP1 in the transcriptional regulation of B cell activation, RNA-Seq gene expression analysis was conducted on GC B cells isolated from the spleen of Bap1fl/fl Cγ1-cre and control Bap1+/+ Cγ1-cre mice at day 11 post-SRBC immunization, with the cells gated for FACS-sorting as shown in Supplementary Figure S10. As already discussed, a strong reduction in the expression of the Bap1fl exons was demonstrated in the RNA-seq datasets from Bap1fl/fl Cγ1-cre relative to control GC B cells (Supplementary Figures S3C, D), confirming an effective Cre-mediated Bap1 gene inactivation in the cells captured for the RNA-seq. Importantly, dimension reduction analysis of the gene expression profiles revealed a clear segregation of the Bap1fl/fl Cγ1-cre and control Bap1+/+ Cγ1-cre GC datasets (Figure 6A, Supplementary Table S5, PC1 – 31% and PC2 –14% variance), which indicates a significant transcriptional change in GC B cells with the loss of BAP1.
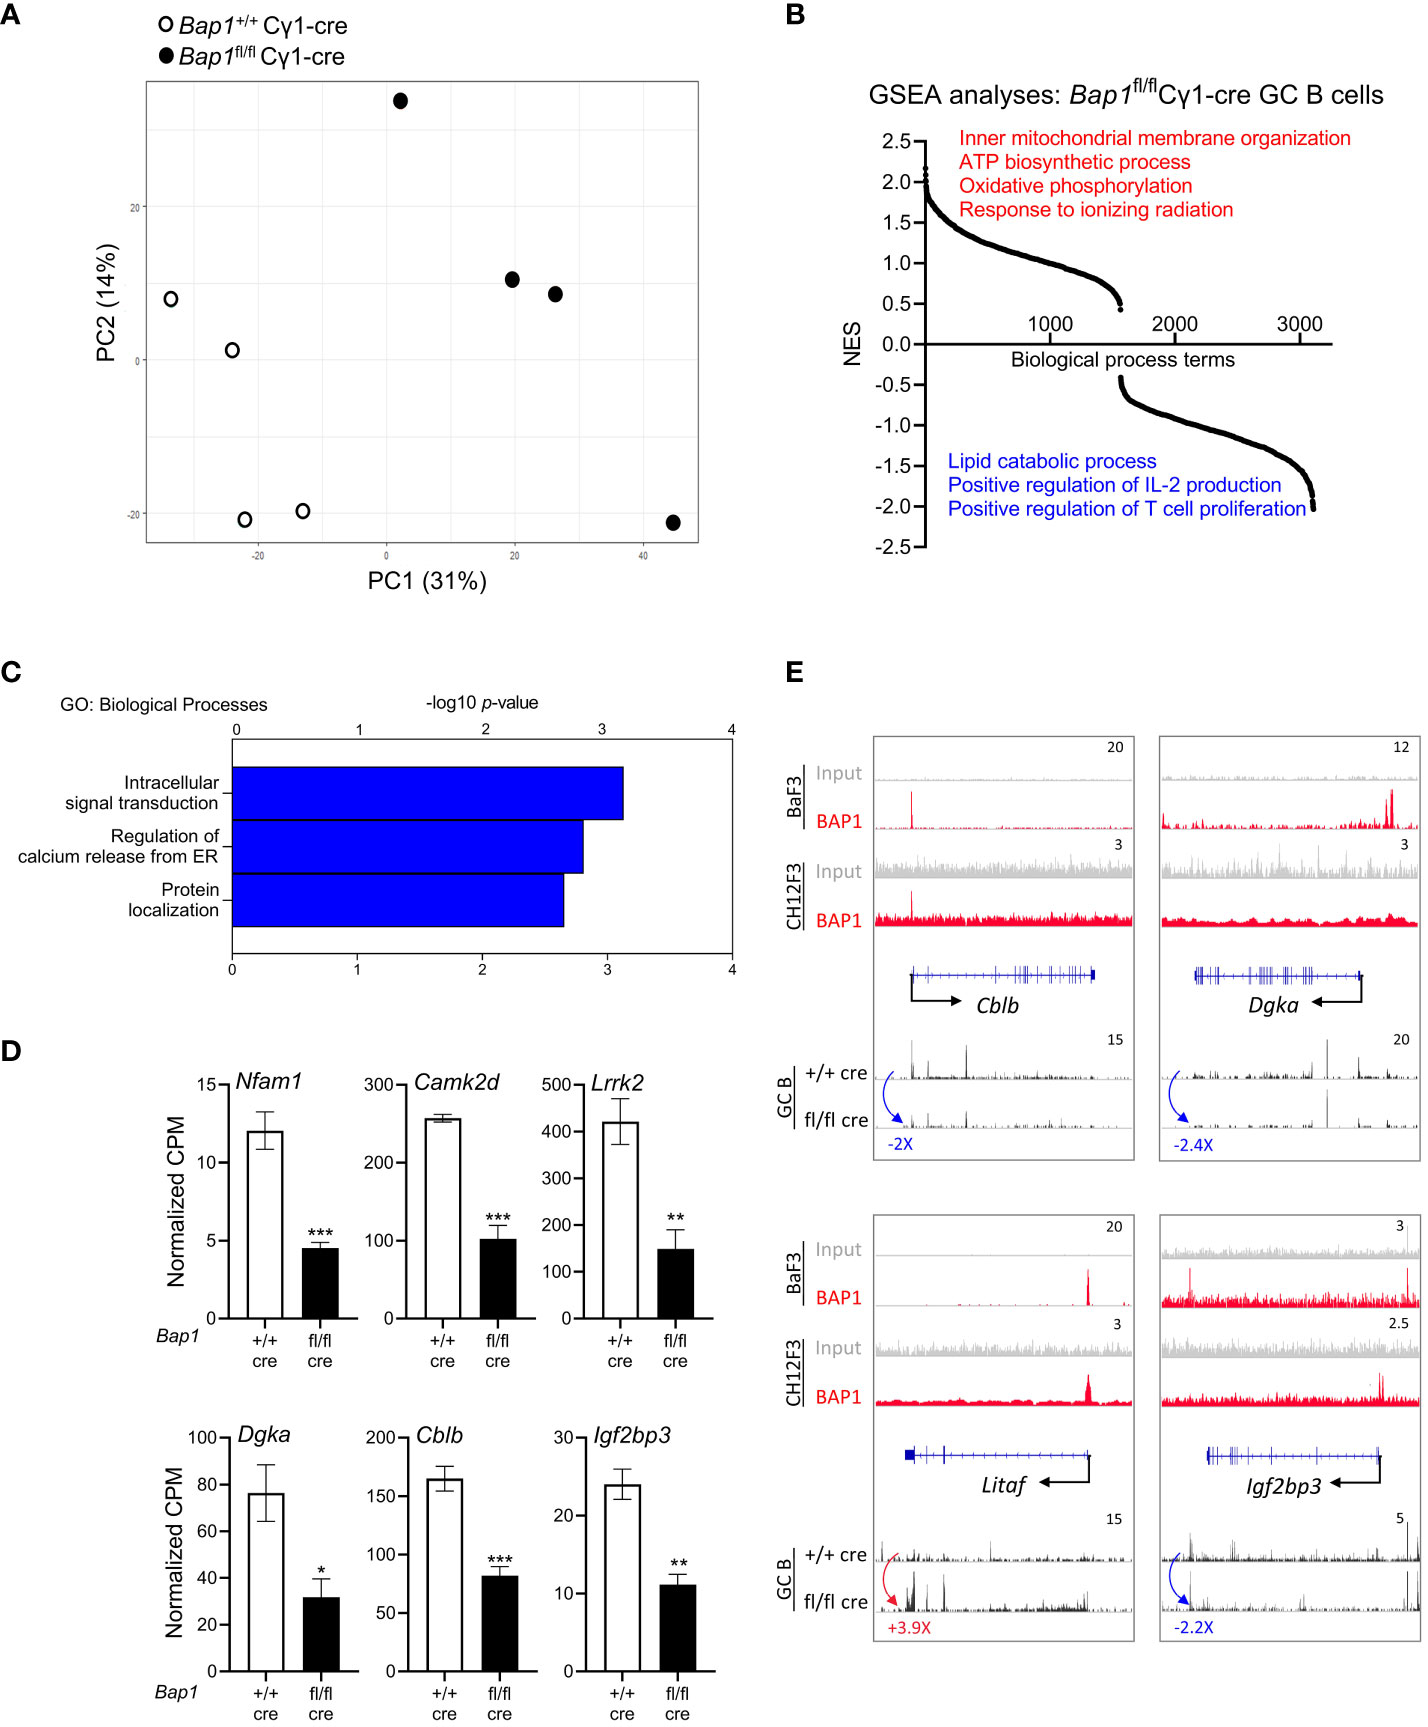
Figure 6 RNA-Seq analysis of the transcriptome of Bap1fl/fl Cγ1-Cre and control Bap1+/+ Cγ1-Cre GC B cells. (A) Principal component analysis plot demonstrating the gene expression profiles of the RNA-Seq samples: differences between the Bap1 genotypes are described by principal component 1 (PC1, 31% variability) and PC2 (14%). (B) Gene set enrichment analysis (GSEA) showing the normalized enrichment scores (NES) of 3,107 pre-established biological processes transcriptional signatures in Bap1fl/fl Cγ1-Cre relative to control Bap1+/+ Cγ1-Cre GC B cells. (C) Gene ontology enrichment analysis of the genes downregulated in Bap1fl/fl Cγ1-Cre relative to control Bap1+/+ Cγ1-Cre GC B cells, at fold change (FC) ≥ |2.0| and false discovery rate (FDR) ≤0.05; -log10(p-values) for the top GO-terms are presented. Equivalent analysis of the upregulated genes in provided in Supplementary Table S5D. (D) Examples of the genes downregulated in Bap1+/+ Cγ1-Cre GC B cells and encoding important regulators on B cell receptor signaling, GC reaction, and humoral immunity; data presented as normalized read counts per million (CPM); bars represent mean ± SEM; * p< 0.05, ** p<0.01, *** p<0.001. (E) Genomic snapshots of selected genes representing the putative direct transcriptional targets of BAP1 in B cells, based on their altered expression in the Bap1fl/fl Cγ1-Cre GC B cells RNA-seq data and on BAP1 binding at their promoters in the ChIP-seq data. ChIP-Seq tracks for BAP1 and input DNA are shown on the top two lanes, including new data from CH12F3 B cells and previously published data from Ba/F3 pre-B cells (49). The gene feature track is shown in the middle, and averaged RNA-Seq tracks are in the bottom, with fold changes comparing expression in Bap1fl/fl Cγ1-Cre and control Bap1+/+ Cγ1-Cre GC B cells indicated. The maximum data range of each track is indicated at the top-right corner.
To explore the biological functions of the genes dysregulated in Bap1-deficient GC B cells, gene set enrichment analysis (GSEA) was performed (79). This demonstrated a significant downregulation of the transcriptional signatures involved in B cell engagement with T-helper cells, such as ‘positive regulation of T cell proliferation’ and ‘positive regulation of IL2 production’ in the Bap1fl/fl Cγ1-cre GC B cells, as well as an upregulation of the transcriptional signatures linked to mitochondrial function such as ‘inner mitochondrial membrane organization’, ‘ATP biosynthetic process’, and ‘oxidative phosphorylation’ (Figure 6B, Supplementary Table S5C). We also conducted a differential gene expression analysis between the Bap1fl/fl Cγ1-cre and control Bap1+/+ Cγ1-cre GC B cells, at the fold change (FC) ≥ |2.0| and false discovery rate (FDR) ≤ 0.05, which identified 94 upregulated and 76 downregulated genes in the Bap1fl/fl Cγ1-cre GC B cells (Supplementary Table S5A). Applying gene ontology (GO) analysis, we note the downregulation of the transcriptional signature of ‘intracellular signal transduction’ in the Bap1fl/fl Cγ1-cre GC B cells (Figure 6C, Supplementary Table S5E), with the downregulated genes including important positive and negative regulators of B cell receptor signaling, such as Nfam1 (88), Camk2d (89), Lrrk2 (90), Dgka (91), and Cblb (92, 93) (Figure 6D). As an example, Cblb encodes an E3 ubiquitin ligase that targets CD79a, CD79b, and IRF4 to regulate the initiation and progression of the GC-reaction (92, 93). Overall, the cell intrinsic loss of BAP1 in GC B cells resulted in a dysregulation of the transcriptional programs essential for normal induction of humoral immune response.
We consolidated the RNA-seq and ChIP-seq datasets to identify putative genes under the direct transcriptional control of BAP1 in B cells, as the genes dysregulated in Bap1fl/fl Cγ1-cre GC B cells and with BAP1-binding at their promoters in CH12F3 and/or BaF3 B cell lines. While our datasets showed no evidence for BAP1 regulation of the genes encoding the major mediators of B cell lineage choice, GC reaction, or plasma cell differentiation (Bach2, Batf, Bcl6, Blimp1/Prdm1, Irf4, Irf8, Myc, Pax5, Xbp1, Supplementary Tables S3-S5), we identified 73 putative BAP1-regulated genes (Supplementary Tables S5F, G). Such genes included the regulators of B cell receptor signaling Dgka and Cblb, already discussed above (Figures 6D, E) (91–93). The genes also included Litaf that encodes a repressor of Bcl6-expression and a regulator of autophagy and apoptosis in B cell lymphoma (94, 95), as well as Igf2bp3 that encodes a reader of the N6-methyladenosine (m6A) RNA-modification, specifically induced in GC B cells and essential for normal induction of humoral immune response (Figures 6D, E) (96). In summary, our study identifies novel transcriptional targets of BAP1 that are essential for the progression of GC-reaction and can contribute to the failure of humoral immunity with the loss of BAP1 function.
Discussion
Our study establishes the essential and cell-intrinsic role of the chromatin-binding DUB BAP1 in B cells for the normal induction of humoral immune response. It characterizes the impact of BAP1-loss on the genome-wide distribution of the H2AK119ub epigenetic mark and on the B cell transcriptome, and discovers novel BAP1-regulated genes with critical roles in the regulation of GC reaction and antibody-mediated immunity.
It is important to note that BAP1 is a multifunctional DUB with many putative substrates (28). Beyond histone H2AK119ub (19), BAP1 is reported to regulate the ubiquitination, stability, and activity of many transcription factors and enzymes at chromatin of various cell types, namely HCF1 (31, 32, 35), YY1 (35), FOXK1/2 (33, 34), KLF5 (36), PGC1α (37), and OGT (37, 47). BAP1 can also modulate the ubiquitination and stability of IP3R3, regulating Ca2+ release from endoplasmic reticulum and cell viability (38). Nevertheless, we demonstrate a major disruption in the H2AK119ub epigenetic landscape in Bap1Δ/Δ B cells, with an increase in H2AK119ub specifically at the BAP1 genome-binding sites. This establishes the major non-redundant role of BAP1 as a DUB for the H2AK119ub epigenetic mark in B cells and suggests this as the primary mechanism for the failure of B cell mediated immunity in the Bap1fl/fl Cγ1-cre model. Possible roles of other BAP1 substrates in B cell physiology remain to be further explored in future work.
Analyzing the effects of BAP1-loss on the transcriptome of GC B cells in consolidation with the BAP1 ChIP-seq data, we identified putative novel BAP1-regulated genes with essential roles in the GC reaction and humoral immunity. Furthermore, the significant overlap in BAP1 ChIP-seq genome binding sites in our B cell datasets with previously published datasets from other cell types indicated the engagement of BAP1 in shared housekeeping transcriptional programs. Although, due to the broad BAP1 functions in both housekeeping and cell-type specific transcriptional programs, we cannot attribute all the observed phenotypes to a defined set of BAP1-target genes, our analyses provide many novel BAP1-regulated genes the dysregulation of which can contribute to the failure of humoral immunity in the Bap1fl/fl Cγ1-cre model. This includes Cblb that encodes an E3 ubiquitin ligase known to target CD79a, CD79b, and IRF4 to regulate the GC-reaction (92, 93), as well as Igf2bp3 that encodes a reader of the m6A RNA-modification, induced in GC B cells and essential for normal activation of humoral immunity (96). Compensatory activity of the YTHDF2 m6A-binding protein has been reported in Igf2bp3-deficient GC B cells (96), and may contribute to the overexpression of the transcriptional signatures of mitochondrial biogenesis in the Bap1fl/fl Cγ1-cre GC B cells. Downregulation of the transcriptional signatures of ‘IL2 production’ and ‘T cell proliferation’ in the Bap1fl/fl Cγ1-cre GC B cells is also notable, as failure to receive T cell help is known to result in mitochondrial dysfunction and apoptosis in activated B cells (97, 98). Another example of a novel BAP1-regulated gene identified in our work is Litaf, which encodes a repressor of Bcl6-expression and a regulator of autophagy in B cell lymphoma (94, 95), and indeed autophagy plays an important role in the regulation of GC reaction and plasma cell maintenance (99–102). While our study focused on the BAP1-regulated transcriptional programs in GC B cells, its functions in the downstream checkpoints in humoral immunity, such as in plasma and memory B cells, remains to be further explored. The reduction in plasma cell numbers and antibody titers in the Bap1fl/fl Cγ1-cre model is particularly notable, and our study did not quantify antigen specific plasma cells or assess the efficiency of Bap1-deletion within the plasma cell compartment. The roles and molecular mechanisms of BAP1 in plasma cell differentiation should be addressed in future work.
Loss of BAP1 in activated B cells in the Bap1fl/fl Cγ1-cre mouse model resulted in a severe defect in antibody production, and we noted the more profound reduction in IgG as compared to IgM isotypes. We hypothesized that this may reflect the enhanced Cγ1-cre activity in the B cells committed to undergo class switching to IgG1, or a direct role for BAP1 in the antibody class switching reaction. Indeed, epigenetic mechanisms are important across many checkpoints in antibody class switching, such as regulation of S-region accessibility and transcription, AID expression and targeting to chromatin, and in the DNA break-repair step (103). For instance, BAP1 was previously shown to facilitate DNA repair through the homologous recombination (HR) pathway in DT40 B cell lymphoma (39). However, we found normal class switching of Bap1fl/fl Cγ1-cre B cells when normalized to the significant reduction in B cell proliferation. This result is consistent with the major roles of the other repair pathways in antibody class switching, namely non-homologous end joining (NHEJ) and microhomology-mediated end joining (MMEJ) (104), and also rules out non-redundant roles of BAP1 in steps upstream from DNA damage in class switching. Nonetheless, BAP1 functions in the class switching reaction may be redundant with other chromatin associated DUBs (20), as for example the chromatin associated DUB USP22 was recently shown to promote DNA repair in antibody class switching (105).
Our current study focusses on the role of BAP1 specifically in mature activated B cells, with the Bap1fl/fl Cγ1-cre model allowing the selective analyses of its B cell-intrinsic functions in the induction of humoral immune response. However, beyond this experimental model, it is important to consider that BAP1 activities in other cell types may also contribute to the regulation of antibody mediated immunity in vivo. BAP1 is known to play an important cell-intrinsic role in T cell development in the thymus, as well as in the peripheral T cell expansion under homeostatic conditions and in response to antigenic stimulation (48). Furthermore, BAP1 activities in mesenchymal stromal cells (MSCs) are essential for normal B cell development in the bone marrow (106). Therefore, in addition to the cell intrinsic roles of BAP1 in B cells, elucidated in our current work, BAP1 functions in T cells and stromal compartments need to be considered when assessing its systemic roles in the regulation of humoral immunity in vivo, as for example in carriers of germline BAP1 mutations.
Our study establishes the critical role of BAP1 as a transcriptional and epigenetic regulator in the GC reaction, which is a common site of cell transformation that gives rise to B cell lymphomas (4, 107). While BAP1 is a highly important tumor suppressor (28), lymphomas are not among the major cancer types associated with germline or acquired BAP1 mutations, and our current study didn’t directly address the role of BAP1 in lymphomagenesis. Nevertheless, cases of non-Hodgkin lymphoma have been reported in carriers of germline BAP1 mutations (108), and lymphomas with other genetic aberrations were shown to acquire BAP1 gene silencing via epigenetic mechanisms (109). Therefore, we anticipate that future work in the Bap1fl/fl Cγ1-cre and other relevant murine models may further explore BAP1 functions as a tumor suppressor in B cell lymphoma.
In summary, our study provides novel insights into the epigenetic regulation of B lymphocyte biology and humoral immunity by BAP1, the major DUB for histone H2AK119ub, with potential implications for host responses to infections and vaccinations, and the mechanisms of B cell carcinogenesis.
Data availability statement
RNA-Seq and ChIP-seq data are available in the National Center for Biotechnology Information GEO database under the following accession numbers: GSE244623 (NCBI tracking system #24319231) for RNA-seq and GSE245220 (NCBI tracking system #24330334) for ChIP-seq. All other data are available from the corresponding author upon request.
Ethics statement
The animal study was approved by protocol MCGL-2011-6029 reviewed by the McGill Animal Care Committee. The study was conducted in accordance with the local legislation and institutional requirements.
Author contributions
YL: Data curation, Formal Analysis, Investigation, Writing – original draft. HW: Supervision, Data curation, Formal analysis, Investigation, Writing – review & editing. NS: Formal analysis, Investigation, Writing – review & editing. YHL: Formal analysis, Investigation, Writing – review & editing. LT: Investigation, Writing – review & editing. JN: Conceptualization, Supervision, Writing – review & editing. DL: Conceptualization, Supervision, Writing – review & editing. AN: Conceptualization, Funding acquisition, Supervision, Writing – original draft, Formal analysis.
Funding
The author(s) declare that financial support was received for the research, authorship, and/or publication of this article. The work was funded by the Discovery Grant RGPIN-2016-05657 from the Natural Sciences and Engineering Research Council of Canada (NSERC). Work by NS and JN was funded by project grant PJ-155944 from the Canadian Institutes of Health Research (CIHR). AN is a Canada Research Chair Tier II in Hematopoiesis and Lymphocyte Differentiation; YL was a recipient of the Richard Birks Fellowship (2017), Internal Scholarship from the Faculty of Medicine of McGill University (2020), and Ph.D. Studentship from the Fonds de Recherche du Québec - Santé (FRQS, 2021-2024); DL was supported by an FRQS Junior 1 salary award; HW was a recipient of an FRQS Masters Training Studentship (2018-2020); NSJ holds an FRQS Doctoral Training Scholarship (2020-2024); LT was a recipient of the Richard Birks Fellowship (2020), Cole Foundation Studentship (2021), and CIHR Canada Graduate Scholarship (2022-2025); YHL was a recipient of Frederick Banting Tri-Council Scholarship (2017), Cole Foundation Studentship (2018-2020), and FRQS Doctoral Training Scholarship (2020).
Acknowledgments
We thank the Molecular Biology and Functional Genomics Facility of the Institut de Recherches Cliniques de Montréal (IRCM) for next generation sequencing, and the Digital Research Alliance of Canada and Calcul Québec for the resources for bioinformatics data analyses. The flow cytometry and cell sorting were performed at the Cell Vision Core Facility of the McGill Life Science Complex, with the support of the Canadian Foundation for Innovation, and we thank Julien Leconte and Camille Stegen for assistance with cell sorting. We thank Catherine Gagné, Tanya Koch, and other staff of the McGill Comparative Medicine and Animal Resources Centre (CMARC) for mouse colony management, Gabriela Blaszczyk, Orthy Aiyana, Xuanning Chen, Nayoung Cha, Andrew Yim, Dania Shaban and Connor Prosty for mouse genotyping, and Viktoria Plackoska, Joo Eun (June) Kim, Dania Shaban, Yurim Park, and Mansen Yu for assistance with the mouse experiments.
Conflict of interest
The authors declare that the research was conducted in the absence of any commercial or financial relationships that could be construed as a potential conflict of interest.
The author(s) declared that they were an editorial board member of Frontiers, at the time of submission. This had no impact on the peer review process and the final decision.
Publisher’s note
All claims expressed in this article are solely those of the authors and do not necessarily represent those of their affiliated organizations, or those of the publisher, the editors and the reviewers. Any product that may be evaluated in this article, or claim that may be made by its manufacturer, is not guaranteed or endorsed by the publisher.
Supplementary material
The Supplementary Material for this article can be found online at: https://www.frontiersin.org/articles/10.3389/fimmu.2024.1353138/full#supplementary-material
References
1. Tarlinton D. B cells still front and centre in immunology. Nat Rev Immunol. (2019) 19:85–6. doi: 10.1038/s41577-018-0107-2
2. De Silva NS, Klein U. Dynamics of B cells in germinal centres. Nat Rev Immunol. (2015) 15:137–48. doi: 10.1038/nri3804
3. Nutt SL, Hodgkin PD, Tarlinton DM, Corcoran LM. The generation of antibody-secreting plasma cells. Nat Rev Immunol. (2015) 15:160–71. doi: 10.1038/nri3795
4. Basso K, Dalla-Favera R. Germinal centres and B cell lymphomagenesis. Nat Rev Immunol. (2015) 15:172–84. doi: 10.1038/nri3814
5. Di Carlo V, Mocavini I, Di Croce L. Polycomb complexes in normal and Malignant hematopoiesis. J Cell Biol. (2019) 218:55–69. doi: 10.1083/jcb.201808028
6. Blackledge NP, Klose RJ. The molecular principles of gene regulation by Polycomb repressive complexes. Nat Rev Mol Cell Biol. (2021) 22:815–33. doi: 10.1038/s41580-021-00398-y
7. Wang H, Wang L, Erdjument-Bromage H, Vidal M, Tempst P, Jones RS, et al. Role of histone H2A ubiquitination in Polycomb silencing. Nature. (2004) 431:873–8. doi: 10.1038/nature02985
8. Beguelin W, Popovic R, Teater M, Jiang Y, Bunting KL, Rosen M, et al. EZH2 is required for germinal center formation and somatic EZH2 mutations promote lymphoid transformation. Cancer Cell. (2013) 23:677–92. doi: 10.1016/j.ccr.2013.04.011
9. Caganova M, Carrisi C, Varano G, Mainoldi F, Zanardi F, Germain PL, et al. Germinal center dysregulation by histone methyltransferase EZH2 promotes lymphomagenesis. J Clin Invest. (2013) 123:5009–22. doi: 10.1172/JCI70626
10. Beguelin W, Teater M, Gearhart MD, Calvo Fernandez MT, Goldstein RL, Cardenas MG, et al. EZH2 and BCL6 cooperate to assemble CBX8-BCOR complex to repress bivalent promoters, mediate germinal center formation and lymphomagenesis. Cancer Cell. (2016) 30:197–213. doi: 10.1016/j.ccell.2016.07.006
11. Guo M, Price MJ, Patterson DG, Barwick BG, Haines RR, Kania AK, et al. EZH2 represses the B cell transcriptional program and regulates antibody-secreting cell metabolism and antibody production. J Immunol. (2018) 200:1039–52. doi: 10.4049/jimmunol.1701470
12. Velichutina I, Shaknovich R, Geng H, Johnson NA, Gascoyne RD, Melnick AM, et al. EZH2-mediated epigenetic silencing in germinal center B cells contributes to proliferation and lymphomagenesis. Blood. (2010) 116:5247–55. doi: 10.1182/blood-2010-04-280149
13. Xu B, Konze KD, Jin J, Wang GG. Targeting EZH2 and PRC2 dependence as novel anticancer therapy. Exp Hematol. (2015) 43:698–712. doi: 10.1016/j.exphem.2015.05.001
14. Good-Jacobson KL. Regulation of germinal center, B-cell memory, and plasma cell formation by histone modifiers. Front Immunol. (2014) 5:596. doi: 10.3389/fimmu.2014.00596
15. Di Pietro A, Polmear J, Cooper L, Damelang T, Hussain T, Hailes L, et al. Targeting BMI-1 in B cells restores effective humoral immune responses and controls chronic viral infection. Nat Immunol. (2022) 23:86–98. doi: 10.1038/s41590-021-01077-y
16. Banerjee A, Sindhava V, Vuyyuru R, Jha V, Hodewadekar S, Manser T, et al. YY1 is required for germinal center B cell development. PloS One. (2016) 11:e0155311. doi: 10.1371/journal.pone.0155311
17. Green MR, Monti S, Dalla-Favera R, Pasqualucci L, Walsh NC, Schmidt-Supprian M, et al. Signatures of murine B-cell development implicate Yy1 as a regulator of the germinal center-specific program. Proc Natl Acad Sci U S A. (2011) 108:2873–8. doi: 10.1073/pnas.1019537108
18. Kleiman E, Jia H, Loguercio S, Su AI, Feeney AJ. YY1 plays an essential role at all stages of B-cell differentiation. Proc Natl Acad Sci U S A. (2016) 113:E3911–20. doi: 10.1073/pnas.1606297113
19. Barbour H, Daou S, Hendzel M, Affar EB. Polycomb group-mediated histone H2A monoubiquitination in epigenome regulation and nuclear processes. Nat Commun. (2020) 11:5947. doi: 10.1038/s41467-020-19722-9
20. Belle JI, Nijnik A. H2A-DUBbing the mammalian epigenome: expanding frontiers for histone H2A deubiquitinating enzymes in cell biology and physiology. Int J Biochem Cell Biol. (2014) 50:161–74. doi: 10.1016/j.biocel.2014.03.004
21. Wang H, Langlais D, Nijnik A. Histone H2A deubiquitinases in the transcriptional programs of development and hematopoiesis: a consolidated analysis. Int J Biochem Cell Biol. (2023) 157:106384. doi: 10.1016/j.biocel.2023.106384
22. Nijnik A, Clare S, Hale C, Raisen C, McIntyre RE, Yusa K, et al. The critical role of histone H2A-deubiquitinase Mysm1 in hematopoiesis and lymphocyte differentiation. Blood. (2012) 119:1370–9. doi: 10.1182/blood-2011-05-352666
23. Jiang XX, Nguyen Q, Chou Y, Wang T, Nandakumar V, Yates P, et al. Control of B cell development by the histone H2A deubiquitinase MYSM1. Immunity. (2011) 35:883–96. doi: 10.1016/j.immuni.2011.11.010
24. Forster M, Farrington K, Petrov JC, Belle JI, Mindt BC, Witalis M, et al. MYSM1-dependent checkpoints in B cell lineage differentiation and B cell-mediated immune response. J Leukoc Biol. (2017) 101:643–54. doi: 10.1189/jlb.1AB0415-177RR
25. Lin YH, Wang H, Fiore A, Forster M, Tung LT, Belle JI, et al. Loss of MYSM1 inhibits the oncogenic activity of cMYC in B cell lymphoma. J Cell Mol Med. (2021) 25:7089–94. doi: 10.1111/jcmm.16554
26. Gu Y, Jones AE, Yang W, Liu S, Dai Q, Liu Y, et al. The histone H2A deubiquitinase Usp16 regulates hematopoiesis and hematopoietic stem cell function. Proc Natl Acad Sci U S A. (2016) 113:E51–60. doi: 10.1073/pnas.1517041113
27. Frangini A, Sjoberg M, Roman-Trufero M, Dharmalingam G, Haberle V, Bartke T, et al. The aurora B kinase and the polycomb protein ring1B combine to regulate active promoters in quiescent lymphocytes. Mol Cell. (2013) 51:647–61. doi: 10.1016/j.molcel.2013.08.022
28. Masclef L, Ahmed O, Estavoyer B, Larrivee B, Labrecque N, Nijnik A, et al. Roles and mechanisms of BAP1 deubiquitinase in tumor suppression. Cell Death Differ. (2021) 28:606–25. doi: 10.1038/s41418-020-00709-4
29. Daou S, Barbour H, Ahmed O, Masclef L, Baril C, Sen Nkwe N, et al. Monoubiquitination of ASXLs controls the deubiquitinase activity of the tumor suppressor BAP1. Nat Commun. (2018) 9:4385. doi: 10.1038/s41467-018-06854-2
30. Sahtoe DD, van Dijk WJ, Ekkebus R, Ovaa H, Sixma TK. BAP1/ASXL1 recruitment and activation for H2A deubiquitination. Nat Commun. (2016) 7:10292. doi: 10.1038/ncomms10292
31. Misaghi S, Ottosen S, Izrael-Tomasevic A, Arnott D, Lamkanfi M, Lee J, et al. Association of C-terminal ubiquitin hydrolase BRCA1-associated protein 1 with cell cycle regulator host cell factor 1. Mol Cell Biol. (2009) 29:2181–92. doi: 10.1128/MCB.01517-08
32. Machida YJ, Machida Y, Vashisht AA, Wohlschlegel JA, Dutta A. The deubiquitinating enzyme BAP1 regulates cell growth via interaction with HCF-1. J Biol Chem. (2009) 284:34179–88. doi: 10.1074/jbc.M109.046755
33. Ji Z, Mohammed H, Webber A, Ridsdale J, Han N, Carroll JS, et al. The forkhead transcription factor FOXK2 acts as a chromatin targeting factor for the BAP1-containing histone deubiquitinase complex. Nucleic Acids Res. (2014) 42:6232–42. doi: 10.1093/nar/gku274
34. Okino Y, Machida Y, Frankland-Searby S, Machida YJ. BRCA1-associated protein 1 (BAP1) deubiquitinase antagonizes the ubiquitin-mediated activation of FoxK2 target genes. J Biol Chem. (2015) 290:1580–91. doi: 10.1074/jbc.M114.609834
35. Yu H, Mashtalir N, Daou S, Hammond-Martel I, Ross J, Sui G, et al. The ubiquitin carboxyl hydrolase BAP1 forms a ternary complex with YY1 and HCF-1 and is a critical regulator of gene expression. Mol Cell Biol. (2010) 30:5071–85. doi: 10.1128/MCB.00396-10
36. Qin J, Zhou Z, Chen W, Wang C, Zhang H, Ge G, et al. BAP1 promotes breast cancer cell proliferation and metastasis by deubiquitinating KLF5. Nat Commun. (2015) 6:8471. doi: 10.1038/ncomms9471
37. Ruan HB, Han X, Li MD, Singh JP, Qian K, Azarhoush S, et al. O-GlcNAc transferase/host cell factor C1 complex regulates gluconeogenesis by modulating PGC-1alpha stability. Cell Metab. (2012) 16:226–37. doi: 10.1016/j.cmet.2012.07.006
38. Bononi A, Giorgi C, Patergnani S, Larson D, Verbruggen K, Tanji M, et al. BAP1 regulates IP3R3-mediated Ca(2+) flux to mitochondria suppressing cell transformation. Nature. (2017) 546:549–53. doi: 10.1038/nature22798
39. Yu H, Pak H, Hammond-Martel I, Ghram M, Rodrigue A, Daou S, et al. Tumor suppressor and deubiquitinase BAP1 promotes DNA double-strand break repair. Proc Natl Acad Sci U S A. (2014) 111:285–90. doi: 10.1073/pnas.1309085110
40. Pena-Llopis S, Vega-Rubin-de-Celis S, Liao A, Leng N, Pavia-Jimenez A, Wang S, et al. BAP1 loss defines a new class of renal cell carcinoma. Nat Genet. (2012) 44:751–9. doi: 10.1038/ng.2323
41. Harbour JW, Onken MD, Roberson ED, Duan S, Cao L, Worley LA, et al. Frequent mutation of BAP1 in metastasizing uveal melanomas. Science. (2010) 330:1410–3. doi: 10.1126/science.1194472
42. Bott M, Brevet M, Taylor BS, Shimizu S, Ito T, Wang L, et al. The nuclear deubiquitinase BAP1 is commonly inactivated by somatic mutations and 3p21.1 losses in Malignant pleural mesothelioma. Nat Genet. (2011) 43:668–72. doi: 10.1038/ng.855
43. Abdel-Wahab O, Dey A. The ASXL-BAP1 axis: new factors in myelopoiesis, cancer and epigenetics. Leukemia. (2013) 27:10–5. doi: 10.1038/leu.2012.288
44. Micol JB, Abdel-Wahab O. The role of additional sex combs-like proteins in cancer. Cold Spring Harb Perspect Med. (2016) 6:10. doi: 10.1101/cshperspect.a026526
45. Wiesner T, Obenauf AC, Murali R, Fried I, Griewank KG, Ulz P, et al. Germline mutations in BAP1 predispose to melanocytic tumors. Nat Genet. (2011) 43:1018–21. doi: 10.1038/ng.910
46. Testa JR, Cheung M, Pei J, Below JE, Tan Y, Sementino E, et al. Germline BAP1 mutations predispose to Malignant mesothelioma. Nat Genet. (2011) 43:1022–5. doi: 10.1038/ng.912
47. Dey A, Seshasayee D, Noubade R, French DM, Liu J, Chaurushiya MS, et al. Loss of the tumor suppressor BAP1 causes myeloid transformation. Science. (2012) 337:1541–6. doi: 10.1126/science.1221711
48. Arenzana TL, Lianoglou S, Seki A, Eidenschenk C, Cheung T, Seshasayee D, et al. Tumor suppressor BAP1 is essential for thymic development and proliferative responses of T lymphocytes. Sci Immunol. (2018) 3:22. doi: 10.1126/sciimmunol.aal1953
49. Lin YH, Liang Y, Wang H, Tung LT, Forster M, Subramani PG, et al. Regulation of B lymphocyte development by histone H2A deubiquitinase BAP1. Front Immunol. (2021) 12:626418. doi: 10.3389/fimmu.2021.626418
50. Lara-Astiaso D, Weiner A, Lorenzo-Vivas E, Zaretsky I, Jaitin DA, David E, et al. Immunogenetics. Chromatin state dynamics during blood formation. Science. (2014) 345:943–9. doi: 10.1126/science.1256271
51. White JK, Gerdin AK, Karp NA, Ryder E, Buljan M, Bussell JN, et al. Genome-wide generation and systematic phenotyping of knockout mice reveals new roles for many genes. Cell. (2013) 154:452–64. doi: 10.1016/j.cell.2013.06.022
52. Skarnes WC, Rosen B, West AP, Koutsourakis M, Bushell W, Iyer V, et al. A conditional knockout resource for the genome-wide study of mouse gene function. Nature. (2011) 474:337–42. doi: 10.1038/nature10163
53. Bradley A, Anastassiadis K, Ayadi A, Battey JF, Bell C, Birling MC, et al. The mammalian gene function resource: the International Knockout Mouse Consortium. Mamm Genome. (2012) 23:580–6. doi: 10.1007/s00335-012-9422-2
54. Hobeika E, Thiemann S, Storch B, Jumaa H, Nielsen PJ, Pelanda R, et al. Testing gene function early in the B cell lineage in mb1-cre mice. Proc Natl Acad Sci U S A. (2006) 103:13789–94. doi: 10.1073/pnas.0605944103
55. Casola S, Cattoretti G, Uyttersprot N, Koralov SB, Seagal J, Hao Z, et al. Tracking germinal center B cells expressing germ-line immunoglobulin gamma1 transcripts by conditional gene targeting. Proc Natl Acad Sci U S A. (2006) 103:7396–401. doi: 10.1073/pnas.0602353103
56. Nakamura M, Kondo S, Sugai M, Nazarea M, Imamura S, Honjo T. High frequency class switching of an IgM+ B lymphoma clone CH12F3 to IgA+ cells. Int Immunol. (1996) 8:193–201. doi: 10.1093/intimm/8.2.193
57. Ran FA, Hsu PD, Wright J, Agarwala V, Scott DA, Zhang F. Genome engineering using the CRISPR-Cas9 system. Nat Protoc. (2013) 8:2281–308. doi: 10.1038/nprot.2013.143
58. Litzler LC, Zahn A, Dionne KL, Sprumont A, Ferreira SR, Slattery MRF, et al. Protein arginine methyltransferase 1 regulates B cell fate after positive selection in the germinal center in mice. J Exp Med. (2023) 220:9. doi: 10.1084/jem.20220381
59. Cao AT, Yao S, Gong B, Nurieva RI, Elson CO, Cong Y. Interleukin (IL)-21 promotes intestinal IgA response to microbiota. Mucosal Immunol. (2015) 8:1072–82. doi: 10.1038/mi.2014.134
60. Nojima T, Haniuda K, Moutai T, Matsudaira M, Mizokawa S, Shiratori I, et al. In-vitro derived germinal centre B cells differentially generate memory B or plasma cells in vivo. Nat Commun. (2011) 2:465. doi: 10.1038/ncomms1475
61. Litzler LC, Zahn A, Meli AP, Hebert S, Patenaude AM, Methot SP, et al. PRMT5 is essential for B cell development and germinal center dynamics. Nat Commun. (2019) 10:22. doi: 10.1038/s41467-018-07884-6
62. McAllister EJ, Apgar JR, Leung CR, Rickert RC, Jellusova J. New methods to analyze B cell immune responses to thymus-dependent antigen sheep red blood cells. J Immunol. (2017) 199:2998–3003. doi: 10.4049/jimmunol.1700454
63. Langlais D, Couture C, Balsalobre A, Drouin J. The Stat3/GR interaction code: predictive value of direct/indirect DNA recruitment for transcription outcome. Mol Cell. (2012) 47:38–49. doi: 10.1016/j.molcel.2012.04.021
64. Langmead B, Trapnell C, Pop M, Salzberg SL. Ultrafast and memory-efficient alignment of short DNA sequences to the human genome. Genome Biol. (2009) 10:R25. doi: 10.1186/gb-2009-10-3-r25
65. Zhang Y, Liu T, Meyer CA, Eeckhoute J, Johnson DS, Bernstein BE, et al. Model-based analysis of chIP-seq (MACS). Genome Biol. (2008) 9:R137. doi: 10.1186/gb-2008-9-9-r137
66. Heinz S, Benner C, Spann N, Bertolino E, Lin YC, Laslo P, et al. Simple combinations of lineage-determining transcription factors prime cis-regulatory elements required for macrophage and B cell identities. Mol Cell. (2010) 38:576–89. doi: 10.1016/j.molcel.2010.05.004
67. Thorvaldsdottir H, Robinson JT, Mesirov JP. Integrative Genomics Viewer (IGV): high-performance genomics data visualization and exploration. Brief Bioinform. (2013) 14:178–92. doi: 10.1093/bib/bbs017
68. McLean CY, Bristor D, Hiller M, Clarke SL, Schaar BT, Lowe CB, et al. GREAT improves functional interpretation of cis-regulatory regions. Nat Biotechnol. (2010) 28:495–501. doi: 10.1038/nbt.1630
69. Tung LT, Wang H, Belle JI, Petrov JC, Langlais D, Nijnik A. p53-dependent induction of P2X7 on hematopoietic stem and progenitor cells regulates hematopoietic response to genotoxic stress. Cell Death Dis. (2021) 12:923. doi: 10.1038/s41419-021-04202-9
70. Bolger AM, Lohse M, Usadel B. Trimmomatic: a flexible trimmer for Illumina sequence data. Bioinformatics. (2014) 30:2114–20. doi: 10.1093/bioinformatics/btu170
71. Kim D, Paggi JM, Park C, Bennett C, Salzberg SL. Graph-based genome alignment and genotyping with HISAT2 and HISAT-genotype. Nat Biotechnol. (2019) 37:907–15. doi: 10.1038/s41587-019-0201-4
72. Pertea M, Kim D, Pertea GM, Leek JT, Salzberg SL. Transcript-level expression analysis of RNA-seq experiments with HISAT, StringTie and Ballgown. Nat Protoc. (2016) 11:1650–67. doi: 10.1038/nprot.2016.095
73. Kim D, Langmead B, Salzberg SL. HISAT: a fast spliced aligner with low memory requirements. Nat Methods. (2015) 12:357–60. doi: 10.1038/nmeth.3317
74. Liao Y, Smyth GK, Shi W. featureCounts: an efficient general purpose program for assigning sequence reads to genomic features. Bioinformatics. (2014) 30:923–30. doi: 10.1093/bioinformatics/btt656
75. Bolstad B. preprocessCore: A collection of pre-processing functions. R package version 1.44.0 (2018). Available online at: https://githubcom/bmbolstad/preprocessCore.
76. Robinson MD, Oshlack A. A scaling normalization method for differential expression analysis of RNA-seq data. Genome Biol. (2010) 11:R25. doi: 10.1186/gb-2010-11-3-r25
77. Mevik BH, Wehrens R. The pls package: principal component and partial least squares regression in R. J Stat Software. (2007) 18. doi: 10.18637/jss.v018.i02
78. Huang DW, Sherman BT, Tan Q, Collins JR, Alvord WG, Roayaei J, et al. The DAVID Gene Functional Classification Tool: a novel biological module-centric algorithm to functionally analyze large gene lists. Genome Biol. (2007) 8:R183. doi: 10.1186/gb-2007-8-9-r183
79. Subramanian A, Tamayo P, Mootha VK, Mukherjee S, Ebert BL, Gillette MA, et al. Gene set enrichment analysis: a knowledge-based approach for interpreting genome-wide expression profiles. Proc Natl Acad Sci U S A. (2005) 102:15545–50. doi: 10.1073/pnas.0506580102
80. Belle JI, Wang H, Fiore A, Petrov JC, Lin YH, Feng CH, et al. MYSM1 maintains ribosomal protein gene expression in hematopoietic stem cells to prevent hematopoietic dysfunction. JCI Insight. (2020) 5:13. doi: 10.1172/jci.insight.125690
81. Yoshida H, Lareau CA, Ramirez RN, Rose SA, Maier B, Wroblewska A, et al. The cis-regulatory atlas of the mouse immune system. Cell. (2019) 176:897–912 e20. doi: 10.1016/j.cell.2018.12.036
82. Tas JMJ, Koo JH, Lin YC, Xie Z, Steichen JM, Jackson AM, et al. Antibodies from primary humoral responses modulate the recruitment of naive B cells during secondary responses. Immunity. (2022) 55:1856–71 e6. doi: 10.1016/j.immuni.2022.07.020
83. Conway E, Rossi F, Fernandez-Perez D, Ponzo E, Ferrari KJ, Zanotti M, et al. BAP1 enhances Polycomb repression by counteracting widespread H2AK119ub1 deposition and chromatin condensation. Mol Cell. (2021) 81:3526–41 e8. doi: 10.1016/j.molcel.2021.06.020
84. Kolovos P, Nishimura K, Sankar A, Sidoli S, Cloos PA, Helin K, et al. PR-DUB maintains the expression of critical genes through FOXK1/2- and ASXL1/2/3-dependent recruitment to chromatin and H2AK119ub1 deubiquitination. Genome Res. (2020) 30:1119–30. doi: 10.1101/gr.261016.120
85. Kweon SM, Chen Y, Moon E, Kvederaviciute K, Klimasauskas S, Feldman DE. An adversarial DNA N(6)-methyladenine-sensor network preserves polycomb silencing. Mol Cell. (2019) 74:1138–47 e6. doi: 10.1016/j.molcel.2019.03.018
86. Micol JB, Pastore A, Inoue D, Duployez N, Kim E, Lee SC, et al. ASXL2 is essential for haematopoiesis and acts as a haploinsufficient tumour suppressor in leukemia. Nat Commun. (2017) 8:15429. doi: 10.1038/ncomms15429
87. Delgado-Benito V, Rosen DB, Wang Q, Gazumyan A, Pai JA, Oliveira TY, et al. The chromatin reader ZMYND8 regulates igh enhancers to promote immunoglobulin class switch recombination. Mol Cell. (2018) 72:636–49 e8. doi: 10.1016/j.molcel.2018.08.042
88. Ohtsuka M, Arase H, Takeuchi A, Yamasaki S, Shiina R, Suenaga T, et al. NFAM1, an immunoreceptor tyrosine-based activation motif-bearing molecule that regulates B cell development and signaling. Proc Natl Acad Sci U S A. (2004) 101:8126–31. doi: 10.1073/pnas.0401119101
89. Li X, Zeng Q, Wang S, Li M, Chen X, Huang Y, et al. CRAC channel controls the differentiation of pathogenic B cells in lupus nephritis. Front Immunol. (2021) 12:779560. doi: 10.3389/fimmu.2021.779560
90. Kubo M, Nagashima R, Ohta E, Maekawa T, Isobe Y, Kurihara M, et al. Leucine-rich repeat kinase 2 is a regulator of B cell function, affecting homeostasis, BCR signaling, IgA production, and TI antigen responses. J Neuroimmunol. (2016) 292:1–8. doi: 10.1016/j.jneuroim.2016.01.005
91. Wheeler ML, Dong MB, Brink R, Zhong XP, DeFranco AL. Diacylglycerol kinase zeta limits B cell antigen receptor-dependent activation of ERK signaling to inhibit early antibody responses. Sci Signal. (2013) 6:ra91. doi: 10.1126/scisignal.2004189
92. Li X, Gong L, Meli AP, Karo-Atar D, Sun W, Zou Y, et al. Cbl and Cbl-b control the germinal center reaction by facilitating naive B cell antigen processing. J Exp Med. (2020) 217:9. doi: 10.1084/jem.20191537
93. Li X, Gadzinsky A, Gong L, Tong H, Calderon V, Li Y, et al. Cbl ubiquitin ligases control B cell exit from the germinal-center reaction. Immunity. (2018) 48:530–41 e6. doi: 10.1016/j.immuni.2018.03.006
94. Shi Y, Kuai Y, Lei L, Weng Y, Berberich-Siebelt F, Zhang X, et al. The feedback loop of LITAF and BCL6 is involved in regulating apoptosis in B cell non-Hodgkin’s-lymphoma. Oncotarget. (2016) 7:77444–56. doi: 10.18632/oncotarget.v7i47
95. Bertolo C, Roa S, Sagardoy A, Mena-Varas M, Robles EF, Martinez-Ferrandis JI, et al. LITAF, a BCL6 target gene, regulates autophagy in mature B-cell lymphomas. Br J Haematol. (2013) 162:621–30. doi: 10.1111/bjh.12440
96. Grenov AC, Moss L, Edelheit S, Cordiner R, Schmiedel D, Biram A, et al. The germinal center reaction depends on RNA methylation and divergent functions of specific methyl readers. J Exp Med. (2021) 218:10. doi: 10.1084/jem.20210360
97. Akkaya M, Traba J, Roesler AS, Miozzo P, Akkaya B, Theall BP, et al. Second signals rescue B cells from activation-induced mitochondrial dysfunction and death. Nat Immunol. (2018) 19:871–84. doi: 10.1038/s41590-018-0156-5
98. Tesi A, de Pretis S, Furlan M, Filipuzzi M, Morelli MJ, Andronache A, et al. An early Myc-dependent transcriptional program orchestrates cell growth during B-cell activation. EMBO Rep. (2019) 20:e47987. doi: 10.15252/embr.201947987
99. He C, Wang S, Zhou C, He M, Wang J, Ladds M, et al. CD36 and LC3B initiated autophagy in B cells regulates the humoral immune response. Autophagy. (2021) 17:3577–91. doi: 10.1080/15548627.2021.1885183
100. Raso F, Sagadiev S, Du S, Gage E, Arkatkar T, Metzler G, et al. alphav Integrins regulate germinal center B cell responses through noncanonical autophagy. J Clin Invest. (2018) 128:4163–78. doi: 10.1172/JCI99597
101. Martinez-Martin N, Maldonado P, Gasparrini F, Frederico B, Aggarwal S, Gaya M, et al. A switch from canonical to noncanonical autophagy shapes B cell responses. Science. (2017) 355:641–7. doi: 10.1126/science.aal3908
102. Sandoval H, Kodali S, Wang J. Regulation of B cell fate, survival, and function by mitochondria and autophagy. Mitochondrion. (2018) 41:58–65. doi: 10.1016/j.mito.2017.11.005
103. Vaidyanathan B, Chaudhuri J. Epigenetic codes programing class switch recombination. Front Immunol. (2015) 6:405. doi: 10.3389/fimmu.2015.00405
104. Saha T, Sundaravinayagam D, Di Virgilio M. Charting a DNA repair roadmap for immunoglobulin class switch recombination. Trends Biochem Sci. (2021) 46:184–99. doi: 10.1016/j.tibs.2020.10.005
105. Li C, Irrazabal T, So CC, Berru M, Du L, Lam E, et al. The H2B deubiquitinase Usp22 promotes antibody class switch recombination by facilitating non-homologous end joining. Nat Commun. (2018) 9:1006. doi: 10.1038/s41467-018-03455-x
106. Jeong J, Jung I, Kim JH, Jeon S, Hyeon DY, Min H, et al. BAP1 shapes the bone marrow niche for lymphopoiesis by fine-tuning epigenetic profiles in endosteal mesenchymal stromal cells. Cell Death Differ. (2022) 29:2151–62. doi: 10.1038/s41418-022-01006-y
107. Mlynarczyk C, Fontan L, Melnick A. Germinal center-derived lymphomas: The darkest side of humoral immunity. Immunol Rev. (2019) 288:214–39. doi: 10.1111/imr.12755
108. Walpole S, Pritchard AL, Cebulla CM, Pilarski R, Stautberg M, Davidorf FH, et al. Comprehensive study of the clinical phenotype of germline BAP1 variant-carrying families worldwide. J Natl Cancer Inst. (2018) 110:1328–41. doi: 10.1093/jnci/djy171
Keywords: B cell, humoral immune response, epigenetic regulation and gene expression, mouse model, germinal center (GC) B cells, class switch recombination, deubiquinating enzymes
Citation: Liang Y, Wang H, Seija N, Lin YH, Tung LT, Di Noia JM, Langlais D and Nijnik A (2024) B-cell intrinsic regulation of antibody mediated immunity by histone H2A deubiquitinase BAP1. Front. Immunol. 15:1353138. doi: 10.3389/fimmu.2024.1353138
Received: 09 December 2023; Accepted: 15 February 2024;
Published: 11 March 2024.
Edited by:
Aaron James Marshall, University of Manitoba, CanadaReviewed by:
Kevin M. Mcbride, University of Texas MD Anderson Cancer Center, United StatesChristian Kosan, Friedrich Schiller University Jena, Germany
Copyright © 2024 Liang, Wang, Seija, Lin, Tung, Di Noia, Langlais and Nijnik. This is an open-access article distributed under the terms of the Creative Commons Attribution License (CC BY). The use, distribution or reproduction in other forums is permitted, provided the original author(s) and the copyright owner(s) are credited and that the original publication in this journal is cited, in accordance with accepted academic practice. No use, distribution or reproduction is permitted which does not comply with these terms.
*Correspondence: Anastasia Nijnik, YW5hc3Rhc2lhLm5pam5pa0BtY2dpbGwuY2E=