 Ibon Galparsoro
 Angel Borja
 María C. Uyarra
- Marine Research Division, AZTI-Tecnalia, Pasaia, Spain
The mapping and assessment of the ecosystem services provided by benthic habitats is a highly valuable source of information for understanding their current and potential benefits to society. The main objective of this research is to assess and map the ecosystem services provided by benthic habitats in the European North Atlantic Ocean, in the context of the “Mapping and Assessment of Ecosystems and their Services” (MAES) programme, the European Biodiversity Strategy and the implementation of the Marine Strategy Framework Directive (MSFD). In total, 62 habitats have been analyzed in relation to 12 ecosystem services over 1.7 million km2. Results indicated that more than 90% of the mapped area provides biodiversity maintenance and food provision services; meanwhile, grounds providing reproduction and nursery services are limited to half of the mapped area. Benthic habitats generally provide more services closer to shore—rather than offshore—and in shallower waters. This gradient is likely to be explained by difficult access (i.e., distance and depth) and lack of scientific knowledge for most of the services provided by distant benthic habitats. This research has provided a first assessment of the benthic ecosystem services on the Atlantic-European scale, with the provision of ecosystem services maps and their general spatial distribution patterns. Regarding the objectives of this research, conclusions are: (i) benthic habitats provide a diverse set of ecosystem services, being the food provision, with biodiversity maintenance services more extensively represented. In addition, other regulating and cultural services are provided in a more limited area; and (ii) the ecosystem services assessment categories are significantly related to the distance to the coast and to depth (higher near the coast and in shallow waters).
Introduction
Functioning ecosystems are essential for maintaining the oceans in a healthy state (Tett et al., 2013). While being healthy, they provide numerous and diverse goods and services that contribute “for free” to the general well-being and health of humans (Van Den Belt and Costanza, 2012). The “ecosystem goods and services” term integrates two concepts: (i) the ecosystem goods, which represent marketable material products that are obtained from natural systems for human use, such as food and raw materials (De Groot et al., 2002); and (ii) ecosystem services, which refers to all “the conditions and processes through which natural ecosystems, and the species that make them up, sustain and fulfill human life” (Daily, 1997). The latter are not directly marketable services, and include nutrient recycling, biodiversity maintenance, climate regulation or cultural and esthetic services (Costanza et al., 1997). Ecosystem services occur at multiple spatial scales; from the global, such as climate regulation, primary production, and carbon sequestration, to a more regional or local scale, such as coastal protection and leisure.
Previous studies show that coastal ecosystem services provide an important portion of the total contribution of ecosystem services to human welfare (Pimm, 1997; Pearce, 1998). Costanza et al. (1997) showed that, while the coastal zone only covers 8% of the world's surface, the services that this zone provides are responsible for approximately 43% of the estimated total value of global ecosystem services. Despite our dependence on biodiversity and ecosystem services, population expansion and economic growth are leading to increasing anthropogenic pressures on coastal areas (Wilson et al., 2013) and consequently, to a decreasing supply of ecosystem services worldwide (Costanza et al., 2014). Recognizing that human pressures directly impact on ecosystem services and that in turn, ecosystem services directly benefit human well-being, they have sparked interest amongst coastal planners and have led to the integration of ecosystem services in conservation management measures (Cimon-Morin et al., 2013).
Due to the above-mentioned reasons, ecologists, social scientists, economists and environmental managers are increasingly interested in assessing the economic values associated with the ecosystem services of coastal and marine ecosystems (Bingham et al., 1995; Costanza et al., 1997; Daily, 1997; Farber et al., 2002; Liquete et al., 2013a). Different approaches and frameworks have been proposed to identify, define, classify and quantify services provided by marine biodiversity (MEA, 2003; Ten Brink et al., 2009; Cices, 2013; Liquete et al., 2013a). Neither of these approaches being a straight forward one; the accurate estimation of the values of services, and in particular their temporal and spatial variation, is relatively new and has not been extensively researched (Schägner et al., 2013).
Indeed, the complexity of the processes and functioning of marine ecosystems, and their highly dynamic nature, translates into the absence or low resolution of spatially explicit information. Furthermore, the deep sea, and in particular benthic habitats, is mostly lacking in ecosystem services assessments (Armstrong et al., 2012; Thurber et al., 2013). Due to these limiting factors, there are few published studies, and they mainly focus on food production, such as fisheries, with other services receiving minor attention (Murillas-Maza et al., 2011; Liquete et al., 2013a; Seitz et al., 2014). Mapping and assessing ecosystem services may help to overcome such hindrances. Maps not only enable the characterization of current benefits that services provide to society, but also the adoption management measures that guarantee their future provision and contribution to human welfare (Egoh et al., 2012).
To date, several habitat mapping efforts have been carried out at different spatial and temporal resolutions (Liquete et al., 2013a). Within Europe, Mapping and Assessment of Ecosystems and their Services (MAES) is one of the keystones of the EU Biodiversity Strategy to 2020 (Maes et al., 2013). This strategy demands Member States to map and assess the state of ecosystems and their services in their national territory (including their marine waters) with the assistance of the European Commission. The results of this mapping and assessment should support the maintenance and restoration of ecosystems and the services they provide (Maes et al., 2013). It will also contribute to the assessment of the economic value of ecosystem services, and promote the integration of these values into accounting and reporting systems at EU and national level by 2020. The results are expected to be used to inform policy decision makers and policy implementation in many fields, such as nature and biodiversity, territorial cohesion, agriculture, forestry, and fisheries. Outputs can also inform policy development and implementation in other domains, such as transport and energy (Maes et al., 2013). For example, the Marine Strategy Framework Directive (MSFD, 2008/56/EC) requires the availability of ecosystem services valuation for the assessment of the environmental status and to define the measures that make sustainable human activities at sea (Cardoso et al., 2010). Hence, according to the MSFD, the assessment of the environmental status should be undertaken for the Exclusive Economic Zone (EEZ) of the Member States within the four European Regional Seas: North Eastern Atlantic, Baltic, Mediterranean, and Black Seas.
In this context, the objectives of this research were: (i) the qualitative assessment and mapping of the ecosystem services provided by benthic habitats within the European North Atlantic Ocean; and (ii) to determine if ecosystem services assessment categories are related to the habitat distance to the coast and depth. The analysis was based on available cartographic information and ecosystem services assessment, focusing on the benefits that they provide in the Regional Seas and sub-regions defined by the MSFD.
Materials and Methods
The implementation of ecosystem services valuation involves two dimensions: (i) a biophysical assessment of services supply; and (ii) a socio-economic assessment of the value per unit of services (Schägner et al., 2013). Within this investigation, we focused only on the first approach of trying to map and assess the ecosystem services provided by benthic habitats at the European North Atlantic Ocean scale. This is because the economic value of the services is still poorly known, needing comprehensive data supply, which the results from this investigation can provide.
Geographic Area
For this investigation, the North Eastern Atlantic was selected. According to MSFD, the North Eastern Atlantic Ocean is divided into four sub-regions: Greater North Sea, Celtic Seas, Bay of Biscay and Iberian coasts, and Macaronesia (Figure 1). It should be noted that at the time of this investigation, no official geographical delimitations of the sub-regions were adopted, and therefore, they were defined according to the EEZs. The total area of the European North Atlantic Ocean covered by the MSFD is 4,540,025 km2, which corresponds to the EEZ of 10 European Member States and part of Norway (Figure 1).
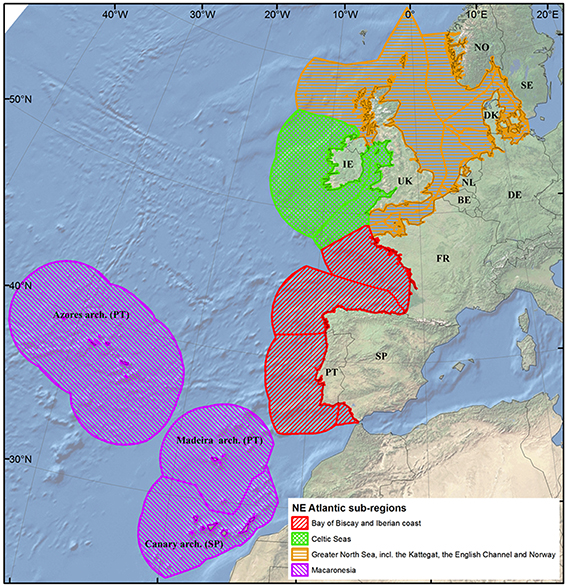
Figure 1. European North Atlantic Ocean sub-regions. Spatial limits are based on the Marine Strategy Framework Directive and Exclusive Economic Zone of the countries located in each sub-region. BE, Belgium; DK, Denmark; FR, France; DE, Germany; IE, Ireland; NL, Netherlands; NO, Norway; PT, Portugal (including Azores archipelago and Madeira archipelago); SP, Spain (including Canary archipelago); SE, Sweden; and UK, United Kingdom.
Background Information Used in the Analysis
In order to proceed with the mapping of ecosystem services, main bathymetric and habitat data were obtained from the following sources:
- EMODnet—European Marine Observation and Data Network [http://www.emodnet-hydrography.eu/; European Commission; Directorate-General for Maritime Affairs and Fisheries (DG MARE)]. EMODnet-Hydrography portal provides hydrographic data collated for a number of sea regions in Europe. Bathymetric information was available as Digital Elevation Model at 500 m (c.a. 0.0042°) grid resolution.
- EUSeaMap—Mapping European seabed habitats (http://jncc.defra.gov.uk/page-6266). EUSeaMap is a broad-scale modeled habitat map built in the framework of MESH (Mapping European Seabed Habitats) and BALANCE (Baltic Sea Management—Nature Conservation and Sustainable Development of the Ecosystem through Spatial Planning) INTERREG IIIB-funded projects. EUSeaMap covers over 2 million km2 of European seabed (Cameron and Askew, 2011). This information layer was available in polygon format.
- MeshAtlantic project (www.meshatlantic.eu; Atlantic Area Transnational Cooperation Programme 2007–2013 of the European Regional Development Fund). It covers over 356,000 km2 of seabed habitats of the European North Atlantic Ocean produced 250 m (c.a. 0.0027°) grid resolution. This information layer was available in polygon format (Vasquez et al., in press).
Digital Elevation Model
To produce the digital elevation model information layer, bathymetric information from MeshAtlantic and EMODnet was mosaicked. The information on this layer enabled the investigation of the depth distribution of benthic habitats in the sub-regions of the mapped areas.
Benthic Habitats Information
For practical purposes of mapping and assessment (i.e., data availability) this investigation focused on “benthic habitats,” as a means to assess the provision of ecosystem goods and services.
Habitats were classified according to EUNIS (European Union Nature Information System) habitat classes (Davies et al., 2004). The EUNIS habitat classification aims to provide a common European reference set of habitat types to allow the reporting of habitat data in a comparable manner for use in nature conservation (e.g., inventories, monitoring, and assessments) (Davies and Moss, 2002; Davies et al., 2004; Galparsoro et al., 2012). The classification is organized into hierarchical levels (EUNIS habitat type hierarchical view is available at http://eunis.eea.europa.eu/habitats-code-browser.jsp). The present version of the classification starts at level 1, where “Marine habitats” are defined, up to level 6, by using different abiotic and biological criteria at each level of the classification. For seabed habitats for which EUNIS classes were not defined, underwater features defined under EUSeaMap (e.g., infralittoral seabed) were retained.
Habitat maps were transformed into raster format and mosaicked to obtain a total broad-scale habitat map. In overlapping cells, MeshAtlantic habitat classes were kept, according to the criteria that this represents the most recent information. The mapped area outside EEZ of Ireland was excluded from the later analysis, in order to make results comparable among different countries, in which only EEZ areas were included.
Finally, to analyse the spatial distribution of benthic habitats (in terms of their distance to shore) and therefore, that of the ecosystem services that they provide, the distance of each cell, assigned to each habitat type, to the nearest coastline point was estimated using Euclidean distance algorithm, in a Geographic Information System (GIS).
Ecosystem Services Assessment
In total, twelve ecosystem services were considered in this investigation: (i) Food provision; (ii) Raw materials (biological) (incl. biochemical, medicinal, and ornamental); (iii) Air quality and climate regulation; (iv) Disturbance and natural hazard prevention; (v) Photosynthesis, chemosynthesis, and primary production; (vi) Nutrient cycling; (vii) Reproduction and nursery; (viii) Maintenance of biodiversity; (ix) Water quality regulation and bioremediation of waste; (x) Cognitive value; (xi) Leisure, recreation and cultural inspiration; and (xii) Feel good or warm glow.
Ecosystem services were classified into: (i) Provisioning services (i.e., 1 and 2 from the above list); (ii) Regulating services (i.e., 3–9); and (iii) Cultural services (i.e., 10–12). The qualitative ecosystem services categories offered by each habitat were based on Table 1 from Salomidi et al. (2012), which, in turn, classified them based on an adaptation of the categories proposed by the Millennium Ecosystem Assessment (MEA, 2003) and Beaumont et al. (2007). Rather than using absolute metrics to classify services of each habitat, the assessment was based on the expert judgment of Salomidi et al. (2012), collated in the aforementioned Table 1 of that manuscript, and the following guidelines: (i) when the provision of a specific service is well documented in the scientific literature and is widely accepted as important for the specific benthic habitat analyzed, it was considered as providing a “High” value for such ecosystem service (e.g., the role of seagrass beds in sediment retention and prevention of coastal erosion); (ii) when a service was or could be provided by a habitat but to a substantially lower magnitude than by other habitats and without being vital for the persistence of an important human activity, a “Low” value was assigned; and (iii) in all other cases, ecosystem services were classified as “Negligible/Irrelevant/Unknown.” For the purpose of the present investigation, ecosystem services categories were rated into the following numerical values for further analysis: “High = 3,” “Low = 1,” “Negligible/Irrelevant/Unknown = 0.” A similar classification and scores were successfully used in smaller areas (Potts et al., 2014) (see Figures 3, 4 in that manuscript).
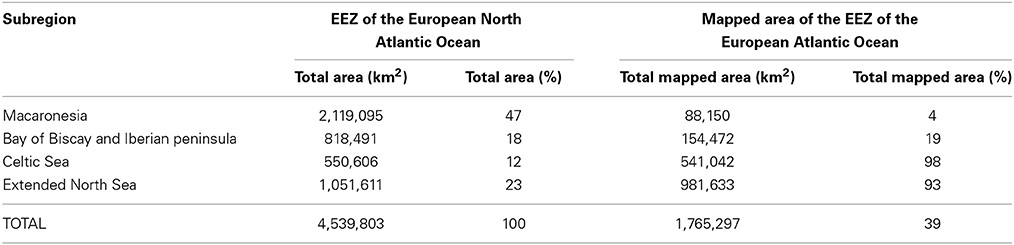
Table 1. Total spatial contribution of each sub-region to the Exclusive Economic Zone (EEZ) of the European North Atlantic Ocean, and their mapped area, represented in total and relative (%) terms.
The ecosystem services provisioning categories of each habitat type, was linked to the final habitat map. For those habitat classes that were included in the map, but not listed in Salomidi et al. (2012), the categories were assigned according to the knowledge of the authors, in a similar way to that of Potts et al. (2014).
To analyse the spatial distribution pattern of ecosystem services provisioning levels, the total area and its percentage cover of the total mapped area, mean depth, and mean distance to the coastline were calculated. The values of all cells encompassed within a polygon representing the extent of a habitat, were averaged to assign a unique value to each polygon for each variable (i.e., mean depth value within a polygon) To assess whether the distance to the coastline and depth had an effect on the categories at which the different ecosystem services are provided (i.e., high, low, and negligible values), Kruskal-Wallis non-parametric tests were applied using Statgraphics v.5.0. Then, differences in ecosystem services categories within the subregions were tested using Chi-Square tests. Finally, Friedman test, followed by post-hoc Wilcoxon tests, was undertaken to explore statistical differences between ecosystem services typologies (i.e., provision, regulation, and cultural).
Results
The European North Atlantic Ocean (EEZ only) covers more than 4.5 million km2 (Table 1), of which 26% corresponds to continental shelf (up to 200 m depth) and 74% to deeper areas (Figure 2). To date, 88% of the continental shelf and 18% of the deeper areas have been mapped, accounting for 38.9 % of the total EEZ area of the European North Atlantic Ocean.
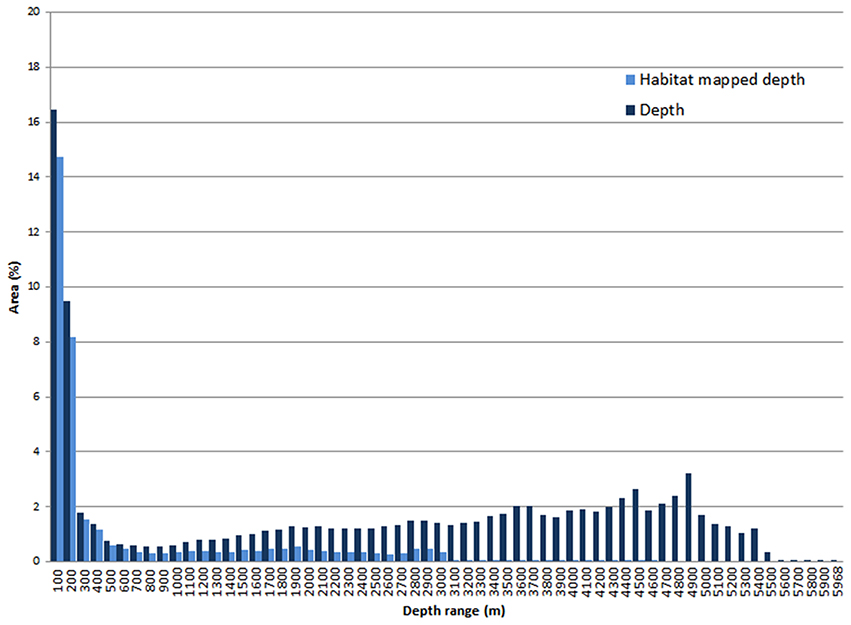
Figure 2. Depth distribution of the Exclusive Economic Zone of the European North Atlantic Ocean (dark blue) and depth distribution of habitat-mapped areas (light blue).
The Macaronesia accounts for the highest proportion of the European North Atlantic EEZ, followed by the Extended North Sea (Table 1). However, differences in the amount of mapped area can be found among sub-regions. Whereas countries located in the Celtic Sea and North Sea have already mapped almost all their EEZ seabed surface (i.e., 98 and 93%, respectively), countries located in Macaronesia, Bay of Biscay, and Iberian coasts (i.e., France, Portugal, and Spain) have still more than 80% of the seabed area without cartographic information (Table 1 and Figure S1). Indeed, habitat maps for the Canary and Madeira Archipelagos, in Macaronesia, are not available. It should be highlighted that these countries have some of the most extensive and deepest EEZs areas of the European North Atlantic Ocean.
The 1.7 million km2 covered by the integrated broad-scale habitat map encompassed 62 different benthic habitats and seabed seascape features (Figure 3). The North Sea and the Celtic Sea encompassed 58 and 55 habitats respectively, while the Bay of Biscay and Macaronesia only covered 42 and 20 habitats, respectively. Furthermore, very few habitats accounted for a large section of the mapped area (Figure 4). Ten habitats covered more than 75% of the total mapped area, of which deep sea mud (18.3%), deep circalittoral sand (16.2%), circalittoral fine sands, or circalittoral muddy sand (9.7%) were the most dominant ones. Opposite, a large number of habitats (i.e., 33) covered less than 10,000 km2 or 0.5% of the mapped seabed. The least dominant habitats in the European North Atlantic Ocean were the low energy infralittoral mixed hard sediments, Atlantic and Mediterranean low energy infralittoral rock and sponge communities on deep circalittoral rock, all of which cover less than 100 km2.
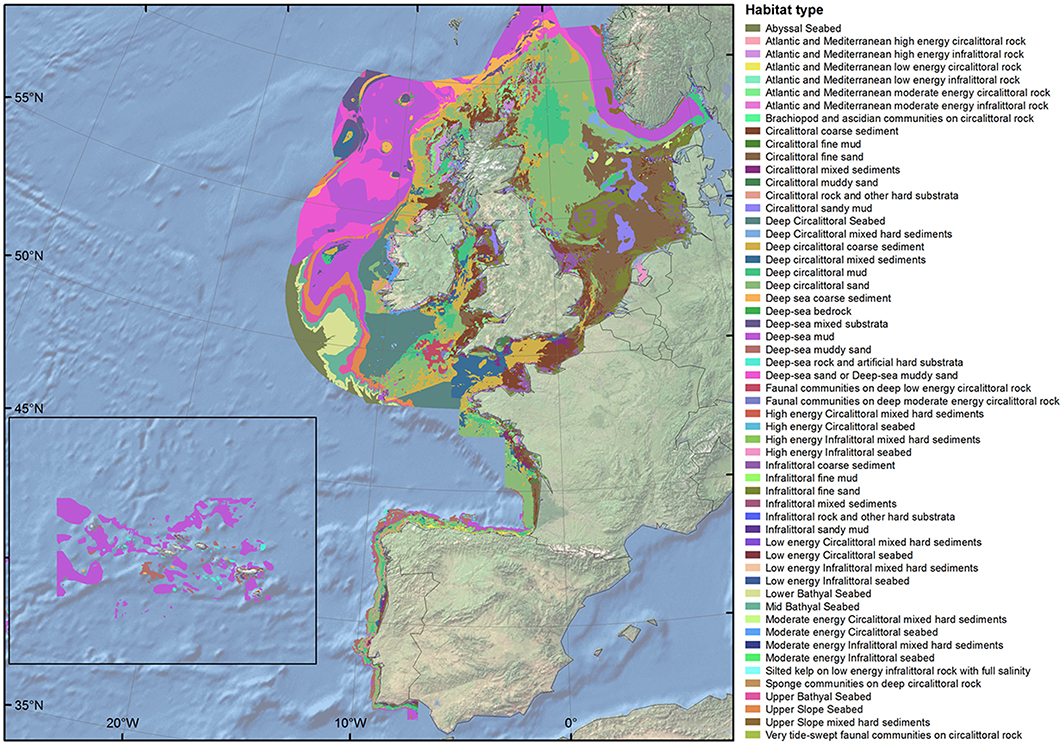
Figure 3. Benthic habitat map distribution within the European North Atlantic Ocean. Habitats are listed in alphabetical order.
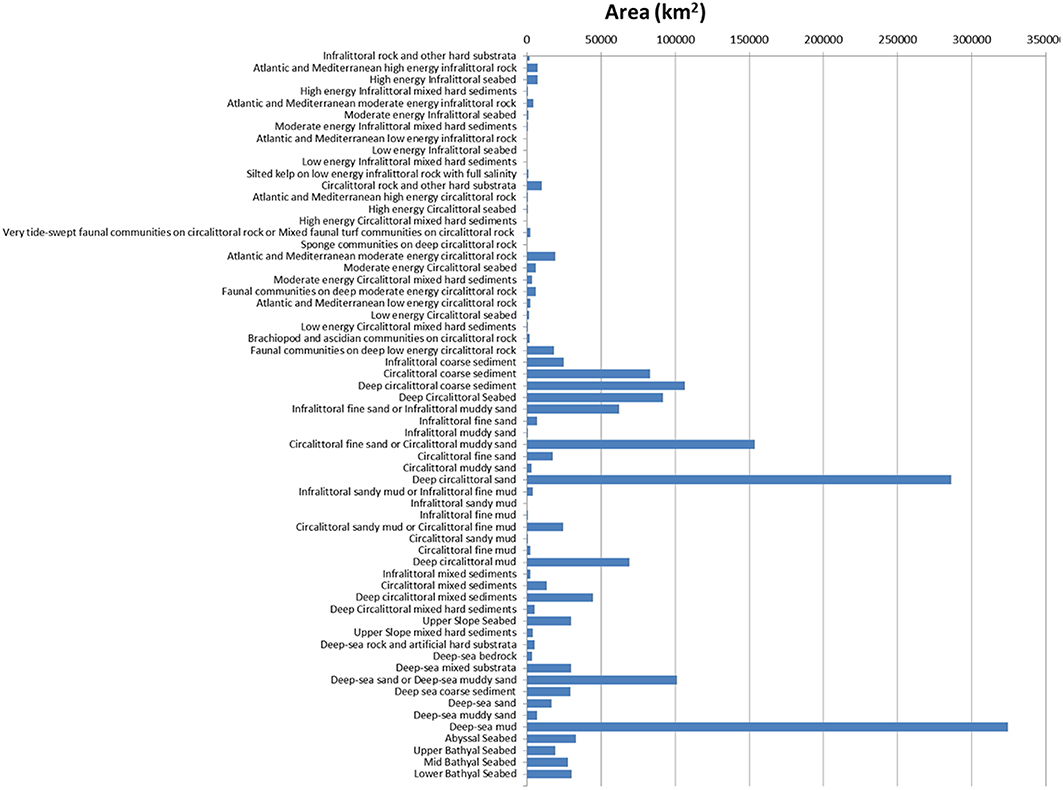
Figure 4. Area covered by each benthic habitat and seascape feature type, within the European North Atlantic Ocean.
Of the 62 habitats identified in European North Atlantic Ocean, none of them provides the 12 ecosystem services considered in this study at the highest value (Table 2). However, four of these habitats (i.e., Infralittoral rock and other hard substrata, Atlantic and Mediterranean high energy infralittoral rock, High energy infralittoral seabed, and High energy infralittoral mixed hard sediments) provide high values for 11 services (excluding nutrient cycling). Another seven infralittoral habitats also provide high values for 10 of the services. On the other hand, 12 deep and bathyal habitats are considered as providing negligible values for 10 or more ecosystem services. The upper, mid, and lower bathyal seabed habitats provide the lowest number of ecosystem services and values.
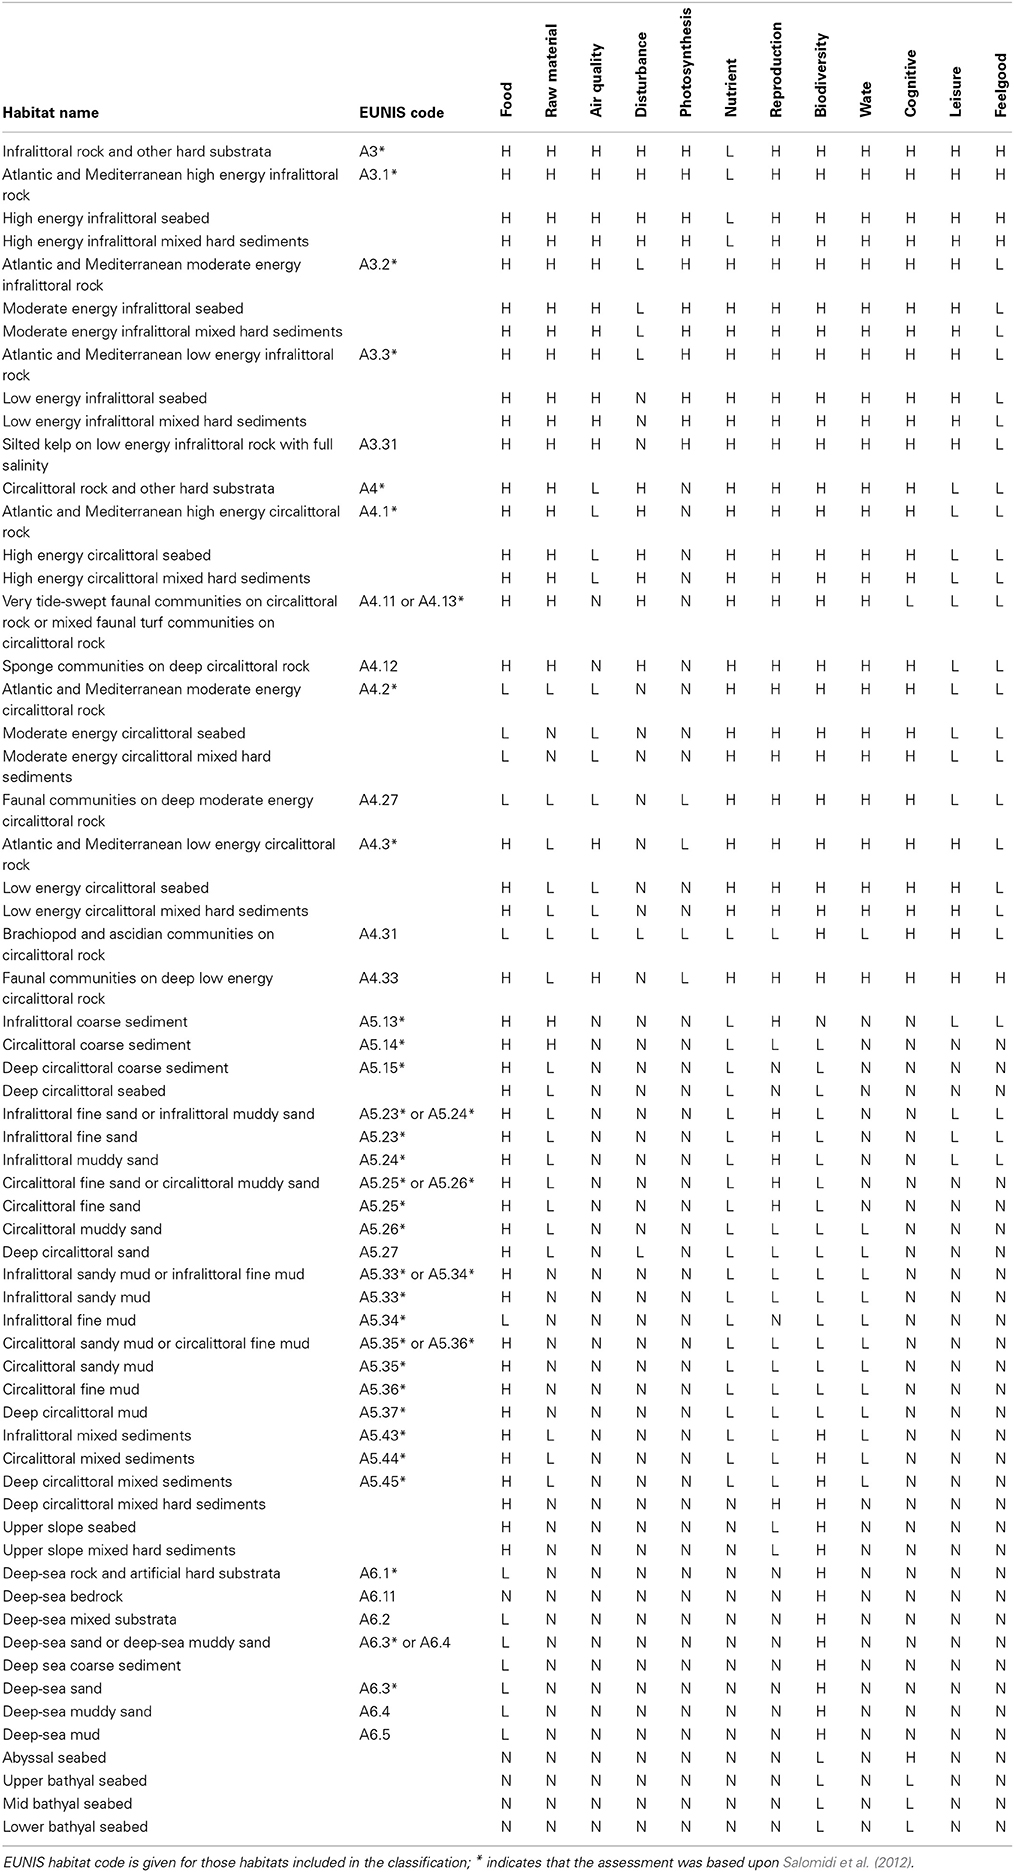
Table 2. Ecosystem services assessment for each habitat and seabed feature type (H, high; L, low; and N, Negligible).
Results also indicate that the highest provision of services is that of habitats located close to the coastline and in shallow waters (p < 0.001 for all services and in both cases—distance and depth; see Tables 3, 4). Thus, there is a gradient on the level of services provision, from high to lower or negligible values, seawards and toward deeper areas. For example, areas providing high food provision services are located close to the coast (16 ± 35 km) and in shallow areas (47 ± 50 m). Furthermore, it is also observed that the level of service provision significantly varies across sub-regions (Chi-Square test: p always < 0.001), with the North Sea being the region generally providing services at the highest levels.
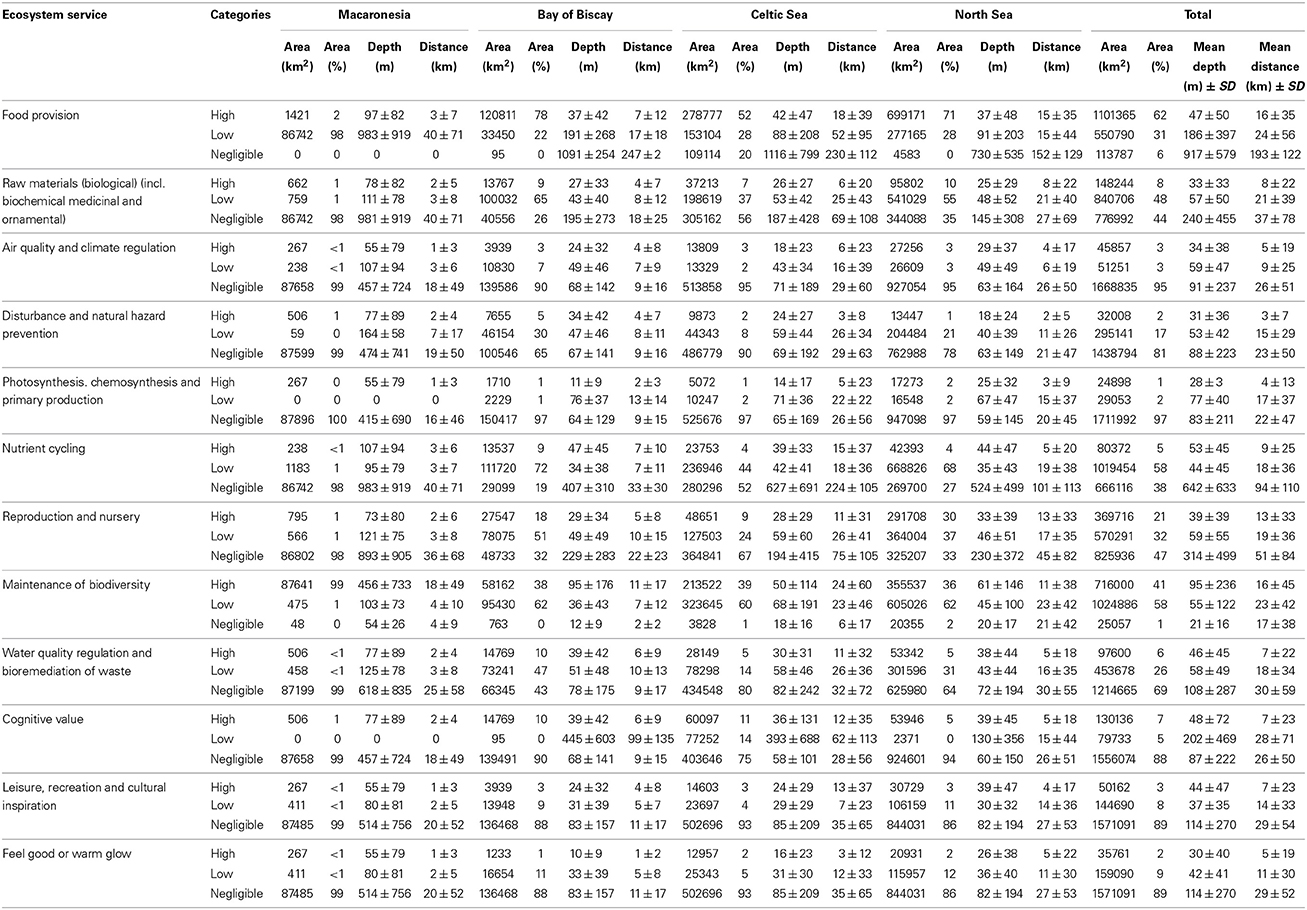
Table 3. Depth, distance to the coast, and area covered by the ecosystem services assigned with different assessment categories (i.e., High, Low, and Negligible) and provided by benthic habitats, within the Atlantic Ocean, and for each of the sub-regions.
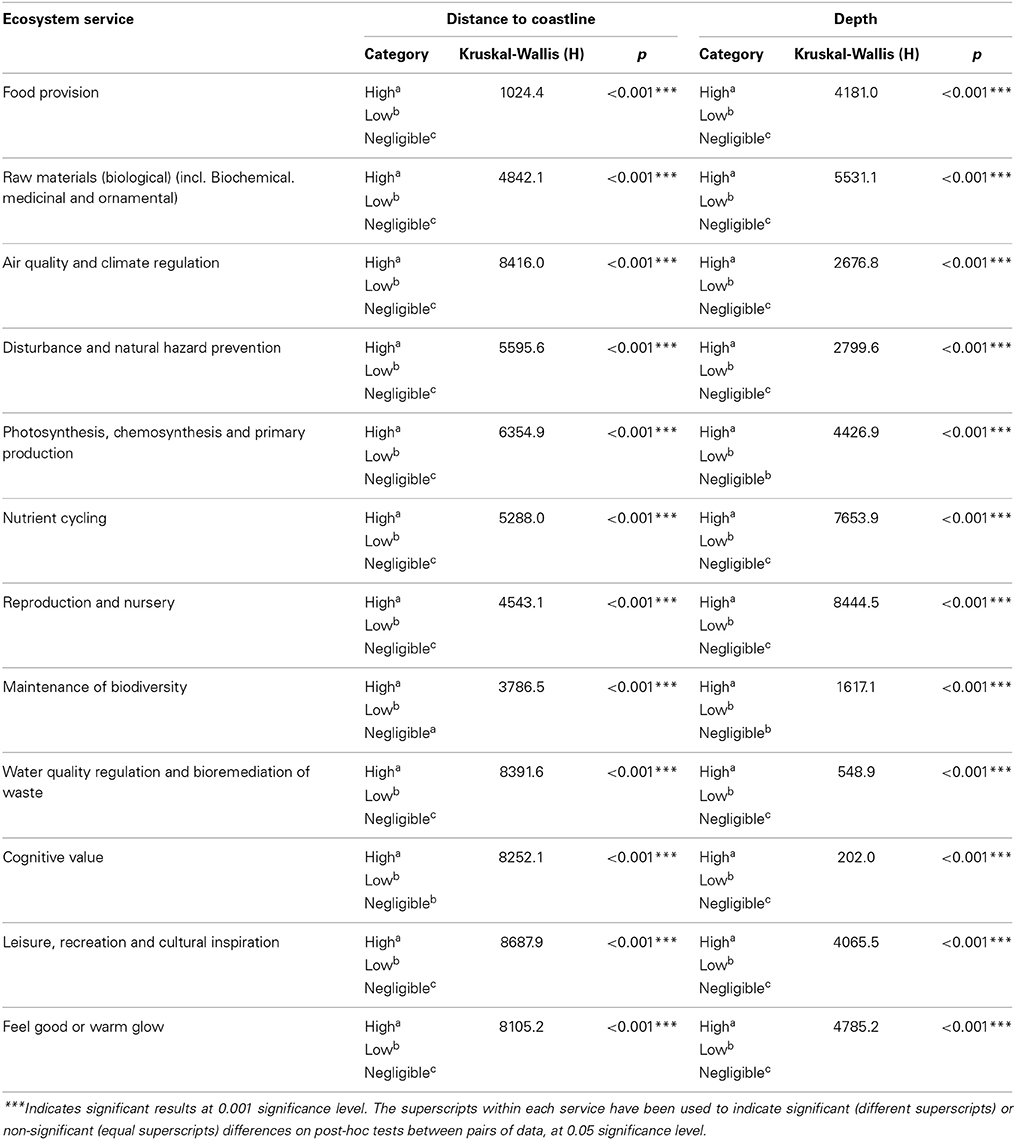
Table 4. Differences (Kruskal-Wallis test) between ecosystem services categories provided by benthic habitats, according to the distance to coastline, and depth (N = 55,023).
Table 2 also suggests that none of the ecosystem services is provided by all the habitats. “Food,” “biodiversity maintenance” and “nursery grounds” (i.e., “reproduction”) are the ecosystem services most commonly provided by habitats (and to the highest level). Opposite, “photosynthesis,” “disturbance prevention,” “air quality” and “cultural services” are provided on a high level by a limited number of habitats. This pattern is also observed when considering not only the number of habitats providing specific ecosystem services, but also the area providing such ecosystem services (Table 3 and Figures S2–S13, in Supporting Information).
Indeed, 93% of the studied area provides food provision services, of which 62% corresponds with high food provision values. Similarly, a high proportion of the mapped area (99%) is considered as providing high (41%) and low (58%) biodiversity maintenance services.
The next ecosystem services, in terms of area coverage, are reproduction and nursery, which are provided by 53% of the mapped area. For the remaining ecosystem goods and services (i.e., air quality and climate regulation, water quality regulation and bioremediation, nutrient cycling, raw material provision, photosynthesis, chemosynthesis, and primary production), the area covered by habitats providing them at high values is much smaller. The disturbance and natural hazard prevention service has the smallest spatial coverage.
Finally, cultural services (i.e., cognitive value, leisure, recreation and cultural inspiration, and feel good and warm glow), showed similar patterns on their spatial distribution. The area covered by the habitats providing such type of services (both, at high and low levels) is very limited (around 11% of the total).
On the other hand, significant differences are observed in the spatial distribution of provision levels of aggregated ecosystem services (i.e., provisioning, regulating, and cultural), (Friedman test χ2 = 47,858; p < 0.001) (Figure 5). The provisioning services are supplied at significantly higher levels than both regulating (Wilcoxon post-hoc test z = −154, p < 0.001) and cultural services (Wilcoxon post-hoc test z = −171, p < 0.001); and in turn, regulating services are also provided at significantly higher levels than cultural services (Wilcoxon post-hoc test z = −130, p < 0.001).
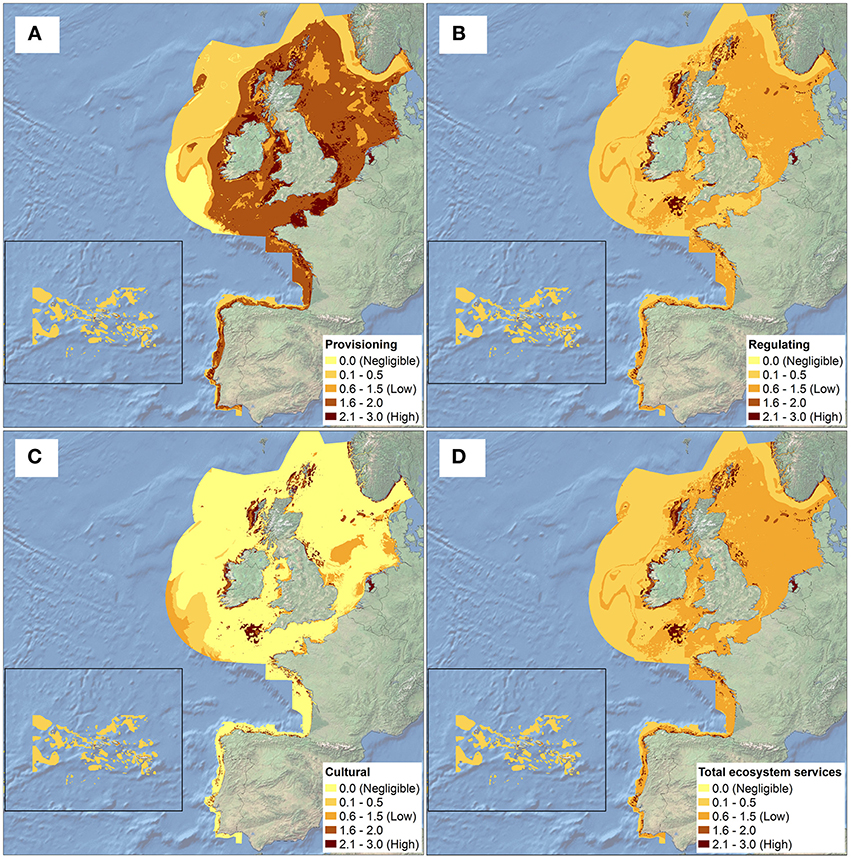
Figure 5. Spatial distribution of the mean value of aggregated ecosystem: (A) Provisioning services; (B) Regulating services; (C) Cultural services; and (D) Total ecosystem services.
Discussion
Seafloor maps are an essential source of information for resource exploitation and management purposes (Rice, 2010). Nevertheless, in Europe, it is worth noting that countries such as Spain, Portugal and France, with large EEZ areas have less mapped areas. This is probably due to the steepness of the seafloor, with large bathyal and abyssal areas, and the technical and economic challenge associated with mapping areas with such characteristics. Among others, marine shallow water areas support most of the human activities associated with the use and benefit of the ecosystem services provided by benthic habitats (Ramirez-Llodra et al., 2011; Korpinen et al., 2013), but accurate estimation of the values of services and their spatial distribution is not available for extensive areas. Within this research, the assessment and mapping of the ecosystem services provided by benthic habitats of the European North Atlantic Ocean has been undertaken for the first time.
In the studied area, a clear gradient has been identified for the provision of ecosystem services, with significantly higher provision levels for habitats located in shallow waters and close to the shore. This is coherent with the fact that habitats provide more ecosystem services as people have easier access to them. In fact, accessibility is a crucial factor and it is typically included in the monetization of some services, especially for cultural services (Milcu et al., 2013). In the case of benthic habitats, access depends on depth, and generally, on the distance from the coastline. Therefore, deep-sea habitats and habitats located further away from the coast generally provide fewer ecosystem services and at lower degree due to limited access and lack of scientific knowledge for most of them. However, as exploration of the deep-sea improves with recent technological advances, access to such habitats (Ramirez-Llodra et al., 2011) will become less difficult, increasing the ecosystem services that they provide in the near future (Thurber et al., 2013).
According to our estimations, between 93 and 99% (depending on the sub-regions) of the benthic habitats of the European North Atlantic Ocean deliver food provision and biodiversity maintenance services; meanwhile, reproduction and nursery services are provided by 53% of the area. We consider that the assessment of this last service could be underestimated due the fact that knowledge on life-cycles is mainly limited to commercially important species. But it should be taken into account that other non-commercial species, with unknown life cycles, also play an important role in food webs. Thus, the reproduction and nursery grounds are likely to cover a wider area than the one resulting from this investigation. In contrast, areas providing other services are smaller or have much more limited spatial distribution. For example, the area corresponding to habitats that supply raw materials is very limited, and the highest proportion of this area only provides low or negligible resources. To explain this pattern, it should be considered that few raw materials are exploited at present, and that their exploitation is regulated by national and international regulations as the impacts associated with such exploitation may be high. However, there may be high potential for habitats to provide higher provision of this service as new raw materials are discovered and exploited (i.e., pharmaceutical).
Another interesting pattern is that observed for the provision of coastal protection as an ecosystem service. Liquete et al. (2013b) propose the use of 14 biophysical and socio-economic variables, from both terrestrial and marine datasets, in assessing coastal protection. In this investigation, we have only used benthic habitats, which may explain the relatively small area providing this service in the European North Atlantic Ocean. Furthermore, it is the limited distribution of biogenic structures and seagrass species within this ocean, considered as the main producer of this service, which may explain the limited provision to shallow and habitats located close to the coast (Christianen et al., 2013; Cullen-Unsworth and Unsworth, 2013).
The remaining ecosystem services are provided in limited areas. This pattern is possibly explained by the fact that some of the services analyzed are provided by very specific, spatially limited benthic habitats (i.e., photic zones), or in a larger scale, by pelagic habitats, i.e., air quality and climate regulation, water quality regulation and bioremediation, nutrient cycling, photosynthesis, chemosynthesis, and primary production. For example, some of them, such as climate regulation or carbon sequestration, are very important in coastal margin habitats, rather than in subtidal habitats (Beaumont et al., 2014).
Very small areas (11%) have been identified as providing cultural services (i.e., cognitive, leisure, recreation and cultural inspiration, feel good, and warm glow). This result is likely to be a consequence of the dependence of these services on accessibility. Therefore, even if the current provision of these services is limited to few habitats and areas (which are probably heavily used), it is likely that over time, as access increases to certain areas, these services will increase their value and distribution (Ghermandi et al., 2012). The broad-scale spatial patterns of the ecosystem services assessment resulting from this investigation could be considered consistent for different spatial scales of analysis if the approach is implemented elsewhere.
When considering the approach and results obtained through this research, authors would like to highlight that, rather than getting a valuation of the ecosystem services provided by the benthic habitats of the European North Atlantic Ocean, in our investigation a pragmatic approach for benthic services mapping is applied, based on the best available knowledge (De Groot et al., 2010). We recognize that the reliability of the results obtained in this investigation depend on, among other things, two major aspects: (i) the quality and reliability of benthic habitat maps used, which is an important but insufficiently assessed issue (Schägner et al., 2013); and (ii) the valuation of the ecosystem services carried out by scientific expert judgment (extracted from Salomidi et al., 2012), which could be biased toward the knowledge of the experts who published that research; meanwhile, social and economic aspects could be under-rated.
Some of the aforementioned weaknesses could be overcome: (i) enhancing the scientific knowledge of marine ecosystem functioning by finalizing detailed benthic habitat maps of the complete study area (especially, for the EEZ of France, Spain, and Portugal and deeper benthic habitats; Liquete et al., 2013a); and (ii) improving the assessment of services valuation, promoting the multidisciplinary discussions among environmental and social scientists and economists, to achieve consensus on benthic habitat services values.
A more adequate ecosystem services assessment and valuation could be carried out following the steps below:
(i) Definition of marine ecosystem services categories, based upon those already in use (see Liquete et al., 2013a). This definition should be carried out by experts from different scientific disciplines such as environmental, social (including stakeholders' participation) and economical sciences. In order to ensure consistency and allow for aggregation or comparison of results across the countries, there is a need for a common classification and to define which ecosystems and services will be considered as a priority by Member States (Maes et al., 2013).
(ii) Mapping services based on spatial distribution and patterns of different ecosystem components, processes and their relationships, including the need for future scenarios.
(iii) Biological and environmental valuation services by common procedures, undertaken by environmental, social, and economic scientists. Many ecosystem services cannot be directly quantified and thus, researchers must rely on indicators or proxy data for their quantification (Liquete et al., 2013a). Expert judgment may be a very important source of information, but the careful selection of a broad panel of experts may be required for ecosystem service assessment.
(iv) Economic valuation undertaken by economists and social scientists. No single ecological, social or economic methodology can capture the total value of these complex systems (Wilson et al., 2013). Assigning economic values to seascape features and habitat functions of marine ecosystems requires full understanding of the natural systems upon which they rely (Wilson et al., 2013). Probably, new economic valuation methods should be adopted (see Liquete et al., 2013a).
(v) Ecosystem services valuation assessment, which could assist in the determination of the ecological and environmental status under the Water Framework Directive (WFD) and MSFD, respectively (Katsanevakis et al., 2011; Vlachopoulou et al., 2014).
This process could result in the definition of proposals for management plans for different directives (e.g., MSFD, Habitats Directive) and instruments such as Marine Spatial Planning. Since oceans are facing an increasing number of human uses and threats, the inclusion of ecosystem services within management plans is growing in importance. In this context, the science of ecology must play a crucial role in bringing concepts like ecosystem goods and services to the forefront of the valuation debate (Bingham et al., 1995; Wilson and Carpenter, 1999; Liquete et al., 2013a).
The spatially explicit nature of the approach presented in this investigation is of special interest to support decision-making approaches and different aspects of the ecosystem-based marine spatial management sensu Katsanevakis et al. (2011). Among other things, the key to achieving a more comprehensive set of management mechanisms is, in the first instance, to know more about the ecosystem functions of benthic habitats (Martinez et al., 2011). In this way, there is a key goal of maintaining the delivery of ecosystem services, which must be based upon ecological principles that articulate the scientifically-recognized attributes of healthy functioning ecosystems (Foley et al., 2010), as required by the MSFD (Borja et al., 2013; Tett et al., 2013). This would require management measures for minimizing environmental impact and maximizing the socio-economic benefit of marine services (Salomidi et al., 2012); aspects that are basic to the Marine Spatial Planning.
This research has provided a first assessment of the benthic ecosystem services at Atlantic European scale, with the provision of ecosystem services maps and their general spatial distribution patterns. Related to the objectives of this research, the conclusions are: (i) benthic habitats provide a diverse set of ecosystem services, with the food provision and biodiversity maintenance services more extensively represented. In addition, other regulating and cultural services are provided in a more limited area; and (ii) the ecosystem services assessment categories are significantly related to the distance to the coast and with depth (higher near the coast and in shallow waters).
The results obtained in this investigation highlight the need for diverse, healthy and extensive benthic habitat areas to support the provision of important and valuable ecosystem services (i.e., food provisioning, disturbance prevention, nutrient cycling, etc.). Spatially explicit assessment and valuation of ecosystem services might be of crucial interest for future management measures adoption such as Marine Spatial Planning. The approach proposed here could be considered as a pragmatic way of getting a first snapshot of the distribution of ecosystem services based on the available information and we consider this as a promising starting point for further research and discussion on ecosystem services contribution of benthic habitats in Europe.
Conflict of Interest Statement
The authors declare that the research was conducted in the absence of any commercial or financial relationships that could be construed as a potential conflict of interest.
Acknowledgments
This manuscript is a result of the projects MeshAtlantic (Atlantic Area Transnational Cooperation Programme 2007–2013 of the European Regional Development Fund) (www.meshatlantic.eu) and DEVOTES (DEVelopment Of innovative Tools for understanding marine biodiversity and assessing good Environmental Status) funded by the European Union under the 7th Framework Program “The Ocean of Tomorrow” Theme (grant agreement no. 308392) (www.devotes-project.eu), and also supported by the Basque Water Agency (URA), through a Convention with AZTI-Tecnalia. The funders had no role in study design, data collection and analysis, decision to publish, or preparation of the manuscript. We wish to thank Udane Martinez and Iñigo Muxika (AZTI-Tecnalia) for their significant contributions to the data analysis. This paper is contribution number 676 from AZTI-Tecnalia (Marine Research Division).
Supplementary Material
The Supplementary Material for this article can be found online at: http://www.frontiersin.org/journal/10.3389/fmars.2014.00023/abstract
Figure S1. Depth distribution of the Exclusive Economic Zone (dark blue) and depth distribution of habitat-mapped areas (light blue), in the four subregions of the European North Atlantic Ocean; (A) Macaronesia; (B) Bay of Biscay and Iberian Coast; (C) Celtic Seas; and (D) Greater North Sea, including the Kattegat, the English Channel and Norway.
Figure S2. Spatial distribution of food provision services.
Figure S3. Spatial distribution of raw materials (biological, incl. biochemical, medicinal, and ornamental) services.
Figure S4. Spatial distribution of air quality and climate regulation services.
Figure S5. Spatial distribution of disturbance and natural hazard prevention services.
Figure S6. Spatial distribution of photosynthesis, chemosynthesis, and primary production services.
Figure S7. Spatial distribution of nutrient cycling services.
Figure S8. Spatial distribution of reproduction and nursery services.
Figure S9. Spatial distribution of maintenance of biodiversity services.
Figure S10. Spatial distribution of water quality regulation and bioremediation of waste services.
Figure S11. Spatial distribution of cognitive value services.
Figure S12. Spatial distribution of leisure, recreation, and cultural inspiration services.
Figure S13. Spatial distribution of feel good or warm glow services.
References
Armstrong, C. W., Foley, N. S., Tinch, R., and Van Den Hove, S. (2012). Services from the deep: steps towards valuation of deep sea goods and services. Ecosystem Services 2, 2–13. doi: 10.1016/j.ecoser.2012.07.001
Beaumont, N. J., Austen, M. C., Atkins, J. P., Burdon, D., Degraer, S., Dentinho, T. P., et al. (2007). Identification, definition and quantification of goods and services provided by marine biodiversity: implications for the ecosystem approach. Mar. Pollut. Bull. 54, 253–265. doi: 10.1016/j.marpolbul.2006.12.003
Beaumont, N. J., Jones, L., Garbutt, A., Hansom, J. D., and Toberman, M. (2014). The value of carbon sequestration and storage in coastal habitats. Estuar. Coast. Shelf Sci. 137, 32–40. doi: 10.1016/j.ecss.2013.11.022
Bingham, G., Bishop, R., Brody, M., Bromley, D., Clark, E., Cooper, W., et al. (1995). Issues in ecosystem valuation: improving information for decision making. Ecol. Econ. 14, 73–90. doi: 10.1016/0921-8009(95)00021-Z
Borja, A., Elliott, M., Andersen, J. H., Cardoso, A. C., Carstensen, J., Ferreira, J. G., et al. (2013). Good Environmental Status of marine ecosystems: What is it and how do we know when we have attained it? Mar. Pollut. Bull. 76, 16–27. doi: 10.1016/j.marpolbul.2013.08.042.
Cameron, A., and Askew, N. (eds.). (2011). EUSeaMap - Preparatory Action for Development and Assessment of a European Broad-Scale Seabed Habitat Map Final Report, 226. Available online at: http://jncc.gov.uk/euseamap
Cardoso, A. C., Cochrane, S., Doemer, H., Ferreira, J. G., Galgani, F., Hagebro, C., et al. (2010). Scientific support to the European Commission on the Marine Strategy Framework Directive. Management Group Report. EUR 24336 EN. Luxembourg: Joint Research Centre, Office for Official Publications of the European Communities.
Christianen, M. J. A., Van Belzen, J., Herman, P. M. J., Van Katwijk, M. M., Lamers, L. P. M., Van Leent, P. J. M., et al. (2013). Low-canopy seagrass beds still provide important coastal protection services. PLoS ONE 8:e62413. doi: 10.1371/journal.pone.0062413
Cices. (2013). Common International Classification of Ecosystem Services. Available online at: http://cices.eu/
Cimon-Morin, J., Darveau, M., and Poulin, M. (2013). Fostering synergies between ecosystem services and biodiversity in conservation planning: a review. Biol. Conserv. 166, 144–154. doi: 10.1016/j.biocon.2013.06.023
Costanza, R., D'Arge, R., De Groot, R., Farber, S., Grasso, M., Hannon, B., et al. (1997). The value of the world's ecosystem services and natural capital. Nature 387, 253–260. doi: 10.1038/387253a0
Costanza, R., De Groot, R., Sutton, P., Van Der Ploeg, S., Anderson, S. J., Kubiszewski, I., et al. (2014). Changes in the global value of ecosystem services. Global Environ. Change 26, 152–158. doi: 10.1016/j.gloenvcha.2014.04.002
Cullen-Unsworth, L., and Unsworth, R. (2013). Seagrass meadows, ecosystem services, and sustainability. Environment 55, 14–28. doi: 10.1080/00139157.2013.785864
Daily, G. C. (1997). Nature's Services: Societal Dependence on Natural Ecosystems.Washington, DC: Island Press. ISBN: 1-55963-475-8 (hbk), 1 55963 476 6 (soft cover).
Davies, C. E., and Moss, D. (2002). “EUNIS habitat classification,” in Final Report to the European Topic Centre on Nature Protection and Biodiversity, European Environment Agency, 125.
Davies, C. E., Moss, D., and Hill, M. O. (2004). “EUNIS habitat classification revised 2004,” in Report to European Environmental Agency and European Topic Centre on Nature Protection and Biodiversity, 307.
De Groot, R. S., Alkemade, R., Braat, L., Hein, L., and Willemen, L. (2010). Challenges in integrating the concept of ecosystem services and values in landscape planning, management and decision making. Ecol. Complexity 7, 260–272. doi: 10.1016/j.ecocom.2009.10.006
De Groot, R. S., Wilson, M. A., and Boumans, R. M. J. (2002). A typology for the classification, description and valuation of ecosystem functions, goods and services. Ecol. Econ. 41, 393–408. doi: 10.1016/S0921-8009(02)00089-7
Egoh, B., Drakou, E. G., Dunbar, M. B., Maes, J., and Willemen, L. (2012). Indicators for Mapping Ecosystem Services: a Review JRC Scientific and Policy Reports. Luxembourg. doi: 10.2788/41823
Farber, S. C., Costanza, R., and Wilson, M. A. (2002). Economic and ecological concepts for valuing ecosystem services. Ecol. Econ. 41, 375–392. doi: 10.1016/S0921-8009(02)00088-5
Foley, M. M., Halpern, B. S., Micheli, F., Armsby, M. H., Caldwell, M. R., Crain, C. M., et al. (2010). Guiding ecological principles for marine spatial planning. Marine Policy 34, 955–966. doi: 10.1016/j.marpol.2010.02.001
Galparsoro, I., Connor, D. W., Borja, A., Aish, A., Amorim, P., Bajjouk, T., et al. (2012). Using EUNIS habitat classification for benthic mapping in European seas: Present concerns and future needs. Mar. Pollut. Bull. 64, 2630–2638. doi: 10.1016/j.marpolbul.2012.10.010
Ghermandi, A., Nunes, P. A. L. D., Portela, R., Rao, N., and Teelucksingh, S.S. (2012). “Recreational, cultural and aesthetic services from estuarine and coastal ecosystems,” in Ecological Economics of Estuaries and Coasts, Vol. 12, Chapter 11, eds M. van den Belt and R. Costanza, Treatise on estuarine and coastal science, Series eds E. Wolanski and D. McLusky (Waltham, MA: Academic Press), 217–237.
Katsanevakis, S., Stelzenmüller, V., South, A., Sorensen, T. K., Jones, P. J. S., Kerr, S., et al. (2011). Ecosystem-based marine spatial management: review of concepts, policies, tools, and critical issues. Ocean Coast. Manag. 54, 807–820. doi: 10.1016/j.ocecoaman.2011.09.002
Korpinen, S., Meidinger, M., and Laamanen, M. (2013). Cumulative impacts on seabed habitats: an indicator for assessments of good environmental status. Mar. Pollut. Bull. 74, 311–319. doi: 10.1016/j.marpolbul.2013.06.036
Liquete, C., Piroddi, C., Drakou, E. G., Gurney, L., Katsanevakis, S., Charef, A., et al. (2013a). Current status and future prospects for the assessment of marine and coastal ecosystem services: a systematic review. PLoS ONE 8:e67737. doi: 10.1371/journal.pone.0067737
Liquete, C., Zulian, G., Delgado, I., Stips, A., and Maes, J. (2013b). Assessment of coastal protection as an ecosystem service in Europe. Ecol. Indic. 30, 205–217. doi: 10.1016/j.ecolind.2013.02.013
Maes, J., Teller, A., Erhard, M., Liquete, C., Braat, L., Berry, P., et al. (2013). Mapping and Assessment of Ecosystems and their Services. An Analytical Framework for Ecosystem Assessments under action 5 of the EU Biodiversity Strategy to 2020. Brussels: Publications office of the European Union. doi: 10.2779/12398
Martinez, M. L., Costanza, R., and Pérez-Maqueo, O. (2011). “12.07 - ecosystem services provided by estuarine and coastal ecosystems: storm protection as a service from estuarine and coastal ecosystems,” in Treatise on Estuarine and Coastal Science, eds W. Eric and M. Donald (Editors-in-Chief) (Waltham, MA: Academic Press), 129–146.
MEA. (2003). “Ecosystems and their services,” in Ecosystems and Human Well-being: a Framework for Assessment, Chapter 2, Millenium Ecosystem Assessment. Available online at: http://www.millenniumassessment.org/
Milcu, A. I., Hanspach, J., Abson, D., and Fischer, J. (2013). Cultural ecosystem services: a literature review and prospects for future research. Ecol. Soc. 18. doi: 10.5751/ES-05790-180344
Murillas-Maza, A., Virto, J., Gallastegui, M. C., González, P., and Fernández-Macho, J. (2011). The value of open ocean ecosystems: a case study for the Spanish exclusive economic zone. Nat. Resour. Forum 35, 122–133. doi: 10.1111/j.1477-8947.2011.01383.x
Pearce, D. (1998). Auditing the earth: the value of the world's ecosystem services and natural capital. Environment 40, 23–28. doi: 10.1080/00139159809605092
Potts, T., Burdon, D., Jackson, E., Atkins, J., Saunders, J., Hastings, E., et al. (2014). Do marine protected areas deliver flows of ecosystem services to support human welfare? Marine Policy 44, 139–148. doi: 10.1016/j.marpol.2013.08.011
Ramirez-Llodra, E., Tyler, P. A., Baker, M. C., Bergstad, O. A., Clark, M. R., Escobar, E., et al. (2011). Man and the last great wilderness: human impact on the deep sea. PLoS ONE 6:e22588. doi: 10.1371/journal.pone.0022588
Rice, J. (2010). “Science dimensions of an Ecosystem Approach to Management of Biotic Ocean Resources (SEAMBOR),” Marine Board-ESF Position Paper 14. (Ostend), 92.
Salomidi, M., Katsanevakis, S., Borja, A., Braeckman, U., Damalas, D., Galparsoro, I., et al. (2012). Assessment of goods and services, vulnerability, and conservation status of European seabed biotopes: a stepping stone towards ecosystem-based marine spatial management. Mediterr. Mar. Sci. 13, 49–88. doi: 10.12681/mms.23
Schägner, J. P., Brander, L., Maes, J., and Hartje, V. (2013). Mapping ecosystem services' values: current practice and future prospects. Ecosystem Services 4, 33–46. doi: 10.1016/j.ecoser.2013.02.003
Seitz, R. D., Wennhage, H., Bergström, U., Lipcius, R. N., and Ysebaert, T. (2014). Ecological value of coastal habitats for commercially and ecologically important species. ICES J. Mar. Sci. 71, 648–665. doi: 10.1093/icesjms/fst152
Ten Brink, P., Berghöfer, A., Schröter-Schlaack, C., Sukhdev, P., Vakrou, A., White, S., et al. (2009). “TEEB – The economics of ecosystems and biodiversity for national and international policy makers 2009,” in United Nations Environment Programme and the European Commission, 1–48.
Tett, P., Gowen, R. J., Painting, S. J., Elliott, M., Forster, R., Mills, D. K., et al. (2013). Framework for understanding marine ecosystem health. Mar. Ecol. Prog. Ser. 494, 1–27. doi: 10.3354/meps10539
Thurber, A. R., Sweetman, A. K., Narayanaswamy, B. E., Jones, D. O. B., Ingels, J., and Hansman, R. L. (2013). Ecosystem function and services provided by the deep sea. Biogeosci. Discuss. 10, 18193–18240. doi: 10.5194/bgd-10-18193-2013
Van Den Belt, M., and Costanza, R. (2012). “Ecological economics of estuaries and coasts,” in Treatise on Estuarine and Coastal Science, Vol. 12, eds E. Wolanski and D. S. McLusky (Waltham, MA: Academic Press), 525.
Vasquez, M., Chacón, D. M., Tempera, F., O'keeffe, E., Galparsoro, I., Alonso, J. L. S., et al. (in press). Mapping at broad scale seabed habitats of the North-East Atlantic using environmental data. J. Sea Res.
Vlachopoulou, M., Coughlin, D., Forrow, D., Kirk, S., Logan, P., and Voulvoulis, N. (2014). The potential of using the ecosystem approach in the implementation of the eu water framework directive. Sci. Tot. Environ. 470–471, 684–694. doi: 10.1016/j.scitotenv.2013.09.072
Keywords: ecosystem service, benthic habitat, Regional Seas, Marine Strategy Framework Directive, habitat classification
Citation: Galparsoro I, Borja A and Uyarra MC (2014) Mapping ecosystem services provided by benthic habitats in the European North Atlantic Ocean. Front. Mar. Sci. 1:23. doi: 10.3389/fmars.2014.00023
Received: 14 April 2014; Accepted: 29 June 2014;
Published online: 18 July 2014.
Edited by:
Michael Arthur St. John, Danish Technical University, DenmarkReviewed by:
Steve Whalan, Southern Cross University, AustraliaJose M. Riascos, Universidad de Antofagasta, Chile
Maria Salomidi, HCMR, Greece
Copyright © 2014 Galparsoro, Borja and Uyarra. This is an open-access article distributed under the terms of the Creative Commons Attribution License (CC BY). The use, distribution or reproduction in other forums is permitted, provided the original author(s) or licensor are credited and that the original publication in this journal is cited, in accordance with accepted academic practice. No use, distribution or reproduction is permitted which does not comply with these terms.
*Correspondence: Ibon Galparsoro, Marine Research Division, AZTI-Tecnalia, Herrera kaia portualdea z/g, Pasaia 20110, Spain e-mail:aWdhbHBhcnNvcm9AYXp0aS5lcw==