 John K. Pearman
 Mohsen M. El-Sherbiny2,3
 Xabier Irigoien
- 1Red Sea Research Centre, Biological and Environmental Sciences and Engineering Division, King Abdullah University of Science and Technology, Thuwal, Kingdom of Saudi Arabia
- 2Department of Marine Biology, Faculty of Marine Science, King Abdelaziz University, Jeddah, Kingdom of Saudi Arabia
- 3Marine Science Department, Faculty of Marine Science, Suez Canal University, Ismailia, Egypt
- 4Department of Ecology and Natural Resources, NEIKER-Tecnalia, Derio, Spain
Coral reefs are considered among the most diverse ecosystems on Earth, yet little is known about the diversity of plankton in the surrounding water column. Moreover, few studies have utilized genomic methods to investigate zooplankton diversity in any habitat. This study investigated the diversity of taxa by sampling 45 stations around three reef systems in the central/southern Red Sea. The diversity of metazoan plankton was investigated by targeting the 18S rRNA gene and clustering OTUs at 97% sequence similarity. A total of 754 and 854 metazoan OTUs were observed in the data set for the 1380F and 1389F primer sets respectively. The phylum Arthropoda dominated both primer sets accounting for ~60% of reads followed by Cnidaria (~20%). Only about 20% of OTUs were shared between all three reef systems and the relation between geographic distance and Jaccard Similarity measures was not significant. Cluster analysis showed that there was no distinct split between reefs and stations from different reefs clustered together both for metazoans as a whole and for the phyla Arthropoda, Cnidaria and Chordata separately. This suggests that distance may not be a determining factor in the taxonomic composition of stations.
Introduction
Coral reefs are known for harboring some of the highest biodiversity of benthic fauna and fish (Roberts et al., 2002). However, little is known about the planktonic diversity in the water column associated with coral reefs. This is particularly true in the Red Sea, a narrow, semi-confined sea that combines high temperature (ranging from 25 to 32°C), a deep basin (maximum depth of about 2300 m), oligotrophic conditions and high salinity (Raitsos et al., 2013). This combination of parameters makes the Red Sea an ideal case study for understanding how future climatic conditions may affect zooplankton communities. However, in the Red Sea zooplankton studies have been mainly limited to the northern regions and especially the Gulf of Aqaba (Echelman and Fishelson, 1990; Cornils et al., 2005; El-Sherbiny et al., 2007).
One of the challenges presented by subtropical communities is that of high biodiversity. Due to similarities in morphology the identification of zooplankton, following a traditional taxonomic approach, is complicated and time-consuming (Ji et al., 2013). For organisms, especially juveniles, to be classified, experts for each taxonomic group are required to undertake a taxonomically broad environmental study (McManus and Katz, 2009). This limits the spatial and temporal resolution of zooplankton community studies.
The advent of molecular techniques has enabled greater resolution to taxonomic identification, allowing single organisms to be compared using DNA sequencing. Other molecular techniques for this purpose include DNA fingerprinting such as restriction fragment length polymorphisms (RFLP), utilized for example by Lindeque et al. (1999) and Wang et al. (2006) to determine the identity of Calanus species at different developmental stages. Multiplexed species specific PCRs have also been used to investigate the distribution of Calanus (Hill et al., 2001) and bivalve larvae (Hare et al., 2000) in the North Atlantic. Extraction of bulk environmental DNA and the amplification of suitable genes, such as the nuclear small subunit (SSU) rRNA gene, has enabled whole communities to be studied. Originally this was via the construction of clone libraries and the subsequent Sanger sequencing of the inserts (Machida et al., 2009). This technique though was limited to relatively few sequences from which evaluations of species composition and richness were made. It was not until “high throughput” second generation sequencing technologies became readily available that large-scale environmental diversity studies could be undertaken without the need for cloning. This allowed for community DNA to be sequenced directly and to a greater depth of coverage than previous molecular techniques achieved. High throughput sequencing has been utilized in the marine community mainly to study the diversity of bacteria and archaea (Sogin et al., 2006; Brazelton et al., 2010), although marine eukaryotes have also been studied including microbial eukaryotes (Cheung et al., 2010; Logares et al., 2012), metazoa (Fonseca et al., 2010; Lindeque et al., 2013) and fish (Thomsen et al., 2012). It is a technique with the potential to greatly simplify comprehensive studies in areas of complex diversity and taxonomy such as coral reefs.
In this study, we examine the diversity and biogeography of zooplankton in three different reef systems in the central/southern Red Sea, using high-throughput sequencing of SSU rRNA amplicons. In particular we investigate the similarity in the taxonomic composition of the reefs and whether there is any trend between similarity in stations and geographic distance.
Methods
Sampling
Sampling was undertaken at three reef systems in the central/southern Red Sea. Samples were taken at 12 sites around Al-Lith (sampling 5th–7th March 2012), 10 sites at Al-Qunfadah (sampling 1st–3rd March 2012) and 23 sites at Farasan Islands (sampling 18th–27th February 2012) (Figure 1). Details of the sampling positions and dates are provided as supplementary information (Table S1). Plankton samples were obtained using a 0.5 m diameter net with a 150 μm mesh size. The net was towed for 15 min at 1.5 knots at a depth of 0.5 m. Samples were stored in 100% ethanol.
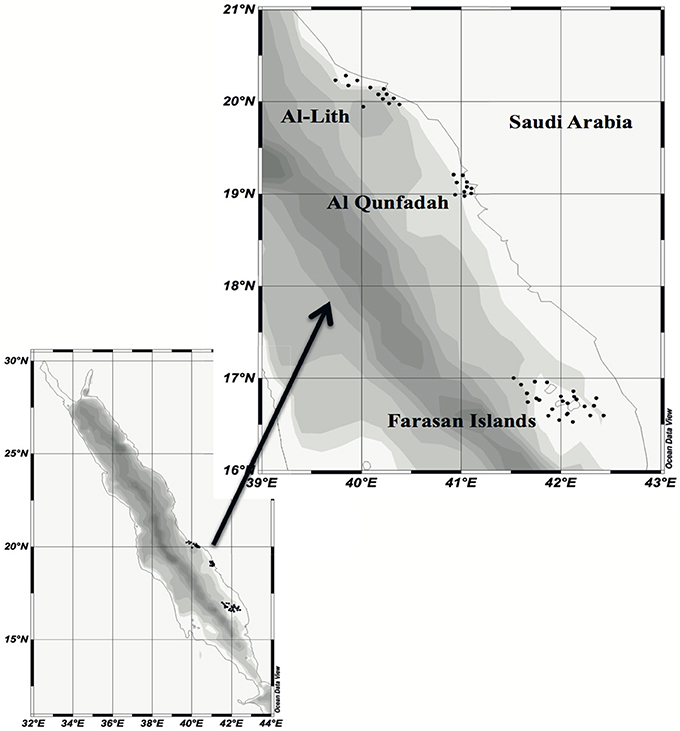
Figure 1. Map illustrating the sampling points around the three different reef systems in the southern/central Red Sea. Produced with Ocean Data View (ODV) (Schlitzer, 2014).
DNA Extraction
Ethanol stored samples were centrifuged at 21000 × g for 15 min. DNA was extracted based on the methods described in Bucklin (2000). Ethanol was removed and the pellet resuspended in ATL lysis buffer (Qiagen). The sample was transferred to a pestle and mortar and crushed until liquefied. The resulting cell suspension was incubated overnight at 55°C with 20 μl proteinase K (20 mg/mL) to ensure cell lysis. An equal volume of phenol:chloroform:isoamyl alcohol was added to the sample, mixed and centrifuged for 5 min. The aqueous layer was removed and a second round of phenol extraction undertaken. An equal volume of chloroform:isoamyl alcohol was added to the resulting aqueous layer. The samples were centrifuged at 4°C for 5 min. The aqueous layer was removed and DNA precipitated using 2.5 volumes ethanol and 0.1 volumes sodium acetate at −20°C. DNA was washed in 70% ethanol and then resuspended in MilliQ water.
PCR Amplification and Sequencing
Amplification of eukaryotic DNA was achieved using the general eukaryotic primer sets designed by Amaral-Zettler et al. (2009). Two forward primers 1380F and 1389F were used in combination with a single reverse primer, 1510R. All primers had a Roche 454 tag as well as a 10 bp barcode. PCRs were undertaken in duplicate on all samples using both primer sets. PCR amplicons were generated in duplicate 50 μl reaction volumes containing 2.5 U Taq polymerase (Invitrogen), 1X Taq reaction Buffer, 200 μM dNTPs (Invitrogen), 1.5 mM MgSO4, 0.05 mg Bovine Serum Albumin (BSA) and 0.2 μM of each primer. PCR conditions were adapted from Amaral-Zettler et al. (2009). An initial denaturation step of 3 min at 94°C was followed by 30 cycles of 94°C for 30 s, 57°C for 45 s and 72°C for 45 s. This is followed by a final extension at 72°C for 10 min. A negative no template control was run for each primer pair.
PCR products were checked using agarose (1%) gel electrophoresis. Duplicated PCR reactions were combined and the PCR band excised from the gel and purified using Qiagen's gel extraction kit. Purified samples were pooled according to barcode. Pools contained a combination of up to 15 samples with unique barcodes. The two forward primers were not multiplexed together. Multiplexed samples were analyzed for purity using an Agilent 2100 bioanalyzer machine. Emulsion PCR was undertaken using Roche's protocols. Library construction was achieved using the Roche XLR70 kit and each pooled sample was sequenced on a ¼ run on a Roche GS FLX system at the KAUST core facility. Raw reads have been submitted to the NCBI Sequence Read Archive (study acession SRP043020).
Bioinformatics
Flowgram data (SFF-files) for each sample was processed using modified settings (minflows = 200) for the RunTitaniumFast script of AmpliconNoise (Quince et al., 2011). Denoised and chimera-filtered sequences were concatenated, the reverse primer removed and the sequence truncated using QIIME (Caporaso et al., 2010a). Additional reference-based chimera filtering was also carried out using UCHIME (Edgar et al., 2011), with the SilvaRef111 used as a reference dataset. Sequences were subsequently aligned and hierarchically clustered (using maximum linkage) using the NDist and FCluster programs of AmpliconNoise, allowing operational taxonomic units (OTUs) to be defined at four different cutoffs (90, 95, 97, and 99% sequence identity), and picking the most abundant sequence from each OTU as a reference. OTUs appearing in only one sample (including singletons) were removed from further analysis as well as samples containing fewer than 2000 total reads.
In order to verify OTU clustering results, UPARSE (Edgar, 2013) was also used as an alternative clustering method for all amplicons resulting from the 1389 primer. All sequences were extracted from SFF flowgram data using the sfffile program of the GS Data Analysis Software package (Roche) to split datasets according to barcodes followed by sff_extract from the seq_crumbs package in order to convert data to FASTQ format. An inhouse script was thereafter used to crop primer sequences and remove all reads not matching the 1389F primer exactly and directly adjacent to the barcode. A final crop length of 150 nt, max errors <0.5 and 97% similarity cutoff and removal of singletons were used as parameters for UPARSE and the resulting OTU richness was compared to the corresponding value for AmpliconNoise 97% OTUs for each sample, as well as for each metazoan order-level taxon of the composite community.
Taxonomic assignment of resulting reference sequences was carried out using CREST with the SilvaMod database as reference (Lanzén et al., 2012) (default parameters, except for min. bitscore 100). Sequences with no hits against the SilvaMod database were reanalyzed against the Silva_111 database in QIIME and the taxonomy appropriately updated. In addition, the 10 most abundant OTUs were taxonomically classified using BLASTn (Altschul et al., 1990) alignment to the NCBI nucleotide database and manual inspection to avoid unclassified sequences.
All OTUs with undefined taxonomy or non-metazoan assignments were removed from further analysis. OTU tables were constructed in QIIME (make_otu_table.py) and used as a basis for further analysis. Unique and shared OTUs were identified from the OTU table and plotted using VennDiagram (Chen, 2013) in R (R development core team, 2014). The species accumulation curve (Ugland et al., 2003) was produced using the specaccum pipeline in vegan (Oksanen et al., 2013). Summaries of taxonomic composition were produced in QIIME (summarize_taxa_through_plots.py) and plotted in R. Jaccard Similarity indices were produced using PAST (Hammer et al., 2001). Reference sequences were aligned against the Silva_111 database using PyNAST (Caporaso et al., 2010b) and UCLUST pairwise alignment incorporated in the align_seqs.py script in QIIME. Weighted and unweighted UniFrac distance matrices (Lozupone and Knight, 2005) were produced in phyloseq (McMurdie and Holmes, 2013) based on the OTU table and phylogenetic tree constructed in QIIME. Non-metric multidimensional scaling (NMDS) plots were plotted in R using phyloseq and statistical analysis of the distance matrices was undertaken using Analysis of Similarity (ANOSIM) in vegan.
Results
Sequence Analysis
After filtering, denoising and chimera filtering over 893,000 reads from the primer 1389F and 608,000 from 1380F were retained (see Table 1). OTU clustering at 90, 95, 97, and 99% maximum linkage resulted in between 456 and 854 OTUs classified as metazoa for the composite dataset using 1389F and 355–795 for 1380F (Table 2).
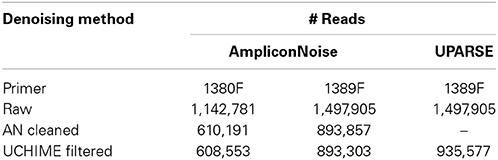
Table 1. Number of reads remaining after denoising and reference based chimera filtering.
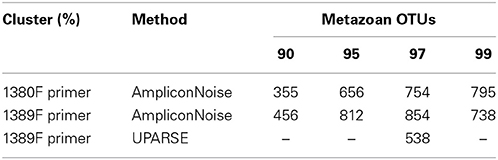
Table 2. Number of Metazoan OTUs present after removal of singletons and those OTUs only appearing in a single station.
To compare results with an alternative approach to denoising and OTU clustering, UPARSE (Edgar, 2013) complemented by UCHIME was also employed to the datasets resulting from primer 1389F, leaving a slightly higher number of sequence reads (Table 1), but a lower total metazoan OTU richness from the total community (538 at 97% similarity, see Table 2). As expected total OTU richness within most identified phyla (Table 3) and orders (Figure S1) was lower for UPARSE. However, the number of UPARSE OTUs appearing in each dataset was consistently higher than for the default analysis (see Figure S2).
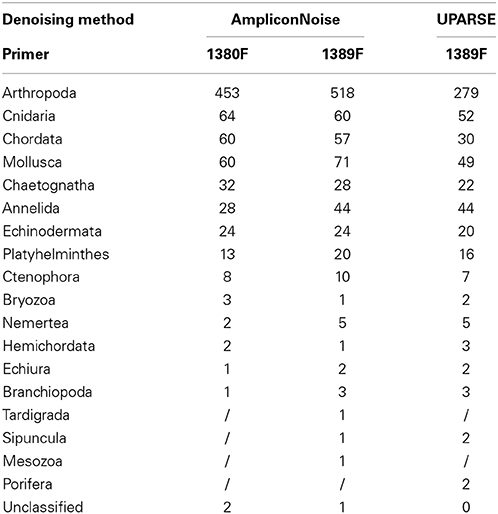
Table 3. Number of 97% OTUs attributed to each metazoan phyla.
The amplicon length utilized in this study was only about ~160 bp, with the consequence that small differences in sequence reads (due to either natural variation or sequencing error) could have significant effects on the clustering results. It was observed that there was a greater proportion of reads from the 99% clustering which were removed during the filtering of singletons (Table 2). This observation led to the adoption of the 97% clustering level to be utilized for further analysis.
General Taxonomic Composition
A rarefaction curve (with 95% confidence limits) was produced for the metazoan diversity in the central/southern Red Sea. Figure 2 shows the number of metazoan OTUs obtained using the 1389F primer plotted against the number of sampled stations (2 out of 45 stations were removed for the 1389F primer set because they did not meet the criteria of >2000 reads). From the analysis species richness started to plateau around 800 OTUs suggesting the sampling strategy was sufficient to reveal the majority of the planktonic metazoan diversity associated with coral reefs in this area. However, the diversity within each reef, especially Al Qunfadah and Al Lith were only partially sampled.
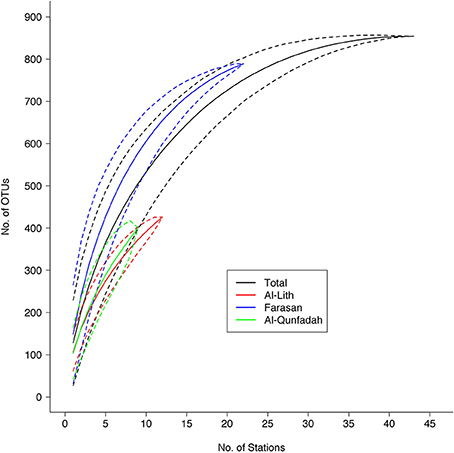
Figure 2. Rarefaction curve (with 95% confidence limits) showing the number of metazoan OTUs observed with increasing number of sampling stations for the 1389F primer set.
A comparison between the two primers sets was undertaken by merging all stations with >2000 reads in both primer sets. Stations, with fewer reads were excluded from this analysis. Multiple rarefactions (n = 100) at even depth (545,000 reads) for each primer resulted in an average of 753 and 848 metazoan OTUs for the 1380F and 1389F primers respectively. The phylum Arthropoda dominated the zooplankton communities associated with coral reefs in the central/southern Red Sea accounting for 60.2 and 61.1% for the 1380F and 1389F primer sets respectively (Table 3).
Although the two primers sets gave slightly different results in terms of diversity the overall trends were similar, thus the 1389F primer set (which had a higher overall alpha diversity and breadth of taxa) was used for the illustration of further diversity analysis.
Taxonomic Composition of Three Reef Systems in the Central/Southern Red Sea
Total reads for each reef were rarefied multiple times (n = 100) to an even depth of 59,000 reads in order to compare the dominant taxa in each system. For the rarefied reef data an average of 580 OTUs were observed. The Farasan reef was found to have the highest species richness with an average of 388 OTUs. Based on average values 24.2% of the OTUs were shared between the three reefs (Figure 3). The highest number of OTUs unique to a single reef were observed in the Farasan Islands (135) with the highest proportion of reads shared between two reefs occurring between the two most geographically distant reefs (Al-Lith and Farasan Islands).
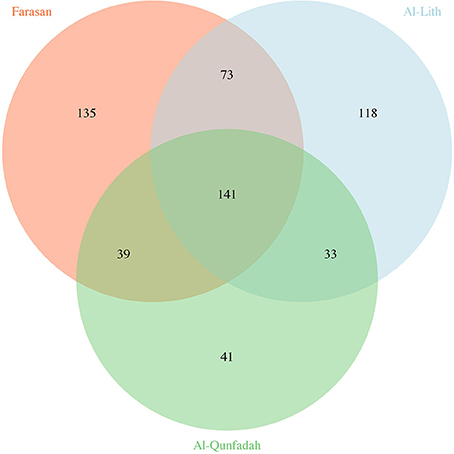
Figure 3. Number of unique and shared OTUs observed across the three reefs.
Arthropoda was the dominant phylum across all three reef systems (Figure 4), mainly composed of the class Maxillopoda although a small proportion (up to 9%) of reads were taxonomically linked to the class Malacostraca. The Maxillopoda reads were dominated by those relating to Calanoid copepods whilst, those in the Malacostraca were mainly classified in the Eumalacostraca. Significant contributions to the diversity of the reefs were also made from the phyla Chordata (class Appendicularia) and Cnidaria (class Siphonophora and Trachylina). Mollusca although having a high number of OTUs only accounted for a minor proportion (1%) of the reads (see Table S2 for the proportion of each metazoan class found in each reef).
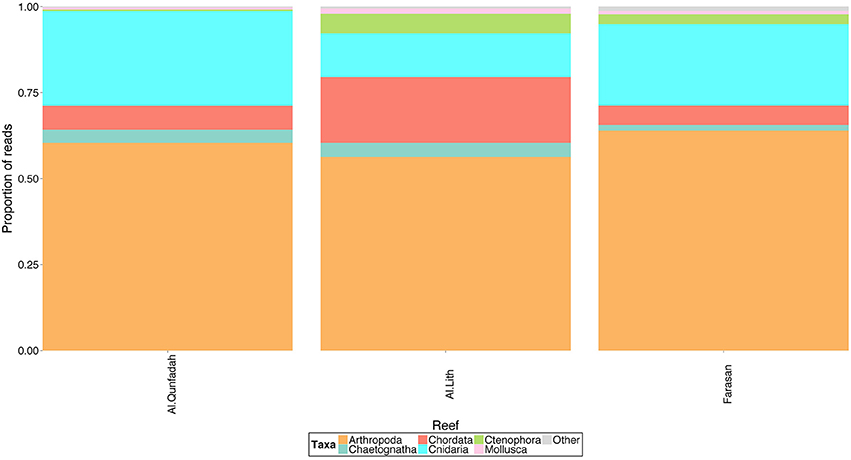
Figure 4. Proportion of reads assigned to metazoan taxa across 3 reef systems in the southern Red Sea.
To assess the taxonomic identification of the dominant OTUs in each reef the number of reads for each station were rarefied multiple times (n = 100) to 2000 (lowest number of reads in a station). OTUs were ranked by the number of combined reads of the stations present in each reef. For taxonomic classifications the top BLAST hit against the NCBI nr database (environmental sequences removed) was used. The Cnidarian Muggiaea sp. AGC-2001 was dominant in Al-Qunfadah and Farasan whilst it was second in Al-Alith. Calanus heglolandicus (OTU 677) was most abundant in Al-Lith with another calanoid (OTU706) being the second most abundant OTU in the other two reefs (Table 4).
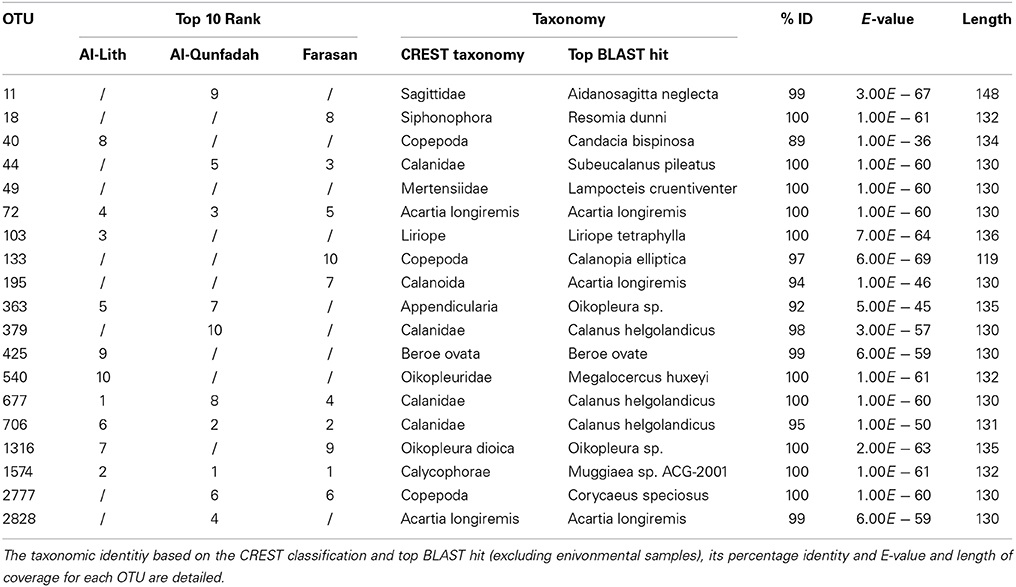
Table 4. Ranking of OTUs (only top 10 of each reef) based on abundance for the three reefs for the 1389F primer.
A total of 4 were shared between all the reefs. The taxonomic affiliations of these OTUs corresponded to Muggiaea sp. AGC-2001, Calanus helgolandicus and Acartia longiremis. The majority of OTUs present in the top 10 were related to copepods. There were also representatives of cnidarians, chaetognatha, ctenophores and tunicates.
Comparisons between the rarefied reef OTU tables showed high levels of similarity based on weighted Unifrac values (Table 5). The highest level of similarity was observed between Farasan and Al-Qunfadah.
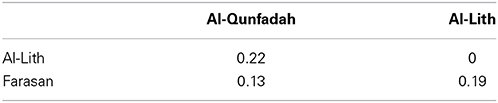
Table 5. Weighted Unifrac matrix between the 3 reefs for the 1389F primer.
Spatial Variability in the Taxonomic Composition of Individual Stations
To investigate the taxonomic composition of metazoans present in individual stations all stations for the 1389F primer set were rarefied multiple times (n = 100) to two thousand reads and the results averaged. Although this will not reveal the total diversity of metazoans in the reef system it allows a comparison of the dominant groups present in each station. Arthropoda were the major component of most stations accounting for between 3.2 and 99.4% (average 60.8%) of the reads. The number of Arthropoda OTUs ranged from 20 to 79, with an average of 38. Cnidaria accounted for the next highest proportion of reads with an average of 21.7% across all stations. The number of OTUs ranged from 0 in Farasan3 to 12 (Al-Lith6) with an average of 4. Cnidarians accounted for the majority of reads in stations Al-Lith10, Farasan9 and 14 and Al-Qunfadah2 and 3 (Figure 5). Chordata were the third phyla in terms of contribution to the number of reads. On average chordates accounted for 9.4% of reads in the stations however they dominated the metazoan community in station Al-Lith13 with 61.5% of the reads. On average there were 6 OTUs attributed to Chordata per station with the number ranging from 2 to 15.
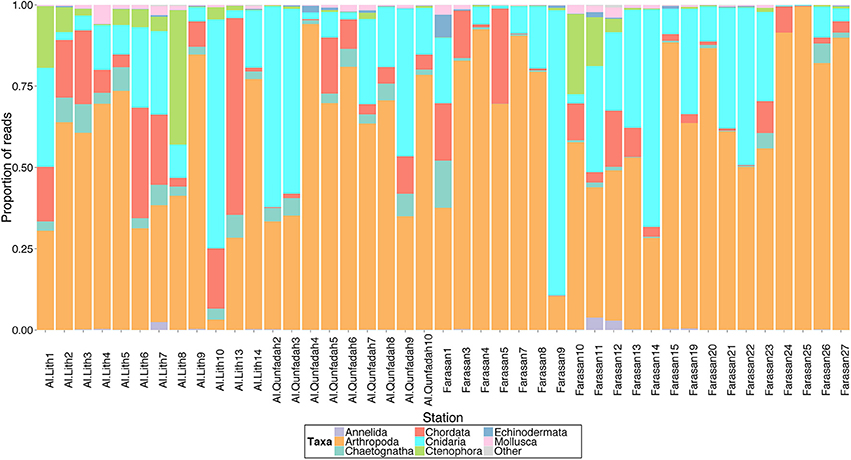
Figure 5. Proportion of reads assigned to metazoan taxa across all stations for the 1389F primer dataset in the central/southern Red Sea.
Jaccard Similarity measures were plotted against distance between the stations in order to test the effect of distance on similarity. Only a very slight negative trend was observed based on a Mantel test (R = 0.16, p < 0.01, 999 permutations) (Figure 6).
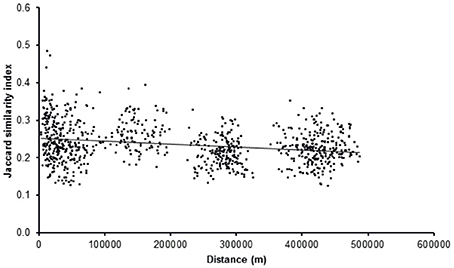
Figure 6. Diversity (Jaccard similariy) plotted against distance for all stations (R = 0.16, p < 0.01, 999 permutations).
Similarity between reef assemblages was investigated using weighted and unweighted UniFrac distance matrices at different taxonomic levels. For the weighted UniFrac results, there was no differentiation of stations based on reefs for Metazoa, Arthropoda and Cnidaria (Figures 7A,B,D). This was statistically confirmed using the ANOSIM routine (Table 6). However, Chordata did show a degree of separation based on the reef factor (R = 0.17, p = 0.014) with most of the Farasan samples clustering apart (Figure 7C). For the unweighted UniFrac distance matrices, there was a significant effect of the factor reef for Metazoa (R = 0.2828, p = 0.001) and Chordata (R = 0.1657, p = 0.003). NMDS plots suggest that in both cases the stations belonging to Farasan are clustering apart from Al-Lith and Al-Qunfadah (Figures 8A,D). For Arthropoda and Cnidaria there is no significant clustering according to the reef, which is in agreement with the ANOSIM results (Figures 8B,C; Table 6).
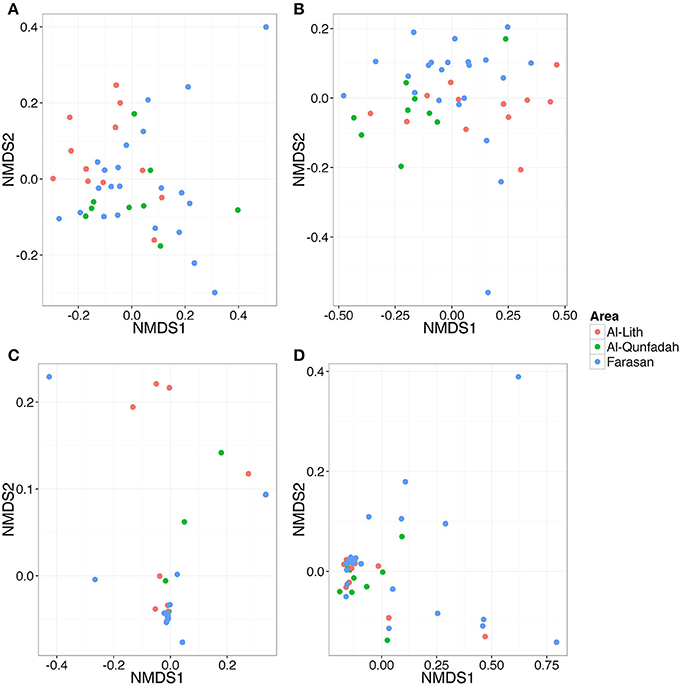
Figure 7. NMDS plot based on weighted UniFrac distance matrices for (A) Metazoa (B) Arthropoda (C) Cnidaria, and (D) Chordata.
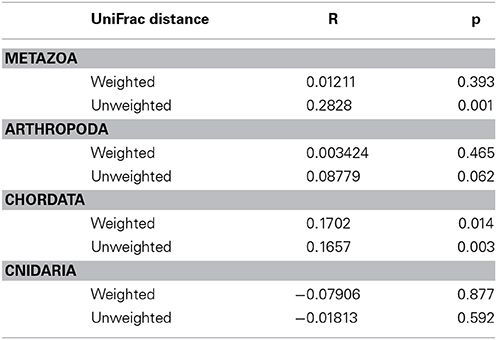
Table 6. R and p-values for ANOSIM results (permutations = 999) for weighted and unweighted Unifrac distance matrices at various taxonomic levels.
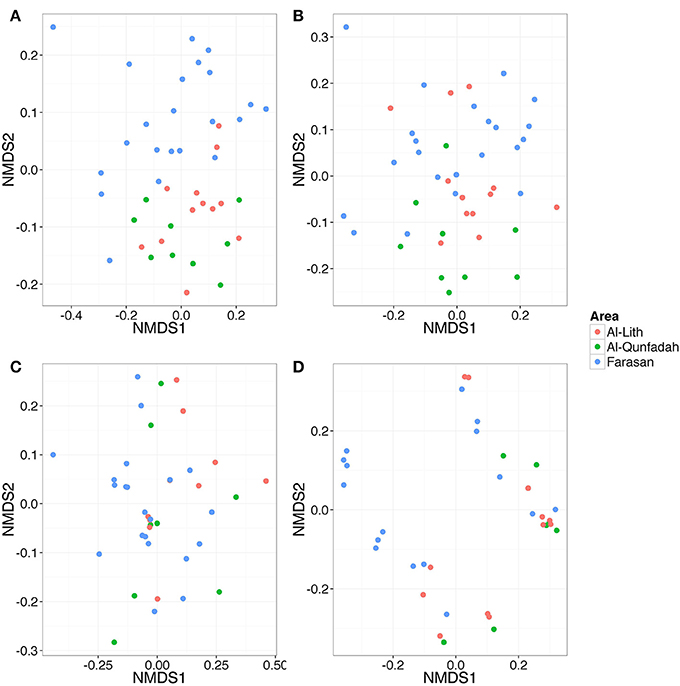
Figure 8. NMDS plot based on unweighted UniFrac distance matrices for (A) Metazoa (B) Arthropoda (C) Cnidaria, and (D) Chordata.
Discussion
To our knowledge this is the first study that utilizes high throughput amplicon sequencing to undertake a study of the metazoan community structure around coral reefs. Although there were differences between the two primer sets in terms of the number of OTUs detected within a taxa, both primer sets showed similar patterns. Arthropoda OTUs were the most abundant with considerable numbers of OTUs related to the phyla Chordata, Cnidaria and Mollusca. Although it was not possible to test this theory in the current study, it is reasonable to use the number of reads as an approximation of biomass, as supported by previous studies. For example, Lindeque et al. (2013) found that using conversion factors for decapod and bivalve larvae there was a suggestion that the number of sequence reads was more related to biomass than number of individuals. Further studies, using conversion factors for other taxa, especially copepods, would be required to make this relationship clearer.
Another problem to consider with genetic approaches is the present day limitations of genetic databases which contain limited reference sequences for planktonic organisms. Several OTUs with the largest number of reads had top BLAST hits against Calanus helgolandicus. This species, although abundant in the Atlantic and Mediterranean (Fleminger and Hulsemann, 1977), has not been recorded in the Red Sea. However, other species of the genus Calanus have been observed in the Red Sea (Khalil and Elrahman, 1997). Stereo microscope analysis of several replicate samples from this study, indicate that Calanus helgolandicus was not present in the samples. However, two other Calanoid species Canthocalanus pauper and Undinula vulgaris were abundant in the samples. The latter does not have a representative 18S rRNA gene sequence in the NCBI database. Similar findings in this study were also observed for the genus Acartia; A. amboinensis was morphologically identified in the samples but there is no 18S rRNA reference sequence in the NCBI database. As seen in Table 4, the more conservative classification method used in this study (CREST), appeared to successfully avoid false classifications to taxa where insufficient reference sequences were available, albeit at the cost of reduced resolution. The paucity of molecular data for zooplankton is not unique to the fauna of the Red Sea. Lindeque et al. (2013) found that using morphological analysis Oncaea dominated the Copepoda during January off the south west coast of the UK. However, due to a lack of molecular data in the databases any reads related to this genus were subsequently classified as unknown. Likewise for the genus Oithona where only half of the species known to persist in the local area had molecular data attributed to them. This problem is likely to increase in taxa, which have received less interest. In areas, such as the Red Sea, where the understanding of the diversity of zooplankton is extremely limited, there could be a high number of novel species which have yet to be described. Secondly the V9 region of the 18S rRNA gene may not be able to reliably produce classifications at the species level. Other genes, such as mt COI or 12S rRNA gene have been proposed to distinguish diversity at species level (Bucklin et al., 2011). Böttger Schnack and Machida (2011) suggested that the SSU 12S rRNA gene was more suitable for the identification of oncaeid copepods at species level than mt COI. This highlights one of the problems still to be addressed with the development of molecular databases. The creation of universal primer sets, especially for the shorter length required for high throughput sequencing technologies is often problematic and either a combination of primers (as used in the current study) or a multigene approach may be required to target as large a breadth of taxa as possible. With the growth of databases and an increasing knowledge of the diversity present in the marine system, the development of suitable primers will quickly improve. As an example, recently a set of primers targeting a 313 bp stretch of mt COI has been developed to target gut contents of fish (Leray et al., 2013).
Our approach revealed a relatively high diversity in terms of OTU richness, with over 800 metazoan OTUs encountered in total among all stations. However, this number cannot be directly compared with species diversity as determined by traditional taxonomic approaches and is expected to be affected substantially by experimental parameters such as primers, sequencing technology and algorithms used for de-noising and clustering of resulting sequence data. The two forward primers evaluated in this study (1380F and 1389F) resulted in highly comparable results, however. Similar OTU richness values were also observed for the alternative denoising and clustering method evaluated, namely UPARSE. Whereas AmpliconNoise uses a maximum likelihood model specific to pyrosequencing technology and PCR error rates in order to correct errors, UPARSE, applies a more simplistic heuristic algorithm. Both rely on the assumption that more abundant sequences are less likely to be erroneous, compared to highly similar sequences. Interestingly, UPARSE resulted in a lower total number of OTUs, although those were more evenly distributed across stations, giving each station a higher OTU richness compared to AmpliconNoise (Figure S1). This is likely a consequence of UPARSE operating on the total dataset whereas AmpliconNoise was run for each station dataset individually. However, it is challenging to determine which approach performed better, both in terms of merging sequence reads resulting from taxa with actual sequence differences and leaving OTUs containing exclusively erroneous sequence data. Most importantly, both methods agreed in terms of diversity trends between datasets and taxa, as well as similar total OTU richness.
High throughput amplicon sequencing can be considered a less mature method for environmental monitoring and diversity studies, lacking standardization that would allow studies by different groups to be compared. However, it is important to consider its efficiency. This study was undertaken for 45 different stations, which would be challenging and certainly more costly following a traditional taxonomic approach. This is especially true as molecular laboratory skills are more abundant than taxonomic expertise meaning fewer delays in the analysis pipeline and could move management away from biodiversity indicators toward a total biodiversity approach (Ji et al., 2013).
A high diversity of holoplanktonic organisms can be expected in warm subtropical systems (Rombouts et al., 2009), but the observed diversity also reflects the contribution of meroplanktonic larvae from the coral reef. As an example we found a high number of Mollusca OTUs (similar to that of Cnidaria and Chordata), whilst having a significantly lower proportion of reads throughout the study. Considering the number of reads as a proxy to biomass, the results suggest that the Mollusca OTUs belonged to larval stages. The variation in developmental stage and the corresponding differences in size could account for the variation between the number of OTUs and the number of reads. Larval and juvenile stages are often hard to identify based on morphology (McManus and Katz, 2009) and genetic approaches may contribute to improve our knowledge of larval dispersal at the species level.
The genetic approach was also sufficient to explore spatial patterns and differences between reefs. Although the decline in Jaccard similarity with distance was not significant we could explore the structure in the community composition related to the different reefs. Stations from different reefs clustered together suggesting that there is either a significant amount of transfer of planktonic species between reefs in this area or that there is a common pool of species supplying all of the reefs. The possibility of transport of planktonic organisms between the three reefs or from a common source is reinforced by circulation data from the Red Sea, which suggests the presence of a cyclonic eddy approximately covering the area between the Farasan Islands and Al-Lith (Raitsos et al., 2013). The higher OTU richness observed at Farasan, which could explain the significant clustering of reefs for the unweighted UniFrac results, could be due to an influx of species through the Gulf of Aden. This result is in agreement with previous findings for the Red Sea with peaks in diversity/biomass in southern stations in the Red Sea being reported for zooplankton (Schneider et al., 1994; Böttger Schnack, 1995).
This study highlights the ability of environmental genomics projects to undertake diversity studies on a large scale. There are current limits to the taxonomic information obtained from genetic approaches, especially from short read lengths. However, this will likely improve as the amount of genetic information for type species increases. Bucklin et al. (2011) found that only 3580 of 47217 described Arthropoda had a mt COI sequence deposited in databases and a similar paucity of coverage would be expected for the 18S rRNA gene utilized in this study. A definitive database matching up morphological data with sequence data will be required in order to take full advantage of the rapidly expanding sequencing capabilities (Jenner, 2004). As has occurred in microbial studies an OTU approach allows differences in genetic diversity to be studied without knowledge of taxonomy. Genetic approaches have the ability to compensate for the problems of frequently being unable to accurately assign taxonomic categories to larval and juvenile stages. The ability to identify larval and juvenile stages will help to expand our knowledge of connectivity in marine ecosystems.
Conflict of Interest Statement
The authors declare that the research was conducted in the absence of any commercial or financial relationships that could be construed as a potential conflict of interest.
Acknowledgment
The authors would like to thank the two anonymous reviewers for their constructive comments on the manuscript.
Supplementary Material
The Supplementary Material for this article can be found online at: http://www.frontiersin.org/journal/10.3389/fmars.2014.00027/abstract
Figure S1. Comparison of OTU richness per order for AmpliconNoise and UPARSE denoised datasets.
Figure S2. Comparison of OTU richness for between AmpliconNoise and UPARSE denoising techniques.
Table S1. Ancillary sampling data for each station.
Table S2. The number proportion of reads attributed to each taxa in each of the three reef systems.
References
Altschul, S. F., Gish, W., Miller, W., Myers, E. W., and Lipman, D. J. (1990). Basic local alignment search tool. J. Mol. Biol. 215, 403–410. doi: 10.1016/S0022-2836(05)80360-2
Amaral-Zettler, L. A., McCliment, E. A., Ducklow, H. W., and Huse, S. M. (2009). A method for studying protistan diversity using massively parallel sequencing of V9 hypervariable regions of small-subunit ribosomal RNA genes. PLoS ONE 4:e6372. doi: 10.1371/journal.pone.0006372
Böttger Schnack, R. (1995). Summer distribution of micro- and small mesozooplankton in the Red Sea and Gulf of Aden, with special reference to non-calanoid copepods. Mar. Ecol. Prog. Ser. 118, 81–102. doi: 10.3354/meps118081
Böttger Schnack, R., and Machida, R. J. (2011). Comparison of morphological and molecular traits for species identification and taxonomic grouping of oncaeid copepods. Hydrobiologia 666, 111–125. doi: 10.1007/s10750-010-0094-1
Brazelton, W. J., Ludwig, K. A., Sogin, M. L., Andreishcheva, E. N., Kelley, D. S., Shen, C.-C., et al. (2010). Archaea and bacteria with surprising microdiversity show shifts in dominance over 1,000-year time scales in hydrothermal chimneys. Proc. Nat. Acad. Sci. U.S.A. 107, 1612–1617. doi: 10.1073/pnas.0905369107
Bucklin, A. (2000). “Methods for population genetic analysis of zooplankton,” in The ICES Zooplankton Methodology Manual. International Council for the Exploration of the Sea, Chapter 11 (London: Academic Press), 533–570.
Bucklin, A., Steinke, D., and Blanco-Bercial, L. (2011). DNA barcoding of marine metazoa. Ann. Rev. Mar. Sci. 3, 471–508. doi: 10.1146/annurev-marine-120308-080950
Caporaso, J. G., Bittinger, K., Bushman, F. D., DeSantis, T. Z., Andersen, G. L., and Knight, R. (2010b). PyNAST: a flexible tool for aligning sequences to a template alignment. Bioinformatics 26, 266–267 doi: 10.1093/bioinformatics/btp636
Caporaso, J. G., Kuczynski, J., Stombaugh, J., Bittinger, K., Bushman, F. D., Costello, E. K., et al. (2010a). QIIME allows analysis of highthroughput community sequencing data. Nat. Methods 7, 335–336. doi: 10.1038/nmeth.f.303
Chen, H. (2013). VennDiagram: Generate High-Resolution Venn and Euler plots. R package version 1.6.5. Available online at: http://CRAN.R-project.org/package=VennDiagram
Cheung, M. K., Au, C. H., Chu, K. H., Kwan, H. S., and Wong, C. K. (2010). Composition and genetic diversity of picoeukaryotes in subtropical coastal waters as revealed by 454 pyrosequencing. ISME J. 4, 1053–1059. doi: 10.1038/ismej.2010.26
Cornils, A., Schnack-Schiel, S. B., Hagen, W., Dowidar, M., Stambler, N., Plahn, O., et al. (2005). Spatial and temporal distribution of mesozooplankton in the Gulf of Aqaba and the northern Red Sea in February/March 1999. J. Plankton Res. 27, 505–518. doi: 10.1093/plankt/fbi023
Echelman, T., and Fishelson, L. (1990). Surface zooplankton dynamics and community structure in the Gulf of Aqaba (Eliat), Red Sea. Mar. Biol. 107, 179–190. doi: 10.1007/BF01313255
Edgar, R. C. (2013). UPARSE: highly accurate OTU sequences from microbial amplicon reads. Nat. Methods 10, 996–998. doi: 10.1038/nmeth.2604
Edgar, R. C., Haas, B. J., Clemente, J. C., Quince, C., and Knight, R. (2011). UCHIME improves sensitivity and speed of chimera detection. Bioinformatics 27, 2194–2200. doi: 10.1093/bioinformatics/btr381
El-Sherbiny, M. M., Hanafy, M. H., and Aamer, M. A. (2007). Monthly variations in abundance and species composition of the epipelagic zooplankton off Sharm El-Sheik, Northern Red Sea. Res. J. Environ. Sci. 1, 200–210. doi: 10.3923/rjes.2007.200.210
Fleminger, A., and Hulsemann, K. (1977). Geographical range and taxonomic divergence in North-Atlantic Calanus (Calanus helgolandicus, Calanus Finmarchicus and Calanus Glacialis). Mar. Biol. 40, 233–248. doi: 10.1007/BF00390879
Fonseca, V. G., Carvalho, G. R., Sung, W., Johnson, H. F., Power, D. M., Neill, S. P., et al. (2010). Second-generation environmental sequencing unmasks marine metazoan biodiversity. Nat. Commun. 1:98. doi: 10.1038/ncomms1095
Hammer, Ø., Harper, D. A. T., and Ryan, P. D. (2001). PAST: paleontological statistics software package for education and data analysis. Palaeontologia Electronica 4:9.
Hare, M. P., Palumbi, S. R., and Butman, C. A. (2000). Single-step species identification of bivalve larvae using multiplex polymerase chain reaction. Mar. Biol. 137, 953–961. doi: 10.1007/s002270000402
Hill, R. S., Allen, L. D., and Bucklin, A. (2001). Multiplexed species-specific PCR protocol to discriminate four N. Atlantic Calanus species, with an mtCOI gene tree for ten Calanus species. Mar. Biol. 139, 279–287. doi: 10.1007/s002270100548
Jenner, R. A. (2004). Accepting partnership by submission? Morphological phylogenetics in a molecular millennium. Syst. Biol. 53, 333–342. doi: 10.1080/10635150490423962
Ji, Y., Ashton, L., Pedley, S. M., Edwards, D. P., Tang, Y., Nakamura, A., et al. (2013). Reliable, verifiable and efficient monitoring of biodiversity via metabarcoding. Ecol. Lett. 16, 1245–1257. doi: 10.1111/ele.12162
Khalil, M. T., and Elrahman, N. S. A. (1997). Abundance and diversity of surface zooplankton in the Gulf of Aqaba, Red Sea, Egypt. J. Plankton Res. 19, 927–936. doi: 10.1093/plankt/19.7.927
Lanzén, A., Jorgensen, S. L., Huson, D. H., Gorfer, M., Grindhaug, S. H., Jonassen, I., et al. (2012). CREST—classification resources for environmental sequence tags. PLoS ONE 7:e49334. doi: 10.1371/journal.pone.0049334
Leray, M., Yang, J. Y., Meyer, C. P., Mills, S. C., Agudelo, N., Ranwez, V., et al. (2013). A new versatile primer set targeting a short fragment of the mitochondrial COI region for metabarcoding metazoan diversity: application for characterizing coral reef fish gut contents. Front. Zool. 10:34 doi: 10.1186/1742-9994-10-34
Lindeque, P. K., Harris, R. P., Jones, M. B., and Smerdon, G. R. (1999). Simple molecular method to distinguish the identity of Calanus species (Copepoda: Calanoida) at any developmental stage. Mar. Biol. 133, 91–96. doi: 10.1007/s002270050446
Lindeque, P. K., Parry, H. E., Harmer, R. A., Somerfield, P. J., and Atkinson, A. (2013). Next generation sequencing reveals the hidden diversity of zooplankton assemblages. PLoS ONE 8:e81327. doi: 10.1371/journal.pone.0081327
Logares, R., Audic, S., Santini, S., Pernice, M. C., De Vargas, C., and Massana, R. (2012). Diversity patterns and activity of uncultured marine heterotrophic flagellates unveiled with pyrosequencing. ISME J. 6, 1823–1833. doi: 10.1038/ismej.2012.36
Lozupone, C., and Knight, R. (2005). UniFrac: a new phylogenetic method for comparing microbial communities. Appl. Environ. Microbiol. 71, 8228–8235. doi: 10.1128/AEM.71.12.8228-8235.2005
Machida, R. J., Hashiguchi, Y., Nishida, M., and Nishida, S. (2009). Zooplankton diversity analysis through single-gene sequencing of a community sample. BMC Genomics 10, 438–438. doi: 10.1186/1471-2164-10-438
McManus, G. B., and Katz, L. A. (2009). Molecular and morphological methods for identifying plankton: what makes a successful marriage? J. Plankton Res. 31, 1119–1129. doi: 10.1093/plankt/fbp061
McMurdie, P. J., and Holmes, S. (2013). phyloseq: an R package for reproducilble interactive analysis and graphics of microbiome census data. PLoS ONE 8:e61217. doi: 10.1371/journal.pone.0061217
Oksanen, J. F., Blanchet, F. G., Kindt, R., Legendre, R., Minchin, P. R., O-Hara, R. B, et al. (2013). Vegan: Community Ecology Package. R package version 2.0.10. Available online at: http://CRAN.R-project.org/package=vegan.
Quince, C., Lanzén, A., Davenport, R. J., and Turnbaugh, P. J. (2011). Removing noise from pyrosequenced amplicons. BMC Bioinformatics 12:38. doi: 10.1186/1471-2105-12-38
R development core team. (2014). R: A Language and Environment for Statistical Computing. R foundation for statistical computing, Vienna. Available online at: http://www.R-project.org.
Raitsos, D. E., Pradhan, Y., Brewin, R. J. W., Stenchikov, G., and Hoteit, I. (2013). Remote sensing the phytoplankton seasonal succession of the Red Sea. PLoS ONE 8:e64909. doi: 10.1371/journal.pone.0064909
Roberts, C. M., McClean, C. J., Veron, J. E. N., Hawkins, J. P., Allen, G. R., McAllister, D. E., et al. (2002). Marine biodiversity hotspots and conservation priorities for tropical reefs. Science 295, 1280–1284. doi: 10.1126/science.1067728
Rombouts, I., Beaugrand, G., Ibanez, F., Gasparini, S., Chiba, S., and Legendre, L. (2009). Global latitudinal variations in marine copepod diversity and environmental factors. Proc. R Soc. B Biol. Sci. 276, 3053–3062. doi: 10.1098/rspb.2009.0742
Schlitzer, R. (2014). Ocean Data View. Available online at: http://odv.awi.de
Schneider, G., Lenz, J., and Rolke, M. (1994). Zooplankton standing stock and community size structure within the epipelagic zone: a comparison between the central Red Sea and the Gulf of Aden. Mar. Biol. 119, 191–198. doi: 10.1007/BF00349556
Sogin, M. L., Morrison, H. G., Huber, J. A., Mark Welch, D., Huse, S. M., Neal, P. R., et al. (2006). Microbial diversity in the deep sea and the underexplored “rare biosphere.” Proc. Natl. Acad. Sci. U.S.A. 103, 12115–12120. doi: 10.1073/pnas.0605127103
Thomsen, P. F., Kielgast, J., Iversen, L. L., Moller, P. R., Rasmussen, M., and Willerslev, E. (2012). Detection of a diverse marine fish fauna using environmental DNA from seawater samples. PLoS ONE 7:e41732. doi: 10.1371/journal.pone.0041732
Ugland, K. I., Gray, J. S., and Ellingsen, K. E. (2003). The species-accumulation curve and estimation of species richness. J. Anim. Ecol. 72, 888–897. doi: 10.1046/j.1365-2656.2003.00748.x
Wang, S., Bao, Z. M., Zhang, L. L., Li, N., Zhan, A. B., Guo, W. B., et al. (2006). A new strategy for species identification of planktonic larvae: PCR-RFLP analysis of the internal transcribed spacer region of ribosomal DNA detected by agarose gel electrophoresis or DHPLC. J. Plankton Res. 28, 375–384. doi: 10.1093/plankt/fbi122
Keywords: amplicon sequencing, zooplankton, arthropoda, cnidaria, Red Sea, molecular diversity
Citation: Pearman JK, El-Sherbiny MM, Lanzén A, Al-Aidaroos AM and Irigoien X (2014) Zooplankton diversity across three Red Sea reefs using pyrosequencing. Front. Mar. Sci. 1:27. doi: 10.3389/fmars.2014.00027
Received: 09 June 2014; Accepted: 11 July 2014;
Published online: 30 July 2014.
Edited by:
Fengping Wang, Shanghai Jiao Tong University, ChinaReviewed by:
Carmelo Fruciano, University of Konstanz, GermanyEmre Keskin, Ankara University, Turkey
Copyright © 2014 Pearman, El-Sherbiny, Lanzén, Al-Aidaroos and Irigoien. This is an open-access article distributed under the terms of the Creative Commons Attribution License (CC BY). The use, distribution or reproduction in other forums is permitted, provided the original author(s) or licensor are credited and that the original publication in this journal is cited, in accordance with accepted academic practice. No use, distribution or reproduction is permitted which does not comply with these terms.
*Correspondence: Xabier Irigoien, Red Sea Research Centre, King Abdullah University of Science and Technology, Building 2, Level 3, Thuwal 23955-6900, Kingdom of Saudi Arabia e-mail:eGFiaWVyLmlyaWdveWVuQGthdXN0LmVkdS5zYQ==