 Shun-Chung Yang
 Der-Chuen Lee
 Tung-Yuan Ho
 Liang-Saw Wen4
- 1Institute of Earth Sciences, Academia Sinica, Taipei, Taiwan
- 2Department of Geosciences, National Taiwan University, Taipei, Taiwan
- 3Research Center for Environmental Changes, Academia Sinica, Taipei, Taiwan
- 4Institute of Oceanography, National Taiwan University, Taipei, Taiwan
The dissolved concentration and isotopic compositions of cadmium (Cd) in the seawater of the West Philippine Sea (WPS) were determined. In general, Cd isotopic composition in the water column decreased with depth, with ε114/110Cd (ε114/110Cd = [(114Cd/110Cd)sample/(114Cd/110Cd)NIST3108 − 1] × 104) ranging from +7.2 to +10.1 in the top 60 m, from +4.8 to +5.1 between 100 and 150 m, peaking at +8.2 at 200 m, decreasing from +4.5 to +3.3 from 400 to 1000 m, and remaining constant at +3.0 from 1000 m and deeper. Different to a Rayleigh fractionation model, the isotopic composition and log scale concentrations of Cd do not exhibit a linear relationship. However, from the deep water to thermocline, the variations in Cd concentration and ε114/110Cd are relevant to the variations of temperature and salinity, indicating that water mixing is the dominant processes determining the concentration and isotopic composition in the interval. At 200 m where North Pacific Tropic Water dominates the water mass, the elevated ε114/110Cd could be linked to the composition in the upper portions of the water mass. In the top 150 m, the ε114/110Cd varies similarly to the phytoplankton community structures, implying that Cd uptake by various phytoplankton species may be associated with the isotopic variation. However, the effects of atmospheric inputs to the ε114/110Cd in the surface water cannot be excluded. A box model calculation is used to constrain the contributions of various processes to the Cd isotopes of surface water, and the results indicate that the Cd concentration and isotopic composition in most of the water body of the region are controlled by physical mixing, while the effects of biological fractionation and atmospheric inputs are limited in the euphotic zone.
Introduction
Cadmium (Cd) is one of the most studied trace metals in the oceans. With a vertical profile that resembles the major nutrients in the oceans, the marine distribution of dissolved Cd reflects active uptake by phytoplankton and subsequent decomposition of particulate matter (Boyle et al., 1976; Bruland et al., 1978). Laterally, dissolved Cd concentration in global deep waters is proportional to the water mass age, which is believed to be the consequence of the accumulation of remineralized Cd from sinking particles through oceanic thermohaline circulation (Bruland and Franks, 1983). In addition, the distributions of dissolved Cd are very similar to the distributions of dissolved phosphate. Consequently, Cd is widely applied as a proxy for phosphate in paleo Cd/Ca records, and the studies on its cycling processes are mostly focused on biological issues (Boyle, 1988; Elderfield and Rickaby, 2000). Other processes, such as physical advection or mixing of water masses, and atmospheric inputs, may also play important roles to the cycling of Cd in the oceans, but are relatively less understood.
Recent studies on Cd isotopic fractionation in seawater have given new insight into the relative contributions of the biological, physical, and atmospheric processes on regulating the cycling of Cd in oceans. The isotopic composition of dissolved Cd in deep waters is fairly consistent throughout the major oceans, regardless of dissolved Cd concentrations varying by a factor of four from Atlantic to Northern Pacific deep waters (Ripperger et al., 2007; Yang et al., 2012; Xue et al., 2013; Abouchami et al., 2014). In contrast to the consistent Cd isotope ratios in the deep waters, Cd in the surface waters exhibit relatively diverse and overall heavier isotopic compositions. The vertical isotopic fractionation is generally regarded as the result of preferential uptake of light Cd isotopes by phytoplankton (Ripperger et al., 2007; Xue et al., 2012, 2013; Abouchami et al., 2014). In the Southern Ocean, Cd isotope ratios exhibit a linear relationship with the log of Cd concentrations (Abouchami et al., 2011, 2014; Xue et al., 2013), and the relationship is thought to follow a Rayleigh fractionation model, assuming that phytoplankton assimilate Cd with comparable isotopic fractionation factors in an approximately closed system (Abouchami et al., 2011, 2014; Xue et al., 2013). However, in a study of Cd isotope ratios in the surface water off-shore of New Zealand, Gault-Ringold et al. (2012) did not observe the same Rayleigh fractionation pattern. They suggested that the fractionation factor for Cd during the phytoplankton uptake may be variable, depending on the availability of Cd and the uptake kinetics. In addition, dissolved Cd isotopic composition of surface waters can also be affected by atmospheric inputs, particularly in the regional seas where fluxes of anthropogenic aerosols are exceptionally high (Yang et al., 2012).
The variations of Cd isotopic composition in thermocline and deep waters are relatively small (≤2 ε), but are still resolvable (Yang et al., 2012; Abouchami et al., 2014). The lighter ε114/110Cd in the deep waters and slightly elevated ε114/110Cd in the thermocline were thought to be the accumulation of remineralized light Cd from sinking particles in the oceans (Ripperger et al., 2007). However, recent studies have shown that Cd concentration and isotopic composition in thermocline and deep waters vary conservatively, showing good relationships with temperature and salinity (Yang et al., 2012; Abouchami et al., 2014; Xie et al., 2014). This indicates that the advection and mixing of water masses will dominate over the distribution and isotopic variation of Cd in thermocline and deep waters (Yang et al., 2012; Abouchami et al., 2014; Xie et al., 2014).
Due to the intense upwelling in the Southern Ocean, physical properties of the water columns are relatively homogenous, and major nutrients are relatively enriched in surface waters. Consequently, many efforts have focused on studying the Cd isotope ratios in this region to investigate the contributions of biological and physical processes to the cycling of Cd (Abouchami et al., 2011, 2014; Gault-Ringold et al., 2012; Xue et al., 2013). In comparison to the Southern Ocean, fewer Cd isotopic datasets are available for the seawater of the Pacific Ocean. As a result, detailed information regarding how and what controls the cycling of Cd in the seawater among different regions of the Pacific Ocean is still limited. Particularly in the northwest Pacific where water body is well-stratified, and the upper ocean is oligotrophic, the cycling of Cd is most likely different from that of the Southern Ocean. In this study, seawater samples from a high-resolution water column profile were collected in the West Philippine Sea (WPS), and the isotopic and concentration of dissolved Cd have been analyzed to investigate how the dissolved concentrations and isotopic compositions of Cd are regulated, with a particular emphasis on the surface water and the thermocline.
Materials and Methods
Sampling
Seawater samples were collected from a station in the WPS (st. 16; 22°00′N, 125°00′E; Figure 1) in March 22–23, 2009, during the 892th cruises of R/V Ocean Researcher 1. Detailed information regarding the sampling can be found in Wen et al. (2006). In brief, all of the seawater samples were collected with acid pre-cleaned Teflon-coated Go-Flo samplers (General Oceanics) on March 22, 2009, at the WPS. The seawater was filtered in situ through inline 0.22 μm acid-cleaned POLYCAP cartridge filters (Whatman), and, subsequently, transferred to acid-washed polyethylene bottles and acidified to pH 1 with ultrapure HCl (Seastar) on March 30, 2009.
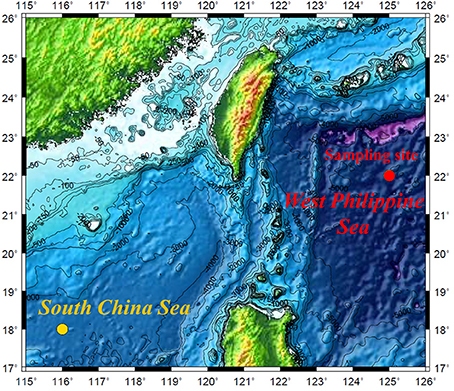
Figure 1. Location of the sampling site in the West Philippine Sea. The study site of Yang et al. (2012) in the South China Sea is also presented.
The WPS is located at the western side of the Philippine Basin with a total area of ca 2,700,000 km2 and bottom depths around 5.6–6 km. The water body of the WPS is well-stratified, and is composed of, from top to down, the surface water, the North Pacific Tropical Water (NPTW), the North Pacific Intermediate Water (NPIW), and the Pacific Deep Water (PDW) (Nitani, 1972). The NPTW is usually identified by its relatively high salinity, and is thought to form at the surface in the central North Pacific along the Tropic of Cancer, where evaporation is far higher than precipitation (Suga et al., 2000). Subsequently, the NPTW flows westwards and merges with the North Equatorial Current, forming a subsurface salinity maximum in the WPS (Li and Wang, 2012). In contrast, the NPIW is identified by its distinct salinity minimum. The NPIW is supposed to originate from the low-salinity water in the subpolar gyre, including Okhotsk Sea and Gulf of Alaska. The water extends downward and southward to the water depths between 400 and 900 m in Western Pacific (You et al., 2000). Below the NPIW lies the nearly homogeneous PDW, between 2000 and 5000 m. The origin of PDW is from the upwelling of Circumpolar Water. As the oldest deep water in the world ocean, PDW is fairly well-mixed (Mantyla and Reid, 1983).
At the sampling site, the surface water, ≤80 m, was relatively well-mixed with uniform salinity. Salinity increased while temperature decreased sharply from depth ≥80 m, until the salinity reached its maximum at 190 m, resulting in a strong halocline and thermocline. Both salinity and temperature decreased sharply with depth from 190 m and downward till the salinity minimum at 650 m. At greater depth, salinity increased while temperature continued to decrease gradually with depth until 3500 m and remained constant between 3500 and 5000 m (Figures 2A,B). The T-S diagram of the seawater profile shows four distinct linear line segments from a salinity and temperature of 34.62 and 24.5°C at the surface, to 34.62 and 23.2°C at 80 m, to 34.83 and 20.3°C at 190 m, to 34.22 and 6.7°C at 650 m, and to 34.67 and 1.6°C at 3500–5000 m (Figure 4A). The transition points at 34.83 and 34.22 psu mark the core of NPTW and the NPIW at this location, and the line segments reflect the relatively well-mixed water masses.
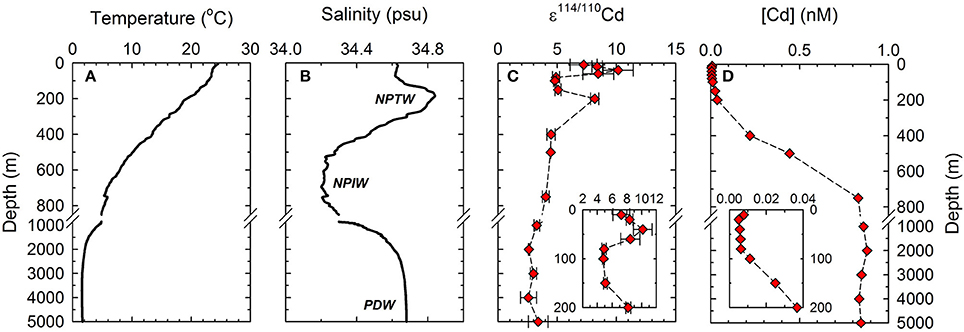
Figure 2. Depth profiles of Cd concentrations, ε114/110Cd, temperature and salinity at the sampling site. (A) Temperature; (B) Salinity; (C) ε114/110Cd; (D) Cd concentrations. Abbreviations—Water masses: NPTW, North Pacific Tropical Water; NPIW, North Pacific Intermediate Water; PDW, Pacific Deep Water.
Cd Purification
The double spike technique and column chemistry used in this study were the same as Yang et al. (2012). Approximately 50–3000 mL of seawater containing from 2 to 10 ng of Cd was used for isotopic analysis. Seawater samples were spiked with a 110Cd–111Cd double spike containing 171.42 ng g−1 Cd with a 111Cd/110Cd of 0.58847 to achieve a spike to sample ratio of approximately 4. The spiked seawater samples were subsequently acidified to achieve a final HCl concentration of 0.7 N, and were incubated and regularly shaken for at least 3 days to reach a full sample-spike equilibration prior to the chemical separation procedures.
The separation of Cd was achieved with a three-stage column chemistry adapted from Ripperger and Rehkamper (2007). Anion resin, Biorad AG1X8, was used in the first two columns to separate Cd from most of the major elements, e.g., Na, Mg, and Ca, in seawater. TRU resin from Eichrom was used in the third column to remove the remaining Mo and Sn, in order to avoid isobaric interferences on Cd. The purified Cd was evaporated to dryness, and 0.2 mL of super-pure concentrated HNO3 was added. The samples were then evaporated to dryness again, and re-dissolved with 2% HNO3 to achieve a final sample concentration of ~5 ng g−1 Cd. The recovery of Cd was greater than 90%. The procedural blank was ~60 pg (1SD, n = 3), which was ~0.6–3% of the Cd in the purified seawater samples, and was thus negligible.
Mass Spectrometry Analysis
Isotopic measurement has been reported in detail previously (Yang et al., 2012), so only a brief description is given here. All of the Cd isotopic measurements were performed using a Nu Plasma (a multi-collector ICPMS from Nu Instruments), with an Aridus I (a desolvator nebulizer from CETAC) as a sample introduction system. Four Cd isotopes, 110Cd, 111Cd, 112Cd, and 114Cd, were measured simultaneously in each analysis, while potential isobaric interferences from 112Sn to 114Sn were corrected within-run by simultaneously monitoring the 118Sn. All of the Cd isotopic compositions are reported in ε-notation, which is given by the following equation:
where the NIST SRM 3108 was used as the reference standard. The accuracy of the Cd isotopic measurement was verified by routinely checking for two additional Cd standards, JMC Cd Münster (ICP standard, lot 502552A) and an in-house standard “Alfa Aesar Ho” (Alfa Aesar standard, lot H14M68), against the NIST SRM 3108 within the same day of isotopic measurement, and which yielded consistent value of −0.8 ± 0.2 ε (2SE, n = 3–10) and −2.4 ± 0.3 ε (2SE, n = 3–6), respectively. The isotopic value of the JMC Cd Münster is analytically consistent with the value obtained from other laboratories (Abouchami et al., 2012). Within-day reproducibility was obtained by repeated analyses of the JMC Cd Münster, and which varied from ±0.6 to ±1.2 ε (2SD, n = 3–10). However, the reproducibility was slightly elevated to ~ ±1.6 ε (n = 6) during the measurements of seawater samples at 4000 and 5000 m. Within the same day, the reproducibility for repeated sample measurements was also comparable to that obtained from the Cd standard, indicating that potential matrix effects and interferences were negligible.
Determination for Dissolved Cd and Phosphate Concentrations, Temperature, Salinity, Oxygen, and Apparent Oxygen Utilization
Dissolved Cd concentrations were obtained by double spike technique (Table 1), and the uncertainty of Cd concentrations was, therefore, estimated from the uncertainty of isotopic measurements and weighting. Dissolved phosphate concentrations were determined on the same sample bottles as the Cd with the standard molybdenum blue method with a flow injection analyzer (Pai et al., 1990). The detection limit for phosphate concentration was 0.01 μM. Temperature, salinity, and dissolved oxygen were measured by a SEA-BIRD, Model 911-plus CTD, with an additional sensor (SEA-BIRD, SBE 43 Dissolved Oxygen Sensor) to measure dissolved oxygen concentration, and which was used to estimate the apparent oxygen utilization (AOU).
Table 1. Cd concentrations and isotope compositions for seawater samples collected in the West Philippine Sea.
Results
Vertical Variation on Dissolved Concentration and Isotopic Composition of Cd
The ε114/110Cd water column vertical profile for a station in the WPS is shown in Table 1 and Figure 2C. Overall, the ε114/110Cd profile follows the variations in the world's oceans (Ripperger et al., 2007; Abouchami et al., 2011, 2014; Xue et al., 2012, 2013; Yang et al., 2012), with ~+3 in the deep water (≥1000 m), and +4 to +10 in the thermocline and the surface water (≤750 m) (Figure 2C). Between 1000 and 5000 m, the ε114/110Cd is relatively constant, ranging from +2.6 ± 0.0 to +3.3 ± 0.2. The ε114/110Cd increases to +4.0 ± 0.3 and +4.5 ± 0.4 between 750 and 400 m. In the top 200 m, the ε114/110Cd is more variable, with an abrupt increase to +8.2 ± 0.3 at 200 m, a drop to around +5 between 150 and 80 m, and an increase again from +7.2 ± 1.1 to +10.1 ± 1.3 in the top 60 m.
The dissolved Cd concentrations ([Cd]) for the seawater profile are shown in Table 1 and Figure 2D. The [Cd] exhibits a typical “nutrient-like” distribution, with a concentration between 0.835 and 0.880 nM in the depth water (≥1000 m), a linear decrease from 0.830 to 0.011 nM from 750 to 100 m, and a relatively low abundance of 0.005–0.008 nM in the top 80 m.
Previous studies have shown negative relationships between the isotopic composition and concentration of dissolved Cd in open oceans, with relatively light ε114/110Cd and high [Cd] in the deep waters and vice versa in the surface waters (Ripperger et al., 2007; Abouchami et al., 2011, 2014; Xue et al., 2012, 2013). The relationships are mostly attributed to the effects of Cd isotopic fractionation via biological cycling processes, including the preferential uptake of light Cd isotopes by phytoplankton from the surface waters, and the subsequent transport of light Cd via biomass to the deep waters (Ripperger et al., 2007; Abouchami et al., 2011, 2014; Xue et al., 2012, 2013). In particular to the water column of the Atlantic sector of the Southern Ocean, ε114/110Cd linearly increases, coupled with the decrease of log [Cd] (Figure 3; Xue et al., 2013; Abouchami et al., 2014). Due to the relatively simple cycling processes of Cd in the region, dominated by upwelling and phytoplankton uptake, the cycling of Cd is assumed to behave as a closed system. Consequently, the linear relationship is supposed to reflect the biological fractionation through a Rayleigh fractionation process (Xue et al., 2013; Abouchami et al., 2014).
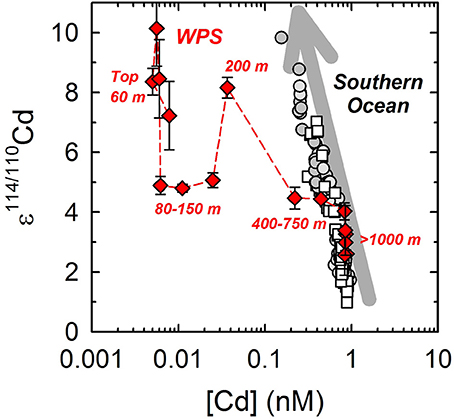
Figure 3. Relationship between Cd concentration and ε114/110Cd in the water column of the West Philippine Sea (WPS), along with the data from Abouchami et al. (2011, 2014) and Xue et al. (2013). Diamonds in red: data of WPS; Circles in gray: data of Antarctic Circumpolar Current; open squares: data of Weddell Gyre.
Comparing ε114/110Cd with log [Cd] in the WPS, we also observe that the deep water (≥1000 m) is characterized by the lightest ε114/110Cd and the highest [Cd], while the surface water (top 60 m) is characterized by the heaviest ε114/110Cd and the lowest [Cd] (Figure 3), which, in general, is comparable to the relationship observed in previous studies. However, the ε114/110Cd values in the depth interval from 80 m to 750 m do not follow the negative relationship with log [Cd] as that observed in the Southern Ocean (Figure 3). This indicates that other processes, besides the uptake by phytoplankton and decomposition of sinking particles resulting a simple Rayleigh fractionation, are also affecting and fractionating the Cd isotopes in the water column of the WPS.
Discussion
Cadmium Cycling in the Whole Water Column
The cycling of Cd in the whole water column of WPS is controlled by the processes of vertical transport of sinking particles, physical mixing, and advection of water masses. As shown in the South China Sea (SCS), atmospheric input and phytoplankton export dominate the cycling of Cd in the surface water, with shorter Cd turnover time than that of lateral transport and physical mixing (Yang et al., 2012). However, for the intermediate to deep waters, lateral transport and physical mixing of different water masses become more dominant than the downward flux, evident by the one to two orders shorter Cd turnover times (Yang et al., 2012). In the case of WPS, the understanding of Cd fluxes for sinking particles and the rates of water mass advection is still limited. Therefore, the Cd flux is calculated using the organic carbon fluxes around the nearby areas (Kawahata et al., 1997, 2000; Hung et al., 2012), assuming the Redfield ratio of 106 mol mol−1 for organic carbon to organic phosphate and a Cd to P ratio of ~0.5 mmol mol−1 in the particles (Martin et al., 1976; Collier and Edmond, 1984; Kuss and Kremling, 1999). The estimated Cd turnover time for the downward Cd fluxes is ~0.2, 130, and 3600 years for the top 150, 150–1500, and 1500–5000 m, respectively. Despite the approximation, the turnover times of Cd fluxes for WPS are actually in the same order as that of SCS (Yang et al., 2012), providing confidence to these estimations, although further study may better constrain the Cd fluxes and residence time for the whole water column of WPS.
As for the horizontal transport, the water body of WPS originates from the Northwest Pacific Ocean to the Philippine Sea basin, and outflows through western boundary currents. The fluxes of inflow and outflow are reasonably constrained (Kaneko et al., 2001; Hsin et al., 2008), and the turnover times of seawater in the 0–150, 150–1500, and 1500–5000 m intervals are 1.2, 1.5, and 7 years, respectively.
Together, the estimated turnover times suggest that phytoplankton export is the dominant process on controlling Cd cycling in the surface water interval, and horizontal transported of water masses is the dominant process for the intermediate and deep water intervals.
Conservative Isotopic Variation in the Thermocline and Deep Water
Besides Rayleigh fractionation, other processes such as advection and vertical mixing of water masses are also important on controlling the isotopic composition of Cd in seawater (Yang et al., 2012; Abouchami et al., 2014). For example, the concentrations and isotopic composition of dissolved Cd in the water column from thermocline and below are shown to vary with the physical properties of seawater, e.g., temperature, density, and salinity, for the Northwest Pacific, SCS, Southern Ocean, and South Atlantic Ocean (Lacan et al., 2006; Yang et al., 2012; Abouchami et al., 2014; Xie et al., 2014). This suggests that the concentration and isotopic composition of dissolved Cd in seawaters behaves “quasi-conservatively” (Abouchami et al., 2014). The relationship occurs when mixing and advection of water masses are more dominant than phytoplankton uptake and remineralization on controlling the oceanic Cd cycling (Yang et al., 2012; Abouchami et al., 2014). Lacan et al. (2006) first suggested that the vertical variations of Cd isotopic composition in seawater might be a reflection of vertical mixing of different water masses. Lacan et al. (2006) observed strong linear relationship between salinity and the product of the Cd isotopic composition and concentrations from 300 to 700 m, the mixing zone between mesothermal water and the NPIW in the North Pacific Ocean. In the Southern Ocean, Abouchami et al. (2014) also observed linear relationships between Cd isotopic composition and potential temperature and salinity in the water columns of the Subantarctic region. Similarly, a recent study in the South Atlantic Ocean along the western boundary indicated that the variations of the Cd isotopes in the thermocline and deep water reflect the mixing between North Atlantic Deep Water and Antarctic Bottom Water (Xie et al., 2014). In the SCS, Yang et al. (2012) also demonstrated that physical mixing is the primary process controlling the Cd concentration and isotopic composition in the thermocline and deep water of the water column. Since the water body in the SCS is mostly originating from the WPS through horizontal advection (Gong et al., 1992; Qu et al., 2000), the physical mixing process may also govern the dissolved concentration and isotopic composition of Cd in the thermocline and deep water of the WPS.
The T-S diagram at the study site in the WPS exhibits three distinct water masses in the thermocline and deep water, including NPTW, NPIW, and PDW (Figure 4A; see Sampling). Relative to the T-S diagram, the plots between both [Cd] and ε114/110Cd vs. salinity show similar patterns, with three distinct water masses in the water zone (Figures 4B,C). This suggests that both the [Cd] and ε114/110Cd vary conservatively as temperature and salinity, and vertical mixing among different water masses is the dominant process mediating the distribution of the dissolved concentration and isotopic composition of Cd in the thermocline and deep water of the WPS.
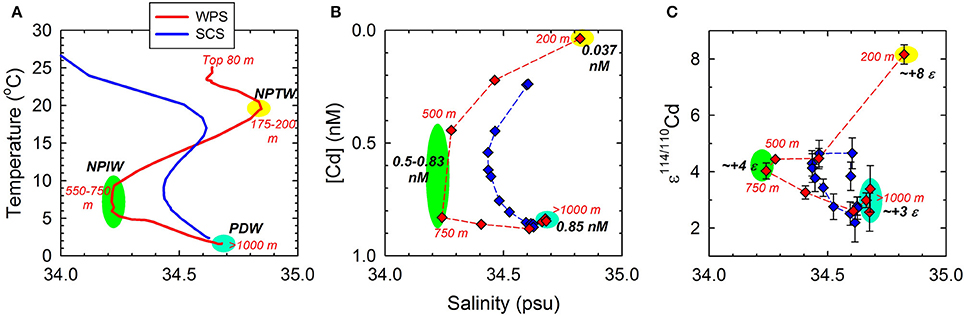
Figure 4. Relationship between salinity and (A) temperature; (B) Cd concentration; and (C) ε114/110Cd in the West Philippine Sea and South China Sea (SCS). Figure 4A displays the data over the whole water column profile, and Figures 4B,C display the data in the thermocline and deep waters. The data of SCS is quoted from Yang et al. (2012).
Despite the water body of the SCS originated mostly from the WPS, vertical variations of [Cd] in the thermocline of the two regions do not exhibit consistent patterns (Figure 5B). The [Cd]-depth gradient is larger in WPS than in SCS (Figure 5B), probably reflecting the hydrographic difference in these two areas. The T-S diagrams of the WPS and SCS indicate that both water bodies consist of distinct surface water, subsurface water, intermediate water, and deep water, but the T-S variations in the thermocline and deep water of SCS are relatively moderate (Figure 4A). The decrease in the T-S gradient and the reduction of extreme salinity signals from WPS to SCS are supposed to be the results of more intense upwelling and vertical mixing in the SCS basin (e.g., Gong et al., 1992; Qu, 2001). Relative to salinity, [Cd] in the thermocline are also less variable in the SCS than in the WPS (Figure 4B), suggesting that more intense upwelling and vertical mixing in the SCS tend to even out the gradients of [Cd] in the water column. In terms of ε114/110Cd, however, despite significant hydrographic differences between WPS and SCS, the vertical variations in the thermocline are generally comparable except for a single sample at 200 m of the WPS (Figure 5A).
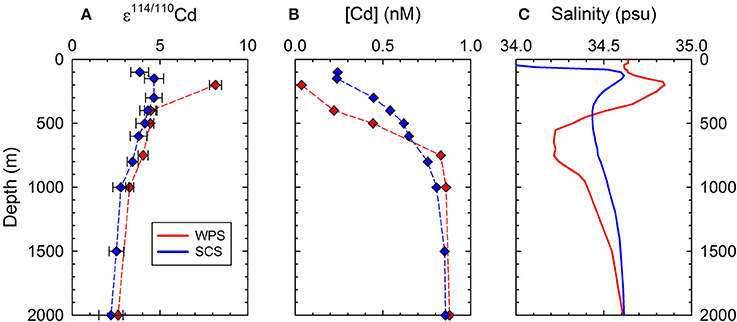
Figure 5. Depth profiles of Cd concentrations, ε114/110Cd and salinity in the thermocline and deep water of the West Philippine Sea (200–2000 m) and South China Sea (100–2000 m). (A) ε114/110Cd values; (B) Cd concentrations; (C) salinity. The data of SCS is quoted from Yang et al. (2012).
The different [Cd] but similar ε114/110Cd patterns in the thermocline in the WPS and SCS may result from different productivity with similar biological fractionation effects in the regions. The productivity in the WPS may be higher than the SCS, resulting in relatively intense Cd removal fluxes in the surface water, coupled with relatively depleted [Cd] in the upper thermocline. However, Liu et al. (2002) found that the surface chlorophyll concentration in the WPS was only about half that of the SCS, hence the downward particle fluxes of the WPS are probably lower than that of the SCS. Furthermore, the cycling of Cd in thermocline of the SCS (Yang et al., 2012) and WPS was predominately controlled by horizontal advection of water masses, instead of vertical transport of particle fluxes, for horizontal advection would result in a much more efficient turnover of Cd in the waters. Thus, the vertical variations in Cd concentration in the thermocline in the WPS and SCS should not reflect the difference on Cd removal via biological exports in the surface waters.
The seawater at 200 m shows a distinctly elevated ε114/110Cd of +8.2 ± 0.3 (Figures 2B,C, 4C). The seawater at the depth belongs to NPTW, which originates from the surface of the central North Pacific along the Tropic of Cancer and flows westwards, and sinks to subsurface in the WPS (Li and Wang, 2012). Ripperger et al. (2007) reported extremely heavy ε114/110Cd (≥+16) and low [Cd] (≤15 pM) in the surface water of the central North Pacific, and proposed that the low [Cd] and heavy ε114/110Cd were the results Cd uptake by phytoplankton. Assuming the water sample reported by Ripperger et al. (2007) is representative to the source of NPTW, the ~+8 ε114/110Cd in the NPTW of the WPS may reflect the biological fractionation in the central North Pacific.
Yang et al. (2012) found that the biogenic sinking particles of the SCS characterized with a ~+9 ε 114/110Cd, suggesting that the ~+8 ε114/110Cd of the NPTW may also be attributed to degradation of sinking particles. However, the degradation process is unsupported by the vertical variations of AOU and transmission in the surface water. Both AOU and transmission exhibit significant decline in the depth between 100 and 150 m, indicating that sinking particles were mostly degraded at this water depth (Figures 6C,D). Consequently, decomposition of sinking particles should not be responsible for the observed ε114/110Cd of the NPTW.
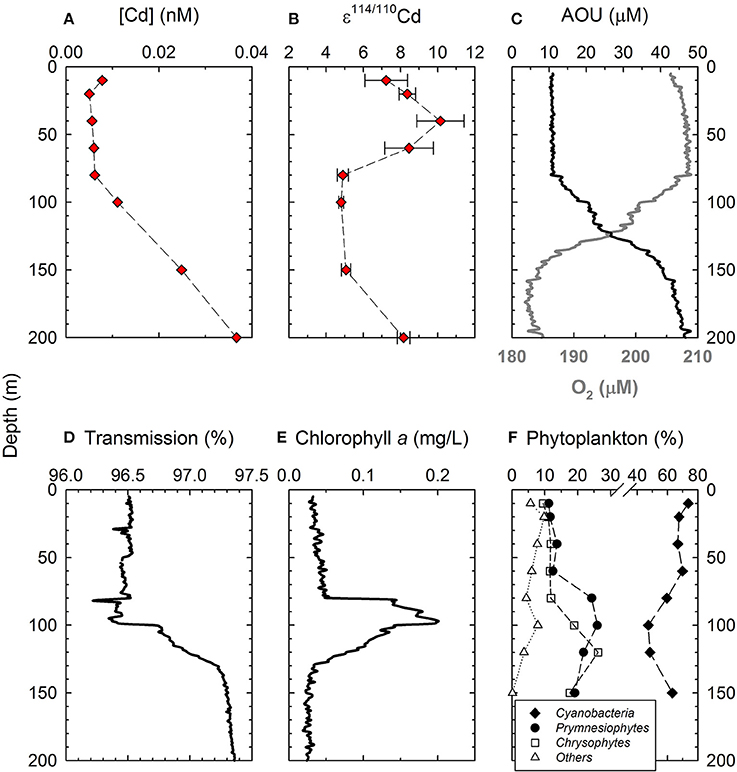
Figure 6. Depth profiles of Cd concentrations and ε114/110Cd along with O2, AOU, transmission and phytoplankton community structure data in the top 200 m water layer of the West Philippine Sea. (A) Cd concentrations; (B) ε114/110Cd; (C) O2 and AOU; (D) transmission; (E) Chlorophyll a concentrations; and (F) phytoplankton community structure. Data of phytoplankton community structure data are from Yang et al. (2009).
Isotopic Fractionation in the Surface Water
In the top 150 m water layer where bio-activity is most intensive (Figure 6E), the cycling of Cd should be governed predominantly by the uptake of phytoplankton, and, the [Cd] and ε114/110Cd in this interval should, therefore, reflect the fractionation through phytoplankton uptake. In a closed system, a Rayleigh fractionation model predicts a linear increase of the ε114/110Cd with the decrease of [Cd]. This has been observed in the surface waters of individual water column profiles of the Southern Ocean (Xue et al., 2013; Abouchami et al., 2014). However, the WPS data do not exhibit a similar fractionation pattern. For example, from the depth of 150 to 80 m, [Cd] decreases by a factor of 3, from 0.025 to 0.006 nM, but ε114/110Cd remains at ~+5 (Figures 6A,B). Furthermore, in the top 60 m, while ε114/110Cd is significantly elevated to ≥+7, [Cd] stays comparable to that of 80–100 m, ~0.005–0.008 nM (Figures 6A,B). The lack of a coherent relationship between [Cd] and ε114/110Cd suggests that Cd in the surface water of WPS does not follow a Rayleigh fractionation process, implying that either the fractionation factor may not be constant at different water depths, and/or the Cd cycling may not be in a closed-system.
Phytoplankton community may also be an important factor on controlling ε114/110Cd in seawater. Phytoplankton culture experiments have shown that coccolithophore and diatom would take up Cd through different transport systems and result in different Cd isotopic fractionations (Ho et al., 2011). In addition, two distinct linear patterns between ε114/110Cd and log [Cd] were observed for the surface water of the Antarctic Circumpolar Current (ACC) and Weddell Gyre, separating the regions into two distinct Cd isoscapes (Abouchami et al., 2011). Each pattern is supposed to reflect a different phytoplankton group dominating the ACC and Weddell Gyre (Abouchami et al., 2011). In the WPS, phytoplankton community structure changes significantly with water depths (Yang et al., 2009). Therefore, the vertical ε114/110Cd variation may also be the results of Cd uptake by different phytoplankton.
The phytoplankton community in the WPS consists mainly of cyanobacteria, prymnesiophytes, and chrysophytes, each with abundance higher than 10% (Figures 6F; Yang et al., 2009). Relative to the vertical variations in ε114/110Cd, the vertical variations in the abundance of cyanobacteria exhibit a comparable pattern, however, a reverse pattern is found for prymnesiophytes (Figures 6B,F). The abundance of cyanobacteria is relatively high in the top 60 m, and is relatively low in the 80–150 m interval, varying from 67 to 74%, and from 47 to 63%, respectively (Figure 6F). In contrast, the abundance of prymnesiophytes exhibits an inverse variation, ranging from 11 to 14% at top 60 m and from 19 to 26% at 80–150 m (Figure 6F). The corresponding variations between ε114/110Cd and the abundance of phytoplankton indicate that the isotopic fractionation of Cd in the surface water may be associated with the Cd uptake by cyanobacteria and prymnesiophytes. In terms of Cd quota, phytoplankton and prymnesiophytes contain one to two order magnitudes higher than that of marine cyanobacteria (Ho et al., 2003; Finkel et al., 2007). The distinct variations in Cd quota are due to the more sensitive to Cd toxicity for cyanobacteria than prymnesiophytes (Brand et al., 1986; Payne and Price, 1999). Furthermore, prymnesiophytes may actively take up more Cd when the supply of other trace metal nutrients such as Zn and Co is limited (Sunda and Huntsman, 2000; Xu et al., 2007). The differences of the resistance and requirement to Cd among cyanobacteria and prymnesiophytes may reflect the different affinities for their trace metal transporters in response to Cd, resulting in different selectivity of Cd isotopes through Cd uptake. Further investigation is needed in order to understand the uptake and fractionation of Cd isotopes by the phytoplankton phyla.
Supply of essential trace metal nutrients to phytoplankton such as Fe, Zn, and Mn is also a potential factor on controlling the Cd isotopic fractionation through Cd uptake. Abouchami et al. (2011, 2014) suggested that the limitation of Fe, Zn, or Mn in seawater might induce phytoplankton to overexpress various trace metal transporters to assimilate Cd, and, hence, a change to the isotopic fractionation effects (Abouchami et al., 2011, 2014). However, trace metal limitation is unlikely to be the cause of Cd isotopic variation in the surface water of WPS. In the oligotrophic Northwest Pacific Ocean, the low availability of major nutrient (N, P, and Si) in the surface water limits the primary production (Levitus et al., 1993; Jiao and Ni, 1997). Due to high aerosol deposition originated form lithogenic and anthropogenic sources in Asia to the Northwest Pacific Ocean (Uematsu et al., 1983; Duce et al., 1991), the availability of trace metals in the surface water should be relatively abundant. Particularly in the WPS and SCS that are surrounded by large populations from the developing countries, the input of anthropogenic aerosols from the burning of fossil fuels and biomass is significant (Lin et al., 2007). In the SCS, previous studies have shown that phytoplankton adsorb a significant amount of trace metals originating from anthropogenic aerosols (Ho et al., 2007, 2009, 2010). The Fe, Zn, and Mn extracellularly adsorbed by phytoplankton were approximately one order of magnitude higher than their averaged intracellular quotas (Ho et al., 2003). Since WPS is located near the SCS, the deposition of anthropogenic aerosols is also elevated (Lin et al., 2007), the availability of trace metals are unlikely to limit the growth of phytoplankton, and to cause Cd isotopic fractionation in the surface water.
Similar to the SCS (Yang et al., 2012), atmospheric Cd inputs may also play an important role on influencing the Cd isotopic composition in the surface waters, due to the high aerosol deposition in the WPS. However, since the study of the oceanic cycling of trace metals in East Asia is still in the early stage, the fluxes and isotopic composition of Cd in aerosols deposited to the WPS remain unclear. Consequently, the effect of atmospheric deposition on the Cd isotopic composition in the surface water is difficult to estimate. Nevertheless, preliminary constraints about the Cd isotopic composition of the atmospheric inputs and the influence on the surface water are shown using a box model calculation in the following section.
A Box Model for the Surface Water
Due to the lack of constraint for the fractionation factor of Cd uptake by the dominant phytoplankton phyla and the Cd fluxes and isotopic composition of atmospheric deposition to the WPS, precisely quantifying their relative contribution to the ε114/110Cd of the surface water is not possible. However, critical constraints about how various processes would affect the Cd isotopic fractionations in the surface water of WPS can still be established by using a simple box model calculation. The surface water is divided into two boxes, the 0–60 m and the 80–150 m, based on the different phytoplankton activities and community structures in the depth intervals (Figures 6E, 7). The model calculations are based on mass-balance equations that are adapted from Murphy et al. (2014).
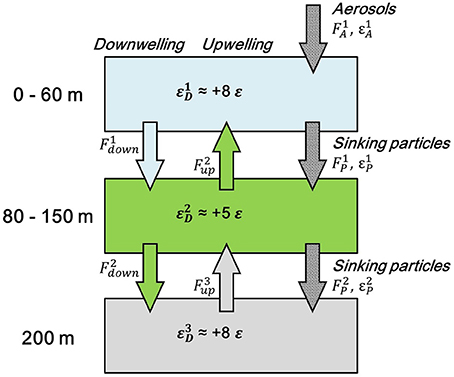
Figure 7. Box model for the cycling of Cd in the euphotic zone of the West Philippine Sea. The arrows with dotted pattern stand for particle fluxes (aerosols and sinking particles), the arrows in green stand for the output fluxes from the 80 to 150 m box from vertical advection, the arrow in light blue stands for the output flux from the 0 to 60 m box from downward advection, and the gray arrow stands for the output flux from the 200 m water mass from bottom-up advection. F, Cd fluxes; ε, Cd isotopic composition in the boxes or of the fluxes. The averaged Cd isotopic composition in the 0–60 m, 80–150 m, and the composition at 200 m in the WPS, +8, +5, and +8 ε, respectively, are applied to the boxes.
For the 0–60 m box, Cd would be transported into the box through atmospheric inputs, vertical mixing, and horizontal advection, and would be exported through particle sinking, vertical mixing, and horizontal advection. Because horizontal advection is not the major process on controlling Cd cycling in the surface water (see Cd Cycling in the Whole Water Column), and the lack of Cd isotopic data for the source regions of the surface water, we decide to neglect the horizontal advection in the model calculation. By assuming the Cd cycling in the box to be steady-state, the mass balance of Cd fluxes and isotopic composition can, thus, be described as the following equations:
where F1A and F2up stand for the input fluxes through atmospheric deposition and upwelling, respectively, and F1P and F1down stand for the output fluxes through biogenic sinking particles and vertical mixing, respectively. ε1A and ε2D are the Cd isotopic composition of atmospheric deposition and upwelled seawater from the 80 to 150 m box, and ε1P and ε1D are the composition of biogenic sinking particles and seawater in the 0–60 m box (Figure 7). The equations can be combined as one equation:
and we further define the term F1A/(F1A + F2up) as f1in−A and F1P/(F1P + F1down) as f1out−P. f1in−A reflects the fraction of inputs from atmospheric deposition, and, similarly, f1out−P reflects the fraction of outputs from particle sinking. Lastly, the Equation (3) can be rewritten as:
As in the 0–60 m box, Cd would be transported into the 80–150 m box from particle sinking, vertical mixing, and horizontal advection, and would be exported through particle sinking, vertical mixing, and horizontal advection. Again, the horizontal terms are ignored. By assuming the Cd cycling in the box to be steady-state, the mass-balance of Cd fluxes, and isotopic compositions in the 80–150 m box can then be described as the following equations:
where F3up stands for the input flux from upwelled seawater from the water mass below the 80–150 m box, and F2P and F2down stand for the output fluxes from particle sinking and downwelling of seawater from the 80 to 150 m box, respectively. ε3D and ε2P represent the ε114/110Cd for the upwelled seawater from the water mass below the box and the sinking particles output from the 80 to 150 m box (Figure 7). Again, Equations (5) and (6) can be combined as one equation:
Similarly, we further define the term F1P/(F1P + F1down + F3up) as f2in−P, F1down/(F1P + F1down + F3up) as f2in−D1, and F2P/(F2P + F2up + F2down) as f2out−P, the equation can be rewritten as:
Because ε1D and ε3D are almost the same (~+8 ε) for the WPS, the equation can be further simplified as:
Based on Equations (4) and (9), the ε114/110Cd of dissolved Cd in the 0–60 m box is governed by the isotopic composition of aerosol inputs (ε1A) and sinking particles (ε1P), the fraction of aerosol inputs (f1in−A), and the fraction of particulate output (f1out−P). Similarly, for the 80–150 m box, the ε114/110Cd of dissolved Cd is dependent on the composition in sinking particles received from the 0 to 60 m box (ε1P) and exported from the 80 to 150 m box (ε2P), the fraction of particulate inputs (f2in−P), and the fraction of particulate output (f2out−P). The averaged ε114/110Cd in the 0–60 m and 80–150 m water is approximately +8 and +5, respectively (Figure 2C). Applying the averaged value of +8 ε into ε1D in Equation (4) and the averaged value of +5 ε into ε2D into Equation (9), the relationships between the parameters in each box are shown in Figures 8A–L.
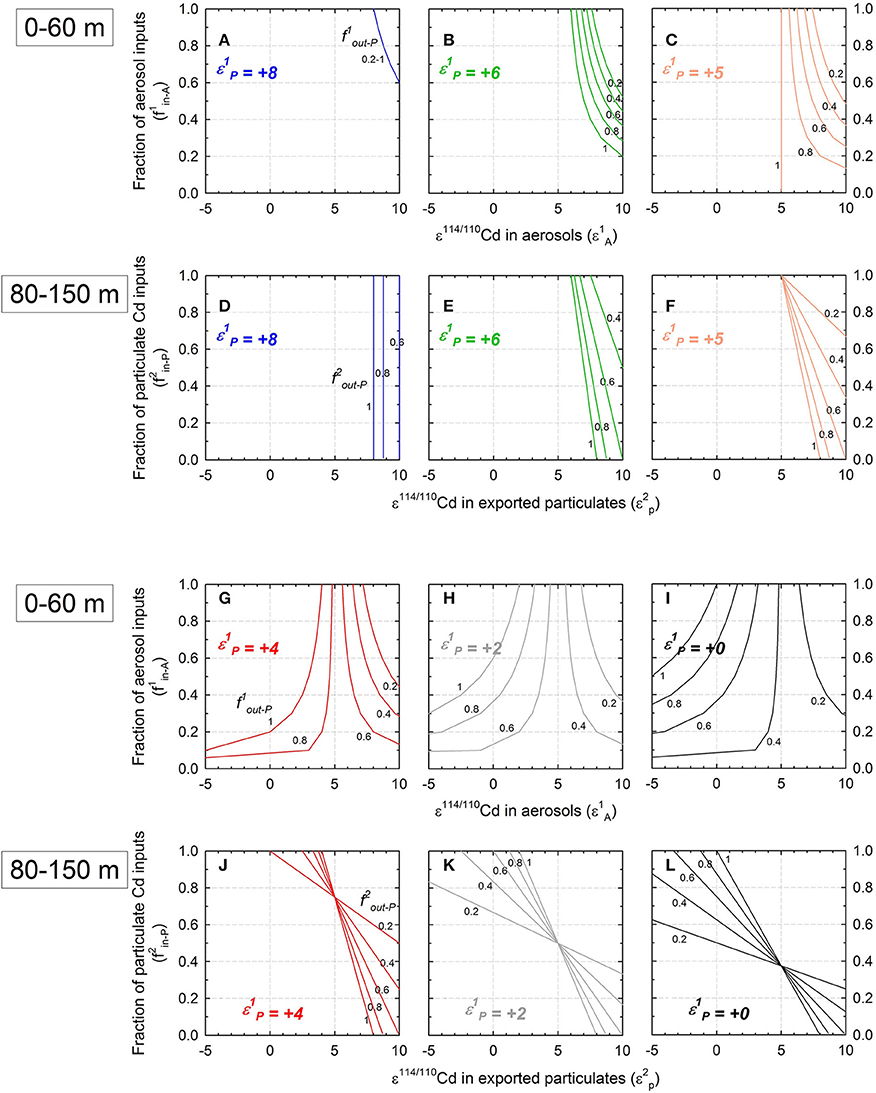
Figure 8. Modeled relationship between the isotopic composition in aerosols (ε1A) and the fraction of aerosol inputs (f1in-A) in the 0–60 m box and relationship between the isotopic composition in exported particulate Cd (ε2P) and the fraction of particulate Cd inputs (f2in-P) in the 80–150 m box. (A–C) and (G–I), the relations of ε1A and f1in-A in the 0–60 m box; (D–F) and (J–L), the relations of ε2P and f2in-P in the 80–150 m box. The isotopic composition of exported particulate Cd (ε1P) is set from +8 to +0 ε. The fractions of Cd exported through particle sinking in the 0–60 m and 80–150 m boxes (f1out-P and f2out-P, respectively) are both set from 0.2 to 1 (the numbers in black in the diagrams). The model results of (A–F) (ε1P is set as +8 to +6) are unrealistic because the calculated ε2P is all heavier than +5 ε (the composition of the Cd inventory of the 80–150 m box), indicating that phytoplankton prefer to take up relatively heavy Cd isotopes from seawater.
The box model is useful for evaluating the influence of atmospheric inputs, since if ε1A and ε1P are known, the f1in−A can be constrained. For example, if the ε1A and ε1P were 0 and +4, respectively, the f1in−A would be within the range from 0.04 to 0.2, indicating that the contribution of atmospheric Cd to the Cd inventory is minor (Figure 8G). Similarly, the model is helpful in estimating the Cd isotopic fractionation effect through phytoplankton uptake. The culture studies had shown that phytoplankton assimilate Cd with an isotopic composition lighter than or comparable to that of seawater (Lacan et al., 2006; Ho et al., 2011; John and Conway, 2014). Consequently, if the phytoplankton in the box models fractionate Cd as that observed in the culture studies, ε114/110Cd of the phytoplankton would be comparable or lighter than that of the surrounding seawater. Therefore, ε114/110Cd of the biogenic particles exported from the 0 to 60 m and 80 to 150 m boxes (ε1P, and ε2P) would be ≤+8 and ≤+5, respectively (comparable or lighter than that of each box). In comparison, if ε1P has the value higher than +5, the estimated ε2P would be heavier than +5, suggesting that the phytoplankton in the 80–150 m box would take up relatively heavy isotopes from seawater, which is in conflict with the results in the culture studies (Figures 8D–F). Therefore, the ε1P is further constrained to be lighter than +5, indicating that phytoplankton uptake in the 0–60 m box would generate a fractionation of 3 ε or larger (α ≥ 1.0003).
The modeled Cd isotopic fractionation factor in the 0–60 m box, α ≥ 1.0003, is comparable to that obtained from the world's oceans (α = 1.0002–1.0008; Ripperger et al., 2007; Abouchami et al., 2011, 2014; Xue et al., 2012, 2013). The fractionation factors in the oceans may be controlled by various factors, such as phytoplankton community composition and availabilities of biological essential trace metals (Abouchami et al., 2011, 2014). For example, Abouchami et al. (2011) have found that the fractionation factor in the surface water passing from the Weddell Gyre into the ACC increases from α = 1.0002 to 1.0004. In general, phytoplankton community in Weddell Gyre is dominated by diatoms, while ACC is dominated by chlorophytes. As for the supply of trace metals in the surface water, Weddell Gyre is relatively Zn-replete and ACC is relatively Zn-depleted. Based on these, Abouchami et al. (2011) suggested that the increase in Cd isotopic fractionation across the Weddell Gyre into the ACC was caused by changes in the phytoplankton community with a corresponding shift in the transport channels of Cd, from a high Zn to a low-Zn induced system, respectively. In the case of WPS, the seawater may have received large amounts of anthropogenic aerosols originated from the neighboring countries, and Zn is unlikely to be depleted in the surface water. Based on the conclusion of Abouchami et al. (2011), the fractionation factor of Cd isotopes in the WPS may be 1.0002. However, the fractionation factor estimated from the box model, α ≥ 1.0003, is, in fact, closer to that of the Zn-depleted ACC seawater. The cause for the discrepancy between Cd isotopic fractionation and Zn supply obtained in this study and in Abouchami et al. (2011, 2014) requires further studies, such as verification on the validity of our box model, determination of trace metal concentrations in the WPS, and phytoplankton culture experiments under various trace metal conditions.
The range of Cd isotopic composition in aerosols can be further constrained by the box model as well. The model predicts that aerosol inputs and upwelling are the dominant Cd inputs to the top 150 m water layer, while particle sinking and downwelling are the dominant outputs of the layer (Figure 7). Furthermore, fluxes and ε114/110Cd of the inputs and outputs are also balanced. Based on our previous estimation assuming that the ε114/110Cd of sinking particles exported at 150 m should be lower than +5, paired with a ε114/110Cd of +5 for downwelling exports, the ε114/110Cd of net Cd exports from the top 150 m layer would be +5 or lower. Evidently, the ε114/110Cd of the net inputs to the layer would also be +5 or lower. Given the ε114/110Cd of the upwelled seawater at +8, the ε114/110Cd of aerosol inputs must be lower than +5. This estimate is distinctly lighter than the ε114/110Cd of the aerosols collected at the northern SCS, ranging from +8 to +9 (Lee et al., 2011).
Atmospheric Cd input usually includes both lithogenic and anthropogenic aerosols, and the net effect of atmospheric Cd to seawater is decided by the ε114/110Cd of lithogenic and anthropogenic aerosols and their relative contributions. Schmitt et al. (2009) have studied the ε114/110Cd for various lithogenic materials, including various rocks, sediments, and Cd-rich minerals, and found the ε114/110Cd to fall within a relatively narrow range, from −2 to +3. In comparison, ε114/110Cd of anthropogenic aerosols is relatively diverse, with values around −4 to −7 for aerosols generated from waste incineration and lead smelters (Cloquet et al., 2005; Shiel et al., 2010), to +11 to +51 for fly ash emitted from a power plant (Fouskas et al., 2014). The ε114/110Cd of anthropogenic aerosols are thus highly region or case specific. Further studies for various lithogenic particles and, more importantly, anthropogenic emissions over the East Asia, including their relative contribution to aerosols and ε114/110Cd, are necessary in order to better understanding the cause for different atmospheric ε114/110Cd inputs to the WPS and SCS.
Conclusions
The isotopic composition of Cd in the seawater of the WPS has been studied here, as well as the possible processes on controlling its vertical variation. The relationship between ε114/110Cd and log [Cd] is not consistent with the previous studies showing nearly linear relationships (Abouchami et al., 2011, 2014; Xue et al., 2013), indicating that the cause of the isotopic variation cannot be fully explained by a Rayleigh fractionation model. The isotopic composition in the thermocline and deep water varies conservatively, indicating that the variation in this interval is predominantly decided by the composition in the NPTW, NPIW, and PDW and their vertical mixing. The isotopic fractionation in the surface water is likely to be influenced by the factors including phytoplankton community structures, atmospheric inputs, and vertical mixing. However, their relative contributions are unclear through examining the data of dissolved Cd in seawater alone. An understanding of the ε114/110Cd of aerosols and biogenic particles is necessary to decipher the isotopic fractionation processes of Cd in the surface water of WPS.
Conflict of Interest Statement
The authors declare that the research was conducted in the absence of any commercial or financial relationships that could be construed as a potential conflict of interest.
Acknowledgments
We thank the personnel of the R/V Ocean Research 1 and the research assistants at the Institute of Oceanography, National Taiwan University for their assistance in sampling during the cruises. We thank two reviewers for their constructive and detailed comments, Dr. K.-Y. Wei and Dr. Y.-C. Hsin for constructive suggestions on this study. This study was supported by the National Science Counsel of Taiwan, ROC via the NSC Grant numbers of 100-2119-M-001-026 and 101-2116-M-001-006, and MOST 103-2116-M-001-006.
References
Abouchami, W., Galer, S. J. G., de Baar, H. J. W., Alderkamp, A. C., Middag, R., and Laan, P. (2011). Modulation of the Southern Ocean cadmium isotope signature by ocean circulation and primary productivity. Earth Planet. Sci. Lett. 305, 83–91. doi: 10.1016/j.epsl.2011.02.044
Abouchami, W., Galer, S. J. G., de Baar, H. J. W., Middag, R., Vance, D., Zhao, Y., et al. (2014). Biogeochemical cycling of cadmium isotopes in the Southern Ocean along the Zero Meridian. Geochim. Cosmochim. Acta 127, 348–367. doi: 10.1016/j.gca.2013.10.022
Abouchami, W., Galer, S. J. G., Horner, T. J., Rehkämper, M., Wombacher, F., Xue, Z., et al. (2012). A common reference material for cadmium isotope studies – NIST SRM 3108. Geostand. Geoanal. Res. 37, 5–17. doi: 10.1111/j.1751-908X.2012.00175.x
Boyle, E. A. (1988). Cadmium: chemical tracer of deepwater paleoceanography. Paleoceanography 3, 471–489. doi: 10.1029/PA003i004p00471
Boyle, E. A., Sclater, F., and Edmond, J. M. (1976). On the marine geochemistry of cadmium. Nature 263, 42–44. doi: 10.1038/263042a0
Brand, L. E., Sunda, W. G., and Guillard, R. R. (1986). Reduction of marine phytoplankton reproduction rates by copper and cadmium. J. Exp. Mar. Biol. Ecol. 96, 225–250. doi: 10.1016/0022-0981(86)90205-4
Bruland, K. W., and Franks, R. P. (1983). “Mn, Ni, Cu, Zn and Cd in the western North Atlantic,” in Trace Metals in Sea Water, eds C. S. Wong, E. A. Boyle, K. W. Bruland, J. D. Burton, and E. D. Goldberg (New York, NY: Plenum Press), 395–414. doi: 10.1007/978-1-4757-6864-0_23
Bruland, K. W., Knauer, G. A., and Martin, J. N. (1978). Cadmium in Northeast Pacific waters. Limnol. Oceanogr. 23, 618–625. doi: 10.4319/lo.1978.23.4.0618
Pubmed Abstract | Pubmed Full Text | CrossRef Full Text | Google Scholar
Cloquet, C., Rouxel, O., Carignan, J., and Libourel, G. (2005). Natural cadmium isotopic variations in eight geological reference materials (NIST SRM 2711, BCR 176, GSS-1, GXR-1, GXR-2, GSD-12, Nod-P-1, Nod-A-1) and anthropogenic samples, measured by MC-ICP-MS. Geostand. Geoanal. Res. 29, 95–106. doi: 10.1111/j.1751-908X.2005.tb00658.x
Collier, R., and Edmond, J. (1984). The trace element geochemistry of marine biogenic particulate matter. Prog. Oceanogr. 13, 113–199. doi: 10.1016/0079-6611(84)90008-9
Duce, R. A., Liss, P. S., Merrill, J. T., Atlas, E. L., Buat-Menard, P., Hicks, B. B., et al. (1991). The atmospheric input of trace species to the world ocean. Global Biogeochem. Cycles 5, 193–259. doi: 10.1029/91GB01778
Pubmed Abstract | Pubmed Full Text | CrossRef Full Text | Google Scholar
Elderfield, H., and Rickaby, R. E. M. (2000). Oceanic Cd/P ratio and nutrient utilization in the glacial Southern Ocean. Nature 405, 305–310. doi: 10.1038/35012507
Pubmed Abstract | Pubmed Full Text | CrossRef Full Text | Google Scholar
Finkel, Z. V., Quigg, A. S., Chiampi, R. K., Schofield, O. E., and Falkowski, P. G. (2007). Phylogenetic diversity in cadmium: phosphorus ratio regulation by marine phytoplankton. Limnol. Oceanogr. 52, 1131–1138. doi: 10.4319/lo.2007.52.3.1131
Fouskas, F., Ma, L., Engle, M. A., Ruppert, L., and Geboy, N. J. (2014). “Using novel Cd isotopes to trace heavy metal pollution related to coal combustion products (abstract),” in Goldschmidt 2014 Conference (Sacramento, CA).
Gault-Ringold, M., Adu, T., Stirling, C. H., Frew, R. D., and Hunter, K. A. (2012). Anomalous biogeochemical behavior of cadmium in subantarctic surface waters: mechanistic constraints from cadmium isotopes. Earth Planet. Sci. Lett. 341, 94–103. doi: 10.1016/j.epsl.2012.06.005
Gong, G. C., Liu, K. K., Liu, C. T., and Pai, S. C. (1992). The chemical hydrography of the South China Sea West of Luzon and a comparison with the West Philippine Sea. Terr. Atmos. Ocean. Sci. 3, 587–602.
Ho, T. Y., Chou, W. C., Wei, C. L., Lin, F. J., Wong, G. T. F., and Lin, H. L. (2010). Trace metal cycling in the surface water of the South China Sea: vertical fluxes, composition, and sources. Limnol. Oceanogr. 55, 1807–1820. doi: 10.4319/lo.2010.55.5.1807
Ho, T. Y., Quigg, A., Finkel, Z. V., Milligan, A. J., Wyman, K., Falkowski, P. G., et al. (2003). The elemental composition of some marine phytoplankton. J. Phycol. 39, 1145–1159. doi: 10.1111/j.0022-3646.2003.03-090.x
Ho, T. Y., Wen, L. S., You, C. F., and Lee, D. C. (2007). The trace-metal composition of size-fractionated plankton in the South China Sea: biotic versus abiotic sources. Limnol. Oceanogr. 52, 1776–1788. doi: 10.4319/lo.2007.52.5.1776
Ho, T. Y., Yang, S. C., and Lee, D. C. (2011). Cd isotope fractionation in some phytoplankton: a novel proxy for fe limiting status in the oceans. Mineral. Mag. 75, 1030.
Ho, T. Y., You, C. F., Chou, W. C., Pai, S. C., Wen, L. S., and Sheu, D. D. (2009). Cadmium and phosphorus cycling in the water column of the South China Sea: the roles of biotic and abiotic particles. Mar. Chem. 115, 125–133. doi: 10.1016/j.marchem.2009.07.005
Hsin, Y. C., Wu, C. R., and Shaw, P. T. (2008). Spatial and temporal variations of the Kuroshio east of Taiwan, 1982-2005: a numerical study. J. Geophys. Res. 113:C04002. doi: 10.1029/2007JC004485
Hung, C. C., Gong, G. C., and Santschi, P. H. (2012). 234Th in different size classes of sediment trap collected particles from the Northwestern Pacific Ocean. Geochim. Cosmochim. Acta 91, 60–74. doi: 10.1016/j.gca.2012.05.017
Jiao, N., and Ni, I. H. (1997). “Spatial variations of size-fractionated Chlorophyll, Cyanobacteria and heterotrophic bacteria in the Central and Western Pacific,” in Asia-Pacific Conference on Science and Management of Coastal Environment, eds Y.-S. Wong and N. F.-Y. Tam (Dordrecht: Kluwer Academic Publishers), 219–230. doi: 10.1007/978-94-011-5234-1_22
John, S. G., and Conway, T. M. (2014). A role for scavenging in the marine biogeochemical cycling of zinc and zinc isotopes. Earth Planet. Sci. Lett. 394, 159–167. doi: 10.1016/j.epsl.2014.02.053
Kaneko, I., Takatsuki, Y., and Kamiya, H. (2001). Circulation of intermediate and deep waters in the Philippine Sea. J. Oceanogr. 57, 397–420. doi: 10.1023/A:1021565031846
Kawahata, H., Suzuki, A., and Ohta, H. (2000). Export fluxes in the Western Pacific Warm Pool. Deep-Sea Res. PT. I 47, 2061–2091. doi: 10.1016/S0967-0637(00)00025-X
Kawahata, H., Yamamuro, M., and Ohta, H. (1997). Seasonal and vertical variations of sinking particle fluxes in the West Caroline Basin. Oceanol. Acta 21, 521–532. doi: 10.1016/S0399-1784(98)80035-2
Kuss, J., and Kremling, K. (1999). Spatial variability of particle associated trace elements in near-surface waters of the North Atlantic (30 degrees N/60 degrees W to 60 degrees N/ 2 degrees W), derived by large-volume sampling. Mar. Chem. 68, 71–86. doi: 10.1016/S0304-4203(99)00066-3
Lacan, F., Francois, R., Ji, Y. C., and Sherrell, R. M. (2006). Cadmium isotopic composition in the ocean. Geochim. Cosmochim. Acta 70, 5104–5118. doi: 10.1016/j.gca.2006.07.036
Pubmed Abstract | Pubmed Full Text | CrossRef Full Text | Google Scholar
Lee, D. C., Yang, S. C., and Ho, T. Y. (2011). The evolution of Zn and Cd isotopes in the South China Sea (abstract). Mineral. Mag. 75, 1284.
Levitus, S., Conkright, M. E., Reid, J. L., Najjar, R. G., and Mantyla, A. (1993). Distribution of nitrate, phosphate and silicate in the world oceans. Prog. Oceanogr. 31, 245–273. doi: 10.1016/0079-6611(93)90003-V
Li, Y., and Wang, F. (2012). Spreading and salinity change of North Pacific tropical water in the Philippine Sea. J. Oceanogr. 68, 439–452. doi: 10.1007/s10872-012-0110-3
Lin, I. I., Chen, J. P., Wong, G. T. F., Huang, C. W., and Lien, C. C. (2007). Aerosol input to the South China Sea: results from the MODerate resolution Imaging Spectro-radiometer, the quick scatterometer, and the measurements of pollution in the troposphere sensor. Deep-Sea Res. PT. II 54, 1589–1601. doi: 10.1016/j.dsr2.2007.05.013
Liu, K. K., Chao, S. Y., Shaw, P. T., Gong, G. C., Chen, C. C., and Tang, T. Y. (2002). Monsoon-forced chlorophyll distribution and primary production in the South China Sea: observations and a numerical study. Deep-Sea Res. PT. I 49, 1387–1412. doi: 10.1016/S0967-0637(02)00035-3
Mantyla, A. W., and Reid, J. L. (1983). Abyssal characteristics of the World Ocean waters. Deep-Sea Res. PT. A 30, 805–833. doi: 10.1016/0198-0149(83)90002-X
Martin, J. H., Bruland, K. W., and Broenkow, W. W. (1976). “Cadmium transport in the California current,” in Marine Pollutant Transfer, eds H. L. Windom and R. A. Duce (Toronto, ON: Lexington Books, D. C. Health and Co.), 159–184.
Murphy, K., Rehkämper, M., and van de Flierdt, T. (2014). Comment on “The isotopic composition of cadmium in the water column of the South China Sea.” Geochim. Cosmochim. Acta 134, 335–338. doi: 10.1016/j.gca.2013.11.027
Nitani, H. (1972). “Beginning of the Kuroshio,” in Kuroshio, eds H. Stommel and Y. Yoshida (Seattle, WA: University of Washington Press), 129–164.
Pai, S. C., Yang, C. C., and Riley, J. P. (1990). Effects of acidity and molybdate concentration on the kinetics of the formation of the phosphor–antimonyl–molybdenum blue complex. Anal. Chim. Acta 229, 115–120. doi: 10.1016/S0003-2670(00)85116-8
Payne, C. D., and Price, N. M. (1999). Effects of cadmium toxicity on growth and elemental composition of marine phytoplankton. J. Phycol. 35, 293–302. doi: 10.1046/j.1529-8817.1999.3520293.x
Qu, T. D. (2001). Role of ocean dynamics in determining the mean seasonal cycle of the South China Sea surface temperature. J. Geophys. Res. 106, 6943–6955. doi: 10.1029/2000JC000479
Qu, T. D., Mitsudera, H., and Yamagata, T. (2000). Intrusion of the North Pacific waters into the South China Sea. J. Geophys. Res. 105, 6415–6424. doi: 10.1029/1999JC900323
Ripperger, S., and Rehkamper, M. (2007). Precise determination of cadmium isotope fractionation in seawater by double spike MC-ICPMS. Geochim. Cosmochim. Acta 71, 631–642. doi: 10.1016/j.gca.2006.10.005
Pubmed Abstract | Pubmed Full Text | CrossRef Full Text | Google Scholar
Ripperger, S., Rehkamper, M., Porcelli, D., and Halliday, A. N. (2007). Cadmium isotope fractionation in seawater - A signature of biological activity. Earth Planet. Sci. Lett. 261, 670–684. doi: 10.1016/j.epsl.2007.07.034
Schmitt, A. D., Galer, S. J. G., and Abouchami, W. (2009). Mass-dependent cadmium isotopic variations in nature with emphasis on the marine environment. Earth Planet. Sci. Lett. 277, 262–272. doi: 10.1016/j.epsl.2008.10.025
Shiel, A. E., Weis, D., and Orians, K. J. (2010). Evaluation of zinc, cadmium and lead isotope fractionation during smelting and refining. Sci. Total Environ. 408, 2357–2368. doi: 10.1016/j.scitotenv.2010.02.016
Pubmed Abstract | Pubmed Full Text | CrossRef Full Text | Google Scholar
Suga, T., Kato, A., and Hanawa, K. (2000). North Pacific tropical water: its climatology and temporal changes associated with the climate regime shift in the 1970s. Prog. Oceanogr. 47, 223–256. doi: 10.1016/S0079-6611(00)00037-9
Sunda, W. G., and Huntsman, S. A. (2000). Effect of Zn, Mn, and Fe on Cd accumulation in phytoplankton: implications for oceanic Cd cycling. Limnol. Oceanogr. 45, 1501–1516. doi: 10.4319/lo.2000.45.7.1501
Uematsu, M., Duce, R. A., Prospero, J. M., Chen, L., Merrill, J. T., and McDonald, R. L. (1983). Transport of mineral aerosol from Asia over the North Pacific Ocean. J. Geophys. Res. 88, 5343–5352. doi: 10.1029/JC088iC09p05343
Wen, L. S., Jiann, K. T., and Santschi, P. H. (2006). Physicochemical speciation of bioactive trace metals (Cd, Cu, Fe, Ni) in the oligotrophic South China Sea. Mar. Chem. 101, 104–129. doi: 10.1016/j.marchem.2006.01.005
Xie, R. C., Galer, S., Abouchami, W., Rijkenberg, M., and De Jong, J. (2014). “Cadmium isotope distribution along the western boundary of the South Atlantic (abstract),” in 2014 Ocean Science Meeting (Honolulu, HI).
Xu, Y., Tang, D., Shaked, Y., and Morel, F. M. (2007). Zinc, cadmium, and cobalt interreplacement and relative use efficiencies in the coccolithophore Emiliania huxleyi. Limnol. Oceanogr. 52, 2294–2305. doi: 10.4319/lo.2007.52.5.2294
Xue, Z., Rehkämper, M., Horner, T. J., Abouchami, W., Middag, R., van de Flierd, T., et al. (2013). Cadmium isotope variations in the Southern Ocean. Earth Planet. Sci. Lett. 382, 161–172. doi: 10.1016/j.epsl.2013.09.014
Xue, Z., Rehkämper, M., Schönbächler, M., Statham, P. J., and Coles, B. J. (2012). A new methodology for precise cadmium isotope analyses of seawater. Anal. Bioanal. Chem. 402, 883–893. doi: 10.1007/s00216-011-5487-0
Pubmed Abstract | Pubmed Full Text | CrossRef Full Text | Google Scholar
Yang, S. C., Lee, D. C., and Ho, T. Y. (2012). The isotopic composition of Cadmium in the water column of the South China Sea. Geochim. Cosmochim. Acta 98, 66–77. doi: 10.1016/j.gca.2012.09.022
Yang, S. H., Ho, T. Y., and Yu, E. F. (2009). Phytoplankton Community Structure in the Northern South China Sea and West Philippine Sea. Taipei, Taiwan: Master thesis, National Taiwan University.
Keywords: Cd isotopes, West Philippine Sea, biogeochemical cycling, physical mixing, GEOTRACES
Citation: Yang S-C, Lee D-C, Ho T-Y, Wen L-S and Yang H-H (2014) The isotopic composition of dissolved cadmium in the water column of the West Philippine Sea. Front. Mar. Sci. 1:61. doi: 10.3389/fmars.2014.00061
Received: 14 July 2014; Accepted: 28 October 2014;
Published online: 14 November 2014.
Edited by:
Sunil Kumar Singh, Physical Research Laboratory, IndiaReviewed by:
Antonio Cobelo-Garcia, Instituto de Investigaciones Marinas - Consejo Superior de Investigaciones Cientificas, SpainTim Mark Conway, Swiss Federal Institute of Technology in Zurich, Switzerland
Copyright © 2014 Yang, Lee, Ho, Wen and Yang. This is an open-access article distributed under the terms of the Creative Commons Attribution License (CC BY). The use, distribution or reproduction in other forums is permitted, provided the original author(s) or licensor are credited and that the original publication in this journal is cited, in accordance with accepted academic practice. No use, distribution or reproduction is permitted which does not comply with these terms.
*Correspondence: Der-Chuen Lee, Institute of Earth Sciences, Academia Sinica, 128, Sec. 2, Academia Rd., Nankang, Taipei 115, Taiwan e-mail:ZGNsZWVAZWFydGguc2luaWNhLmVkdS50dw==