 Jay J. Lunden
 Conall G. McNicholl
 Christopher R. Sears1
 Cheryl L. Morrison
 Erik E. Cordes
- 1Department of Biology, Temple University, Philadelphia, PA, USA
- 2United States Geological Survey, Leetown Science Center, Kearneysville, WV, USA
Changing global climate due to anthropogenic emissions of CO2 are driving rapid changes in the physical and chemical environment of the oceans via warming, deoxygenation, and acidification. These changes may threaten the persistence of species and populations across a range of latitudes and depths, including species that support diverse biological communities that in turn provide ecological stability and support commercial interests. Worldwide, but particularly in the North Atlantic and deep Gulf of Mexico, Lophelia pertusa forms expansive reefs that support biological communities whose diversity rivals that of tropical coral reefs. In this study, L. pertusa colonies were collected from the Viosca Knoll region in the Gulf of Mexico (390 to 450 m depth), genotyped using microsatellite markers, and exposed to a series of treatments testing survivorship responses to acidification, warming, and deoxygenation. All coral nubbins survived the acidification scenarios tested, between pH of 7.67 and 7.90 and aragonite saturation states of 0.92 and 1.47. However, net calcification generally declined with respect to pH, though a disparate response was evident where select individuals net calcified and others exhibited net dissolution near a saturation state of 1. Warming and deoxygenation both had negative effects on survivorship, with up to 100% mortality observed at temperatures above 14°C and oxygen concentrations of approximately 1.5 ml· l−1. These results suggest that, over the short-term, climate change and OA may negatively impact L. pertusa in the Gulf of Mexico, though the potential for acclimation and the effects of genetic background should be considered in future research.
Introduction
Human activities are driving noticeable alterations to the Earth's oceans, primarily via warming, deoxygenation, and acidification (Hoegh-Guldberg and Bruno, 2010). As a result of the oceans' uptake of anthropogenic CO2, drastic changes are expected to occur to the marine environment throughout the current century and beyond (Solomon et al., 2009). Sea surface temperatures increased on average by 0.6°C over the past 100 years, and ongoing warming may result in future increases of as much as 4°C (Solomon et al., 2007; IPCC, 2013). Through processes such as meridional transport and downwelling (Bryan, 1982; Hall and Bryden, 1982), heat and oxygen from photosynthesis are transported to the deep ocean (Barnett et al., 2001, 2005; Levitus, 2005). However, deep-water ventilation may be reduced as ocean temperatures increase, resulting in an expansion of oxygen minimum zones in the deep sea (Keeling et al., 2010; Stramma et al., 2010). Furthermore, absorption of anthropogenic CO2 by the oceans alters the equilibrium of dissolved inorganic carbon thereby decreasing pH and calcium carbonate saturation. At the current rate of CO2 emissions, surface seawater pH is projected to decrease by 0.4 units by the year 2100 (Caldeira and Wickett, 2003). In addition to decreasing surface seawater pH, anthropogenic CO2 is transported to deeper waters by the same processes listed above, driving the shoaling, or upward movement, of the aragonite saturation horizon (Orr et al., 2005; Guinotte et al., 2006) with potentially negative effects on organisms across a range of depths and latitudes.
The emerging consequences of global climate change (GCC) described above are manifest across the spectrum of biological organization, with a variety of responses observed at the individual, population, community, and ecosystem levels (Walther et al., 2002; Peck, 2011). This may result in a drastic reduction in global biodiversity with deleterious impacts to environmental stability, ecosystem function, and society (Cooley and Doney, 2009; Turley et al., 2010). Despite these changes, many extant species possess physiological and behavioral mechanisms to either cope with or escape from the effects of GCC, including acclimatization, adaptation, and range or habitat shifts through migration. Since these mechanisms operate principally at the individual and population levels, it is prudent to investigate the impacts of GCC at these scales. Furthermore, the role of individual plasticity in acclimatization is important to consider while predicting species and population persistence on a rapidly changing planet.
One of the most abundant and widely distributed deep-sea corals is the scleractinian Lophelia pertusa (Linnaeus, 1758), a reef-forming species that occurs on hard substrata at depths from 40 to 3300 m (Strømgren, 1971; Zibrowius, 1980) across the globe (Roberts et al., 2009). The distribution of L. pertusa is largely controlled by environmental factors such as temperature, oxygen saturation, food supply, and carbonate chemistry (Roberts et al., 2009; Georgian et al., 2014). L. pertusa is typically found in areas with hard substrata where temperatures range from 4 to 12°C, dissolved oxygen ranges from 3 to 5 ml· l−1, and the aragonite saturation state is greater than 1 (Freiwald et al., 2004; Guinotte et al., 2006). However, the specific environmental conditions experienced by individual colonies of L. pertusa are dependent on both bathymetric and geographic location. The best documented occurrences of L. pertusa are in the Northeast Atlantic Ocean surrounding Norway, the United Kingdom, and Ireland at depths primarily from 200 to 1000 m where temperatures range from 6 to 8°C (Zibrowius, 1980; Frederiksen et al., 1992; Freiwald et al., 2004) and dissolved oxygen ranges from 3 to 6 ml· l−1 (Freiwald, 2002; Wisshak et al., 2005). Outside of this area, L. pertusa occurs in the Mediterranean Sea at depths below 200 m and is associated with higher temperatures from 12.5 to 14°C (Tursi et al., 2004; Freiwald et al., 2009). Populations of L. pertusa also occur along the Atlantic coast of the United States and in the Gulf of Mexico. In the Gulf of Mexico, L. pertusa reefs are typically found at depths from 300 to 600 m at intermediate temperatures of 8–12°C and relatively low aragonite saturation states of 1.2–1.5 (Cordes et al., 2008; Mienis et al., 2012; Lunden et al., 2013). The range in pH experienced by L. pertusa is described only in a few studies, and reports range from 7.94 to 8.08 in the North Atlantic (Form and Riebesell, 2012; Brooke and Ross, 2014) and from 7.85 to 8.03 in the Gulf of Mexico (Lunden et al., 2013). Dissolved oxygen values at L. pertusa habitats in the Gulf of Mexico are typically in the 2.7–2.8 ml l−1 range (Davies et al., 2010; Schroeder, 2002), although values as low as 1.5 ml· l−1 have been observed near L. pertusa colonies (Georgian et al., 2014). However, these values are likely to be episodic and long-term (i.e., monthly to annual) data are currently lacking.
Previous studies of global change impacts on L. pertusa have predominately been performed on individuals from the Northeast Atlantic and Mediterranean populations. Dodds et al. (2007) found that metabolic rate in L. pertusa from the Mingulay Reef Complex was sensitive to ocean deoxygenation despite surviving short periods of anoxia. Naumann et al. (2014) obtained evidence of thermal acclimation to decreased temperature in L. pertusa from the Mediterranean, but it is not presently known if this capacity exists for ocean warming. The effects of ocean acidification on L. pertusa metabolism were recently investigated by Maier et al. (2013a), and the authors observed no significant decreases in respiration rate in response to elevated pCO2. Studies on calcification in L. pertusa from the Northeast Atlantic and the Mediterranean have mixed results, with observations of short-term decreases in net calcification followed by acclimation to increased pCO2 in the Northeast Atlantic (Form and Riebesell, 2012) and conflicting observations of no change in calcification rate due to increased pCO2 over several months from the Mediterranean (Maier et al., 2013b). The only published laboratory experiment on L. pertusa from the Gulf of Mexico identified an upper thermal limit of 15°C after 7 days (Brooke et al., 2013).
This study investigated the effects of ocean warming, deoxygenation, and acidification on survivorship and calcification in L. pertusa from the Gulf of Mexico. Due to anthropogenic changes to the physical and chemical properties of seawater, L. pertusa is likely to experience increased energetic demands associated with homeostasis and calcification, and therefore its persistence may be compromised in a changing ocean. Here, in a series of short-term experiments in the laboratory, we measured survivorship of L. pertusa colonies exposed to varying regimes of temperature, pH, and dissolved oxygen; furthermore, we measured net calcification of L. pertusa as a function of pH. The purpose of these experiments was to obtain physiological response data on L. pertusa from the Gulf of Mexico.
Materials and Methods
Collection Site Description
The principal collection sites for this study are located in the Viosca Knoll leasing area designated by the U.S. Bureau of Ocean Energy Management (BOEM). Two expansive Lophelia reefs occur within two lease blocks of the VK area, VK906 (385–400 m depth, 29.07°N 88.38°W) and VK826 (390–550 m depth, 29.15°N 88.01°W). The physical environment of the two sites is similar: temperatures at VK906 range from 8 to 12.5°C and from 6.5 to 11.6°C at VK826, while salinity at both sites ranges from 34.9 to 35.4 (Mienis et al., 2012; Georgian et al., 2014; Lunden et al., 2014). Observations of dissolved oxygen concentrations from the two sites range from 1.5 to 3.4 ml· l−1, with mean dissolved oxygen near 3 ml· l−1 (Davies et al., 2010; Georgian et al., 2014). The carbonate chemistry parameters at the two sites are also similar, with pH ranging from 7.85 to 8.03 and aragonite saturation state (Ωarag) ranging from 1.3 to 1.6 (Lunden et al., 2013). Gene flow between the two sites is likely high given that L. pertusa populations in this area of the Gulf are considered panmictic (Morrison et al., 2011).
Coral Collection, Preparation, and Maintenance
Forty-one nubbins of L. pertusa used in the experiments were collected in November 2010 on the NOAA Ship Ronald H. Brown with ROV Jason II as part of the “Lophelia II” project jointly sponsored by the Bureau of Ocean Energy Management and the NOAA Office of Ocean Exploration and Research in the Gulf of Mexico (GoM). Permits for the collection of corals were obtained from the U.S. Department of the Interior prior to any collection activities. Spatially discrete coral branches were collected with the ROV and placed in temperature-insulated bioboxes (volume = ~20 l) at depth. Upon return to the surface, corals were kept alive in 20 l aquaria in the ship's constant-temperature room. Partial water changes were made regularly while at sea. Upon return to port, corals were immediately transported overnight to the laboratory on wet ice.
In the laboratory, corals were maintained in one of two 570 liter recirculating aquaria systems at temperature 8°C and salinity 35 ppt (Lunden et al., 2014). Regular partial water changes (15–20%) were performed with seawater made using Instant Ocean® sea salt. Submersible power heads were placed in each holding tank to ensure water movement and turbulence sufficient to cause swaying of coral polyps. Corals were fed three times weekly using a combination of MarineSnow® Plankton Diet (Two Little Fishies, Miami Gardens, FL) and freshly hatched Artemia nauplii.
Prior to experimental manipulations, coral nubbins were fixed to 1” PVC male adapters using HoldFast epoxy forming coral “nubbins” to minimize handling effects. Monofilament line (diameter = 0.30 mm) was looped through the base of each PVC adapter to allow for buoyant weighing of the coral branch. All coral nubbins weighed less than 60 g in seawater. Weights were corrected for the buoyant weight of the base to which they were attached.
For population genetic analyses, small fragments of 240 L. pertusa colonies from nine localities in the GoM (Garden Banks, Green Canyon, Mississippi Canyon 751, Gulf Oil and Gulf Penn shipwrecks, VK906, VK862, VK826, West Florida Slope) were collected during four GoM cruises between August 2009 and November 2010. Sampling occurred during August-September of 2009 and October-November 2010, aboard the R/V Ronald H. Brown (NOAA) using the remotely operated vehicle (ROV) Jason II (Woods Hole Oceanographic Institute); aboard the R/V Seward Johnson using the Johnson-Sea-Link II (Harbor Branch Oceanographic Institute) submersible in September 2009, as well as aboard the R/V Cape Hatteras using the Kraken II ROV (University of Connecticut) in September-October 2010. Additionally, 16 samples from the eastern Atlantic Ocean (Sula Ridge and Nordleska Reef) were collected aboard the R/V Poseidon in September 2011. Once onboard the vessel, small tissue samples were preserved in 95% ETOH and FTA® Technology Classic card (Whatman®).
Coral Genotyping
All nubbins were swabbed for genotyping prior to experimental assignment and no mortality resulted from swabbing. Genotyping was conducted to ensure that multiple genotypes of corals were present in the experimental cohorts, i.e., that one set of experiments did not include an entire set of clones and that each treatment contained a mixture of genotypes. Coral nubbins were haphazardly assigned to each series of experiments prior to genotyping results. Total DNA was extracted from swabs taken from experimental L. pertusa nubbins and FTA cards using the PureGene DNA extraction kit (Gentra Systems Inc., Minneapolis, Minnesota). Six L. pertusa microsatellite loci (LpeA5, LpeC44, LpeC151, LpeC142, LpeD3, Morrison et al., 2008; Lpeg62, Molecular Ecology Resources database entry 51059) were amplified from 41 swab extracts in 20 μL PCR reactions following the conditions in Morrison et al. (2008). Additionally, 240 L. pertusa samples from 9 localities in the GoM and 16 samples from the eastern Atlantic Ocean (Sula Ridge and Nordleska Reef) were genotyped at 8 microsatellite loci (LpeA5, LpeC44, LpeC52, LpeC61, LpeC142, LpeC151, LpeD3, and LpeD5, Morrison et al., 2008). Fluorescent DNA fragments were electrophoresed on an ABI 3130xl Genetic Analyzer with GeneScan-500 ROX size standard. Alleles were scored using GeneMapper v. 4.1 fragment analysis software (Applied Biosystems). Individuals with identical multilocus genotypes (MLGs) were identified and the probability of identity (PI; i.e., the probability of two individuals sharing the same MLG) was calculated using GenAlEx 6.501 software (Peakall and Smouse, 2006, 2012). To assess inter-regional patterns of connectivity, MLG data from 195 L. pertusa individuals collected at seven localities in the northwestern Atlantic Ocean, off the southeastern U.S. (SEUS), two New England Seamounts (Manning and Rehoboth), and five eastern North Atlantic populations (Rockall Bank, Mingulay Reef, Sula Ridge, Trondheimfjord and Nordleska), plus an additional 108 L. pertusa samples from 4 localities in the GoM, were included in several analyses (see Table S1 and Morrison et al., 2011 for details).
The probability of identity (PI, the probability of two unrelated individuals sharing the same genotype) was calculated for increasing locus combinations using GenAlEx. A Bayesian model-based clustering approach (Pritchard et al., 2000) implemented in STRUCTURE v. 2.3.2 (Hubisz et al., 2009) was used to describe genetic relationships among individuals. This method infers the number of genetic clusters (K) from MLG data by minimizing Hardy-Weinberg and linkage disequilibrium among loci within groups, assigning individuals (probabilistically) to each cluster. Because models utilizing collection location information as priors are useful for small data sets and weak structuring (Hubisz et al., 2009), locality designations were included as priors. Settings for all runs also included an admixture model (i.e., individuals may have mixed ancestry), correlated allele frequencies (Falush et al., 2003), and 20,000 Markov Chain Monte Carlo (MCMC) iterations after a burn-in of 10,000 iterations. Twenty independent chains were run to test each value of K from K = 1–23. The optimum number of clusters was determined by evaluating the values of K as the highest mean likelihood of the probability of the number of clusters given the data observed (LnP(D), Pritchard et al., 2000), and comparing that with Δ K (Evanno et al., 2005) as compiled and graphed using STRUCTURE Harvester v.0.56.1 (Earl, 2009). Each cluster identified in the initial STRUCTURE run was analyzed separately using the same settings to identify potential within-cluster structure since detection of fine-scale structuring can be limited with large data sets (see Jakobsson et al., 2008). The software CLUMPP v.1.2 (Jakobsson and Rosenberg, 2007) was used to merge the results of the 20 runs per K. DISTRUCT v.1.1 (Rosenberg, 2004) were used to visualize merged run results.
Experimental Design and General Setup
Three single-factor experiments were conducted in this study: pH (“acidification”), temperature (“warming”), and dissolved oxygen (“deoxygenation”). Each experiment consisted of 3–5 treatments (Table 1). All experiments were conducted in a constant-temperature room in the laboratory (see Lunden et al., 2014, for complete description of experimental aquaria). Three 75-l aquaria (“tall” type: 61 × 33 × 43 cm) with individual Hagen® AquaClear® 30 filtration units (Drs. Foster & Smith, Rhinelander, WI) and Pinpoint® pH controllers (American Marine Inc., Ridgefield, CT) were used for each treatment (3 to 5 depending on experiment) within each experiment. Each treatment lasted for a total of 15 days, with an initial 8-day conditioning period to allow the corals to acclimate to the experimental tank conditions. Treatments were separated by 3-week “recovery” periods in all experimental series.
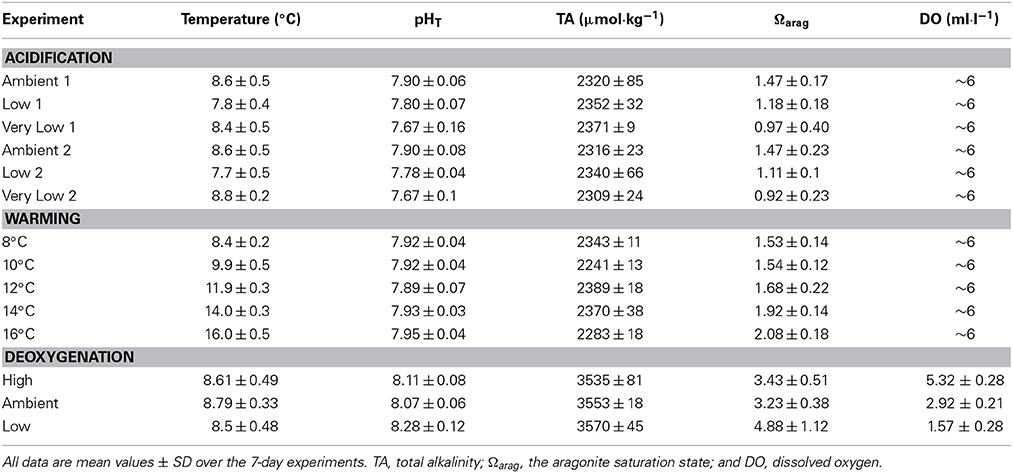
Table 1. Tank conditions for the different experiments.
The acidification experiment consisted of three separate treatments and was conducted in sequence at ambient pH (7.90), low pH (7.75), and very low pH (7.60) from April 2011 to January 2012. Experimental incubations were maintained at temperature 8°C and salinity 35 ppt. pH was controlled by injection of CO2 using a Pinpoint® pH controller (American Marine Inc., Ridgefield, CT). pH electrodes were calibrated weekly using Tris-HCl and AMP-HCl buffers (Nemzer and Dickson, 2005; Dickson et al., 2007). All of the corals used in the acidification experiment were collected from VK906. Two trials were performed for the acidification experiment with two separate groups of corals (see Results).
The warming experiment consisted of five separate treatments and was conducted in sequence at 8, 10, 12, 14, and 16°C from February to July 2012. Experimental incubations were maintained at pH 7.90 and salinity 35 ppt. To reach the desired temperature for each treatment, the thermostat of the constant-temperature room was adjusted at a rate of 2°C per day. This rate of change is well within the range experienced by L. pertusa in its natural environment, where temperature can change as rapidly as 2.3°C per hour (Brooke et al., 2013). Temperature in each aquarium was recorded daily with a digital thermometer. All of the corals used in the warming experiment were collected from VK906. During the recovery period between the 14 and 16°C treatments, all corals experienced 100% mortality. Because of this, a new set of experimental corals (also from VK826) had to be used for the 16°C experiment. Survivorship was recorded as cumulative survivorship, or the proportion of the original nine coral nubbins surviving.
The deoxygenation experiment consisted of three separate treatments and was conducted in sequence under high DO (5 ml· l−1), ambient DO (3 ml· l−1), and low DO (1ml· l−1) from July to October 2012. Experimental incubations were maintained at temperature 8°C and salinity 35 ppt. In order to manipulate dissolved oxygen concentrations, oxygen-free nitrogen (OFN) gas was bubbled into each tank through an Aqua Medic 1000 CO2 reactor (Drs. Foster & Smith, Rhinelander, WI). Flow of nitrogen was controlled with CGA 580 regulators (Airgas, Inc., Berwyn, PA). Dissolved oxygen concentration in each aquarium was recorded daily with an Orion 5 Star DO/pH meter that was calibrated each day. All of the corals used in the deoxygenation experiment were collected from VK826.
Seawater Preparation and Analyses
Experimental seawater was prepared using Instant Ocean® sea salt at a salinity of 35 ppt. For the acidification and temperature experiments, further modifications were necessary in order to manipulate pH. Since Instant Ocean® produces seawater with a total alkalinity of approximately 3600 μmol·kg−1 (1.5X that of natural oceanic values), 12.1 N HCl was added to reduce the total alkalinity to 2300 μmol·kg−1 (mean total alkalinity at GoM L. pertusa reefs, Lunden et al., 2013). The seawater was then bubbled with oxygen for ~24 h to drive off excess CO2 and to restore pH to the ambient value of 7.90 and then further manipulated for the other treatments (fully described in Lunden et al., 2014). This reduction in total alkalinity of the Instant Ocean seawater® was not performed in the deoxygenation experiments. Because the addition of nitrogen gas removed both O2 and CO2 from the experimental aquaria, dissolved CO2 was reduced in the aquaria and therefore an elevation in pH occurred. Since pH could not be controlled under this scenario, total alkalinity was not manipulated in the deoxygenation experiments.
Total alkalinity was measured twice weekly in each aquarium by potentiometric open-cell titration using a Mettler-Toledo DL15 automatic titrator (Fisher Scientific, Waltham, MA) according to SOP3b (Dickson et al., 2007) with certified reference materials courtesy of A. Dickson (Scripps Institute of Oceanography, La Jolla, CA). pH (total hydrogen scale) was recorded daily using the Pinpoint® pH controller (American Marine Inc., Ridgefield, CT) calibrated against Tris/HCl and AMP/HCl buffers (Nemzer and Dickson, 2005). The aragonite saturation state was calculated using CO2SYS (Pierrot et al., 2006) with total alkalinity, pH, temperature, and salinity as input variables. Nutrient concentrations (ammonia [NH3], nitrate [NO−3], and nitrite [NO−2]) were measured weekly using API® aquarium test kits (Drs. Foster & Smith, Rhinelander, WI).
Survivorship Measurements
Survivorship was assessed by daily observations of polyp tissue presence and behavior. Final survivorship counts were taken 3 to 4 days following the end of each treatment after transfer to the maintenance tank. Survivorship is reported as percent cumulative mortality.
Calcification Measurements
Net calcification was measured using the buoyant weight technique (Davies, 1989). Coral nubbins were buoyantly weighed at the start and end of each experimental period (days eight and fifteen) using a Denver Instruments SI-64 analytical balance (d = 0.1 mg, Fisher Scientific, Waltham, MA). A weighing chamber was constructed using ½” plexiglass to prevent disturbances from air movement during weighing. Each coral nubbin was transported individually from its respective aquarium to the weighing chamber in a four-liter Pyrex® beaker and suspended from the balance. The buoyant weight was recorded after the coral nubbin stabilized, typically 2 min. Each coral nubbin was weighed three times to determine measurement precision (~2–3 mg). Seawater density was determined in each aquarium by buoyantly weighing a 2.5 cm2 aluminum block with known density (2.7 g· cm−3).
Coral weight in air (i.e., dry weight) was calculated by the following equation:
Where
Wa = coral weight in air (dry weight)
Ww = coral weight in water (buoyant weight)
Dw = density of seawater
SD = coral skeletal density (= 2.82 g· cm−3, Lunden et al., 2013).
Coral growth rate is reported as percent growth per day (%· d−1), which was calculated by the equation:
Where
Gt = growth rate as %· d−1
Mt2 = mass (mg, dry weight) at time 2 (end of experimental period, day 15)
Mt1 = mass (mg, dry weight) at time 1 (start of experimental period, day 8)
T2 = time 2 (end of experimental period, day 15)
T1 = time 1 (start of experimental period, day 8).
Statistical Analyses and Tank Effects
All statistical analyses were performed using JMP10® statistical software. In this study, both parametric and non-parametric statistics were employed. Non-parametric statistics were employed where assumptions of normality were not met, despite endeavors to transform the data (log, square-root). Normality was tested using the Shapiro–Wilk W Test. A coral “individual” is defined as a coral nubbin weighing less than 60 g irrespective of genotype. We elect this definition due to lack of genotypic replication in our original experimental design.
The effect of individual experimental tanks (n = 3) on coral growth was tested by one-way Kruskal–Wallis test of growth rate against tank for each treatment. All but one treatment in this study yielded p > 0.5 for tank effects. The only treatment to fail this threshold was the very low pH treatment for the group 1 corals, where p > 0.05. We note that “accepted practices” typically set p > 0.25 for tank effects, but that exceptions to this rule exist (e.g., Dufault et al., 2012). Therefore, in our subsequent analyses, we ignored the effect of experimental tanks and treated all coral nubbins within the 3 tanks as individual replicates.
Results
Coral Genotyping and Population Genetics
For the 41 experimental L. pertusa samples genotyped, the number of alleles per locus ranged from 3 (Lpeg62) to 11 (LpeC142), with a mean of 7.8. The PI for the six microsatellite loci was 0.000269, or in other words, this combination of microsatellite loci provides adequate power to distinguish among close relatives and clones. There were 30 unique MLGs and 17 samples had identical MLGs (four MLGs represented twice, and two MLGs represented 4–5 times), suggesting that these samples were clones.
In total, 36 of the 41 genotyped coral nubbins were haphazardly assigned to groups and treatments in the laboratory experiments (Table S2). The 36 coral nubbins represented 27 of the 30 unique MLGs, or “genets” identified in the microsatellite analysis. Each of the three experimental series included multiple genetically distinct individuals. For the acidification experiment, two separate groups of 9 coral nubbins were used. The first group of nubbins (“group 1”) consisted of 5 genets and 4 clones, and the second group of nubbins (“group 2”) consisted of 9 genets and no clones. For the warming experiment, one group of 7 genets and 2 clones was used for the 8, 10, 12, and 14°C treatments. A separate group of 9 genets and no clones was used for the 16°C treatment. For the deoxygenation experiment, one group was used and consisted of 9 genets and no clones.
Our regional population genetic analysis of L. pertusa included 601 unique MLGs from 23 localities in the Gulf of Mexico and North Atlantic Ocean (Table S1). These 8 microsatellite loci were highly polymorphic, with a mean of 12.87 alleles per locus across sampling localities (Table S1). Observed heterozygosities were high in the majority of localities (mean 0.654, Table S1, HO), however, heterozygote deficits were detected in most localities (positive FIS, Table S1).
Population structuring was evident at several hierarchical levels based upon successive STRUCTURE analyses (Figure 1). Two population clusters corresponding to the Gulf of Mexico and the North Atlantic Ocean were detected in the full data set (Figure 1A, First round). Additional STRUCTURE runs performed on each initial cluster detected sub-structuring only in the North Atlantic between the Western Atlantic populations off the southeastern U.S. coast and the New England Seamounts plus the Eastern Atlantic (Figure 1B, Second round), but not within the Gulf of Mexico populations examined. Additional sub-structuring was detected within the North Atlantic cluster among the seamounts, the eastern Atlantic, and Sula Ridge populations (Figure 1C, Third round).
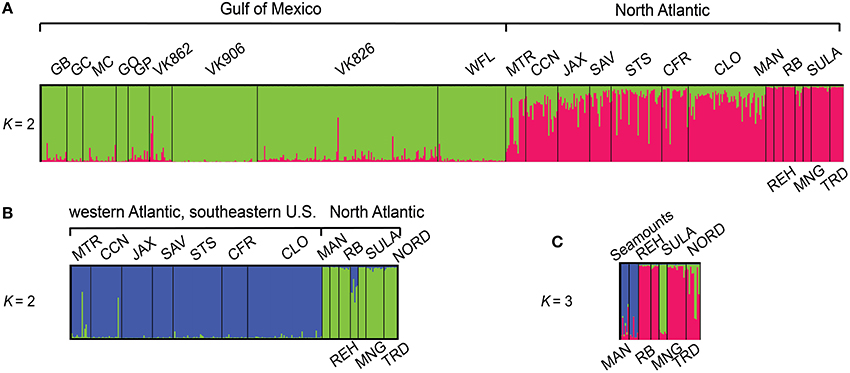
Figure 1. Bar plot showing proportional membership of L. pertusa individuals in K clusters using sequential analyses in the program STRUCTURE. Collection localities, indicated above and below plots, are sorted West to East (A). The North Atlantic cluster contained two additional levels of structuring detected in subsequent STRUCTURE analyses (B,C). Site abbreviations and additional information are provided in Table S1.
Acidification Experiments
The experimental values for pH and additional carbonate chemistry parameters are reported in Table 1. Mean pH varied significantly across all three treatments for both group 1 corals (Kruskal–Wallis test, H = 19.7, p < 0.001) and group 2 corals (Kruskal–Wallis test, H = 30.1, p < 0.001). Temperature was significantly different in both the group 1 experiment (Kruskal–Wallis test, H = 32.03, p < 0.0001) and in the group 2 experiment (Kruskal–Wallis test, H = 17.9, p < 0.0001), and was lower by roughly 0.8–0.9°C from the control experiments. Survivorship was 100% for all treatments and no mortality was observed during the 3-week recovery phases between the acidification treatments.
In the acidification experiments, calcification rate data were collected from eight coral nubbins from each group, for a total of 16 coral nubbins for the entire experiment. One coral nubbin from each group became detached from its PVC fitting during the experiment and was excluded from the analysis. There were no significant differences between group 1 and group 2 corals in number of live polyps (Kruskal–Wallis test, H = −0.464, p = 0.643) or mass (Kruskal–Wallis test, H = −0.893, p = 0.372).
In the ambient pH treatment, all corals exhibited positive net calcification over the experimental period. Net calcification rates among all corals in the ambient pH treatment ranged from 0.002 to 0.091% day−1, with a mean rate of 0.025 ± 0.006% day−1 (n = 16). Group 1 corals exhibited a mean net calcification rate of 0.011 ± 0.004% day−1 (n = 8), and group 2 corals exhibited a mean net calcification rate of 0.039 ± 0.01% day−1 (n = 8).
Calcification rate was highly variable among all coral nubbins in the low pH treatment; eight coral nubbins exhibited net dissolution, and eight coral nubbins exhibited positive net calcification. Calcification rate in the low pH treatment for all coral nubbins ranged from −0.04 to 0.02% day−1, with a mean of −0.003 ± 0.003% day−1 (n = 16). Despite the slightly decreased temperature in the low pH treatments, this did not have a significant effect on the net calcification of the individuals tested (Two-Way ANOVA, t = 1.61, p = 0.158). There was no significant interaction between pH and temperature (p = 0.055). The two coral groups responded differently in the low pH treatment. Group 1 corals calcified at a rate of 0.01 ± 0.003% day−1 (n = 8). However, group 2 corals exhibited net dissolution in the low pH treatment at a rate of −0.01 ± 0.004% day−1 (n = 8).
In the very low pH treatment, 15 of 16 coral nubbins exhibited net dissolution. Calcification rate for all coral nubbins in the very low pH treatment ranged from −0.024 to 0.012% day−1, with a mean rate of −0.007 ± 0.002% day−1 (n = 16). Group 1 corals dissolved at a rate of −0.008 ± 0.003% day−1 (n = 8) and group 2 corals dissolved at a rate of −0.005 ± 0.003% day−1 (n = 8).
The relationship between net calcification and pH was assessed with both a local regression (LOESS, Figure 2) and linear regression. The local regression (R2 = 0.3349) shows two apparent responses to changes in pH, a sharp decline in calcification from the ambient pH treatment to the low pH treatment, and a slight decline in calcification from the low pH treatment to the very low pH treatment. Results from the linear regression (R2 = 0.238, data not shown) suggest an average threshold pH of 7.73 ± 0.06 and aragonite saturation state of 1.05 ± 0.2 for net calcification to occur in the individuals examined.
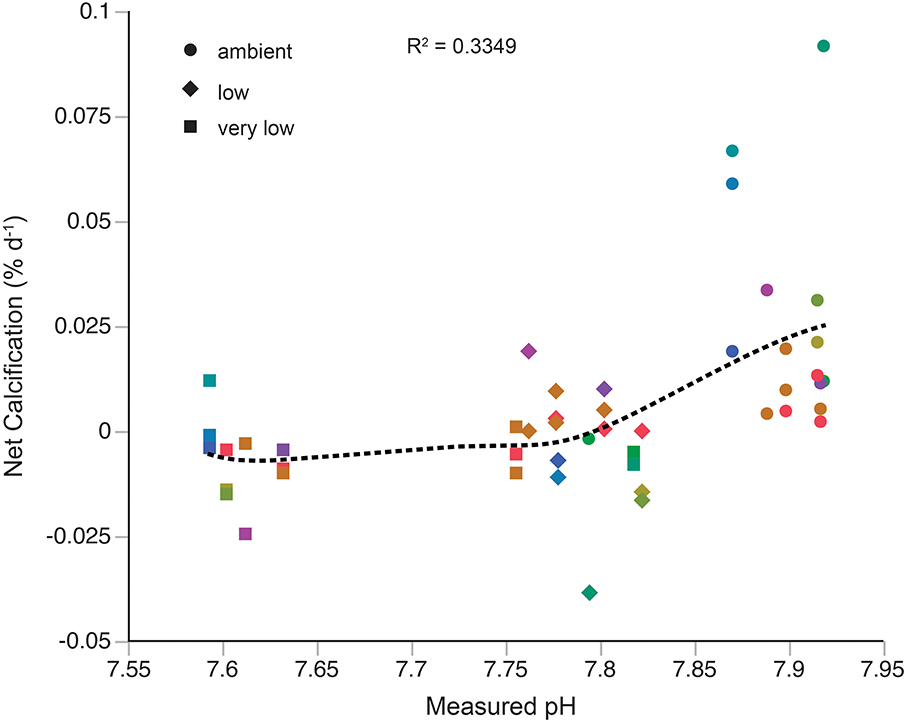
Figure 2. L. pertusa calcification responses to acidification treatments. Each color represents a unique genotype. Dashed black line represents a linear local regression (LOESS) of calcification data against measured pH.
Warming Experiments
In the warming experiments, temperature was significantly different across all treatments (Kruskal–Wallis test, H = 92.1, p < 0.001). Mean pH across all temperature treatments was 7.92 ± 0.05. In the 16°C experiment, pH was significantly higher than all other temperature treatments (mean of 7.95 compared to means of 7.89–7.93 for other treatments, Kruskal–Wallis test, H = 10.7, p = 0.0303). There was no significant interaction between pH and temperature in this set of experiments (Two-Way ANOVA, t = −0.30, p = 0.817). Ωarag varied significantly among treatments (Kruskal–Wallis test, H = 63.5, p < 0.001) and was not statistically different between the 8 and 10°C experiments (Mann–Whitney test, U = 0.028, p = 0.978). Mean temperatures and other relevant variables for each treatment are reported in Table 1.
Cumulative survivorship of L. pertusa differed significantly among temperature regimes after 7 days at each treatment (Figure 3A,B, Kruskal–Wallis test, H = 33.97, p < 0.001). Survivorship was 100% in the control treatment (8°C) and decreased in each successive treatment. At 10°C, survivorship was 86.7 ± 6.2% (mean ± SE, n = 9). At 12°C, survivorship was 69.9 ± 6.1% (mean ± SE, n = 9). At 14°C, survivorship was 53.6 ± 8.5% (mean ± SE, n = 9), though all individuals suffered 100% mortality during the recovery phase following this treatment (within 3 weeks of the conclusion of the 14°C treatment). Survivorship of the second set of nine experimental corals was 0% in the 16°C treatment.
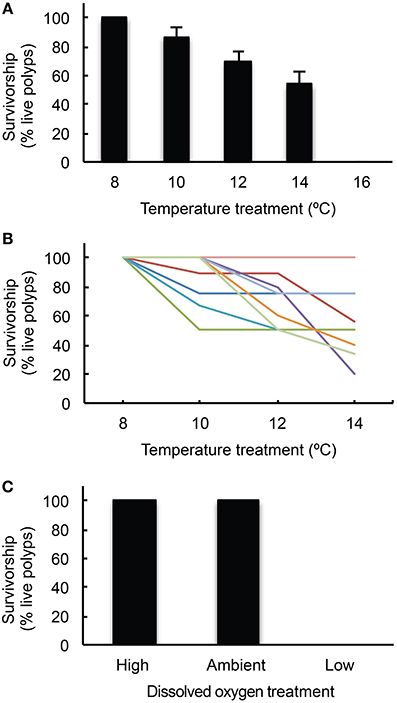
Figure 3. L. pertusa survivorship responses. (A) Mean ± SE (n = 9) cumulative survivorship of L. pertusa from temperature treatments in the warming experiment; (B) Cumulative survivorship* of individual L. pertusa genets in the warming experiment where each color indicates a unique genotype; (C) Mean ± SE (n = 9) cumulative survivorship of L. pertusa from dissolved oxygen treatments in the deoxygenation experiment. *Note that in the 14°C experiment, all corals died during the recovery phase in the maintenance aquaria. It is unclear if this was due to a delayed onset of stress from the 14°C treatment or by accumulated stress from the prior temperature experiments (8, 10, and 12°C).
For this set of experiments, several corals were used from the acidification experiments described above (Table S2). To test for carry-over effects on individuals used from the acidification experiments, a “previous treatment” factor was included in the analysis and there was a significant effect on coral survivorship (Two-Way ANOVA, t = 3.49, p = 0.002). Even though they were not used in any previous experiments, all of the corals exposed to 16°C suffered complete mortality.
Deoxygenation Experiments
In the deoxygenation experiments, DO was significantly different across all treatments (Kruskal–Wallis test, H = 474.7, p < 0.001) and all treatment values are reported in Table 1. Temperature was not significantly different across treatments in this experiment (Kruskal–Wallis test, H = 2.41, p = 0.3). Survivorship of L. pertusa was 100% at both the high and ambient dissolved oxygen treatments. However, survivorship decreased to 0% in the low treatment (DO = 1.57 ± 0.28 ml· l−1, Figure 3C). No mortality was observed during the recovery phases between the deoxygenation treatments. The pH in the low deoxygenation treatment was significantly higher than the high and ambient treatments (Kruskal–Wallis test, H = 22.96, p < 0.001). This is likely due to the addition of nitrogen gas, which removed dissolved CO2 (and O2) and consequently elevated pH.
Discussion
In the present study, the survivorship responses of the deep-sea coral L. pertusa were tested against experimental perturbations simulating those projected to occur in the near future from ongoing GCC and ocean acidification in the Gulf of Mexico. Survivorship and calcification responses of individual L. pertusa colonies to ocean acidification were tested and the corals exhibited a variable response at pH ~7.75 whereby some individuals net calcified at rates similar to the controls and others exhibited net dissolution. However, all but one of the individuals exhibited net dissolution at the lowest pH tested (pH 7.60). Exposure to temperatures above 14°C for 7 days led to eventual mortality, while exposure to oxygen concentrations of 1.5 ml· l−1 proved fatal to the corals after 7 days. It is important to note that while these results agree well with prior studies on L. pertusa that were conducted in a similar manner (e.g., Dodds et al., 2007; Brooke et al., 2013), we cannot rule out the effects of cumulative exposures on mortality in these experiments (as described above in the Methods). As the impacts of GCC and ocean acidification continue to proliferate, it will be necessary to investigate potential mechanisms that species possess in order to cope with or escape from the associated stresses of GCC.
The present study is among the first to explore the impacts of global ocean change on a species of deep-sea coral from the Gulf of Mexico. While deep-sea corals are widely distributed throughout the deep Gulf of Mexico (e.g., Cordes et al., 2008; Quattrini et al., 2014), little is known about their responses to projected future ocean changes. Related studies have investigated the impacts of changes in temperature, oxygen, and pH on L. pertusa, but these have been entirely restricted to areas within the Northeast Atlantic Ocean (Dodds et al., 2007; Maier et al., 2009; Form and Riebesell, 2012) and the Mediterranean Sea (Maier et al., 2012, 2013a,b). Existing studies and the population genetics work presented here support the existence of regional populations of L. pertusa across the North Atlantic Ocean with restricted gene flow (Morrison et al., 2011). Genetic diversity and connectivity among coral populations is dependent on several factors, including life history, geographic location, and physical environment (Huston, 1985; Hughes, 1989; Selkoe et al., 2010; Maina et al., 2011). High genetic diversity may be found in populations that experience frequent or intense disturbances while more clonal populations are generally found in relatively stable environments due to the success of locally adapted genotypes and lack of space for subsequent recruitment (Hunter, 1993); however, this relationship may vary with respect to species (Coffroth and Lasker, 1998). Long-term monitoring of L. pertusa habitats in the Northeast Atlantic reveals relatively stable environmental conditions, with recorded temperature variations typically near 1°C, but episodic variations near 3°C (Mienis et al., 2007). A similar dataset from the Gulf of Mexico shows a wider temperature range of up to 5°C (Mienis et al., 2012). As would be predicted, the structure of the Northeast Atlantic L. pertusa population appears to be highly clonal (Waller and Tyler, 2005) and genetically isolated from the Gulf of Mexico population (Morrison et al., 2011). Therefore, the results presented here offer new insight into the responses of L. pertusa from a region that is genetically discrete and yet to be rigorously studied in the context of global ocean change.
Results from the acidification experiment show considerable variation in calcification rate among individuals. The most pronounced variability was observed in the ambient pH treatment (Figure 2), where calcification rates spanned a range of ~0.08% day−1. In general, growth rates of L. pertusa are highly variable (reviewed in Roberts et al., 2009), and are typically much slower than zooxanthellate corals due to the lack of photosynthetic input to calcification (Al-Horani et al., 2003, but see Orejas et al., 2011) and temperature differences of their natural environments. Several studies of L. pertusa growth rate show allometric patterns, the differential growth of select parts of a colony relative to the whole (e.g., Mortensen, 2001; Gass and Roberts, 2006; Brooke and Young, 2009), with younger polyps growing significantly faster than older polyps (Maier et al., 2009). Furthermore, periods of active and arrested growth within individual colonies have also been reported (Mortensen, 2001), suggesting episodic growth. While sampling, we exerted great effort to obtain terminal ends of L. pertusa branches, and used entirely live colonies in the experiments. However, the combination of allometric and episodic growth patterns in L. pertusa may still explain some of the highly variable growth rates obtained at ambient pH in the present study, and our results agree well with previous studies under similar carbonate chemistry conditions (Form and Riebesell, 2012; Maier et al., 2012, 2013b). While a linear response to acidification may be more intuitive (but also see Ries et al., 2010), the high variability in net calcification rates at ambient conditions is better captured by the LOESS curve (Figure 2). Furthermore, the LOESS curve suggests varied responses to changes in pH, where calcification initially declines sharply below ambient conditions, and then exhibits a slow decline from the low pH treatment to the very low treatment. This response may indicate a biological “tipping point” for acidification that has been observed in other calcification-dependent invertebrates (Dorey et al., 2013). At this point in time, there are no high-resolution temporal pH data for L. pertusa habitats, so it is unknown how much variability in pH this species experiences naturally. If L. pertusa does not naturally experience wide variability in pH in the Gulf of Mexico, it may explain the sharp decline in calcification below ambient conditions observed here.
Previous studies of L. pertusa's sensitivity to ocean acidification have revealed a variety of responses. Using specimens from the North Atlantic in a long-term experiment, Form and Riebesell (2012) exposed L. pertusa to varying levels of pCO2 ranging from 600 to 980 μ atm, corresponding to a pH range of 7.94 to 7.76. They observed a short-term shock response manifest as a reduction in L. pertusa calcification rate over the short-term (8 days), but found that after 6 months L. pertusa accreted new skeletal material in the high CO2 treatment at comparable rates to the control, implying acclimation to high CO2. In similar studies, L. pertusa from the Mediterranean Sea was used in experiments with pCO2 treatments ranging from 380 to 930 μ atm, spanning a pH range of 8.14 to 7.73, and found no differences in respiration rate (Maier et al., 2013a) or calcification rate (Maier et al., 2013b).
The findings of the present study may reconcile these disparate results regarding calcification rates. Neither Form and Riebesell (2012) nor Maier et al. (2013b) performed genotypic analyses on their L. pertusa samples, meaning clones may have been used in the experiments, particularly if samples were collected from a limited number of locations. Prior work on L. pertusa in the Northeast Atlantic supports the existence of a highly clonal population within this area (LeGoff-Vitry et al., 2004; Waller and Tyler, 2005). Furthermore, if the genetic variability within a single panmictic population is sufficient to generate a variable response to OA, as may be occurring in the Gulf of Mexico, then one would expect to observe more significant differences among genetically isolated populations such as the North Atlantic and Mediterranean (Figure 1). The existence of “OA-hardy” genotypes has been observed in other taxonomic groups (Iglesias-Rodriguez et al., 2008; Langer et al., 2009; Pistevos et al., 2011; Parker et al., 2012), and such genotypes may also occur within the Gulf of Mexico population of L. pertusa (Figure 2), though further studies are required. Calcification responses of corals and other taxa to ocean acidification are generally complex (Langdon and Atkinson, 2005; Ries et al., 2009), and some of this complexity may be attributed to the inherent genetic diversity within experimental populations.
Temperature is one of the most important abiotic controllers of species' distributions including cold-water corals (Roberts et al., 2009; Davies and Guinotte, 2011). Individual sensitivity to thermal stress is tightly linked to ephemeral physiological mechanisms such as the heat shock response, which permits tolerance to short-term heat (and other) stress through the actions of molecular chaperones (Feder and Hofmann, 1999). The limit for onset of the heat shock response is coupled to an individual's thermal history (O'Donnell et al., 2009). Although it inhabits relatively stable thermal regimes compared to tropical coral species, L. pertusa experiences episodic short-term temperature excursions of 2 to 5°C in the Gulf of Mexico (Mienis et al., 2007, 2012; Davies et al., 2010). Previous studies of individuals from the Gulf of Mexico population suggest that L. pertusa is able to tolerate short-term (24 h) temperature stress at 15°C without any noticeable effects on survivorship, but prolonged exposure (7 days) at 15°C induces significant mortality (Brooke et al., 2013). The present study agrees to an extent with these results, but the data here indicate that some of the individuals of L. pertusa examined are sensitive to prolonged (7 days) exposure to temperatures sustained at 10°C and greater. The presence of a significant effect of previous treatment in the temperature experiment suggests that carry-over effects from the acidification experiments may be influencing the corals' responses to temperature stress. A potential driver of this significant effect of previous treatment may be that all corals used in the 16°C treatment suffered complete mortality. However, all of the corals used in the 16°C treatment had not been used previously, suggesting that the significant effect of previous treatment was biased. In order to further resolve this, future experiments on L. pertusa could avoid using corals in multiple experiments. However, from a logistical perspective, this may be challenging, as deep-sea corals require considerable effort and resources to collect and maintain. Our data also suggest that some individuals have wider tolerances to temperature (Figure 3B), which may be linked to differential expression of the heat shock response pathways. Future research should also explore the molecular basis of this tolerance and its role in ocean warming, and if this tolerance is linked to specific genotypes of L. pertusa.
Like temperature, dissolved oxygen concentration also plays a significant role in controlling L. pertusa distribution (Dodds et al., 2007; Georgian et al., 2014). Previous work has explored the metabolic tolerance of L. pertusa to various oxygen concentrations, and found that L. pertusa is unable to maintain aerobic respiration at oxygen concentrations less than 3.26 ml· l−1 at 9°C (Dodds et al., 2007). However, this work was performed on samples from the Northeast Atlantic, where the mean local oxygen concentration was 6.10 ml· l−1. Oxygen concentrations ranging from 1.5 to 3.2 ml· l−1 have been reported from the Gulf of Mexico surrounding L. pertusa mounds (Schroeder, 2002; Davies et al., 2010; Georgian et al., 2014), which suggests that L. pertusa from the Gulf of Mexico may possess a lower oxygen threshold for aerobic respiration compared to North Atlantic individuals. The experimental results presented here show that long-term exposure (7 days) at sustained hypoxic conditions near 1.57 ml· l−1 results in complete mortality. This is despite the unavoidable concomitant increase in pH, which would make it energetically favorable for skeletal precipitation. Although in their environment, these exposures to low O2 may not last long enough to inflict significant mortality. At the present time, the L. pertusa populations of the Gulf of Mexico are surviving on the edge of their dissolved oxygen niche. The frequency and duration of hypoxic conditions may increase in the future due to warming and also expansion of the seasonally oxygen-depleted surface layers of the Gulf of Mexico (Rabalais et al., 2002).
Our work here contributes to the growing body of experimental evidence of deep-sea species sensitivity to ocean acidification, warming, and deoxygenation. The observed responses to climate change-related stressors in L. pertusa from the Gulf of Mexico raise new questions related to its persistence in the Anthropocene. Future work should explore variation in response at the individual level, and if certain genotypes possess innate resilience to these stressors. Furthermore, the potential variability of environmental conditions within deep-sea coral habitats should be explored, as this could facilitate the potential for physiological plasticity in species' responses to warming, deoxygenation, and acidification. Such work will enable better management of these habitats as the impacts of global change continue to manifest across the ocean environment.
Conflict of Interest Statement
The authors declare that the research was conducted in the absence of any commercial or financial relationships that could be construed as a potential conflict of interest.
Acknowledgments
We thank N. Remon and S. Campellone for help with animal husbandry and S. Georgian and A. Demopoulos for assistance at sea. We are also very grateful for the technical skills of the ROV Jason group and the captain and crew of the Ronald H. Brown. A special thanks goes to J. Brooks and TDI-Brooks International, Inc., for coordinating logistics for this project, including cruises. Additionally, we thank S. Ross and S. Brooke who coordinated cruises aboard the R/V Seward Johnson and R/V Cape Hatteras that contributed samples for the population genetics work, and M. Springmann who generated the microsatellite data. J. M Roberts and S. Hennige donated samples from their R/V Poseidon cruise in the eastern Atlantic Ocean. We thank two anonymous reviewers for helpful comments on the manuscript. This study was supported by several agencies and awards: the Bureau of Ocean Energy Management (BOEM) and the National Oceanic and Atmospheric Administration (NOAA) Office of Ocean Exploration and Research [contract M08PC20038 to T.D.I. Brooks International, subcontracted to Erik E. Cordes] and the National Science Foundation [OCE-1220478 to Erik E. Cordes]. Financial support for the genetics work was provided by the USGS Outer Continental Shelf Ecosystem Program, sponsored by BOEM. Jay J. Lunden received partial support from the National Science Foundation Bridge to the Doctorate fellowship program. Any use of trade, product, or firm names is for descriptive purposes only and does not imply endorsement by the U.S. government.
Supplementary Material
The Supplementary Material for this article can be found online at: http://www.frontiersin.org/journal/10.3389/fmars.2014.00078/abstract
References
Al-Horani, F. A., Al-Moghrabi, S. M., and de Beer, D. (2003). The mechanism of calcification and its relation to photosynthesis and respiration in the scleractinian coral Galaxea fascicularis. Mar. Biol. 142, 419–426. doi: 10.1007/s00227-002-0981-8
Barnett, T. P., Pierce, D. W., Achuta Rao, K. M., Gleckler, P. J., Santer, B. D., Gregory, J. M., et al. (2005). Penetration of human-induced warming into the world's oceans. Science 309, 284–287. doi: 10.1126/science.1112418
Pubmed Abstract | Pubmed Full Text | CrossRef Full Text | Google Scholar
Barnett, T. P., Pierce, D. W., and Schnur, R. (2001). Detection of anthropogenic climate change in the world's oceans. Science 292, 270–274. doi: 10.1126/science.1058304
Pubmed Abstract | Pubmed Full Text | CrossRef Full Text | Google Scholar
Brooke, S., and Ross, S. W. (2014). First observations of the cold-water coral Lophelia pertusa in mid-Atlantic canyons of the USA. Deep-Sea Res. Pt. II. 104, 245–251. doi: 10.1016/j.dsr2.2013.06.011
Brooke, S., Ross, S. W., Bane, J. M., Seim, H. E., and Young, C. M. (2013). Temperature tolerance of the deep-sea coral Lophelia pertusa from the southeastern United States. Deep-Sea Res. Pt. II. 92, 240–248. doi: 10.1016/j.dsr2.2012.12.001
Brooke, S., and Young, C. M. (2009). In situ measurement of survival and growth of Lophelia pertusa in the northern Gulf of Mexico. Mar. Ecol. Prog. Ser. 397, 153–161. doi: 10.3354/meps08344
Bryan, K. (1982). Poleward heat transport by the ocean: observations and models. Annu. Rev. Earth Pl. Sci. 10, 15–38. doi: 10.1146/annurev.ea.10.050182.000311
Caldeira, K., and Wickett, M. E. (2003). Anthropogenic carbon and ocean pH. Nature 425, 365. doi: 10.1038/425365a
Pubmed Abstract | Pubmed Full Text | CrossRef Full Text | Google Scholar
Coffroth, M. A., and Lasker, H. R. (1998). Population structure of a clonal gorgonian coral: the interplay between clonal reproduction and disturbance. Evolution 52, 379–393. doi: 10.2307/2411075
Cooley, S. R., and Doney, S. C. (2009). Anticipating ocean acidification's economic consequences for commercial fisheries. Environ. Res. Lett. 4:024007. doi: 10.1088/1748-9326/4/2/024007
Cordes, E. E., McGinley, M., Podowski, E. L., Becker, E. L., Lessard-Pilon, S., Viada, S. T., et al. (2008). Coral communities of the deep Gulf of Mexico. Deep-Sea Res. Pt. I. 55, 777–787. doi: 10.1016/j.dsr.2008.03.005
Davies, A. J., Duineveld, G. C. A., Van Weering, T. C. E., Mienis, F., Quattrini, A. M., Seim, H. E., et al. (2010). Short-term environmental variability in cold-water coral habitat at Viosca Knoll, Gulf of Mexico. Deep-Sea Res. Pt. I. 57, 199–212. doi: 10.1016/j.dsr.2009.10.012
Davies, A. J., and Guinotte, J. M. (2011). Global habitat suitability for framework-forming cold-water corals. PLoS ONE 6:e18483. doi: 10.1371/journal.pone.0018483
Pubmed Abstract | Pubmed Full Text | CrossRef Full Text | Google Scholar
Davies, P. S. (1989). Short-term growth measurements of corals using accurate buoyant weighing technique. Mar. Biol. 101, 389–395. doi: 10.1007/BF00428135
Dickson, A. G., Sabine, C. L., and Christian, J. R. (2007). Guide to Best Practices for Ocean CO2 Measurements. PICES Special Publication.
Dodds, L. A., Roberts, J. M., Taylor, A. C., and Marubini, F. (2007). Metabolic tolerance of the cold-water coral Lophelia pertusa (Scleractinia) to temperature and dissolved oxygen change. J. Exp. Mar. Biol. Ecol. 349, 205–214. doi: 10.1016/j.jembe.2007.05.013
Dorey, N., Lancon, P., Thorndyke, M., and Dupont, S. (2013). Assessing physiological tipping point of sea urchin larvae exposed to a broad range of pH. Glob. Change Biol. 19, 3355–3367. doi: 10.1111/gcb.12276
Pubmed Abstract | Pubmed Full Text | CrossRef Full Text | Google Scholar
Dufault, A. M., Cumbo, V. R., Fan, T.-Y., and Edmunds, P. J. (2012). Effects of diurnally oscillating pCO2 on the calcification and survival of coral recruits. Proc. Biol. Sci. 279, 2951–2958. doi: 10.1098/rspb.2011.2545
Pubmed Abstract | Pubmed Full Text | CrossRef Full Text | Google Scholar
Earl, D. A. (2009). Structure Harvester v. 0.56.3. Available online at: http://taylor0.biology.ucla.edu/struct_harvest/
Evanno, G., Regnaut, S., and Goudet, J. (2005). Detecting the number of clusters of individuals using the software STRUCTURE: a simulation study. Mol. Ecol. 14, 2611–2620. doi: 10.1111/j.1365-294X.2005.02553.x
Pubmed Abstract | Pubmed Full Text | CrossRef Full Text | Google Scholar
Falush, D., Stephens, M., and Pritchard, J. (2003). Inference of population structure using multilocus genotype data: linked loci and correlated allele frequencies. Genetics 164, 1567–1587.
Feder, M. E., and Hofmann, G. E. (1999). Heat-shock proteins, molecular chaperones, and the stress response: evolutionary and ecological physiology. Annu. Rev. Physiol. 61, 243–282. doi: 10.1146/annurev.physiol.61.1.243
Pubmed Abstract | Pubmed Full Text | CrossRef Full Text | Google Scholar
Form, A. U., and Riebesell, U. (2012). Acclimation to ocean acidification during long-term CO2 exposure in the cold-water coral Lophelia pertusa. Glob. Change Biol. 18, 843–853. doi: 10.1111/j.1365-2486.2011.02583.x
Frederiksen, R., Jensen, A., and Westerberg, H. (1992). The distribution of the scleractinian coral Lophelia pertusa around the Faroe Islands and the relation to internal tidal mixing. Sarsia 77, 157–171. doi: 10.1080/00364827.1992.10413502
Freiwald, A. (2002). “Reef-forming cold-water corals,” in Series Ocean Margin Systems, eds G. Wefer, D. Billett, D. Hebbeln, B. B. Jorgensen, M. Schluter, and T. Van Weering (Berlin: Springer-Verlag), 365–385.
Freiwald, A., Beuck, L., Rüggeberg, A., Taviani, M., and Hebbeln, D. (2009). The white coral community in the central Mediterranean Sea revealed by ROV surveys. Oceanography 22, 36–52. doi: 10.5670/oceanog.2009.06
Freiwald, A., Fosså, J. H., Grehan, A., Koslow, T., and Roberts, J. M. (2004). Cold-water Coral Reefs. Cambridge, UK: UNEP-WCMC.
Gass, S. E., and Roberts, J. M. (2006). The occurrence of cold-water coral Lophelia pertusa (Scleractinia) on oil and gas platforms in the North Sea: colony growth, recruitment and environmental controls on distribution. Mar. Pollut. Bull. 52, 549–559. doi: 10.1016/j.marpolbul.2005.10.002
Pubmed Abstract | Pubmed Full Text | CrossRef Full Text | Google Scholar
Georgian, S. E., Shedd, W., and Cordes, E. E. (2014). High resolution ecological niche modeling of the cold-water coral Lophelia pertusa in the Gulf of Mexico. Mar. Ecol. Prog. Ser. 506, 145–161. doi: 10.3354/meps10816
Guinotte, J. M., Orr, J., Cairns, S., Freiwald, A., Morgan, L., and George, R. (2006). Will human-induced changed in seawater chemistry alter the distribution of deep-sea scleractinian corals? Front. Ecol. Environ. 4, 141–146. doi: 10.1890/1540-9295(2006)004[0141:WHCISC]2.0.CO;2
Hall, M. M., and Bryden, H. L. (1982). Direct estimates and mechanisms of ocean heat transport. Deep-Sea Res. 29, 339–359. doi: 10.1016/0198-0149(82)90099-1
Hoegh-Guldberg, O., and Bruno, J. F. (2010). The impact of climate change on the world's marine ecosystems. Science 328, 1523–1528. doi: 10.1126/science.1189930
Pubmed Abstract | Pubmed Full Text | CrossRef Full Text | Google Scholar
Hubisz, M. J., Falush, D., Stephens, M., and Pritchard, J. K. (2009). Inferring weak population structure with the assistance of sample group information. Mol. Ecol. Resour. 9, 1322–1332. doi: 10.1111/j.1755-0998.2009.02591.x
Pubmed Abstract | Pubmed Full Text | CrossRef Full Text | Google Scholar
Hunter, C. (1993). Genotypic variation and clonal structure in coral populations with different disturbance histories. Evolution 47, 1213–1228. doi: 10.2307/2409987
Huston, M. A. (1985). Patterns of species diversity on coral reefs. Annu. Rev. Ecol. Evol. S. 16, 149–177. doi: 10.1146/annurev.es.16.110185.001053
Iglesias-Rodriguez, M. D., Halloran, P. R., Rickaby, R. E. M., Hall, I. R., Colmenero-Hidalgo, E., Gittins, J. R., et al. (2008). Phytoplankton calcification in a high-CO2 world. Science 320, 336–340. doi: 10.1126/science.1154122
Pubmed Abstract | Pubmed Full Text | CrossRef Full Text | Google Scholar
IPCC. (2013). “Summary for Policymakers,” in: Climate Change 2013: The Physical Science Basis. Contribution of Working Group I to the Fifth Assessment Report of the Intergovernmental Panel on Climate Change, eds T. F. Stocker, D. Qin, G.-K. Plattner, M. Tignor, S.K. Allen, J. Boschung, et al. Midgley (Cambridge, UK; New York, NY: Cambridge University Press), 1062–1068.
Jakobsson, M., and Rosenberg, N. A. (2007). CLUMPP: a cluster matching and permutation program for dealing with label switching and multimodality in analysis of population structure. Bioinformatics 23, 1801–1806. doi: 10.1093/bioinformatics/btm233
Pubmed Abstract | Pubmed Full Text | CrossRef Full Text | Google Scholar
Jakobsson, M., Scholz, S. W., Scheet, P., Gibbs, J. R., Van Liere, J. M., Fung, H., et al. (2008). Genotype, haplotype and copy-number variation in worldwide human populations. Nature 451, 998–1003. doi: 10.1038/nature06742
Pubmed Abstract | Pubmed Full Text | CrossRef Full Text | Google Scholar
Keeling, R., Körtzinger, A., and Gruber, N. (2010). Ocean deoxygenation in a warming world. Annu. Rev. Mar. Sci. 2, 199–229. doi: 10.1146/annurev.marine.010908.163855
Pubmed Abstract | Pubmed Full Text | CrossRef Full Text | Google Scholar
Langdon, C., and Atkinson, M. J. (2005). Effect of elevated pCO2 on photosynthesis and calcification of corals and interactions with seasonal change in temperature, irradiance and nutrient enrichment. J. Geophys. Res. 110, C09SC07. doi: 10.1029/2004JC002576
Langer, G., Nehrke, G., Probert, I., Ly, J., and Ziveri, P. (2009). Strain-specific responses of Emiliania huxleyi to changing seawater carbonate chemistry. Biogeosciences 6, 2637–2646. doi: 10.5194/bg-6-2637-2009
LeGoff-Vitry, M. C., Pybus, O. G., and Rogers, A. D. (2004). Genetic structure of the deep-sea coral Lophelia pertusa in the northeast Atlantic revealed by microsatellites and internal transcribed spacer sequences. Mol. Ecol. 13, 537–549. doi: 10.1046/j.1365-294X.2004.2079.x
Levitus, S. (2005). Warming of the world ocean, 1955-2003. Geophys. Res. Lett. 32, L02604. doi: 10.1029/2004GL021592
Lunden, J. J., Georgian, S. E., and Cordes, E. E. (2013). Aragonite saturation states at cold-water coral reefs structured by Lophelia pertusa in the northern Gulf of Mexico. Limnol. Oceanogr. 58, 354–362. doi: 10.4319/lo.2013.58.1.0354
Lunden, J. J., Turner, J. M., McNicholl, C. G., Glynn, C. K., and Cordes, E. E. (2014). Design, development, and implementation of recirculating aquaria for maintenance and experimentation of deep-sea corals and associated fauna. Limnol. Oceanogr. Meth. 12, 363–372. doi: 10.4319/lom.2014.12.363
Maier, C., Bils, F., Weinbauer, M. G., Watremez, P., Peck, M. A., and Gattuso, J.-P. (2013a). Respiration of Mediterranean cold-water corals is not affected by ocean acidification as projected for the end of the century. Biogeosciences Discuss. 10, 7617–7640. doi: 10.5194/bgd-10-7617-2013
Pubmed Abstract | Pubmed Full Text | CrossRef Full Text | Google Scholar
Maier, C., Hegeman, J., Weinbauer, M. G., and Gattuso, J.-P. (2009). Calcification of the cold-water coral Lophelia pertusa under ambient and reduced pH. Biogeosciences 6, 1671–1680. doi: 10.5194/bg-6-1671-2009
Pubmed Abstract | Pubmed Full Text | CrossRef Full Text | Google Scholar
Maier, C., Schubert, A., Berzunza Sánchez, M. M., Weinbauer, M. G., Watremez, P., and Gattuso, J.-P. (2013b). End of the century pCO2 levels do not impact calcification in Mediterranean cold-water corals. PLoS ONE 8:e62655. doi: 10.1371/journal.pone.0062655
Pubmed Abstract | Pubmed Full Text | CrossRef Full Text | Google Scholar
Maier, C., Watremez, P., Taviani, M., Weinbauer, M. G., and Gattuso, J.-P. (2012). Calcification rates and the effect of ocean acidification on Mediterranean cold-water corals. Proc. Biol. Sci. 279, 1716–1723. doi: 10.1098/rspb.2011.1763
Pubmed Abstract | Pubmed Full Text | CrossRef Full Text | Google Scholar
Maina, J., McClanahan, T. R., Venus, V., Ateweberhan, M., and Madin, J. (2011). Global gradients of coral exposure to environmental stresses and implications for local management. PLoS ONE 6:e23064. doi: 10.1371/journal.pone.0023064
Pubmed Abstract | Pubmed Full Text | CrossRef Full Text | Google Scholar
Mienis, F., De Stigter, H. C., White, M., Duineveld, G., De Haas, H., and Van Weering, T. C. E. (2007). Hydrodynamic controls on cold-water coral growth and carbonate-mound development at the SW and SW Rockall Trough Margin, NE Atlantic Ocean. Deep-Sea Res. Pt. I. 54, 1655–1674. doi: 10.1016/j.dsr.2007.05.013
Mienis, F., Duineveld, G. C. A., Davies, A. J., Ross, S. W., Seim, H., Bane, J., et al. (2012). The influence of near-bed hydrodynamic conditions on cold-water corals in the Viosca Knoll area, Gulf of Mexico. Deep-Sea Res. Pt. I. 60, 32–45. doi: 10.1016/j.dsr.2011.10.007
Morrison, C. L., Eackles, M. S., Johnson, R. L., and King, T. L. (2008). Characterization of 13 microsatellite loci for the deep-sea coral, Lophelia pertusa (Linnaeus 1758), from the western North Atlantic Ocean and Gulf of Mexico. Mol. Ecol. Resour. 8, 1037–1039. doi: 10.1111/j.1755-0998.2008.02147.x
Pubmed Abstract | Pubmed Full Text | CrossRef Full Text | Google Scholar
Morrison, C. L., Ross, S. W., Nizinski, M. S., Brooke, S., Järnegren, J., Waller, R. G., et al. (2011). Genetic discontinuity among regional populations of Lophelia pertusa in the North Atlantic Ocean. Conserv. Genet. 12, 713–729. doi: 10.1007/s10592-010-0178-5
Mortensen, P. B. (2001). Aquarium observations on the deep-water coral Lophelia pertusa (L., 1758) (Scleractinia) and selected associated invertebrates. Ophelia 54, 83–104. doi: 10.1080/00785236.2001.10409457
Naumann, M. S., Orejas, C., and Ferrier-Pagès, C. (2014). Species-specific physiological response by the wold-water corals Lophelia pertusa and Madrepora oculata to variations within their natural temperature range. Deep-Sea Res. Pt. II. 99, 36–41. doi: 10.1016/j.dsr2.2013.05.025
Nemzer, B. V., and Dickson, A. G. (2005). The stability and reproducibility of Tris buffers in synthetic seawater. Mar. Chem. 96, 237–242. doi: 10.1016/j.marchem.2005.01.004
O'Donnell, M. J., Hammond, L. M., and Hofmann, G. E. (2009). Predicted impact of ocean acidification on a marine invertebrate: elevated CO2alters response to thermal stress in sea urchin larvae. Mar. Biol. 156, 439–446. doi: 10.1007/s00227-008-1097-6
Orejas, C., Ferrier-Pagès, C., Reynaud, S., Tsounis, G., Allemand, D., and Gili, J. M. (2011). Experimental comparison of skeletal growth rates in the cold-water coral Madrepora oculata Linnaeus, 1758 and three tropical scleractinian corals. J. Exp. Mar. Biol. Ecol. 405, 1–5. doi: 10.1016/j.jembe.2011.05.008
Orr, J. C., Fabry, V. J., Aumont, O., Bopp, L., Doney, S. C., Feely, R. A., et al. (2005). Anthropogenic ocean acidification over the twenty-first century and its impact on calcifying organisms. Nature 437, 681–686. doi: 10.1038/nature04095
Pubmed Abstract | Pubmed Full Text | CrossRef Full Text | Google Scholar
Parker, L. M., Ross, P. M., O'Connor, W. A., Borysko, L., Raftos, D. A., and Pörtner, H.-O. (2012). Adult exposure influences offspring response to ocean acidification in oysters. Glob. Change Biol. 18, 82–92. doi: 10.1111/j.1365-2486.2011.02520.x
Peakall, R., and Smouse, P. E. (2006). GENALEX 6: genetic analysis in Excel. Population genetic software for teaching and Research. Mol. Ecol. Notes 6, 288–295. doi: 10.1111/j.1471-8286.2005.01155.x
Pubmed Abstract | Pubmed Full Text | CrossRef Full Text | Google Scholar
Peakall, R., and Smouse, P. E. (2012). GenAlEx 6.5: genetic analysis in Excel. Population genetic software for teaching and research – an update. Bioinformatics 28, 2537–2539. doi: 10.1093/bioinformatics/bts460
Pubmed Abstract | Pubmed Full Text | CrossRef Full Text | Google Scholar
Peck, L. (2011). Organisms and responses to environmental change. Mar. Genomics 4, 237–243. doi: 10.1016/j.margen.2011.07.001
Pubmed Abstract | Pubmed Full Text | CrossRef Full Text | Google Scholar
Pierrot, D., Lewis, E., and Wallace, D. W. R. (2006). MS Excel program developed for CO2 system calculations. ORNL/CDIAC-105. Carbon Dioxide Information Analysis Center, Oak Ridge National Laboratory, U.S. Department of Energy.
Pistevos, J. C. A., Calosi, P., Widdicombe, S., and Bishop, J. D. D. (2011). Will variation among genetic individuals influence species responses to global climate change? Oikos 120, 675–689. doi: 10.1111/j.1600-0706.2010.19470.x
Pubmed Abstract | Pubmed Full Text | CrossRef Full Text | Google Scholar
Pritchard, J. K., Stephens, M., and Donnelly, P. (2000). Inference of population structure using multilocus genotype data. Genetics 155, 945–959.
Quattrini, A. M., Etnoyer, P. J., Doughty, C., English, L., Falco, R., Remon, N., et al. (2014). A phylogenetic approach to octocoral community structure in the deep Gulf of Mexico. Deep-Sea Res. Pt. II. 99, 92–102. doi: 10.1016/j.dsr2.2013.05.027
Rabalais, N. N., Turner, R. E., and Wiseman, W. J. Jr. (2002). Gulf of Mexico hypoxia, a.k.a. “the dead zone.” Annu. Rev. Ecol. Syst. 33, 235–263. doi: 10.1146/annurev.ecolsys.33.010802.150513
Ries, J. B., Cohen, A. L., and McCorckle, D. C. (2010). A nonlinear calcification response to CO2-induced ocean acidification by the coral Oculina arbuscula. Coral Reefs 29, 661–674. doi: 10.1007/s00338-010-0632-3
Ries, J. B., Cohen, A. L., and McCorkle, D. C. (2009). Marine calcifiers exhibit mixed responses to CO2-induced ocean acidification. Geology 37, 1131–1134. doi: 10.1130/G30210A.1
Roberts, J. M., Wheeler, A. J., Freiwald, A., and Cairns, S. (2009). Cold-Water Corals: The Biology and Geology of Deep-Sea Coral Habitats. New York, NY: Cambridge University Press. doi: 10.1017/CBO9780511581588
Rosenberg, N. A. (2004). DISTRUCT: a program for the graphical display of population structure. Mol. Ecol. Notes 4, 137–138. doi: 10.1046/j.1471-8286.2003.00566.x
Schroeder, W. W. (2002). Observations of Lophelia pertusa and the surficial geology at a deep-water site in the northeastern Gulf of Mexico. Hydrobiologia 471, 29–33. doi: 10.1023/A:1016580632501
Selkoe, K. A., Watson, J. R., White, C., Horin, T. B., Iacchei, M., Mitarai, S., et al. (2010). Taking the chaos out of genetic patchiness: seascape genetics reveals ecological and oceanographic drivers of genetic patterns in three temperate reef species. Mol. Ecol. 19, 3708–3726. doi: 10.1111/j.1365-294X.2010.04658.x
Pubmed Abstract | Pubmed Full Text | CrossRef Full Text | Google Scholar
Solomon, S., Qin, D., Manning, M., Chen, Z., Marquis, M., Averyt, K. B., et al. (eds.). (2007). “Climate change 2007: the physical science basis,” in Contribution of Working Group I to the Fourth Assessment Report of the Intergovernmental Panel on Climate Change. Cambridge, UK: Cambridge University Press.
Solomon, S., Plattner, G.-K., Knutti, R., and Friedlingstein, P. (2009). Irreversible climate change due to carbon dioxide emissions. Proc. Natl. Acad. Sci. U.S.A. 106, 1704–1709. doi: 10.1073/pnas.0812721106
Pubmed Abstract | Pubmed Full Text | CrossRef Full Text | Google Scholar
Stramma, L., Schmidtko, S., Levin, L. A., and Johnson, G. C. (2010). Ocean oxygen minima expansions and their biological impacts. Deep-Sea Res. Pt. I. 57, 587–595. doi: 10.1016/j.dsr.2010.01.005
Strømgren, T. (1971). Vertical and horizontal distribution of Lophelia pertusa (Linne) in Trondheimsfjorden on the west coast of Norway. K Norske Vidensk Skr. 6, 1–9.
Turley, C., Eby, M., Ridgwell, A. J., Schmidt, D. N., Findlay, H. S., Brownlee, C., et al. (2010). The societal challenge of ocean acidification. Mar. Poll. Bull. 60, 787–792. doi: 10.1016/j.marpolbul.2010.05.006
Tursi, A., Mastrototaro, F., Matarrese, A., Maiorano, P., and D'Onghia, G. (2004). Biodiversity of the white coral reefs in the Ionian Sea (Central Mediterranean). Chem. Ecol. 20, 107–116. doi: 10.1080/02757540310001629170
Waller, R. G., and Tyler, P. A. (2005). The reproductive biology of two deep-water, reef-building scleractinians from the NE Atlantic Ocean. Coral Reefs 24, 514–522. doi: 10.1007/s00338-005-0501-7
Walther, G.-R., Post, E., Convey, P., Menzel, A., Parmesan, C., Beebee, T. J. C., et al. (2002). Ecological responses to recent climate change. Nature 416, 389–395. doi: 10.1038/416389a
Pubmed Abstract | Pubmed Full Text | CrossRef Full Text | Google Scholar
Weir, B. S., and Cockerham, C. C. (1984). Estimating F-statistics for the analysis of population structure. Evolution 38, 1358–1360. doi: 10.2307/2408641
Wisshak, M., Freiwald, A., Lundalv, T., and Gektidis, M. (2005). “The physical niche of the bathyal Lophelia pertusa in a non-bathyal setting: Environmental controls and palaeoecological implications,” in Cold-Water Corals and Ecosystems, eds A. Freiwald and J. M. Roberts (New York, NY: Springer) 979–1001.
Keywords: climate change, ocean acidification, Lophelia pertusa, survivorship, net calcification, Gulf of Mexico
Citation: Lunden JJ, McNicholl CG, Sears CR, Morrison CL and Cordes EE (2014) Acute survivorship of the deep-sea coral Lophelia pertusa from the Gulf of Mexico under acidification, warming, and deoxygenation. Front. Mar. Sci. 1:78. doi: 10.3389/fmars.2014.00078
Received: 18 July 2014; Accepted: 29 November 2014;
Published online: 19 December 2014.
Edited by:
Paul E. Renaud, Akvaplan-niva AS, NorwayReviewed by:
Erik Caroselli, Alma Mater Studiorum - University of Bologna, ItalyJon Havenhand, University of Gothenburg, Sweden
Copyright © 2014 Lunden, McNicholl, Sears, Morrison and Cordes. This is an open-access article distributed under the terms of the Creative Commons Attribution License (CC BY). The use, distribution or reproduction in other forums is permitted, provided the original author(s) or licensor are credited and that the original publication in this journal is cited, in accordance with accepted academic practice. No use, distribution or reproduction is permitted which does not comply with these terms.
*Correspondence: Jay J. Lunden, Department of Ecology, Evolution and Marine Biology, University of California, Santa Barbara, Building 520 Rm. 4001 Fl 4L, Santa Barbara, CA 93106-6150, USA e-mail:amF5Lmx1bmRlbkBsaWZlc2NpLnVjc2IuZWR1
†Present address: Jay J. Lunden, Department of Ecology, Evolution and Marine Biology, University of California, Santa Barbara, Santa Barbara, USA