 Jonathan E. Hunter
 Miguel J. Frada
 Helen F. Fredricks
 Assaf Vardi
 Benjamin A. S. Van Mooy
- 1Ocean and Earth Science, National Oceanography Centre, University of Southampton, Southampton, UK
- 2Institute for Life Sciences, University of Southampton, Southampton, UK
- 3Department of Plant and Environmental Sciences, Weizmann Institute of Science, Rehovot, Israel
- 4Department of Marine Chemistry and Geochemistry, Woods Hole Oceanographic Institution, Woods Hole, MA, USA
Marine viruses that infect phytoplankton strongly influence the ecology and evolution of their hosts. Emiliania huxleyi is characterized by a biphasic life cycle composed of a diploid (2N) and haploid (1N) phase; diploid cells are susceptible to infection by specific coccolithoviruses, yet haploid cells are resistant. Glycosphingolipids (GSLs) play a role during infection, but their molecular distribution in haploid cells is unknown. We present mass spectrometric analyses of lipids from cultures of uninfected diploid, infected diploid, and uninfected haploid E. huxleyi. Known viral GSLs were present in the infected diploid cultures as expected, but surprisingly, trace amounts of viral GSLs were also detected in the uninfected haploid cells. Sialic-acid GSLs have been linked to viral susceptibility in diploid cells, but were found to be absent in the haploid cultures, suggesting a mechanism of haploid resistance to infection. Additional untargeted high-resolution mass spectrometry data processed via multivariate analysis unveiled a number of novel biomarkers of infected, non-infected, and haploid cells. These data expand our understanding on the dynamics of lipid metabolism during E. huxleyi host/virus interactions and highlight potential novel biomarkers for infection, susceptibility, and ploidy.
Introduction
Emiliania huxleyi (Lohmann) is the numerically dominant coccolithophore in the modern oceans and an important component of phytoplankton assemblages, inhabiting all but extreme polar oceans. Moreover, it forms large, dense blooms in high-latitude coastal and shelf ecosystems that exert a critical impact upon the global carbon cycle and the earth's climate (Westbroek et al., 1993; Paasche, 2001; Tyrrell and Merico, 2004). In later stages these blooms become visible to satellites as large scale cell death leads to the mass shedding of the highly scattering calcium carbonate coccoliths that normally coat the surface of E. huxleyi cells (Holligan et al., 1983; Vardi et al., 2012; Lehahn et al., 2014).
Marine viruses are the most abundant biological agents in the oceans (Fuhrman, 1999; Suttle, 2007). Specific, giant, lytic double-stranded DNA E. huxleyi viruses (EhV), belonging to the phycodnaviridae family that infect microalgae (Van Etten et al., 2002) are heavily implicated in the decay of E. huxleyi blooms (Bratbak et al., 1993; Brussaard et al., 1996; Vardi et al., 2012; Lehahn et al., 2014). Viruses that induce host cell lysis are thought to release particulate carbon and other nutrients into the water column (the “viral shunt”), thus circumventing the export of particulate organic matter to the deep ocean by way of the biological pump (Fuhrman, 1999; Suttle, 2007; Jover et al., 2014). Conversely, viral infection is also known to induce increased production of transparent exopolymer particles (TEP) in E. huxleyi, that accelerate the formation of sinking particulates, enhancing the biological pump, and removing virus particles from the upper water column (Vardi et al., 2012). The efficacy of the biological pump, and thus the effect of viruses on phytoplankton, has direct implications upon atmospheric carbon dioxide (Suttle, 2007).
At the cellular level, as a large dsDNA virus with high metabolic demand for the building blocks of DNA, lipids and protein synthesis, EhV triggers a rapid remodeling of the host metabolism (Rosenwasser et al., 2014; Schatz et al., 2014). In particular, recent studies have highlighted the crucial role of membrane lipids in the progression and regulation of EhV infection (Vardi et al., 2009, 2012; Rosenwasser et al., 2014). Evidence from genome and microscopic investigation suggests that EhV86 utilizes an animal-like, membrane-dependent infection strategy. EhV entry, by membrane fusion or endocytosis and the acquisition of host membrane lipids via budding (Mackinder et al., 2009; Schatz et al., 2014), seem to be localized to membrane lipid raft regions (Rose et al., 2014). Furthermore, the EhV genome contains a cluster of genes composing a nearly complete sphingolipid biosynthetic pathway analogous to the host pathway (Wilson et al., 2005; Monier et al., 2009).
Glycosphingolipids (GSLs) bearing a sphingoid base derived from palmitoyl-CoA—host glycosphingolipids (hGSL)—are abundant in uninfected E. huxleyi. Under lytic infection however, viral glycosphingolipids (vGSLs) derived from myristoyl-CoA are synthesized de novo, and vGSLs are known to play a role in the regulation of cell death in infected cells and are enriched in the membrane of newly formed virions (Vardi et al., 2009; Fulton et al., 2014; Rosenwasser et al., 2014). These vGSLs were detected in coccolithophore populations in the North Atlantic, which highlights their potential as biomarkers for viral infection in the oceans (Vardi et al., 2009, 2012).
A glycosphingolipid with a sialic acid modified glycosyl headgroup (sGSL) was recently described to have a direct relationship with susceptibility to infection. Across 11 strains of E. huxleyi (Fulton et al., 2014), sGSL was only detected at greater than trace levels in susceptible host strains, but not in viral-resistant host strains. Given the presence of a sialidase gene in the EhV genome (Wilson et al., 2005), it has been speculated that sGSL is a target for hydrolysis by EhV sialidases and/or a ligand for attachment by EhV lectin proteins during infection (Fulton et al., 2014). This mechanism is of an analogous fashion to a range of human viral pathogens including influenza (Stray et al., 2000). Additionally, betaine-like glycerolipids (BLL) were also recently described whose fatty acid composition appears highly indicative of the progression of infection. It was reported that uninfected E. huxleyi BLL composition was almost exclusively C16:0/C22:6 and C18:1/C22:6, while under viral infection the total BLL composition shifted to contain 50% C22:6/22:6 (Fulton et al., 2014).
A basic feature of E. huxleyi is the possession of a biphasic, haplodiplontic, and heteromorphic life cycle comprising a diploid (2N) coccolith-bearing phase that is non-motile and involved in the formation of blooms and a contrasting haploid (1N) form bearing flagella and non-mineralized organic body-scales (Green et al., 1996; Houdan et al., 2004). The vast majority of research on E. huxleyi has been conducted with 2N cells, and yet recent transcriptomic analyses have revealed a dramatic differentiation between 1N and 2N cells, with less than 50% of transcripts estimated to be shared between the two phases, unraveling a deep degree of physiological segregation (Von Dassow et al., 2009; Rokitta et al., 2011). Interestingly, whilst the 2N form is generally susceptible to EhV infection, the 1N form appears completely resistant to EhV (Frada et al., 2008). Furthermore, when 2N E. huxleyi are subject to EhV infection, a transition toward the resistant 1N flagellated form is induced, likely allowing for continuity of E. huxleyi following viral bloom termination (Frada et al., 2008, 2012).
Given the central role that membrane lipids play in the progression and regulation of EhV infection and the resistance to EhV infection exhibited by 1N E. huxleyi, a number of questions arise that are as yet unanswered. Early targeted analyses have shown similar compositions with respect to the major structural lipids, storage lipids, and pigments between 1N and 2N cells in the case of a single strain of E. huxleyi (Bell and Pond, 1996). Minor or novel lipid classes however, are as yet uncharacterized in the 1N cell lipidome and it is unknown whether the susceptibility marker sGSL is absent from EhV resistant 1N cells. By characterizing these lipids and the lipidome as a whole, we can gain insight into the mechanism of 1N E. huxleyi resistance to EhV infections and potentially highlight biomarkers of each of the life cycle phases.
We present herein, a detailed characterization of the lipidomes of cultured E. huxleyi, an uninfected 2N strain (RCC 1216), the 2N strain under infection with coccolithovirus (RCC 1216 + EhV201), and an uninfected 1N strain (RCC 1217). Total lipid extracts derived from these cultures collected over 120 h post-infection were characterized by mass spectrometry. We used two approaches, targeted analysis for quantification of known GSL/glycerolipid species and untargeted analyses for screening for unknown lipids.
Materials and Methods
Culturing Procedures
The calcifying, 2N Emiliania huxleyi strain RCC1216 and the non-calcified, flagellated 1N E. huxleyi RCC1217 (isolated from RCC1216 following a partial phase change (2N to 1N), were used for this study (Houdan et al., 2005). Cells were cultured in K/2 medium (Keller et al., 1987) and incubated at 18°C with a 16 : 8 h, light: dark illumination cycle. Light intensity was provided at 100 μmol photons m−2 s−1 with cool white LED lights. All experiments were performed in duplicate. The virus used for this study is the lytic E. huxleyi virus EhV201 (Schroeder et al., 2002) used at an initial multiplicity of infection (MOI) of 0.2 viral particles cell−1. Samples of 25 mL were collected daily over 120 h post-infection by gentle vacuum-filtration onto pre-combusted GFF filters (Whatmann) and stored at −80°C until further analysis.
Targeted Lipid Analysis
Lipid abbreviations as indicated in the results section. Total lipid extracts were prepared from the cell isolates by a modified Bligh and Dyer extraction (Bligh and Dyer, 1959; Popendorf et al., 2013), with addition of the internal standard DNP-PE(16:0/16:0) (2,4-dinitrophenyl modified PE). The prepared total lipid extracts were then subjected to targeted lipid analysis by normal phase high performance liquid chromatography tandem mass spectrometry (HPLC-MS/MS) on an Agilent 1200 HPLC coupled to a Thermo Scientific TSQ Vantage triple quadrupole MS. Chromatography and mass spectrometry conditions were as described by Popendorf et al. (2013).
Lipid classes were identified by retention time and characteristic MS2 fragmentation (Popendorf et al., 2013; Fulton et al., 2014) and quantified based upon peak area within a given MS2 mass chromatogram. Quantification was achieved relative to external standard response factor calibrations. These calibrations were generated immediately before each analytical run, from a mixture of standards in a dilution series. PC, PG, PE, and DNP-PE (Avanti Polar Lipids, Alabaster, AL, USA); MGDG, DGDG (Matreya LLC, Pleasant Gap, PA, USA), and SQDG (Lipid Products, South Nutfield, UK) standards were used to generate calibrations for the glycerolipids. DGCC was quantified based on a purified extract from cultured Thalassiosira Pseudonana (Popendorf et al., 2013). DGTS was quantified based upon the DGCC calibration subject to a scaling factor (Popendorf et al., 2011b). The internal standard mixture was run after every seven samples as a control upon instrument variability. Quantities were corrected based upon the quality control run prior to a given sample. BLL and PDPT were quantified directly from the DNP-PE internal standard, as a semi-quantitative solution in the absence of an available internal standard. Quantification of hGSL, vGSL, and sGSL was based upon the response factor calibration of soy glucocerebroside extract (Avanti Polar Lipids, Alabaster, AL, USA) (Fulton et al., 2014).
While uninfected 1N cells have been reported to have a smaller diameter than calcified uninfected 2N cells, this difference is thought to be due primarily due to the presence of the calcified skeletons as opposed to large difference in cytoplasmic volume (Mausz and Pohnert, 2014). Furthermore, uncalcified 2N cells were found to be of comparable diameter to the 1N cells (Klaveness, 1972; Mausz and Pohnert, 2014). Therefore, we assume that the biovolume of 1N and 2N cells was similar, and the measured lipid quantities were normalized to cell concentration for ease of interpretation.
All data represent the mean average of two biological replicates with error bars of one standard deviation. Statistical significance for the targeted analyses was determined by two-tailed, paired equal-variance T-test. A Bonferroni correction was applied to the significance threshold to account for dual comparisons (uninfected 2N/uninfected 1N, uninfected 2N/infected 2N), thus a p-value of < 0.025 was considered statistically significant. Any such significant variation is described in the results section. P-values were indicated as *p < 0.025; **p < 0.0025 where appropriate.
Untargeted Lipid Analysis
Total lipid extracts from the 48 h samples were also analyzed by untargeted reverse phase HPLC-MS methodology on an Agilent 1200 HPLC coupled to a Thermo Scientific Exactive orbitrap high resolution mass spectrometer. Chromatography and mass spectrometry conditions were as described by Hummel et al. (2011) with the exception of a Waters XBridge C8 column (5 uM packing, 150 × 2.1 mm). During each sample run, the mass spectrometer continuously cycled between full positive, full negative, positive all ion fragmentation, and negative all ion fragmentation modes, generating spectra with high mass accuracy.
The data was processed with the Thermo Scientific Sieve software package using the component extraction algorithm for chromatographic alignment, peak detection, and integration. Identified peak areas were then normalized to the DNP-PE internal standard and number of cells isolated. These unbiased analyses yield relative quantification; hence the abundance of a given molecular species is only comparable with the abundance of the same molecular species in other samples. The extracted data was filtered to remove molecular species where the deviation in abundance between replicates exceeded a factor of 10.
Peak areas were mean centered, level scaled to their means (Van den Berg et al., 2006) and used to build a Partial Least Square Discriminant Analysis Model (PLS-DA), using the Classification Toolbox for MATLAB (Ballabio and Consonni, 2013). PLS-DA models (Positive ions/Negative ions) were built using the following parameters: two components, Bayes assignment, six cross validation (CV) groups in contiguous blocks (i.e., Leave-One-Out validation as six samples were used). The positive model described 94% of the variance and had an error and CV error rate of 0. The negative model described 89% of the variance and had an error and CV error rate of 0. Ions from the mass spectrometry data were ranked upon their contribution (loading) toward the model score of samples of a given culture type (Supplementary Figure 2).
The top five ions ranked as indicative of each culture type in positive and negative ion mode were identified by matching to an extensive, accurate mass, structure query language (SQL) lipid database. The database was populated by permutations of fatty acids (chain length/degree of unsaturation) and common glycerolipids/sphingolipids. The complete LIPID MAPS (version 20130306) structural database (Sud et al., 2007) and MaConDa mass spectrometry contaminants database (Weber et al., 2012) were also included. The chemical formulae of database entries were then used to calculate accurate mass m/z values based upon a list of common molecular ion adducts in ESI-MS (Huang et al., 1999). Database hits were within 2.5 ppm of the measured m/z. Supporting MS2 fragmentation and diagnostic retention time information was recorded for the assignments presented in the Results and is included in Supplementary Figures 3, 4.
Results
Host Cell and Viral Dynamics and Relative Abundances
Uninfected 2N and uninfected 1N cultures grew at a comparable average rate of 0.023 h−1, reaching a population density of 4.07 × 10⁶ ± 0.39 × 10⁶ cells mL−1 and 4.79 × 10⁶ ± 0.28 × 10⁶cells mL−1 respectively within 120 h (Figure 1A). In contrast, the infected 2N culture population peaked at 5.07 × 10⁵ ± 1.15 × 10⁴ cells mL−1 at 31 h and rapidly declined thereafter concomitant with the emergence of EhV particles in the medium. EhV concentration peaked at 54 h at 9.17 × 10⁷ ± 0.71 × 10⁷ virions mL−1 in the infected 2N cultures (Figure 1C). The decline phase was accompanied by an increase in the percentage of non-calcified (low scatter) cells from 17.70 ± 0.73% at 0 h to 80.05 ± 2.63% at 48 h. Bacteria concentration (Figure 1D), whilst remaining low in the uninfected 2N control, increased at a rate of 0.037 h−1 in the infected 2N cultures after the onset of infection reaching a maximum of 1.15 × 10⁷ ± 8.39 × 10⁵ cells mL−1 at 120 h.
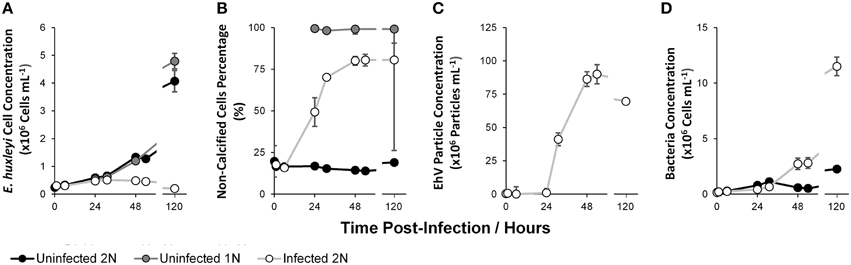
Figure 1. Host cell and viral dynamics during infection: Total Host Cell Concentration (A); Non-calcified Cell Percentage of Total (Host Cell, B); EhV Particle Concentration (C); Bacterial Cell Concentration (D). Data represent the mean average of two biological replicates with error bars of one standard deviation.
Glycerolipid Targeted Lipidomics
The polar glycerolipids phosphatidylcholine (PC), diacylglyceryl-3-O- carboxy-(hydroxymethyl)-choline (DGCC), digalactosyldiacylglycerol (DGDG), sulfoquinovosyldiacylglycerol (SQDG), and the sulfur containing phospholipid phosphatidyl-S,S-dimethylpropanethiol (PDPT) (Fulton et al., 2014) did not vary between cultures (Supplementary Figure 1). However, several other classes of polar glycerolipid showed interesting differences.
Phosphatidylglycerol (PG) quantity per cell (Figure 2A) in the uninfected 2N and uninfected 1N cultures was statistically similar through time. PG per cell in the infected 2N cultures initially declined by 0.27 ± 0.023* fold at 31 h relative to the uninfected 2N control. A large increase in infected 2N PG per cell of 30.29 ± 21.80 fold was observed at 120 h, although relative to the uninfected 2N control cultures the increase was not statistically significant (p = 0.12), due to a large variation between the biological replicates at this time point.
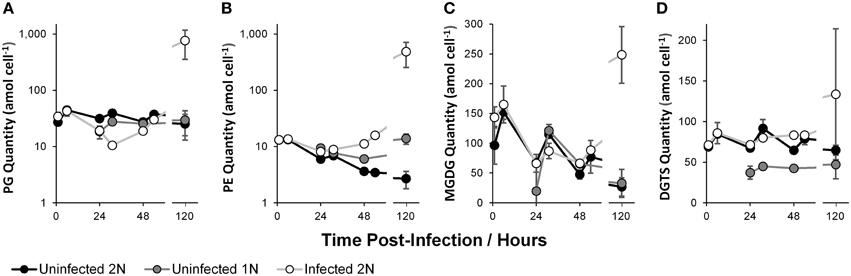
Figure 2. Polar glycerolipid quantity per E. huxleyi cell: Phosphatidylglycerol (PG, A); Phosphatidylethanolamine (PE, B); Monogalactosyldiacylglycerol (MGDG, C); and Diacylglyceryltrimethylhomoserine (DGTS, D). Data represent the mean average of two biological replicates with error bars of one standard deviation. See Supplementary Table 1 for tabulated data.
Phosphatidylethanolamine (PE) quantity per cell (Figure 2B) showed a decreasing trend through time in the uninfected 1N and uninfected 2N cultures. PE was slightly elevated in the uninfected 1N cultures compared to the uninfected 2N control, this was statistically significant only at 24 h, where PE per cell in the uninfected 1N was 1.57 ± 0.16* fold higher than in uninfected 2N. PE quantity per cell in the infected 2N cultures diverged from the uninfected 2N control after 24 h, progressively increasing to 4.58 ± 0.18** fold greater at 54 h. In common with PG, a large increase of infected 2N PE per cell at 120 h, of 180.10 ± 105.19 fold, was not statistically significant (p = 0.10), due to variability in the replicate samples at this time point.
Two non-phosphorous polar glycerolipids showed interesting and significant dynamics. Monogalactosyldiacylglycerol (MGDG) quantity per cell (Figure 2C) was statistically similar in all of the cultures before 52 h, but showed a decreasing trend with time. However, at 120 h MGDG in the infected 2N cultures increased by 9.31 ± 5.68* fold, relative to the uninfected 2N cultures. Diacylglyceryltrimethylhomoserine (DGTS) quantity per cell (Figure 2D) appeared to be approximately half as abundant in the uninfected 1N compared with the uninfected 2N control cultures at 0.55 ± 0.12* fold less at 24 h and 0.66 ± 0.01** fold less at 48 h. DGTS per cell in the infected 2N cultures did not vary statistically significantly from the uninfected 2N control, with the exception of a 1.29 ± 0.02** fold increase at 48 h. Similar to PG, DGTS levels in the uninfected 2N and uninfected 1N cultures remained relatively consistent through time.
Total Betaine-Like Lipid (BLL; Fulton et al., 2014) quantity per cell (Figure 3A) varied considerably in all cultures, ranging from a minimum of 35.55 ± 21.35 amol cell−1 at 24 h in the uninfected 1N cultures to a maximum of 86.07 ± 27.21 amol cell−1 at 120 h in the infected 2N cultures. Only at 31 h were significant differences observed, where the infected 2N cultures were 0.58 ± 0.05 fold less and the uninfected 1N cultures were 0.73 ± 0.05* fold less than in the uninfected 2N control. No clear trend was evident in the total BLL quantity per cell, in response to time or between the different cultures. However, the ratio between two BLL molecular species, BLL(22:6/22:6) and BLL(18:1/22:6) showed marked differences (Figure 3B). In the uninfected 2N and uninfected 1N cultures, the ratio was < 0.1 throughout, representing the relative absence of BLL(22:6/22:6) compared to BLL(18:1/22:6) when uninfected. The ratio of these species rose rapidly under infection reaching 10.46 ± 1.56 at 120 h after inoculation of the infected 2N cultures.
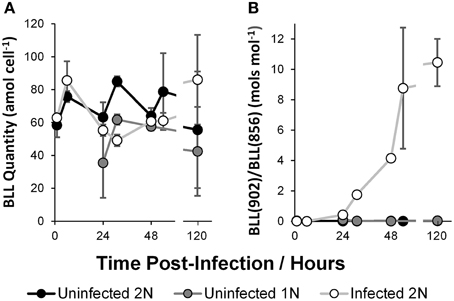
Figure 3. Betaine-Like Lipid (BLL), total quantity per cell (A), and ratio of BLL(902; 22:6/22:6) quantity to BLL(856; 18:1/22:6) quantity (B). Data represent the mean average of two biological replicates with error bars of one standard deviation. See Supplementary Table 1 for tabulated data.
Glycosphingolipid Targeted Lipidomics
Concentrations of two classes of glycosphingolipids were highly dynamic through the course of infection. The infection marker viral glycosphingolipid (vGSL, Figure 4A) was abundant only in the infected 2N cultures. Infected 2N vGSL concentration rose consistently through time from absent at 0 h to 169.32 ± 73.77 amol cell−1 at 120 h, concomitant with the increase in EhV concentrations. Interestingly, lower levels of vGSL (4–8 amol cell−1) were also detected in the uninfected 1N cultures, reaching a maximum of 7.63 ± 0.13 amol cell−1 at 120 h.
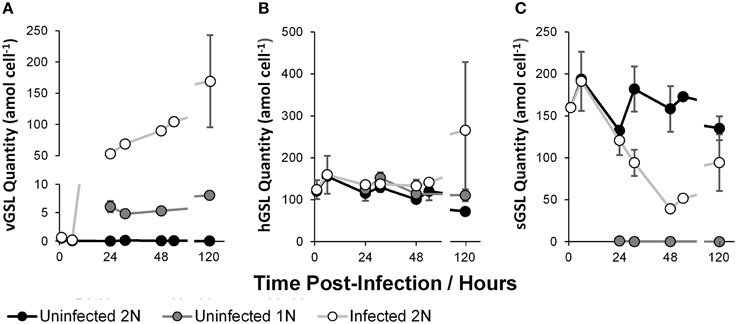
Figure 4. Glycosphingolipid quantity per E. huxleyi cell: Viral glycosphingolipid (vGSL, A); Host glycosphingolipid (hGSL, B); Sialic-acid glycosphingolipid (sGSL, C). Data represent the mean average of two biological replicates with error bars of one standard deviation. See Supplementary Table 1 for tabulated data.
The susceptibility marker sialic glycosphingolipid (sGSL, Figure 4C) was abundant in the uninfected 2N control, with no clear time dependence, between a range of 132.32 ± 4.09 amol cell−1 at 24 h and 193.76 ± 3.20 amol cell−1 at 6 h. The concentrations of sGSL in the infected 2N cultures displayed an approximately decreasing trend from 191.07 ± 35.35 amol cell−1 at 6 h to 51.59 ± 0.57 amol cell−1 at 54 h. Importantly, sGSL was absent from the uninfected 1N cultures. In contrast to vGSL and sGSL, a third class of glycosphingolipid, the intrinsic host glycosphingolipid (hGSL, Figure 4B) presented no statistically significant variation between cultures, and no trend was evident with the progression of time.
Untargeted Lipidomics and Biomarker Selection
Untargeted lipidomic data were collected from the incubations at 48 h and subsequent PLS-DA analysis revealed a number of potential biomarkers for E. huxleyi life stages and viral infection. The top 5 loadings that were indicative for each culture type, bearing significant differences by univariate statistics (p = < 0.05 by single factor ANOVA), were assigned by database matching (Table 1). All ion fragmentation MS2 data was used to confirm database hits (Supplementary Figures 3, 4).
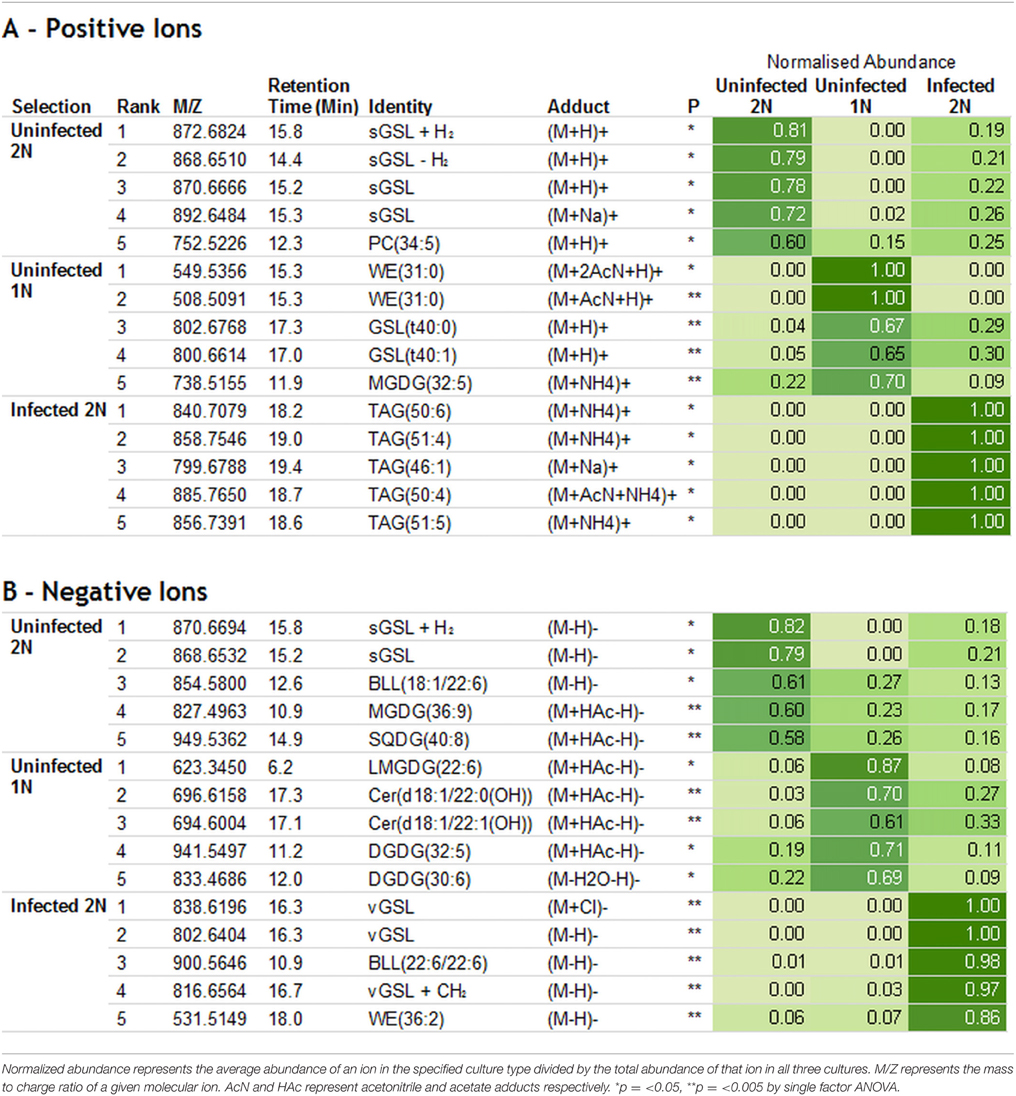
Table 1. Top 5 loadings (assigned species only) for each culture type in the PLS-DA model: Positive ions (A) and Negative ions (B).
The potential biomarkers for the 2N control cultures were sGSLs, bearing various adducts and plus or minus one double bond resulting in the highest positive loadings on PC2. In positive ion mode (Table 1A), tentatively assigned sGSL+H2, sGSL–H2, and sGSL (with two different adducts) gave normalized abundances of 0.81, 0.79, 0.78, and 0.72 respectively, where the sGSL of calculated m/z 870.6665 [M+H]+ is regarded as the archetypal sGSL (Fulton et al., 2014). A 752.5226 m/z species, with a database hit to PC(34:5) showed a normalized abundance of 0.60. In negative ion mode (Table 1B), sGSL+H2, sGSL and BLL(18:1/22:6) showed a normalized abundance of 0.82, 0.79, and 0.61 respectively. Species of m/z 827.4963 and 949.5362 with hits to MGDG(36:9) and SQDG(40:8) respectively showed normalized abundances of 0.60 and 0.58.
The top potential biomarker for uninfected 1N cells, in positive ion mode, was a wax ester/alkanoate WE(31:0) with two and one acetonitrile adducts, which was detected solely in the 1N cultures yielding normalized abundances of 1.00 and 1.00 respectively. Two GSLs, GSL(t40:0) and GSL(t40:1), distinct to previously documented GSLs in the E. huxleyi host/virus system, had normalized abundances of 0.67 and 0.65 respectively. Finally, MGDG(32:5) was ranked fifth with a normalized abundance of 0.70. In negative ion mode, a lyso-MGDG (bearing a single fatty acid rather than a pair), LMGDG(22:6) was most strongly indicative of the uninfected 1N cultures with a normalized abundance of 0.87. Ceramide species, chemically similar to sGSL but lacking any headgroup and bearing a hydroxy fatty amide, Cer(d18:1/22:0(OH)), and Cer(d18:1/22:1(OH)) in the uninfected 1N cultures had normalized abundances of 0.70 and 0.61 respectively. Lastly, digalactosyldiacylglycerols and DGDG(32:5) and DGDG(30:6) were enriched in the uninfected 1N cultures with normalized abundances of 0.71 and 0.69 respectively.
The potential biomarkers for the infected 2N cells were highly diagnostic, with 7 out of the top 10 yielding normalized abundances of 1.00. In positive ion mode, a series of triacylglycerols (TAGs) gave the highest negative loadings on PC1 and were ranked highest. TAG(50:6); TAG(51:4); TAG(46:1); TAG(48:2); and TAG(51:5) each had normalized abundances of 1.00. In negative ion mode, previously described biomarkers vGSL (with a chloride adduct); vGSL; BLL(22:6/22:6); and vGSL + CH2 had normalized abundances of 1.00, 1.00, 0.98, 0.97, and 0.86 respectively, where vGSL of calculated m/z 802.6414 [M-H]− is regarded as the archetypal vGSL (Vardi et al., 2009). A fatty acid/wax ester like FA/WE(36:2) species was ranked fifth in negative ion mode with a normalized abundance of 0.86.
Further to the assigned species (Table 1) there were many molecular species of interest that could not be assigned by accurate mass database matching (Supplementary Table 2).
Discussion
Host Cell and Viral Dynamics and Relative Abundances
Uninfected 2N and uninfected 1N E. huxleyi populations increased exponentially through time with a similar growth rate and maximum population, but the infected 2N cultures peaked at 31 h and declined thereafter, consistent with typical lytic viral infection by EhV (Bratbak et al., 1993; Wilson et al., 2002) (Figure 1A). This decline was concomitant with a rapid increase in EhV particles and non-calcified, low side scatter E. huxleyi cell concentration in the growth media, indicating both viral burst from infected cells and the demise of 2N calcified cells (Figures 1B,C). These growth dynamics reflect identical trends to those previously described (Frada et al., 2008, 2012). High scatter cells were predominate in the uninfected 2N control, representing the coccolith bearing 2N phase. Conversely, cells in the uninfected 1N cultures were mostly low scatter, indicative of the non-calcifying 1N phase.
The cultures used in this study were non-axenic, and a rapid increase in bacterial numbers in the infected 2N cultures was likely fuelled by the release of organic carbon during cell lysis. However, in terms of overall biomass, the level of contamination from bacteria is comparatively minor: considering the cell concentrations of E. huxlyei and bacteria, and cellular carbon quotas of 2 pmol C cell−1 and 1 fmol C cell−1, respectively (Gundersen et al., 2002; Borchard and Engle, 2012), E. huxleyi dominate biomass by approximately a factor of 20. Based on the cell counts of the uninfected 2N and uninfected 1N cultures, we would expect this factor to be orders of magnitude higher. Thus, except in the case of a few specific lipid molecules (discussed below) we would expect the lipidomes of our samples to be overwhelmingly dominated by contributions from E. huxleyi.
Glycerolipid Targeted Lipidomics
For the most part, polar glycerolipids per cell were largely invariant between cultures and with time, with only a few notable exceptions. Despite the relatively small contributions of bacterial biomass, the observed increase in PG concentration in the infected 2N cultures (Figure 2A) was most likely due to an increase in the bacterial population (Figure 1D). Thus, this result is not entirely unexpected since PG generally composes about half of the glycerolipids in marine bacteria, while in E. huxleyi PG only represents 0.2% of the lipidome (Fulton et al., 2014; Carini et al., 2015).
In the infected 2N cultures, PE quantity also increased compared to the uninfected 2N control after 24 h (Figure 2B). Like PG, PE is also a major component of bacterial membranes but is scarce in E. huxleyi (Van Mooy et al., 2009; Popendorf et al., 2011a; Carini et al., 2015), and thus a contribution from bacteria is possible (Fulton et al., 2014). Alternatively, this increase in PE may be derived from the host cell's autophagy machinery (Schatz et al., 2014). Autophagy is a highly conserved eukaryotic mechanism for the degradation of damaged organelles and unwanted macromolecules (Shemi et al., 2015). It has been demonstrated that autophagy is induced during the lytic phase of EhV infection and plays a role in the propagation of the virus (Schatz et al., 2014). A well-known hallmark of autophagy is PE lipidation of the Atg8 protein, as also reported in E. huxleyi under EhV infection (Schatz et al., 2014). Thus, the observed increase in PE under EhV infection may be attributable to the induction of autophagy via lipidation of the Atg8 protein. Interestingly, total PE appeared slightly more abundant per cell in the uninfected 1N cultures, relative to the uninfected 2N control.
MGDG quantity per cell was similar between uninfected 2N and uninfected 1N cultures, while the infected 2N cultures showed a large increase in MGDG quantity per cell at 120 h post-inoculation (Figure 2C). MGDG is often associated with the thylakoid membranes of the chloroplast (Sakurai et al., 2006) and hence variation may indicate a consequence of infection upon the host photosynthetic machinery. In contrast, a decrease in MGDG under EhV infection of E. huxleyi has been shown elsewhere (Fulton et al., 2014). Furthermore, a recent study on another haptophyte Haptolina ericina infected with a dsDNA virus observed a decrease in glycolipid abundance under infection (Ray et al., 2014). This decrease was suggested to derive from cell disruption during infection, resulting in a loss of chloroplasts during sample preparation. The haptophyte Phaeocystis pouchetii did not display a major loss of cellular MGDG when infected with a dsDNA virus (Ray et al., 2014). MGDG is one of the most abundant lipids in E. huxleyi (Fulton et al., 2014), but this molecule is scarce in bacteria because they have a clear preference for synthesizing phospholipids over glycolipids when phosphate is abundant, as in the K/2 medium used here (Popendorf et al., 2011a; Carini et al., 2015); thus, it is unlikely that the MGDG observed in the infected 2N cultures is of bacterial origin. Clearly at this stage we have an incomplete understanding of the behavior of MGDG under viral infection in haptophytes such as E. huxleyi.
Total DGTS abundance per cell in the uninfected 1N cultures was consistently around half of its abundance in the uninfected 2N control (Figure 2D). Betaine lipids such as DGTS are known to substitute for membrane phospholipids (primarily PC) under phosphorus stress in many eukaryotic phytoplankton. As such the BL/PC ratio has been considered as a measure for phosphorus limitation in the environment (Van Mooy et al., 2009; Martin et al., 2011). Reduced DGTS abundance from 1N cells within an environmental population would impact such a measure. Furthermore, when coupled with a slight increase in PE in the 1N case, outlined earlier, this may shift the glycerolipid stoichiometry to an N: P ratio lower than the 2N counterpart (Van Mooy et al., 2009; Carini et al., 2015).
Whilst total BLL quantity per cell was generally similar (Figure 3A), BLL(22:6/22:6) was present only at trace level in the uninfected 2N cultures and increased dramatically in abundance in the infected 2N cultures. BLL(18:1/22:6) was present in the uninfected 2N and uninfected 1N cultures and we found that the ratio between BLL(22:6/22:6)/BLL(18:1/22:6) was a strong indicator of infection in these experiments (Figure 3B). We suggest that in light of these and previous observations (Fulton et al., 2014), that BLL(22:6/22:6) and ratios thereof may be a useful biomarker of EhV infection to compliment vGSL. Application as a biomarker would require further investigation to verify BLL(22:6/22:6) presence/absence under the infected/host states is conserved across different E. huxleyi and viral strains and specific to E. huxleyi. The presence/absence relationship has been to date demonstrated in E. huxleyi 1216 (2N), 1217 (1N), and 1216 with EhV201 in this study and E. huxleyi 374 (2N) with EhV86 (Fulton et al., 2014).
Notably, the polar glycerolipids PC, DGCC, DGDG, SQDG, and PDPT were effectively identical in all three cultures through time (Supplementary Figure 1). This observation, in conjunction with the many similarities in PG, PE, and MGDG indicates that the overall polar glycerolipid content is not radically affected by life cycle or even viral infection, except potentially at the very termination of the lytic phase; only DGTS and BLL (22:6/22:6) show notable earlier variations. Bell and Pond (1996) observed that the distributions of fatty acids within polar glycerolipids were also fairly similar in uninfected 2N and 1N cells. Thus, overall these molecules seem to play a largely passive role in life cycle differentiation and infection. Furthermore, since the cellular lipid content of the major glycerolipids is mostly similar in all three cultures and cellular lipid content is a first-order approximation of cellular biomass, these data validate our assumption that the different types of cells do not vary greatly in size (i.e., biomass content) and support our decision to normalize all lipid data to cell abundance.
Glycosphingolipid Targeted Lipidomics
In contrast to the polar glycerolipids, the glycosphingolipids were highly dynamic, showing marked differences between culture treatments and through time. The infection marker vGSL was absent from the uninfected 2N cultures and abundant in the infected 2N cultures, rising through time with the progression of infection (Figure 4A), in agreement with previous observations (Vardi et al., 2009, 2012). Interestingly, low levels of vGSL-like molecules were detected in the uninfected 1N cultures. These vGSL-like species produce the same diagnostic glycosyl headgroup fragments and co-elute with previously characterized vGSLs. Untargeted lipidomic data, discussed below, suggest however that these molecules may not be exactly the same as the vGSLs in the infected diploid cultures originally recognized by Vardi et al. (2009). Future developments in targeted lipidomic methods hold the promise of being able to distinguish true vGSL from infected diploid cells and this novel vGSL-like molecule from uninfected haploid cells.
Host intrinsic hGSL did not vary in quantity per cell between the uninfected 2N control and the infected 2N cultures, in line with previous studies (Vardi et al., 2009, 2012; Fulton et al., 2014). Furthermore, we find that hGSL cellular abundance is also statistically similar in the uninfected 1N cultures (Figure 4B).
The marker lipid sGSL was recently described as indicative of susceptibility to viral infection in E. huxleyi (Fulton et al., 2014) and we found that sGSL was abundant in the virus-susceptible 2N strain used in this study, RCC1216. Levels of sGSL were somewhat reduced with the progression of infection in the infected 2N cultures at intermediate time, before returning to a level statistically similar to that of the uninfected control (Figure 4C). This contrasts with a previous study with a different E. huxleyi strain (Fulton et al., 2014) showing an increase in sGSL cellular abundance under infection. The same report however, included mesocosm field experiments that showed decreases in sGSL abundance per cell subject to EhV infection (Fulton et al., 2014); these results were interpreted as preferential infection of sGSL rich cells and relative growth of sGSL poor virus resistant cells. In light of our finding that sGSL is absent in 1N cells, the interpretation of Fulton et al. (2014) is entirely consistent with the observations of Frada et al. (2012) from the same mesocosms showing that 1N cells became proportionally more abundant, an affirmation of the Cheshire Cat hypothesis (Frada et al., 2008). Although the dynamics of sGSL subject to EhV infection appear variable between 2N systems (Fulton et al., 2014), the discovery here that sGSL is absent in 1N E. huxleyi cells could make sGSL an even more important biomarker for viral infection dynamics and associated shifts in ploidy.
Since 1N cells are resistant to viral infection (Frada et al., 2008) and sGSL is linked with susceptibility in several strains of 2N E. huxleyi (Fulton et al., 2014), the absence of sGSL from 1N cells further implicates sGSL as playing a key role in viral infection (Fulton et al., 2014). Sialic acid moieties similar to that of sGSL are implicated as ligands for viral attachment in the cyanobacterium Prochlorococcus (Avrani et al., 2011; Fulton et al., 2014). It has been speculated therefore, that viral attachment and entry, facilitated by sGSL, may be the means by which this resistance is achieved (Fulton et al., 2014). Furthermore, it has been speculated that sGSL may have intrinsic function in the production or externalization of the coccoliths that characterize the exterior of the calcifying 2N phase (Fulton et al., 2014). It is noteworthy therefore, that the 1N phase that does not produce sGSL also does not produce coccoliths, further suggesting a link between sGSL and calcification.
Untargeted Lipidomics and Biomarker Selection
By using PLS-DA to analyse the untargeted lipidomic data, we have highlighted molecular species diagnostic of each 1N, 2N, and infected 2N cells (Table 1). These species were assigned identities based upon matches between accurate m/z and an extensive database of lipids. The included assignments are supported by secondary MS2 data. Due to the nature of the all ion fragmentation MS2 method applied in the interest of unbiased methodology, incorrect assignments of co-eluting species may occur in some cases. As such the assigned lipid identities in the unbiased analyses are presented as tentative. The differential abundances of each species give a quantitative representation for the discovery of potential biomarkers.
For the uninfected 2N control, the known susceptibility biomarker sGSL (Fulton et al., 2014) and related species were the top ranked assigned hits, in both positive and negative ion mode. This observation is in agreement with the targeted data, where sGSL was absent from the uninfected 1N cultures, and reduced in abundance in the infected 2N case. In negative ion mode, BLL(18:1/22:6) was ranked 3rd for the uninfected 2N cultures. BLL(18:1/22:6) is a known marker of E. huxleyi, whose concentration has been shown to drop under viral infection (Fulton et al., 2014). At the present time, sGSL and BLL (18:1/22:6) have not been reported in any other species than E. huxleyi. By contrast, PC(34:5), MGDG(36:9), and SQDG(40:8) which were ranked 5th in positive, 4th and 5th in negative ion mode respectively, are common polar membrane glycerolipids in eukaryotic microalgae (Popendorf et al., 2011a; Brandsma et al., 2012). These observations underscore the challenge of developing these biomarkers for use in the field: a molecule must be both diagnostic for E. huxleyi viral infection and ploidy and absent in all other marine microbes. The former criterion is addressed with the data presented here, but the latter will only be met after the lipidomes of many additional marine taxa are examined using the techniques similar to those employed here. In the meantime, the biomarkers we identified by untargeted lipidomics should be applied with due discretion.
In the uninfected 1N cultures, the top hits in positive ion mode appeared to be a form of 31:0 wax ester or alkenoate. It is possible that changes in this molecule could reflect differences in the amounts of long chain alkenones in 1N cells. Alkenones are widely used in palaeoceanography temperature reconstructions (Volkman et al., 1980; Prahl and Wakeham, 1987). Direct comparisons between this 31:0 wax ester/alkenoate and alkenones remain to be conducted.
The 3rd and 4th ranked species in 1 N cultures in positive ion mode were matched to a GSL(t40:0) and GSL(t40:1) species. These GSLs appear to share some structural similarities with archetypal forms of hGSL (GSL(d41:5(OH)) and vGSL (GSL(t39:0(OH)) identified by Vardi et al. (2009, 2012). These haploid specific GSLs may be the source of the observed vGSL-like species in the targeted uninfected haploid analyses, discussed previously. In light of the aforementioned targeted GSL data, these haploid GSLs certainly warrant further characterization. In negative ion mode, Cer(d18:1/22:0(OH)) and Cer(d18:1/22:1(OH)) hydroxyceramide species were ranked 2nd and 3rd for the uninfected 1N cultures. These ceramides are effectively the same chemical composition as GSL minus the glycosyl headgroup. Furthermore, it is likely that the GSL(t40:1) highlighted is in fact the Cer(d18:1/22:0(OH)) ceramide moiety with a glycosyl headgroup, although this could not be confirmed from the MS2 data. Interestingly, upregulation of enzymes responsible for the production of ceramides from the hydrolysis of the beta-glycosidic linkages of GSLs is a characteristic response of 2N cells to viral infection (Rosenwasser et al., 2014). To our knowledge, the GSL(t40:0) and GSL(t40:1) species have not been previously reported in any marine microbial organism, although they are closely related chemically to the other GSLs. Thus, these GSL species represent, pending further validation and characterization, candidate biomarkers for 1N E. huxleyi. 1N E. huxleyi are not easily identifiable in field samples by classic microscopy techniques (Von Dassow et al., 2009) and lipid biomarkers have particular utility in bulk environmental samples, such as filtered particulate organic material collected from the water column or sinking particulate trap matter, where other methods may not be applicable.
Finally, a number of glyceroglycolipids appeared indicative of the uninfected 1N cultures. MGDG(32:5) was ranked 5th in positive ion mode and LMGDG(22:6), DGDG(32:5) and DGDG(30:6) were ranked 1st, 4th, and 5th in negative ion mode. Glyceroglycolipids are typically associated with the thylakoid membranes of the chloroplast (Petroutsos et al., 2014). Our analysis highlights differences in these photosynthetic membrane lipids and alludes to some implication of ploidy upon the photosynthetic apparatus. However, these are fairly common molecules that are unlikely to be of much utility as biomarkers for E. huxleyi viral infection or ploidy (Popendorf et al., 2011a; Brandsma et al., 2012).
For the infected 2N cultures, the PLS-DA model highlights a series of TAGs found under positive ionization as indicative. TAG biosynthesis is commonly upregulated in phytoplankton in response to a variety of stressors, and TAGs are found primarily in lipid bodies. TAGs are unlikely to be attributable to heterotrophic bacterial contaminants as they are not generally produced in significant quantities by bacteria (Alvarez and Steinbüchel, 2002). It has been proposed that EhV capsid assembly occurs via a mechanism similar to that of the Hepatitis C virus (Herker and Ott, 2011; Fulton et al., 2014), where lipids are incorporated from the interface of lipid bodies and the endoplasmic reticulum. In uninfected 2N E. huxleyi, these lipid bodies are composed mainly of alkenones, alkenoates, and small quantities of TAGs and other lipids (Eltgroth et al., 2005). Research on human hepatocyte cells shows that TAGs are critical to Hepatitis C capsid assembly (Liefhebber et al., 2014). Thus, we speculate that the observed increase in a number of TAG species in E. huxleyi under EhV infection may result from the virus upregulating TAG biosynthesis in order to assist capsid assembly.
In negative ion mode, vGSL and BLL(22:6/22:6) represent the top four assigned species indicative of the infected cultures, in line with previous observations (Vardi et al., 2012; Fulton et al., 2014) and the targeted data discussed previously, while a 36:2 wax ester/alkenoate species is ranked fifth. None of these molecules are likely to be derived from contaminating bacteria in the cultures, but instead are of decidedly coccolithophore origin (Eltgroth et al., 2005; Fulton et al., 2014; Ray et al., 2014). A molecule with the exact same elemental formula, 36:2 methyl alkenoate, was identified in E. huxleyi lipid bodies (Eltgroth et al., 2005). Closely related alkenones are abundant in EhV virions and alkenone content in infected E. huxleyi has previously been demonstrated to be increased (Fulton et al., 2014). As mentioned previously, alkenoates and alkenones are thought to occur primarily in lipid bodies (Eltgroth et al., 2005). We suggest therefore, that this 36:2 wax ester/alkenoate species we observed was likely localized to lipid bodies. If true, this result, in conjunction with the TAG data mentioned above, further implicates the role of lipid bodies in viral assembly (Fulton et al., 2014).
In addition to the assigned species discussed previously, many novel biomarkers could not be assigned from our database and/or corroborated by all ion fragmentation MS2 (Supplementary Table 2). Many of these species demonstrate absence/presence behavior between cultures and have potential as biomarkers of EhV infection or ploidy in E. huxleyi. The assigned and unassigned candidate biomarkers discovered by these unbiased analyses are tantalizing. A further biomarker validation study, utilizing targeted MS2/MS3 fragmentation in conjunction with high resolution mass spectrometry has the potential to assign and confirm the identities of the additional molecular species.
Conclusions
We have presented critical new data on the glycerolipids and glycosphingolipids of 1N E. huxleyi by the application of a targeted lipidomics approach. Comparison of these data to that of infected and uninfected 2N E. huxleyi has provided new insights on ploidy and viral infection. Firstly, we note the detection of trace levels of the EhV type viral glycosphingolipid (vGSL) in the uninfected 1N samples. The implications of this observation are as yet unclear but should be considered in the application of vGSL as a biomarker of EhV infection. Secondly, we find that the sialic glycosphingolipid (sGSL), a proposed marker of susceptibility to EhV infection in E. huxleyi, was absent from the uninfected 1N cell. This absence provides further evidence for the role of sGSL in EhV infection and may confer 1N E. huxleyi its documented resistance to EhV.
In addition, we have highlighted promising lipid biomarker candidates for each of the uninfected 2N, 1N, and infected 2N cases by way of untargeted lipidomics. Differentially enriched biomarker candidates have been tentatively identified, such as novel glycosphingolipids, hydroxyceramides and a wax ester/alkanoate that are highly indicative of the 1N phase. Following further biomarker validation and structural studies these lipids may yield powerful lipid biomarkers for the determination of 1N E. huxleyi, identification of which is not feasible by classic microscopy techniques.
These findings contribute to our understanding of the critical role of lipids in E. huxleyi/EhV interactions. Moreover, our findings further the potential of lipid based biomarkers as indicators of the progression of infection and life cycle in E. huxleyi. Extrapolation from simplified cell culture models to complex environmental systems must be approached with due caution and the discussed biomarkers require further validation in culture and in situ. However, such biomarkers have the potential to yield great insight into the processes that dictate the characteristics of E. huxleyi blooms, translating to substantial implications for global carbon cycling and climate.
Conflict of Interest Statement
The authors declare that the research was conducted in the absence of any commercial or financial relationships that could be construed as a potential conflict of interest.
Acknowledgments
The authors would like to thank J. Tagliafere and J. Ossolinski for assistance in the laboratory and J. Collins, J. Fulton, and B. Edwards for helpful discussions about data analysis. This work was funded by the University of Southampton—Vice Chancellor's Scholarship Award (JH), University of Southampton—Diamond Jubilee Fellowship (BV), Graduate School of the National Oceanography Centre WHOI Exchange Award (JH), and the Gordon and Betty Moore Foundation through Grant GBMF3301 (BV and AV).
Supplementary Material
The Supplementary Material for this article can be found online at: http://journal.frontiersin.org/article/10.3389/fmars.2015.00081
References
Alvarez, H., and Steinbüchel, A. (2002). Triacylglycerols in prokaryotic microorganisms. Appl. Microbiol. Biotechnol. 60, 367–376. doi: 10.1007/s00253-002-1135-0
Avrani, S., Wurtzel, O., Sharon, I., Sorek, R., and Lindell, D. (2011). Genomic island variability facilitates Prochlorococcus-virus coexistence. Nature 474, 604–608. doi: 10.1038/nature10172
Ballabio, D., and Consonni, V. (2013). Classification tools in chemistry. Part 1: linear models. PLS-DA. Anal. Methods 5, 3790–3798. doi: 10.1039/C3AY40582F
Bell, M. V., and Pond, D. (1996). Lipid composition during growth of motile and coccolith forms of Emiliania huxleyi. Phytochemistry 41, 465–471. doi: 10.1016/0031-9422(95)00663-X
Bligh, E. G., and Dyer, W. J. (1959). A rapid method of total lipid extraction and purification. Can. J. Biochem. Physiol. 37, 911–917. doi: 10.1139/o59-099
Borchard, C., and Engle, A. (2012). Organic matter exudation by Emiliania huxleyi under simulated future ocean conditions. Biogeosciences 9, 3405–3423. doi: 10.5194/bg-9-3405-2012
Brandsma, J., Hopmans, E. C., Philippart, C. J. M., Veldhuis, M. J. W., Schouten, S., and Sinninghe Damsté, J. S. (2012). Low temporal variation in the intact polar lipid composition of North Sea coastal marine water reveals limited chemotaxonomic value. Biogeosciences 9, 1073–1084. doi: 10.5194/bg-9-1073-2012
Bratbak, G., Egge, J. K., and Heldal, M. (1993). Viral mortality of the marine alga Emiliania huxleyi (Haptophyceae) and termination of algal blooms. Mar. Ecol. Prog. Ser. 93, 39–48. doi: 10.3354/meps093039
Brussaard, C., Gast, G., van Duyl, F., and Riegman, R. (1996). Impact of phytoplankton bloom magnitude on a pelagic microbial food web. Mar. Ecol. Prog. Ser. 144, 211–221. doi: 10.3354/meps144211
Carini, P., Van Mooy, B. A. S., Thrash, J. C., White, A., Zhao, Y., Campbell, E. O., et al. (2015). SAR11 lipid renovation in response to phosphate starvation. Proc. Natl. Acad. Sci. U.S.A. 112, 7767–7772. doi: 10.1073/pnas.1505034112
Eltgroth, M. L., Watwood, R. L., and Wolfe, G. V. (2005). Production and cellular localization of neutral long-chain lipids in the haptophyte algae isochrysis galbana and Emiliania huxleyi. J. Phycol. 41, 1000–1009. doi: 10.1111/j.1529-8817.2005.00128.x
Frada, M. J., Bidle, K. D., Probert, I., and de Vargas, C. (2012). In situ survey of life cycle phases of the coccolithophore Emiliania huxleyi (Haptophyta). Environ. Microbiol. 14, 1558–1569. doi: 10.1111/j.1462-2920.2012.02745.x
Frada, M., Probert, I., Allen, M. J., Wilson, W. H., and de Vargas, C. (2008). The “Cheshire Cat” escape strategy of the coccolithophore Emiliania huxleyi in response to viral infection. Proc. Natl. Acad. Sci. U.S.A. 105, 15944–15949. doi: 10.1073/pnas.0807707105
Fuhrman, J. A. (1999). Marine viruses and their biogeochemical and ecological effects. Nature 399, 541–548. doi: 10.1038/21119
Fulton, J. M., Fredricks, H. F., Bidle, K. D., Vardi, A., Kendrick, B. J., DiTullio, G. R., et al. (2014). Novel molecular determinants of viral susceptibility and resistance in the lipidome of Emiliania huxleyi. Environ. Microbiol. 16, 1137–1149. doi: 10.1111/1462-2920.12358
Green, J. C., Course, P. A., and Tarran, G. A. (1996). The life-cycle of Emiliania huxleyi: a brief review and a study of relative ploidy levels analysed by flow cytometry. J. Mar. Syst. 9, 33–44. doi: 10.1016/0924-7963(96)00014-0
Gundersen, K., Heldal, M., Norland, S., Purdie, D. A., and Knap, A. H. (2002). Elemental C, N, and P content of individual bacteria collected at the Bermuda Atlantic Time-Series (BATS) site. Limnol. Oceanogr. 47, 1525–1530. doi: 10.4319/lo.2002.47.5.1525
Herker, E., and Ott, M. (2011). Unique ties between hepatitis C virus replication and intracellular lipids. Trends Endocrinol. Metab. 22, 241–248. doi: 10.1016/j.tem.2011.03.004
Holligan, P. M., Viollier, M., Harbour, D. S., Camus, P., and Champagne-Philippe, M. (1983). Satellite and ship studies of coccolithophore production along a continental shelf edge. Nature 304, 339–342. doi: 10.1038/304339a0
Houdan, A., Billard, C., Marie, D., Not, F., Sáez, A. G., Young, J. R., et al. (2004). Holococcolithophore—heterococcolithophore (Haptophyta) life cycles: flow cytometric analysis of relative ploidy levels. Syst. Biodivers. 1, 453–465. doi: 10.1017/S1477200003001270
Houdan, A., Probert, I., Van Lenning, K., and Lefebvre, S. (2005). Comparison of photosynthetic responses in diploid and haploid life-cycle phases of Emiliania huxleyi (Prymnesiophyceae). Mar. Ecol. Prog. Ser. 292, 139–146. doi: 10.3354/meps292139
Huang, N., Siegel, M. M., Kruppa, G. H., and Laukien, F. H. (1999). Automation of a Fourier transform ion cyclotron resonance mass spectrometer for acquisition, analysis, and e-mailing of high-resolution exact-mass electrospray ionization mass spectral data. J. Am. Soc. Mass Spectrom. 10, 1166–1173. doi: 10.1016/S1044-0305(99)00089-6
Hummel, J., Segu, S., Li, Y., Irgang, S., Jueppner, J., and Giavalisco, P. (2011). Ultra performance liquid chromatography and high resolution mass spectrometry for the analysis of plant lipids. Front. Plant Sci. 2:54. doi: 10.3389/fpls.2011.00054
Jover, L. F., Effler, T. C., Buchan, A., Wilhelm, S. W., and Weitz, J. S. (2014). The elemental composition of virus particles: implications for marine biogeochemical cycles. Nat. Rev. Micro. 12, 519–528. doi: 10.1038/nrmicro3289
Keller, M. D., Selvin, R. C., Claus, W., and Guillard, R. R. L. (1987). Media for the culture of oceanic ultraphytoplankton. J. Phycol. 23, 633–638. doi: 10.1111/j.1529-8817.1987.tb04217.x
Klaveness, D. (1972). Coccolithus huxleyi (Lohm.) Kamptn II. The flagellate cell, aberrant cell types, vegetative propagation and life cycles. Br. Phycol. J. 7, 309–318. doi: 10.1080/00071617200650321
Lehahn, Y., Koren, I., Schatz, D., Frada, M., Sheyn, U., Boss, E., et al. (2014). Decoupling physical from biological processes to assess the impact of viruses on a mesoscale algal bloom. Curr. Biol. 24, 2041–2046. doi: 10.1016/j.cub.2014.07.046
Liefhebber, J. M. P., Hague, C. V., Zhang, Q., Wakelam, M. J. O., and McLauchlan, J. (2014). Modulation of triglyceride and cholesterol ester synthesis impairs assembly of infectious Hepatitis C virus. J. Biol. Chem. 289, 21276–21288. doi: 10.1074/jbc.M114.582999
Mackinder, L. C. M., Worthy, C. A., Biggi, G., Hall, M., Ryan, K. P., Varsani, A., et al. (2009). A unicellular algal virus, Emiliania huxleyi virus 86, exploits an animal-like infection strategy. J. Gen. Virol. 90, 2306–2316. doi: 10.1099/vir.0.011635-0
Martin, P., Van Mooy, B. A. S., Heithoff, A., and Dyhrman, S. T. (2011). Phosphorus supply drives rapid turnover of membrane phospholipids in the diatom Thalassiosira pseudonana. ISME J. 5, 1057–1060. doi: 10.1038/ismej.2010.192
Mausz, M. A., and Pohnert, G. (2014). Phenotypic diversity of diploid and haploid Emiliania huxleyi cells and of cells in different growth phases revealed by comparative metabolomics. J. Plant Physiol. 172, 137–148. doi: 10.1016/j.jplph.2014.05.014
Monier, A., Pagarete, A., de Vargas, C., Allen, M. J., Read, B., Claverie, J. -M., et al. (2009). Horizontal gene transfer of an entire metabolic pathway between a eukaryotic alga and its DNA virus. Genome Res. 19, 1441–1449. doi: 10.1101/gr.091686.109
Paasche, E. (2001). A review of the coccolithophorid Emiliania huxleyi (Prymnesiophyceae), with particular reference to growth, coccolith formation, and calcification-photosynthesis interactions. Phycologia 40, 503–529. doi: 10.2216/i0031-8884-40-6-503.1
Petroutsos, D., Amiar, S., Abida, H., Dolch, L.-J., Bastien, O., Rébeillé, F., et al. (2014). Evolution of galactoglycerolipid biosynthetic pathways—From cyanobacteria to primary plastids and from primary to secondary plastids. Prog. Lipid Res. 54, 68–85. doi: 10.1016/j.plipres.2014.02.001
Popendorf, K. J., Fredricks, H. F., and Van Mooy, B. A. S. (2013). Molecular ion-independent quantification of polar glycerolipid classes in marine plankton using triple quadrupole MS. Lipids 48, 185–195. doi: 10.1007/s11745-012-3748-0
Popendorf, K. J., Lomas, M. W., and Van Mooy, B. A. S. (2011a). Microbial sources of intact polar diacylglycerolipids in the Western North Atlantic Ocean. Org. Geochem. 42, 803–811. doi: 10.1016/j.orggeochem.2011.05.003
Popendorf, K. J., Tanaka, T., Pujo-Pay, M., Lagaria, A., Courties, C., Conan, P., et al. (2011b). Gradients in intact polar diacylglycerolipids across the Mediterranean Sea are related to phosphate availability. Biogeosciences 8, 3733–3745. doi: 10.5194/bg-8-3733-2011
Prahl, F. G., and Wakeham, S. G. (1987). Calibration of unsaturation patterns in long-chain ketone compositions for palaeotemperature assessment. Nature 330, 367–369. doi: 10.1038/330367a0
Ray, J. L., Haramaty, L., Thyrhaug, R., Fredricks, H. F., Van Mooy, B. A. S., Larsen, A., et al. (2014). Virus infection of Haptolina ericina and Phaeocystis pouchetii implicates evolutionary conservation of programmed cell death induction in marine haptophyte–virus interactions. J. Plankton Res. 36, 943–955. doi: 10.1093/plankt/fbu029
Rokitta, S. D., de Nooijer, L. J., Trimborn, S., de Vargas, C., Rost, B., and John, U. (2011). Transcriptome analyses reveal differential gene expression patterns between the life-cycle stages of Emiliania huxleyi (Haptophyta) and reflect specialization to different ecological niches. J. Phycol. 47, 829–838. doi: 10.1111/j.1529-8817.2011.01014.x
Rose, S. L., Fulton, J. M., Brown, C. M., Natale, F., Van Mooy, B. A. S., and Bidle, K. D. (2014). Isolation and characterization of lipid rafts in Emiliania huxleyi: a role for membrane microdomains in host–virus interactions. Environ. Microbiol. 16, 1150–1166. doi: 10.1111/1462-2920.12357
Rosenwasser, S., Mausz, M. A., Schatz, D., Sheyn, U., Malitsky, S., Aharoni, A., et al. (2014). Rewiring host lipid metabolism by large viruses determines the fate of Emiliania huxleyi, a bloom-forming alga in the Ocean. Plant Cell 26, 2689–2707. doi: 10.1105/tpc.114.125641
Sakurai, I., Shen, J.-R., Leng, J., Ohashi, S., Kobayashi, M., and Wada, H. (2006). Lipids in oxygen-evolving photosystem II complexes of cyanobacteria and higher plants. J. Biochem. 140, 201–209. doi: 10.1093/jb/mvj141
Schatz, D., Shemi, A., Rosenwasser, S., Sabanay, H., Wolf, S. G., Ben-Dor, S., et al. (2014). Hijacking of an autophagy-like process is critical for the life cycle of a DNA virus infecting oceanic algal blooms. New Phytol. 204, 854–863. doi: 10.1111/nph.13008
Schroeder, D. C., Oke, J., Malin, G., and Wilson, W. H. (2002). Coccolithovirus (Phycodnaviridae): characterisation of a new large dsDNA algal virus that infects Emiliana huxleyi. Arch. Virol. 147, 1685–1698. doi: 10.1007/s00705-002-0841-3
Shemi, A., Ben-Dor, S., and Vardi, A. (2015). Elucidating the composition and conservation of the autophagy pathway in photosynthetic eukaryotes. Autophagy 11, 701–715. doi: 10.1080/15548627.2015.1034407
Stray, S. J., Cummings, R. D., and Air, G. M. (2000). Influenza virus infection of desialylated cells. Glycobiology 10, 649–658. doi: 10.1093/glycob/10.7.649
Sud, M., Fahy, E., Cotter, D., Brown, A., Dennis, E. A., Glass, C. K., et al. (2007). LMSD: LIPID MAPS structure database. Nucleic Acids Res. 35, D527–D532. doi: 10.1093/nar/gkl838
Suttle, C. A. (2007). Marine viruses—major players in the global ecosystem. Nat. Rev. Micro. 5, 801–812. doi: 10.1038/nrmicro1750
Tyrrell, T., and Merico, A. (2004). “Emiliania huxleyi: bloom observations and the conditions that induce them,” in Coccolithophores SE—4, eds H. R. Thierstein and J. R. Young (Berlin; Heidelberg: Springer), 75–97.
Van den Berg, R. A., Hoefsloot, H. C. J., Westerhuis, J. A., Smilde, A. K., and van der Werf, M. J. (2006). Centering, scaling, and transformations: improving the biological information content of metabolomics data. BMC Genomics 7:142. doi: 10.1186/1471-2164-7-142
Van Etten, J. L., Graves, M. V., Müller, D. G., Boland, W., and Delaroque, N. (2002). Phycodnaviridae– large DNA algal viruses. Arch. Virol. 147, 1479–1516. doi: 10.1007/s00705-002-0822-6
Van Mooy, B. A. S., Fredricks, H. F., Pedler, B. E., Dyhrman, S. T., Karl, D. M., Koblížek, M., et al. (2009). Phytoplankton in the ocean use non-phosphorus lipids in response to phosphorus scarcity. Nature 458, 69–72. doi: 10.1038/nature07659
Vardi, A., Haramaty, L., Van Mooy, B. A. S., Fredricks, H. F., Kimmance, S. A., Larsen, A., et al. (2012). Host–virus dynamics and subcellular controls of cell fate in a natural coccolithophore population. Proc. Natl. Acad. Sci. U.S.A. 109, 19327–19332. doi: 10.1073/pnas.1208895109
Vardi, A., Van Mooy, B. A. S., Fredricks, H. F., Popendorf, K. J., Ossolinski, J. E., Haramaty, L., et al. (2009). Viral glycosphingolipids induce lytic infection and cell death in marine phytoplankton. Science 326, 861–865. doi: 10.1126/science.1177322
Volkman, J. K., Eglinton, G., Corner, E. D. S., and Sargent, J. R. (1980). Novel unsaturated straight-chain C37-C39 methyl and ethyl ketones in marine sediments and a coccolithophore Emiliania huxleyi. Phys. Chem. Earth 12, 219–227. doi: 10.1016/0079-1946(79)90106-x
Von Dassow, P., Ogata, H., Probert, I., Wincker, P., Da Silva, C., Audic, S., et al. (2009). Transcriptome analysis of functional differentiation between haploid and diploid cells of Emiliania huxleyi, a globally significant photosynthetic calcifying cell. Genome Biol. 10, 1–33. doi: 10.1186/gb-2009-10-10-r114
Weber, R. J. M., Li, E., Bruty, J., He, S., and Viant, M. R. (2012). MaConDa: a publicly accessible mass spectrometry contaminants database. Bioinformatics 28, 2856–2857. doi: 10.1093/bioinformatics/bts527
Westbroek, P., Brown, C. W., van Bleijswijk, J., Brownlee, C., Brummer, G. J., Conte, M., et al. (1993). A model system approach to biological climate forcing. The example of Emiliania huxleyi. Glob. Planet. Change 8, 27–46. doi: 10.1016/0921-8181(93)90061-R
Wilson, W. H., Schroeder, D. C., Allen, M. J., Holden, M. T. G., Parkhill, J., Barrell, B. G., et al. (2005). Complete genome sequence and lytic phase transcription profile of a coccolithovirus. Science 309, 1090–1092. doi: 10.1126/science.1113109
Keywords: Emiliania huxleyi, lipidomics, coccolithovirus, glycosphingolipid, glycerolipids, haploid
Citation: Hunter JE, Frada MJ, Fredricks HF, Vardi A and Van Mooy BAS (2015) Targeted and untargeted lipidomics of Emiliania huxleyi viral infection and life cycle phases highlights molecular biomarkers of infection, susceptibility, and ploidy. Front. Mar. Sci. 2:81. doi: 10.3389/fmars.2015.00081
Received: 20 May 2015; Accepted: 25 September 2015;
Published: 13 October 2015.
Edited by:
Anton F. Post, Coastal Resources Center, University of Rhode Island, USAReviewed by:
Kathleen Scott, University of South Florida, USAJoaquin Martinez Martinez, BIgelow Laboratory for Ocean Sciences, USA
Copyright © 2015 Hunter, Frada, Fredricks, Vardi and Van Mooy. This is an open-access article distributed under the terms of the Creative Commons Attribution License (CC BY). The use, distribution or reproduction in other forums is permitted, provided the original author(s) or licensor are credited and that the original publication in this journal is cited, in accordance with accepted academic practice. No use, distribution or reproduction is permitted which does not comply with these terms.
*Correspondence: Jonathan E. Hunter, ai5odW50ZXJAc290b24uYWMudWs=