 Heidi Ahonen1,2*
 Andrew D. Lowther3
 Robert G. Harcourt1
 Simon D. Goldsworthy4
 Isabelle Charrier2
 Adam J. Stow1
- 1Department of Biological Sciences, Macquarie University, North Ryde, NSW, Australia
- 2Centre National de la Recherche Scientifique, UMR 9197, Institut des Neurosciences Paris-Saclay, Université Paris-Saclay, Univ Paris-Sud, Orsay, France
- 3Norwegian Polar Institute, Tromsø, Norway
- 4South Australian Research and Development Institute, Adelaide, SA, Australia
Describing patterns of connectivity throughout a species range is critical to conservation management. In common with other mammals, pinnipeds typically display male-biased dispersal. Earlier studies using mitochondrial DNA showed that the endangered Australian sea lion (Neophoca cinerea) exhibits extreme matrilineal structure throughout its range. If male dispersal were similarly restricted, most breeding colonies may not receive sufficient levels of new genetic variation to buffer against risks associated with inbreeding and environmental change. To address these concerns we used 16 microsatellite loci to obtain a more highly resolving measure of genetic structure among colonies and determine whether dispersal is male-biased. We found that both male and female Australian sea lions are highly philopatric with limited dispersal. Within those constraints, when animals disperse between close colonies (<110 km) there is a tendency for males to move further than females. Our findings are intriguing considering the dispersal potential of Australian sea lions and the unique asynchronous breeding opportunities that might be expected to provide an incentive for male reproductive movements between geographically close colonies.
Introduction
Knowledge of dispersal behavior is fundamental to explaining the ecological requirements of an organism. Effective dispersal results in the redistribution of organisms and their genes, thus influencing a wide range of processes including population regulation and dynamics, spatial distribution and genetic structure (Lidicker, 1975; Taylor and Taylor, 1977; Greenwood, 1980; Bowler and Benton, 2005). Limited dispersal may cause inbreeding and genetic differentiation among neighboring groups, whereas widespread dispersal and gene flow may prevent localized adaptation (Wright, 1943, 1946). Alternately, it is possible that strong localized adaptation may inhibit gene flow, either through strong selection, or mechanisms to prevent outbreeding depression (Garant et al., 2007). Individuals that disperse are often predominantly of one sex- or age- class and movements may be voluntary or enforced. Determining the degree and significance of sex- or age- class dispersal offers information that can be important for designing conservation management strategies.
Dispersal in many species is sex-biased (Greenwood, 1980). Female philopatry (tendency of an individual to stay in or habitually return to a particular area) and male dispersal are considered to be typical in mammals, while female-biased dispersal is pervasive in birds (Greenwood, 1980; Wolff, 1994; Clarke et al., 1997). It is widely accepted that which sex disperses may be a function of the mating system (Greenwood, 1980; Dobson, 1982; Perrin and Goudet, 2001). Greenwood (1980) proposed that male-biased dispersal in mammals is associated with polygyny and female defense by males, whereas avian female-biased dispersal is associated with monogamy and resource defense by males. Along with social competition, inbreeding avoidance can account for sex-biased dispersal (Greenwood, 1980; Dobson, 1982; Pusey, 1987; Clutton-Brock, 1989; Perrin and Mazalov, 1999, 2000), as can kin competition and cooperation (Perrin and Goudet, 2001; Perrin and Lehmann, 2001; Le Galliard et al., 2006; Lawson Handley and Perrin, 2007; Dobson, 2013).
Pinnipeds, like many marine mammals, are capable of moving many hundreds, even thousands, of kilometers. For those pinniped species that breed on land (i.e., non-ice breeders and including all otariids or eared seals), most display typical mammalian male-biased dispersal. Females are more likely to remain within their natal group and show sufficiently strong philopatry to create significant matrilineal substructure detectable with mitochondrial DNA (mtDNA) markers (Andersen et al., 1998; Burg et al., 1999; Hoelzel et al., 2001; Baker et al., 2005; Gonzalez-Suarez et al., 2009). However, when biparentally inherited nuclear markers have been used, while structuring may persist, overall the patterns are weaker, indicating that females are usually more philopatric than males (Andersen et al., 1998; Burg et al., 1999; Hoelzel et al., 2001; Hoffman et al., 2006; Gonzalez-Suarez et al., 2009).
Australia's only endemic otariid, the Australian sea lion (Neophoca cinerea), ranges from the Houtman Abrolhos Islands in Western Australia (WA) to the Pages Islands in South Australia (SA). The current species census estimate of ~14,700 individuals makes it one of the rarest otariids in the world and listed as endangered on the IUCN “Red List” (Shaughnessy et al., 2011). In the late eighteenth and early nineteenth century the Australian sea lion was subjected to unregulated harvest, resulting in extirpation of colonies in Bass Strait and reduction in numbers within the current range (Ling, 1999; Shaughnessy et al., 2005; Robinson et al., 2008). Unlike the two sympatric fur seal species, the Australian fur seal (Arctocephalus pusillus doriferus) and the New Zealand fur seal (Arctocephalus forsteri), the recovery for Australian sea lions has neither been rapid nor sustained (Shaughnessy et al., 2011). Today, animals are distributed across 76 breeding colonies (18 of these are classified as haul-out sites with occasional pupping) and approximately 86% of pups are born in South Australia, with the remaining 14% in Western Australian colonies (Goldsworthy et al., 2009). Over 60% of Australian sea lion colonies are defined as “small,” producing fewer than 30 pups per breeding episode (Goldsworthy et al., 2009). Only eight colonies produce more than 100 pups per breeding season and breeding is on a 17–18 month cycle (Higgins, 1993; Shaughnessy et al., 2011). This is in stark contrast to many other otariid species such as New Zealand fur seals where thousands of pups are born annually within large colonies (e.g., Goldsworthy and Shaughnessy, 2013). This comparatively slow individual reproductive rate combined with small colony sizes across a wide geographic range means that the Australian sea lion is highly susceptible to stochastic processes and increases in mortality rates. Bycatch in demersal gillnet fisheries is already a significant cause of increased mortality (Goldsworthy and Page, 2007; Hamer et al., 2013) and vulnerability to environmental change is a looming long-term threat (Schumann et al., 2013).
Two recent mitochondrial DNA studies have shown that females exhibit strong natal site philopatry (Campbell et al., 2008; Lowther et al., 2012). Campbell et al. (2008) suggested almost no effective migration of adult females by reporting incredibly high population differentiation across colonies (ΦST = 0.93). However, this study concentrated mainly on Western Australian colonies and covered only a small part of the Australian sea lion range in South Australia. Lowther et al. (2012) extended the mtDNA study across South Australia including 17 of the largest colonies. Their findings showed evidence of greater haplotype sharing and lower degree of population subdivision (ΦST = 0.75), but still supported strong matrilineal structuring among Australian sea lion colonies. Matrilineal population structure was evident at very fine geographical scales (<40 km) with three distinct clusters of colonies that share multiple haplotypes being interspersed with isolated breeding sites. Pronounced female genetic structure combined with the species vulnerability to anthropogenic impacts emphasizes the importance of determining the extent of male movement and male-mediated gene flow. If male dispersal were as restricted as female movement, most breeding colonies would likely not be able to buffer against risks associated with inbreeding and environmental change.
In contrast to most species of pinniped, the unusual breeding biology of the Australian sea lion makes the dispersal behavior of males difficult to predict. Typically in terrestrially breeding pinnipeds, synchronized breeding across colonies means males can only sire pups from a single colony in any one season and long-term (multi-year) site fidelity imparts a higher degree of success for individual males (Harcourt et al., 2007a). In contrast, the Australian sea lion has a prolonged, 17–18 month reproductive cycle that is asynchronous across its range, even between geographically close colonies (Higgins, 1993; Gales et al., 1994; Shaughnessy et al., 2011). Accordingly, Australian sea lion males could potentially sire pups throughout much of the year by visiting different colonies. Under this scenario, male-mediated gene flow could result in genetic panmixia amongst colonies within the extent of male reproductive movements. A preliminary study by Campbell (2003) suggested gene flow across distances of 250–300 km, but was based on limited samples and few microsatellite loci.
To investigate dispersal and gene flow in this species we used 16 polymorphic microsatellite loci optimized for the Australian sea lion (Ahonen et al., 2013). Our aims were (i) to determine whether genetic partitioning is evident with biparentally inherited microsatellite markers and (ii) to evaluate whether male movement pattern reflects known female philopatry or follows typical mammalian male-biased dispersal.
Materials and Methods
Sample Collection and DNA Extraction
Biopsy samples were collected from adult Australian sea lions throughout their range. Tissue samples were obtained using Paxarms remote biopsy system (Paxarms New Zealand Ltd, http://www.paxarms.com/). A total of 392 biopsy samples were collected during 2009–2010 breeding season from nine breeding colonies. Six of these colonies are situated along the southern coast of South Australia (SA) and three along west coast of Western Australia (WA) (Figure 1). These colonies represent some of the largest breeding colonies of the species. Mean pup production in each colony varies from ca. 43 on Liguanea Island to ca. 206 on Olive Island (Shaughnessy et al., 2011). Both adult males and females were sampled, however female samples from three of the colonies were not available for this study. The inclusion of only adult individuals is seen as conservative test of philopatry. When using adult individuals there is some prospect that, they have dispersed already and we are likely to detect recent immigrants. Conversely, if we use only pups (pre-dispersal animals) we might bias the results toward apparent philopatry. Furthermore, use of adult individuals is recommended for many sex-biased dispersal analyses (Prugnolle and de Meeus, 2002). Sample numbers for each colony and sex are detailed in Table 1. Samples were preserved in 95% ethanol and total genomic DNA extracted using a standard salting out protocol (Sunnucks and Hales, 1996).
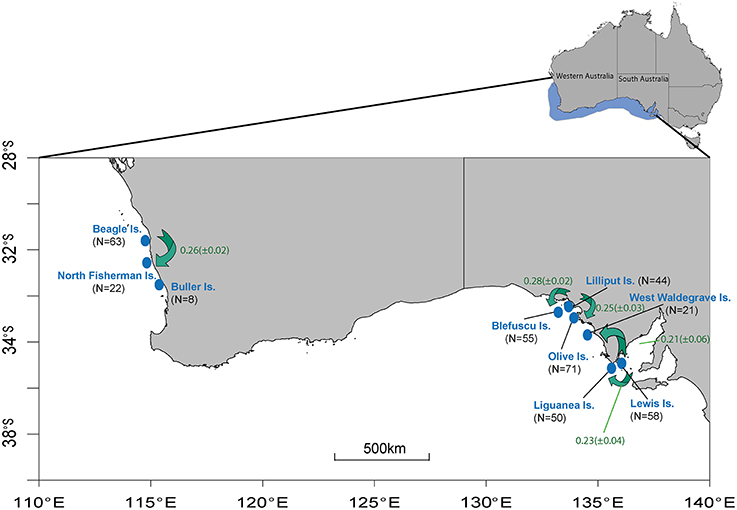
Figure 1. (Inset) Highlighted area represents the range across which Australian sea lions occur. (Main figure) Location of sampling sites across the species range. N represents the total number of sampled individuals for each breeding colony (see Table 1 for sample numbers for each sex). Green arrows and associated values (±SD) indicate the direction and magnitude of migration derived from the program BAYESASS. Proportion of individuals classified by BAYESASS as being sampled in their natal colony can be seen in Table S2.
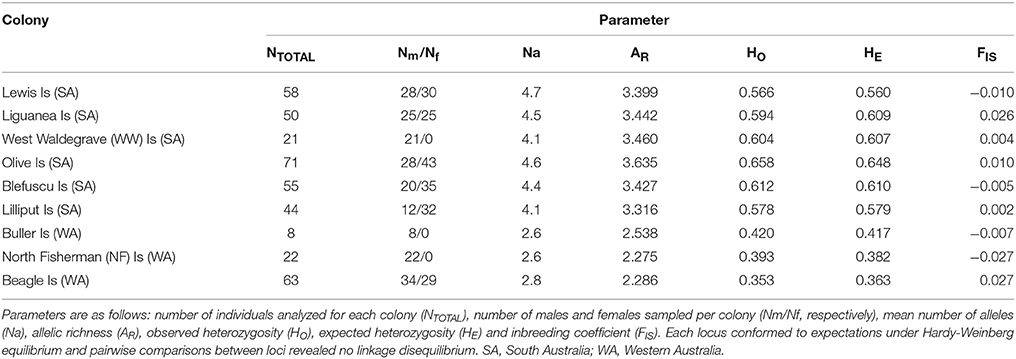
Table 1. Genetic diversity and heterozygosity in Australian sea lions.
Microsatellite Genotyping
We used 12 species specific microsatellite loci (Ahonen et al., 2013) and cross-amplified four loci developed for Galapagos sea lions (Wolf et al., 2006; Hoffman et al., 2007). Each of the forward primers was directly labeled using fluorescent dyes FAM, NED, VIC, and PET (ABI). PCR reactions contained ~10–50 ng genomic DNA, 200 μM each dNTP, 1 × Reaction Buffer, 2 mM MgCl2, 0.5 μM of each primer, 1 unit of Taq polymerase in a total volume of 10-μl. PCR conditions were as follows: Initial denaturation for 3 min at 94°C followed by five cycles of denaturation (94°C, 30 s), primer annealing (60, 58, 56, 54, and 52°C, 30 s), and polymerase extension (72°C, 45 s). Following this series 35 cycles of denaturation (94°C, 30 s), primer annealing (50°C, 30 s), and polymerase extension (72°C, 45 s) were performed before ending with a final extension (72°C, 10 min). PCR amplicons were then electrophoresed on an AB 3730xl DNA analyzer. Allele sizes were determined using an internal size standard LIZ and scored manually using Peak Scanner™ Software v.1.0 (Applied Biosystems). Ten percent of the samples were re-genotyped to ensure data integrity and scoring consistency. The rate of genotyping error was low ranging from 0 to 0.006 per allele/locus.
Data Analysis
Genetic Diversity
MICROCHECKER version 2.2.3 (van Oosterhout et al., 2004) was used to assess for scoring errors and null alleles. We checked for identical genotypes to ensure that individuals had not been sampled more than once. Only two males were sampled twice, in each case at two locations (on Lilliput and Blefuscu Islands, separated only by few kilometers). These two individuals were not included in our data set. Deviation from Hardy-Weinberg equilibrium was evaluated using Genepop version 4.0.10 (Raymond and Rousset, 1995). Tests for linkage disequilibrium between pairs of loci (with Bonferroni corrections for multiple tests) were conducted using FSTAT version 2.9.3.2 (Goudet, 1995). Genetic diversity measurements including number of alleles (Na), observed (HO), and expected (HE) heterozygosity, inbreeding coefficient (FIS), and allelic richness (AR) were calculated for each colony using the program FSTAT version 2.9.3.2 (Goudet, 1995). Colony differences in levels of allelic richness were tested for significance by using non-parametric Wilcoxon sign rank test.
Genetic Differentiation and Spatial Genetic Structure
To estimate the level of genetic variation among colonies, two different measures were used: the pairwise FST- values were estimated using FSTAT (Goudet, 1995) and the pairwise Jost's D values using the R package DEMEtics (Gerlach et al., 2010).
Spatial genetic structuring among colonies was examined using spatial autocorrelation analysis implemented in the software GenAlEx 6.5 (Peakall and Smouse, 2012). This analysis allows inferences to be made about spatial scale over which the genetic structure occurs. Here, genetic structure is characterized using genotypic similarity (r), a measure which is well suited to resolving levels gene flow and dispersal occurring at finer spatial and temporal scales than distance measures based solely on allele frequency. This is because genotypes are shuffled at each generation, therefore genotypic structure derived from genotypic similarity between individuals can be influenced by short-term processes such as the spatial distribution of close relatives (see Stow et al., 2001). By contrast distance measures based on allele frequency data at the population level detect the effects of isolation and drift, processes that typically take many more generations to be measurable. Genotypic similarity at different distance classes is distributed from −1 to 1 around the mean for the whole sample (= zero). Therefore, a positive value shows greater genetic similarity than the average, while a negative value shows genetic dissimilarity. The variable distance class option was used to manually enter distance classes. Distance classes included 0 km, representing individuals sampled at the same colony, and because the colonies are arranged in a more or less linear fashion, we could construct the other distance bins so that they sequentially incorporated additional colonies. The 95% confidence intervals (CIs) around a random distribution and each r estimate were used to assess the significance of any spatial autocorrelation. Mantel testing with Jost D as a measure of genetic divergence among colonies was used to further assess the relationship between genetic distance and geographical distance. Mantel testing was conducted with FST values for comparison. These calculations were performed using the R package Vegan (Oksanen et al., 2015). Geographic distances used in Mantel test were calculated as the shortest swimming distance (km) between colonies (Gonzalez-Suarez et al., 2009). The shortest distance between studied colonies was ca. 5 km between Lilliput Island and Blefuscu Island and the longest was ca. 2749 km between Beagle Island and Lewis Island. The Mantel tests were conducted with samples across both regions (SA & WA) and with samples collected within South Australia. A spatial autocorrelation analysis was only carried out for South Australian colonies.
Recent Migration Rates
We estimated contemporary migration rates among sampled sea lion colonies using BayesAss 3.0 (Wilson and Rannala, 2003). This program applies a Bayesian method to multilocus genotypes and determines recent migration rates between populations over the last several generations by using Markov chain Monte Carlo (MCMC) simulations. Analyses were conducted following recommendations by Meirmans (2014). Due to small sample size for Buller Island individuals from this colony were left out from this analysis. We set delta values for allele frequencies, migration rates, and inbreeding coefficients to 0.2, 0.5, and 0.8, respectively, to ensure that acceptance rates for changes for these parameters fell between 20 and 60% (Wilson and Rannala, 2003). The MCMC was run for total of 10 × 106 iterations, discarding the first 2 × 10⁶ iterations as burn-in. Samples were collected every 1000 iterations to infer the posterior probability distribution of migration rates. Convergence and consistency across runs was confirmed by conducting 10 independent runs initialized with different random seeds. Convergence was also visualized in Tracer program v.1.5 (Rambaut and Drummond, 2012). R-script provided by Meirmans (2014) was used to calculate the Bayesian deviance for each independent run. We considered the lowest Bayesian deviance to indicate the run that provided the best fit (Spiegelhalter et al., 2002; Faubet et al., 2007).
Sex-Biased Dispersal
A range of analyses were carried out to investigate intersexual differences in dispersal and gene flow. Genetic structuring of males and females was first compared using the spatial autocorrelation analysis carried out separately for each sex. This analysis included only South Australian colonies, and those with samples from both males and females. Western Australian samples were not included as females were only sampled from a single colony. The variable distance class option was used to manually enter distance classes with 0 km representing individuals sampled at the same colony and other distance bins sequentially incorporating additional colonies. To further investigate finer scale difference in genotypic similarity in males and females we repeated these analyses but included only three South Australian colonies: Olive, Lilliput and Blefuscu Islands. Blefuscu and Lilliput Islands are separated only by few kilometers and breed synchronously, whereas Olive Island is ~40 km away and the breeding period is asynchronous with the other two colonies. Distance classes were entered manually with 0 km representing individuals sampled at the same colony, 10 km including Lilliput and Blefuscu individuals and 50 km all three colonies. Although microsatellites are bi-parentally inherited, the genotypic measure used here can rapidly accumulate differences at each generation and therefore resolve sex-based differences (Stow et al., 2006). Under the hypothesis of male-biased dispersal we predicted that within colonies, genotypic similarity will be higher among females than males and for individuals sampled at different colonies, genetic similarity of females will be lower than that estimated within colonies. A coefficient of genotypic similarity (r) was calculated for each sex and analyzed using the program GenAlEx 6.5 (Peakall and Smouse, 2012).
Several population genetic indices, including average observed heterozygosity within site (=gene diversity; HS), global FST, Fis and mean relatedness (R), were calculated separately for males and females using FSTAT version 2.9.3 (Goudet, 1995). R is defined as mean relatedness among sea lions of the same sex and estimated as R = 2FST/(1 + Fit) where Fit is the inbreeding coefficient of individuals relative to random mating (Queller and Goodnight, 1989). Statistical significance for these indices was determined by 1000 randomizations. A one-sided t-statistic was used to test for significant difference. The more dispersing sex should have a higher HS, a lower FST, a higher Fis, and a smaller R (Goudet et al., 2002; Prugnolle and de Meeus, 2002).
To further investigate sex-biased dispersal, the number of first-generation migrants was estimated for males and females separately, using program Geneclass2 version 2.0.h (Piry et al., 2004). This program conducts assignment tests which are based on genotypic arrays rather than allelic frequencies allowing us to identify individual dispersal events. First-generation migrants were defined as individuals that were born at a site other than the one in which they were sampled.
Results
Genetic Diversity
Levels of genetic diversity measured by heterozygosity, allelic richness and number of alleles are given in Table 1 (see Table S1 for detailed results for each colony and locus). None of the loci significantly deviated from HWE and there was no evidence of linkage disequilibrium between loci (at nominal level of P < 0.05 after Bonferroni correction for multiple tests). Mean allelic richness, observed heterozygosity and expected heterozygosity were highest for Olive Island (3.635, 0.658, and 0.648 respectively). Allelic richness was lowest for North Fisherman Island (2.275), whereas observed heterozygosity and expected heterozygosity were lowest for Beagle Island (0.353 and 0.363 respectively). Allelic richness was significantly lower in all Western Australian colonies when compared to each South Australian colony (p-values for each comparison varied from 0.003 to 0.0005). Two out of 16 loci were monomorphic among Western Australian colonies. When each region was analyzed separately there was no significant difference observed among South Australian colonies or among Western Australian colonies (P > 0.05 in all cases).
Genetic Differentiation and Spatial Genetic Structure
Both Jost's D and FST showed significant levels of differentiation among most colonies (Table 2). The pairwise Jost's D estimates ranged from 0.006 (Buller Is—North Fisherman Is) to 0.491 (West Waldegrave Is—Beagle Is). Values of FST tended to be slightly lower than Jost's D values ranging from 0.007 (Blefuscu Is—Lilliput Is) to 0.385 (West Waldegrave Is—Is-Beagle Is). Overall, the fixation indices showed high levels of differentiation between South Australian and Western Australian colonies (Jost's D 0.367–0.491 and FST 0.239–0.385). Within South Australia pairwise estimates ranged from 0.016 to 0.162 for Jost's D and from 0.007 to 0.102 for FST. Interestingly when these tests were conducted separately for each sex, both measures gave lower and non-significant values for male comparisons between Olive, Blefuscu, and Lilliput Islands suggesting regular gene flow between these three colonies. Male movement between Blefuscu and Lilliput Islands is further supported by the fact that two males were sampled twice, once in each of these colonies.
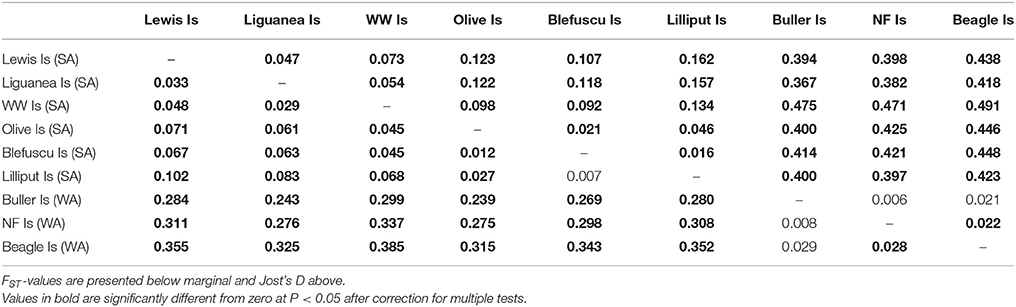
Table 2. Pairwise Jost's D and FST estimates between nine Australian sea lion colonies.
There were significant associations between genetic differences and geographic distances across nine sampling sites and also among SA colonies (Figures 2, 3A, Table 3). We found significant positive spatial autocorrelation among genotypes within distance classes 0; >0–10 and >10–50 with an intercept of 108 km. The Mantel test results support those from spatial autocorrelation analyses with isolation by distance apparent both across South Australian colonies and across regions (Table 3).
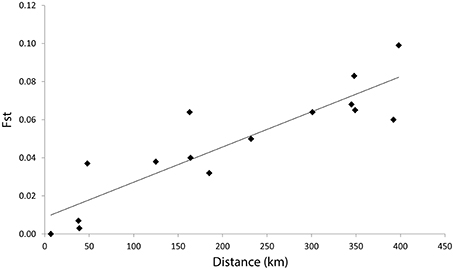
Figure 2. Plot of FST on geographical distance across SA colonies.
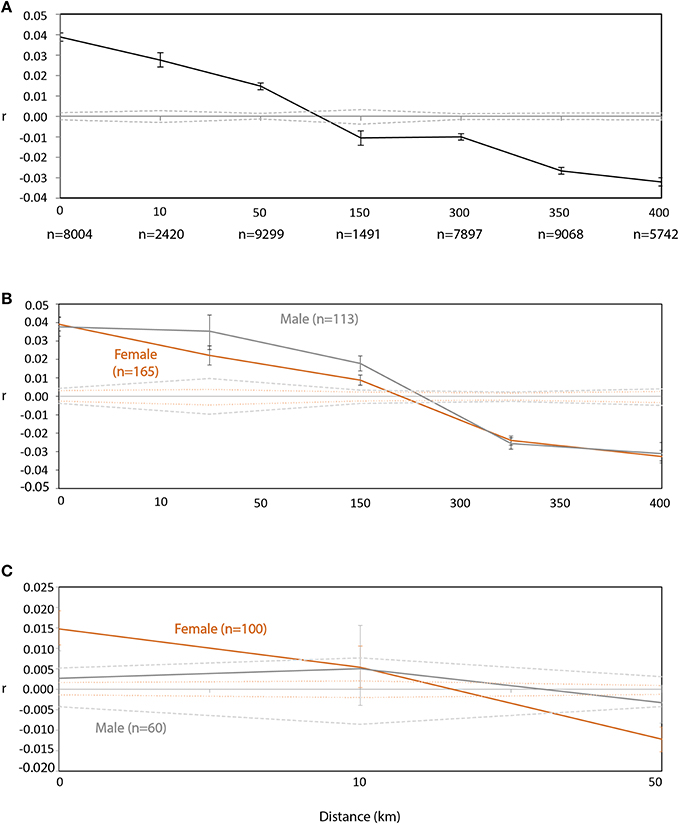
Figure 3. Spatial genetic structure using (A) combined male and female data (n = 299) across all South Australian sampling sites (number of pairwise comparisons for each size class is presented under size class) and using data from males (gray lines) and females (orange lines) separately at (B) all South Australian sampling sites and (C) across only Olive, Lilliput and Blefuscu Islands in South Australia. Sample sizes for males and females are presented in parentheses. The dashed lines represent the permuted 95% confidence limits (colored as appropriate for male and female data), while bars represent 95% error generated from bootstrap testing.
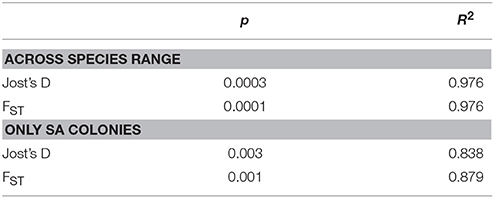
Table 3. Results for Isolation by Distance tests conducted for colonies across species range and for colonies only in South Australia (SA).
Recent Migration Rates
Migration rates were characterized by having at least 68% of individuals classified as being sampled in their natal colony, suggesting that natal philopatry is more commonplace than migration (Figure 1, Table S2). Results showed that in particular Lewis and Beagle Islands have not received significant proportions of migrants over the most recent generations. The remaining six colonies were characterized by moderate contemporary migration rates between colonies. Migration was predominantly unidirectional and occurred from Lewis Island to Liguanea and West Waldegrave Islands, from Lilliput Island to Olive and Blefuscu Islands, and from Beagle Island to North Fisherman Island.
Sex-Biased Dispersal
Spatial autocorrelation analyses carried out separately for each sex showed similar spatial patterns of genotypic similarity (Figure 3B). Significant positive spatial autocorrelation among genotypes was identified within distance classes 0; >0–10 and >10–50 km for both sexes. Within-colony genotypic similarity (distance class 0) was the same for both sexes and then appeared to drop more sharply for females compared to males for distance classes 10 and 50 km. At finer geographic scales (within only three South Australia colonies: Olive, Lilliput and Blefuscu Islands), female genotypic similarity was positive and significant among individuals located within the same colony (Figure 3C). Significant genotypic dissimilarity was apparent between female individuals sampled on either Blefuscu or Lilliput and those individuals from Olive. For males the level of genotypic similarity among individuals did not deviate from random (r = 0) irrespective of the colonies on which they were sampled (Figure 3C). At this spatial scale, genotypic structuring among females and males is significantly different, reflecting some degree of male-biased dispersal. Overall, genetic similarity within colonies showed no apparent differences between males and females. Population genetic indices, including average observed heterozygosity within site (=gene diversity; HS), global FST, FIS, and mean relatedness (R), did not differ significantly between sexes (Table 4) and assignment tests identified 6 female and 5 males as first generation migrants.
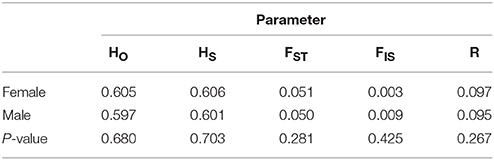
Table 4. Differences between male and female Australian sea lions in average observed heterozygosity (HO), gene diversity (HS), FST, FIS, and mean relatedness (R).
Discussion
Like most pinnipeds, Australian sea lions are capable of long-range movements and have been documented moving up to 350 km (Gales et al., 1992; Lowther et al., 2013). The aim of this study was to determine whether previously observed extreme matrilineal substructure is also evident with biparentally inherited microsatellite markers and whether typical mammalian male-biased dispersal is evident for this species. Our results show that dispersal in the true sense of the term is extremely limited in Australian sea lions. We found no strong evidence of greater female than male philopatry, but evidence that within their limited dispersal males tend to move longer distances than females. High level of genetic differentiation found in this study is above detected in many other pinnipeds. Thus, given the capacity to disperse, what are the constraints on this species that distinguish them from so many other morphologically and ecologically similar species, and what has driven these constraints?
Genetic Diversity and Differentiation
Across their range and despite their endangered status, genetic diversity was not exceptional in the Australian sea lion. Expected heterozygosity (ranging from 0.363 to 0.648) was similar or lower than reported at microsatellite loci for a number of other pinnipeds (Palo et al., 2001; Davis et al., 2002, 2008; Hoffman et al., 2006; Coltman et al., 2007; ranging from 0.550 to 0.850 e.g., Hoelzel et al., 2001). Genetic diversity measures were significantly higher in South Australian colonies than in Western Australian colonies. Long-term isolation from other colonies, genetic drift, and possibly founder effects could explain why these colonies have lower genetic diversity.
Significant genetic differentiation between colonies was observed both between and within regions. Differentiation between South Australian and Western Australian colonies is not surprising considering the distance (>2200 km) between these two regions. However in comparison to other pinniped studies conducted at similar or larger spatial scales the FST values reported here between these two regions were higher (Hoelzel et al., 2001; Palo et al., 2001; Coltman et al., 2007; Graves et al., 2009; Andersen et al., 2011; Feijoo et al., 2011). Strong genetic partitioning between South Australian and West Australian colonies is also evident with mtDNA data (significant pairwise ΦST values ranged from 0.83 to 0.94, Campbell et al., 2008).
Although, isolation by distance explains the large-scale divergence observed between South Australian and Western Australian colonies, other factors must play a role in driving differentiation at geographical scales that are within the movement capabilities of adult individuals, a conclusion supported by other similar scale studies conducted on this species (Campbell et al., 2008; Lowther et al., 2012). Distances among the six South Australian colonies included in this study varied from only a few kilometers to almost 400 km. Clear differences in the genetic composition were observed between the most eastern and western South Australian colonies, which are close to the limit of expected dispersal capabilities (Gales et al., 1992; Lowther et al., 2013). However, significant structuring was also detected between colonies separated by only 120–160 km, well within realistic swimming distances for Australian sea lions. The level of genetic differentiation at these relatively short spatial scales is above that detected in other pinnipeds (e.g., gray seal (Halichoerus grypus) Allen et al., 1995; Graves et al., 2009, Harbor seal (Phoca vitulina) Goodman, 1998, South American sea lion (Otaria flavescens) Feijoo et al., 2011, Californian sea lion (Zalophus californianus) Gonzalez-Suarez et al., 2009, Australian fur seal (Arctocephalus pusillus doriferus) Lancaster et al., 2010). This high level of genetic differentiation has implications in terms of vulnerability to any threatening processes and in particular, local fisheries interactions (Goldsworthy et al., 2009) are likely to have strong regional effects. Our study did not encompass the colonies along the southern coastline of Western Australia, thus we cannot discount that a “stepping-stone model” of gene flow may explain the broad-scale genetic partitioning we describe. As both demographic and genetic knowledge is limited for this region, characterizing connectivity requires further study.
Sex-Biased Dispersal
Previously reported mtDNA structure (Campbell et al., 2008; Lowther et al., 2012) was greater than genetic partitioning detected in this study with nuclear markers (consistently higher ΦST-values than FST and Jost's D-values reported here). While this might be indicative of male-biased dispersal, cautiousness should be applied in direct comparison of two classes of markers (Prugnolle and de Meeus, 2002). A difference in the level of genetic structure between mtDNA and microsatellite markers may be the outcome of their divergent mutation rates and/or effective population sizes (Chesser and Baker, 1996). Hence, we conducted a range of specific sex-biased dispersal analysis suitable for microsatellite markers. Our results did not provide strong support for sex-biased dispersal in this species. Genotypic similarity within colonies was not significantly different between sexes and results for population genetic indices were similar for both females and males. Assignment tests identified similar levels of first generation migrants for both males and females. Although, migrants were detected conclusions of effects of this to population structure should not be drawn as assignment tests can identify dispersal independent of gene flow. Interestingly, fine scale sex-based differences in dispersal were found between three South Australian colonies (Olive, Lilliput and Blefuscu Island). Both FST and Jost's D results were lower and non-significant when carried out with only male samples included and the results from spatial autocorrelation analysis supported regular male gene flow between Olive, Lilliput and Blefuscu Islands, whereas female dispersal between Olive Island and Lilliput and Blefuscu Islands was more restricted. Furthermore, significant matrilineal clustering was detected with mtDNA implying restricted female dispersal between Olive Island and two Nuyts colonies (Lilliput and Blefuscu Islands).
Male-biased dispersal is typical of mammals including most pinnipeds and male philopatry is rare (Lawson Handley and Perrin, 2007). The capacity for long-distance dispersal coupled with asynchrony in the timing of breeding among colonies might have been expected to offer Australian sea lion males a unique opportunity to sire pups throughout much of the year by visiting different colonies. In Western Australia males migrate up to 280 km each breeding season between male haul-out sites and breeding sites (Gales et al., 1992). Similarly, satellite-tracking data from South Australia have shown that genetic divergence lies within the geographic range of regular male foraging trips (on average 170 km per trip, range up to 368 km; Lowther et al., 2013). Hence Australian sea lion males could easily migrate among many of the breeding sites. Thus, to see restricted dispersal in males similar to that described elsewhere for adult females is intriguing. As such, our results raise the question of why males restrict dispersal to distances much shorter than their swimming ability. Furthermore, asynchrony in breeding timing between colonies offers males a unique opportunity to increase their overall reproductive success. Despite such mobility and potential for increased reproductive success, our results indicate that males do not exploit this opportunity fully.
Does Foraging Site Fidelity Constrain Dispersal? The Limits of Plasticity
Recent evidence indicates that individual male Australian sea lions repeatedly utilize the same region at sea for foraging, irrespective of oceanographic conditions or seasons (Lowther et al., 2013). This contrasts with the diverse foraging strategies of many other mammals that are more fluid and adapt to localized change (Croll et al., 1998; Viswanathan et al., 1999). Similar to conspecific females, it seems that male Australian sea lions exhibit fine-scale foraging specialization with male movement being invariant regardless of changes in oceanographic conditions and presumed food availability (Lowther et al., 2012). Thus, while adult male Australian sea lions have the capacity to adapt to large changes in their environment the implications for their restricted movement are profound, evidenced by our genetic findings. Male Australian sea lions appear to be constrained to dispersing only within range of colonies that are close enough to provide a presumably reliable food source, and enhanced opportunities to mate. Ultimately, this might limit population recovery and genetic mixing. This contrasts with some other otariids that breed on a small number of dispersed breeding colonies but exploit common, central foraging grounds, ensuring that the cost-effectiveness of foraging is similar (Arnould and Hindell, 2001; Kirkwood et al., 2006). In those species, both females and males are free to move and breed among all the colonies, with resultant high gene flow (Lancaster et al., 2010). For male Australian sea lions, only movements between colonies that are close enough to preferred foraging habitat appear feasible, as we observed for colonies within 110 km of each other. However, long-distance relocation to another breeding colony would necessitate identifying a new foraging environment and this seems beyond the behavioral plasticity of male Australian sea lions. Ironically, this may be because, in contrast to fur seals, in Australian sea lions the breeding seasons are prolonged and overlapping, and so males are unable to undertake extended fasting periods to gain access to females but must be able to find food year round.
Reproductive success may also be affected by long-term interactions with others (Wolf et al., 2005). In annually breeding colonial otariids, the lack of post breeding dispersal has been hypothesized to allow males to gain knowledge of breeding areas throughout the year and to increase male competitiveness within a colony (Page et al., 2005; Kirkwood et al., 2006). Adult Australian sea lion males might acquire similar benefits by staying in a familiar colony, whereas movement to unfamiliar colonies might increase the risk of losing mating opportunities rather than increasing the number of available mates. Familiarity and experience have been shown to confer significant mating advantages in other pinnipeds, such as Weddell seals (Harcourt et al., 2007a,b). Charrier et al. (2011) have pointed to a mechanism by which this might act in Australian sea lions. They experimentally demonstrated that males can assess each other by their vocalizations, and thus adjust their behavior in regards to the potential threat of the vocalizing male (Charrier et al., 2011).
Reproductive Asynchrony: A Dispersal Constraint
At the outset we argued that the unique asynchronous breeding system of the Australian sea lion may confer a potential advantage to male sea lions through enhanced mating opportunities. However, breeding events are prolonged lasting several months and their onset highly variable. Predicting the onset of breeding is thus difficult and therefore might be a driver limiting seasonal dispersal by males (Lowther et al., 2013). In polygynous mating systems where males fast during the breeding season, males must increase their body mass in order to compete successfully with other males (Arnould and Duck, 1997). However, the accumulation of fat is likely to have energetic costs both in terms of storage and transportation (Page et al., 2005). To limit these costs individuals must be able to predict the onset of the breeding cycle and so synchronize fat accumulation. We suggest that instead males may choose to stay in an area where they can regularly monitor the breeding state of each colony, primarily minimizing the risk of losing out on reproductive opportunities but also streamlining the energetic costs associated with fat accumulation.
Conclusions
Knowledge of dispersal patterns and spatial structure throughout a species range is critical for effective conservation. Given the unique extreme matrilineal structure, unusual life history traits and low recovery and re-colonization rates of the Australian sea lion, it is highly vulnerable to anthropogenic threats. If male dispersal were as restricted as female movement, most breeding colonies may not receive sufficient levels of new genetic variation to buffer against risks associated with inbreeding and environmental change. We found that dispersal for both sexes is remarkably limited and that observed genetic structure is notably stronger than in many other pinnipeds. The unique reproductive cycle of Australian sea lions leads to the prediction that male sea lions could exploit breeding asynchrony, with restrictions in gene flow from female philopatry offset by male behavior. It appears the inability of male Australian sea lions to exhibit plasticity in reproductive behavior further increases the vulnerability of this species to multiple anthropogenic threats.
Author Contributions
AS, RH, HA, AL, and SG contributed to designing the study. HA, AL, IC, and RH contributed to data collection. HA conducted laboratory work and molecular analyses. HA wrote the manuscript with revising and editorial input from all co-authors.
Conflict of Interest Statement
The authors declare that the research was conducted in the absence of any commercial or financial relationships that could be construed as a potential conflict of interest.
Acknowledgments
Funding for this work was provided by a Macquarie University Higher Degree Research Fund to HA, a Macquarie University Research Development Grant to RH, a grant from the Australian Marine Mammal Centre, Department of Environment, Heritage Water and the Arts through the Commonwealth Environment Research Fund to RH, a Seaworld Research and Rescue Foundation grant and by CNRS (Orsay, France). This research was approved by the Department for Environment, Water and Natural Resources, South Australia (permit Z25675) and DEH SA Wildlife Ethics Committee (44/2008). We thank the Department of Environment and Conservation, Western Australia (DEC WA License SF007255 and SF008193) for permission to enter the study sites in Western Australia and for providing significant help in situ, especially Mathew Dasey, Susie Glac, and Richard Koch. We would like to thank Anne-Sophie Lafuite for valuable laboratory assistance. We are grateful to Ben Pitcher, Andrew Dawson, Dave Slip, Francisco Viddi, Kerstin Bilgmann, Lyall Grieve, Phil Allen, Ben Arthur, Sam Blight and Clair Holland for their assistance and excellent company in the field.
Supplementary Material
The Supplementary Material for this article can be found online at: http://journal.frontiersin.org/article/10.3389/fmars.2016.00065
References
Ahonen, H., Lowther, A. D., Goldsworthy, S. D., Harcourt, R. G., and Stow, A. J. (2013). Characterization of 12 novel microsatellite loci and cross-amplification of four loci in the endangered Australian sea lion (Neophoca cinerea). Conserv. Genet. Resour. 5, 283–285. doi: 10.1007/s12686-012-9788-1
Allen, P., Amos, W., Pomeroy, P., and Twiss, S. (1995). Microsatellite variation in grey seals (Halichoerus grypus) shows evidence of genetic differentiation between two British breeding colonies. Mol. Ecol. 4, 653–662. doi: 10.1111/j.1365-294X.1995.tb00266.x
Andersen, L. W., Born, E. W., Gjertz, I., Wiig, Ø., Holm, L.-E., and Bendixen, C. (1998). Population structure and gene flow of the Atlantic walrus (Odobenus rosmarus rosmarus) in the eastern Atlantic Arctic based on mitochondrial DNA and microsatellite variation. Mol. Ecol. 7, 1323–1336. doi: 10.1046/j.1365-294x.1998.00455.x
Andersen, L. W., Lydersen, C., Frie, A. K., Rosing-Asvid, A., Hauksson, E., and Kovacs, K. M. (2011). A population on the edge: genetic diversity and population structure of the world's northernmost harbour seals (Phoca vitulina). Biol. J. Linn. Soc. 102, 420–439. doi: 10.1111/j.1095-8312.2010.01577.x
Arnould, J. P. Y., and Duck, C. D. (1997). The cost and benefits of territorial tenure, and factors affecting mating success in male Antarctic fur seals. J. Zool. 241, 649–664. doi: 10.1111/j.1469-7998.1997.tb05739.x
Arnould, J. P. Y., and Hindell, M. A. (2001). Dive behaviour, foraging locations, and maternal-attendance patterns of Australian fur seals (Arctocephalus pusillus doriferus). Can. J. Zool. 79, 35–48. doi: 10.1139/cjz-79-1-35
Baker, A. R., Loughlin, T. R., Burkanov, V., Matson, C. W., Trujillo, R. G., Calkins, D. G., et al. (2005). Variation of mitochondrial control region sequences of Steller sea lions: the three-stock hypothesis. J. Mammal. 86, 1075–1084. doi: 10.1644/04-MAMM-A-113R1.1
Bowler, D. E., and Benton, T. G. (2005). Causes and consequences of animal dispersal strategies: relating individual behaviour to spatial dynamics. Biol. Rev. 80, 205–225. doi: 10.1017/S1464793104006645
Burg, T. M., Trites, A. W., and Smith, M. J. (1999). Mitochondrial and microsatellite DNA analyses of harbour seal population structure in the northeast Pacific Ocean. Can. J. Zool. Rev. Can. Zool. 77, 930–943. doi: 10.1139/z99-057
Campbell, R. A. (2003). Demography and Genetic Population Structure of the Australian Sea Lion (Neophoca cinerea). Unpublished Ph. D. Perth, WA: University of Western Australia.
Campbell, R. A., Gales, N. J., Lento, G. M., and Baker, C. S. (2008). Islands in the sea: extreme female natal site fidelity in the Australian sea lion, Neophoca cinerea. Biol. Lett. 4, 139–142. doi: 10.1098/rsbl.2007.0487
Charrier, I., Ahonen, H., and Harcourt, R. G. (2011). What makes an Australian sea lion (Neophoca cinerea) male's bark threatening? J. Comp. Psychol. 125, 385–392. doi: 10.1037/a0024513
Chesser, R. K., and Baker, R. J. (1996). Effective sizes and dynamics of uniparentally and diparentally inherited genes. Genetics 144, 1225–1235.
Clarke, A. L., Sæther, B. E., and Røskaft, E. (1997). Sex biases in avian dispersal: a reappraisal. Oikos 79, 429–438. doi: 10.2307/3546885
Clutton-Brock, T. H. (1989). Review lecture: mammalian mating systems. Proc. R. Soc. Lond. B. 236, 339–372.
Coltman, D. W., Stenson, G., Hammill, M. O., Haug, T., Davis, C. S., and Fulton, F. T. (2007). Panmictic population structure in the hooded seal (Cystophora cristata). Mol. Ecol. 16, 1639–1648. doi: 10.1111/j.1365-294X.2007.03229.x
Croll, D. A., Tershy, B. R., Hewitt, R. P., Demer, D. A., Fiedler, P. C., Smith, S. E., et al. (1998). An integrated approch to the foraging ecology of marine birds and mammals. Deep Sea Res. II Top. Stud. Oceanogr. 45, 1353–1371. doi: 10.1016/S0967-0645(98)00031-9
Davis, C. S., Gelatt, T. S., Siniff, D., and Strobeck, C. (2002). Dinucleotide microsatellite markers from the Antarctic seals and their use in other pinnipeds. Mol. Ecol. Notes 2, 203–208. doi: 10.1046/j.1471-8286.2002.00187.x-i2
Davis, C. S., Stirling, I., Strobeck, C., and Coltman, D. W. (2008). Population structure of ice-breeding seals. Mol. Ecol. 17, 3078–3094. doi: 10.1111/j.1365-294X.2008.03819.x
Dobson, F. S. (1982). Competition for mates and predominant juvenile male dispersal in mammals. Anim. Behav. 30, 1183–1192. doi: 10.1016/S0003-3472(82)80209-1
Dobson, F. S. (2013). The enduring question of sex-biased dispersal: Paul J. Greenwood's (1980) seminal contribution. Anim. Behav. 85, 299–304. doi: 10.1016/j.anbehav.2012.11.014
Faubet, P., Waples, R. S., and Gaggiotti, O. E. (2007). Evaluating the performance of a multilocus Bayesian method for the estimation of migration rates. Mol. Ecol. 16, 1149–1166. doi: 10.1111/j.1365-294X.2007.03218.x
Feijoo, M., Lessa, E. P., de Castro, R. L., and Crespo, E. A. (2011). Mitochondrial and microsatellite assessment of population structure of South American sea lion (Otaria flavescens) in the Southwestern Atlantic Ocean. Mar. Biol. 158, 1857–1867. doi: 10.1007/s00227-011-1697-4
Gales, N. J., Cheal, A. J., Pobar, G. J., and Williamson, P. (1992). Breeding biology and movements of Australian sea-lions, Neophoca cinerea, off the west coast of Western Australia. Wildl. Res. 19, 405–416. doi: 10.1071/WR9920405
Gales, N. J., Shaughnessy, P. D., and Dennis, T. E. (1994). Distribution, abundance and breeding cycle of the Australian Sea Lion Neophoca-Cinerea (Mammalia, Pinnipedia). J. Zool. 234, 353–370.
Garant, D., Forde, S. E., and Hendry, A. P. (2007). The multifarious effects of dispersal and gene flow on contemporary adaptation. Funct. Ecol. 21, 434–443. doi: 10.1111/j.1365-2435.2006.01228.x
Gerlach, G., Jueterbock, A., Kraemer, P., Deppermann, J., and Harmand, P. (2010). Calculations of population differentiation based on GST and D: forget GST but not all of statistics! Mol. Ecol. 19, 3845–3852. doi: 10.1111/j.1365-294x.2010.04784.x
Goldsworthy, S. D., McKenzie, J., Shaughnessy, P. D., McIntosh, R. R., Page, B., and Campbell, R. A. (2009). An Update of the Report: Understanding the Impediments to the Growth of Australian Sea Lion Populations. SARDI Research Report Series No. 356., Adelaide, SA: Department of the Environment Water Heritage and The Arts.
Goldsworthy, S. D., and Page, B. (2007). A risk-assessment approach to evaluating the significance of seal bycatch in two Australian fisheries. Biol. Conserv. 139, 269–285. doi: 10.1016/j.biocon.2007.07.010
Goldsworthy, S. D., and Shaughnessy, P. D. (2013). Abundance of New Zealand fur Seal Pups in the Cape Gantheaume Wilderness Protection Area, Kangaroo Island: 2011-12 Breeding Season. Final Report to Nature Foundation, S. A. SARDI Research Report Series No. 735. Adelaide, SA: South Australian Research and Development Institute (Aquatic Sciences).
González-Suárez, M., Flatz, R., Aurioles-Gamboa, D., Hedrick, P., and Gerber, L. (2009). Isolation by distance among California sea lion populations in Mexico: redefining management stocks. Mol. Ecol. 18, 1088–1099. doi: 10.1111/j.1365-294X.2009.04093.x
Goodman, S. J. (1998). Patterns of extensive genetic differentiation and variation among European harbor seals (Phoca vitulina vitulina) revealed using microsatellite DNA polymorphisms. Mol. Biol. Evol. 15, 104–118. doi: 10.1093/oxfordjournals.molbev.a025907
Goudet, J. (1995). FSTAT (version 1.2): a computer program to calculate F-statistics. J. Hered. 86, 485–486.
Goudet, J., Perrin, N., and Waser, P. (2002). Tests for sex-biased dispersal using bi-parentally inherited genetic markers. Mol. Ecol. 11, 1103–1114. doi: 10.1046/j.1365-294X.2002.01496.x
Graves, J. A., Helyar, A., Biuw, M., Jüssi, M., Jüssi, I., and Karlsson, O. (2009). Microsatellite and mtDNA analysis of the population structure of grey seals (Halichoerus grypus) from three breeding areas in the Baltic Sea. Conserv. Genet. 10, 59–68. doi: 10.1007/s10592-008-9517-1
Greenwood, P. J. (1980). Mating systems, philopatry and dispersal in birds and mammals. Anim. Behav. 28, 1140–1162. doi: 10.1016/S0003-3472(80)80103-5
Hamer, D. J., Goldsworthy, S. D., Costa, D. P., Fowler, S. L., Page, B., and Sumner, M. D. (2013). The endangered Australian sea lion extensively overlaps with and regularly becomes by-catch in demersal shark gill-nets in South Australian shelf waters. Biol. Conserv. 157, 386–400. doi: 10.1016/j.biocon.2012.07.010
Harcourt, R. G., Kingston, J. J., Cameron, M. F., Waas, J. R., and Hindell, M. A. (2007a). Paternity analysis shows experience, not age, enhances mating success in an aquatically mating pinniped, the Weddell seal (Leptonychotes weddellii). Behav. Ecol. Sociobiol. 61, 643–652. doi: 10.1007/s00265-006-0294-x
Harcourt, R. G., Kingston, J. J., Waas, J. R., and Hindell, M. A. (2007b). Foraging while breeding: alternative mating strategies by male Weddell seals? Aquat. Conserv. Marine Freshw. Ecosys. 17, S68–S78. doi: 10.1002/aqc.915
Higgins, L. V. (1993). The nonannual, non seasonal breeding cycle of the Australian sea lion Neophoca cinerea. J. Mammal. 74, 270–274.
Hoelzel, A. R., Campagna, C., and Arnbom, T. (2001). Genetic and morphometric differentiation between island and mainland southern elephant seal populations. Proc. R. Soc. Lond. B. 268, 325–332. doi: 10.1098/rspb.2000.1375
Hoffman, J., Matson, C., Amos, W., Loughlin, T., and Bickham, J. (2006). Deep genetic subdivision within a continuously distributed and highly vagile marine mammal, the Steller's sea lion (Eumetopias jubatus). Mol. Ecol. 15, 2821–2832. doi: 10.1111/j.1365-294X.2006.02991.x
Hoffman, J., Steinfartz, S., and Wolf, J. B. (2007). Ten novel dinucleotide microsatellite loci cloned from the Galápagos sea lion (Zalophus californianus wollebaeki) are polymorphic in other pinniped species. Mol. Ecol. Notes 7, 103–105. doi: 10.1111/j.1471-8286.2006.01544.x
Kirkwood, R., Lynch, M., Gales, N. J., Dann, P., and Sumner, M. D. (2006). At-sea movements and habitat use of adult male Australian fur seals (Arctocephalus pusillus doriferus). Can. J. Zool. 84, 1781–1788. doi: 10.1139/z06-164
Lancaster, M. L., Arnould, J., and Kirkwood, R. (2010). Genetic status of an endemic marine mammal, the Australian fur seal, following historical harvesting. Anim. Conserv. 13, 247–255. doi: 10.1111/j.1469-1795.2009.00325.x
Lawson Handley, L., and Perrin, N. (2007). Advances in our understanding of mammalian sex-biased dispersal. Mol. Ecol. 16, 1559–1578. doi: 10.1111/j.1365-294X.2006.03152.x
Le Galliard, J. F., Gundersen, G., Andreassen, H., and Stenseth, N. (2006). Natal dispersal, interactions among siblings and intrasexual competition. Behav. Ecol. 17, 733–740. doi: 10.1093/beheco/arl002
Lidicker, W. Z. (1975). “The role of dispersal in the demography of small mammals,” in Small Mammals: Their Productivity and Population Dynamics, eds F. B. Golley, K. Petrusewicz, and L. Ryszkowski (Cambridge: Cambridge University Press), 103–134.
Ling, J. K. (1999). Exploitation of fur seals and sea lions from Australian, New Zealand and adjacent subantarctic islands during the eighteenth, nineteenth and twentieth centuries. Aust. Zool. 31, 323–350. doi: 10.7882/AZ.1999.036
Lowther, A. D., Harcourt, R. G., Goldsworthy, S. D., and Stow, A. J. (2012). Population structure of adult female Australian sea lions is driven by fine-scale foraging site fidelity. Anim. Behav. 83, 691–701. doi: 10.1016/j.anbehav.2011.12.015
Lowther, A. D., Harcourt, R. G., Page, B., and Goldsworthy, S. D. (2013). Steady as he goes: at-sea movement of adult male Australian Sea Lions in a dynamic marine environment. PLoS ONE 8:e74348. doi: 10.1371/journal.pone.0074348
Meirmans, P. G. (2014). Nonconvergence in Bayesian estimation of migration rates. Mol. Ecol. Res. 14, 726–733. doi: 10.1111/1755-0998.12216
Oksanen, J., Blanchet, F. G., Kindt, R., Legendre, P., Minchin, P. R., O'Hara, R. B., et al. (2015). Vegan: Community Ecology Package. R package Version 2.3-0. Available online at: http://CRAN.R-project.org/package=vegan
Page, B., McKenzie, J., and Goldsworthy, S. D. (2005). Dietary resource partitioning among sympatric New Zealand and Australian fur seals. Mar. Ecol. Prog. Ser. 293, 283–302. doi: 10.3354/meps293283
Palo, J., Mäkinen, H., Helle, E., Stenman, O., and Väinöl,ä, R. (2001). Microsatellite variation in ringed seals (Phoca hispida): genetic structure and history of the Baltic Sea population. Heredity 86, 609–617. doi: 10.1046/j.1365-2540.2001.00859.x
Peakall, R., and Smouse, P. E. (2012). GenAlEx 6.5: genetic analysis in Excel. Population genetic software for teaching and research—an update. Bioinformatics 28, 2537–2539. doi: 10.1093/bioinformatics/bts460
Perrin, N., and Goudet, J. (2001). “Inbreeding, kinship, and the evolution of natal dispersal,” in Dispersal, eds J. Clobert, E. Danchin, A. A. Dhondt, and J. D. Nichols (Oxford: Oxford University Press), 123–142.
Perrin, N., and Lehmann, L. (2001). Is sociality driven by the costs of dispersal or the benefits of philopatry? a role for kin-discrimination mechanisms. Am. Nat. 158, 471–483. doi: 10.1086/323114
Perrin, N., and Mazalov, V. (1999). Dispersal and inbreeding avoidance. Am. Nat. 154, 282–292. doi: 10.1086/303236
Perrin, N., and Mazalov, V. (2000). Local competition, inbreeding, and the evolution of sex-biased dispersal. Am. Nat. 155, 116–127. doi: 10.1086/303296
Piry, S., Alapetite, A., Cornuet, J. M., Paetkau, D., Baudouin, L., and Estoup, A. (2004). GENECLASS2: a software for genetic assignment and first-generation migrant detection. J. Hered. 95, 536–539. doi: 10.1093/jhered/esh074
Prugnolle, F., and de Meeus, T. (2002). Inferring sex-biased dispersal from population genetic tools: a review. Heredity 88, 161–165. doi: 10.1038/sj.hdy.6800060
Pusey, A. E. (1987). Sex-biased dispersal and inbreeding avoidance in birds and mammals. Trends Ecol. Evol. 2, 295–299. doi: 10.1016/0169-5347(87)90081-4
Queller, D. C., and Goodnight, K. F. (1989). Estimating relatedness using genetic markers. Evolution 43, 258–275 doi: 10.2307/2409206
Rambaut, A., and Drummond, A. (2012). Tracer v1. 5. (2009). Available online at: http://tree.bio.ed.ac.uk/software/tracer/
Raymond, M., and Rousset, F. (1995). GENEPOP (version 1.2): population genetics software for exact test and ecumenism. J. Hered. 86, 248–249.
Robinson, A. C., Armstrong, D. M., and Canty, P. D. (2008). Investigator Group Expedition 2006: Vertebrate Fauna. Trans. R. Soc. South Aust. 132, 221–242. doi: 10.1080/03721426.2008.10887103
Schumann, N., Gales, N. J., Harcourt, R. G., and Arnould, J. P. Y. (2013). Impacts of climate change on Australian marine mammals. Aust. J. Zool. 61, 146–159. doi: 10.1071/ZO12131
Shaughnessy, P. D., Dennis, T. E., and Seager, P. G. (2005). Status of Australian sea lions, Neophocus cinerea, and New Zealand fur seals, Arctocephalus forsteri, on Eyre Peninsula and the far west coast of South Australia. Wildl. Res. 32, 85–101. doi: 10.1071/WR03068
Shaughnessy, P. D., Goldsworthy, S. D., Hamer, D. J., Page, B., and McIntosh, R. R. (2011). Australian sea lions Neophoca cinerea at colonies in South Australia: distribution and abundance, 2004 to 2008. Endanger. Species Res. 13, 87–98. doi: 10.3354/esr00317
Spiegelhalter, D. J., Best, N. G., Carlin, B. P., and Van Der Linde, A. (2002). Bayesian measures of model complexity and fit. J. R. Statist. Soc. B Statist. Methodol. 64, 583–639. doi: 10.1111/1467-9868.00353
Stow, A. J., Minarovic, N., Webley, L. S., Eymann, J., and Cooper, D. W. (2006). Genetic structure infers generally high philopatry and male-biased dispersal of brushtail possums (Trichosurus vulpecula) in urban Australia. Wildl. Res. 33, 409–415. doi: 10.1071/WR06019
Stow, A. J., Sunnucks, P., Briscoe, D. A., and Gardner, M. G. (2001). The impact of habitat fragmentation on dispersal of Cunningham's skink Egernia cunninghami: evidence from allelic and genotypic analyses of microsatellites. Mol. Ecol. 10, 867–878. doi: 10.1046/j.1365-294X.2001.01253.x
Sunnucks, P., and Hales, D. F. (1996). Numerous transposed sequences of mitochondrial cytochrome oxidase I-II in aphids of the genus Sitobion (Hemiptera: aphididae). Mol. Biol. Evol. 13, 510–524. doi: 10.1093/oxfordjournals.molbev.a025612
Taylor, L., and Taylor, R. (1977). Aggregation, migration and population mechanics. Nature 265, 415–421. doi: 10.1038/265415a0
van Oosterhout, C., Hutchinson, W. F., Wills, D. P. M., and Shipley, P. (2004). MICRO-CHECKER: software for identifying and correcting genotyping errors in microsatellite data. Mol. Ecol. Notes 4, 535–538. doi: 10.1111/j.1471-8286.2004.00684.x
Viswanathan, G. M., Buldyrev, S. V., Havlin, S., da Luz, M. G. E., Raposo, E. P., and Eugene Stanley, H. (1999). Optimizing the success of random searches. Nature 401, 911–914. doi: 10.1038/44831
Wilson, G. A., and Rannala, B. (2003). Bayesian inference of recent migration rates using multilocus genotypes. Genetics 163, 1177–1191.
Wolf, J. B. W., Kauermann, G., and Trillmich, F. (2005). Males in the shade: habitat use and sexual segregation in the Galapagos sea lion (Zalophus californianus wollebaeki). Behav. Ecol. Sociobiol. 59, 293–302. doi: 10.1007/s00265-005-0042-7
Wolf, J. B. W., Tautz, D., Caccone, A., and Steinfartz, S. (2006). Development of new microsatellite loci and evaluation of loci from other pinniped species for the Galápagos sea lion (Zalophus californianus wollebaeki). Conserv. Genet. 7, 461–465. doi: 10.1007/s10592-005-9045-1
Keywords: otariid, pinniped, genetic differentiation, male-mediated gene flow, fine-scale foraging specialization, conservation, Neophoca cinerea
Citation: Ahonen H, Lowther AD, Harcourt RG, Goldsworthy SD, Charrier I and Stow AJ (2016) The Limits of Dispersal: Fine Scale Spatial Genetic Structure in Australian Sea Lions. Front. Mar. Sci. 3:65. doi: 10.3389/fmars.2016.00065
Received: 01 December 2015; Accepted: 18 April 2016;
Published: 03 May 2016.
Edited by:
Randall Davis, Texas A&M University, USAReviewed by:
Gail Schofield, Deakin University, AustraliaLucy Alice Hawkes, University of Exeter, UK
Carolina Aimore Bonin, University of St. Thomas, USA
Copyright © 2016 Ahonen, Lowther, Harcourt, Goldsworthy, Charrier and Stow. This is an open-access article distributed under the terms of the Creative Commons Attribution License (CC BY). The use, distribution or reproduction in other forums is permitted, provided the original author(s) or licensor are credited and that the original publication in this journal is cited, in accordance with accepted academic practice. No use, distribution or reproduction is permitted which does not comply with these terms.
*Correspondence: Heidi Ahonen, aGVpZGkuYWhvbmVuQG5wb2xhci5ubw==; aGFob25lbjFAZ21haWwuY29t