 Chia-Jung Lu
 Ronald Benner
 Cédric G. Fichot
 Hideki Fukuda
 Youhei Yamashita
 Hiroshi Ogawa1
- 1Atmosphere and Ocean Research Institute, The University of Tokyo, Kashiwa, Japan
- 2Marine Science Program, University of South Carolina, Columbia, SC, USA
- 3Department of Biological Sciences, University of South Carolina, Columbia, SC, USA
- 4Faculty of Environmental and Earth Science, Hokkaido University, Sapporo, Japan
Dissolved lignin phenols and optical properties of dissolved organic matter (DOM) were measured to investigate the sources and transformations of terrigenous DOM (tDOM) in Otsuchi Bay, Japan. Three rivers discharge into the bay, and relatively high values of syringyl:vanillyl phenols (0.73 ± 0.07) and cinnamyl:vanillyl phenols (0.33 ± 0.10) indicated large contributions of non-woody angiosperm tissues to lignin and tDOM. The physical mixing of river and seawater played an important role in controlling the concentrations and distributions of lignin phenols and chromophoric DOM (CDOM) optical properties in the bay. Lignin phenol concentrations and the CDOM absorption coefficient at 350 nm, a(350), were strongly correlated in river and bay waters. Measurements of lignin phenols and CDOM in bay waters indicated a variety of photochemical and biological transformations of tDOM, including oxidation reactions, photobleaching and a decrease in molecular weight. Photodegradation and biodegradation of lignin and CDOM were investigated in decomposition experiments with river water and native microbial assemblages exposed to natural sunlight or kept in the dark. There was a rapid and substantial removal of lignin phenols and CDOM during the first few days in the light treatment, indicating transformations of tDOM and CDOM can occur soon after discharge of buoyant river water into the bay. The removal of lignin phenols was slightly greater in the dark (34%) than in the light (30%) during the remaining 59 days of the incubation. Comparison of the light and dark treatments indicated biodegradation was responsible for 67% of total lignin phenols removal during the 62-day incubation exposed to natural sunlight, indicating biodegradation is a dominant removal process in Otsuchi Bay.
Introduction
The global riverine flux of particulate and dissolved organic carbon to the ocean is ~0.4 PgC y−1 (Schlesinger and Melack, 1981). Dissolved organic carbon (DOC) comprises more than half of this flux and is an important component of the global carbon cycle (Hedges et al., 1997). Lignin is a phenolic polymer common to all vascular plants (Hedges and Mann, 1979) and a useful biomarker of terrigenous dissolved organic matter (tDOM) in the ocean (Meyers-Schulte and Hedges, 1986; Opsahl and Benner, 1997). Low concentrations of lignin phenols in the Atlantic and Pacific oceans reflect average oceanic residence times of tDOM ranging from decades to a century, suggesting ocean margins could be important hot spots for tDOM transformations (Hedges et al., 1997; Opsahl and Benner, 1997). Biodegradation and photodegradation of tDOM are major processes in the remineralization of tDOM in ocean margins (Miller and Zepp, 1995; Benner and Opsahl, 2001; Fichot and Benner, 2014). Photochemical processes play an important role in the degradation of lignin phenols in seawater (Hernes and Benner, 2003; Fichot and Benner, 2012), and recent studies have demonstrated biodegradation is the main removal process in rivers and river-influenced ocean margins (Ward et al., 2013; Fichot and Benner, 2014). Photochemical processes have been shown to enhance the microbial degradation of tDOM, thereby contributing to its remineralization (Miller and Moran, 1997; Moran et al., 2000; Mopper and Kieber, 2002; Obernosterer and Benner, 2004; Fichot and Benner, 2014).
Chromophoric dissolved organic matter (CDOM) is ubiquitous in marine waters and plays a significant role in marine biogeochemical cycles (Nelson et al., 2010; Yamashita et al., 2013). CDOM absorption coefficients and spectral slopes (S) are useful indicators for estimating DOC concentrations and sources, tDOM molecular weight and the extent of photochemical alteration (Del Vecchio and Blough, 2002; Helms et al., 2008; Fichot and Benner, 2011, 2012; Spencer et al., 2012; Yamashita et al., 2013). Lignin is an important chromophore in tDOM, and S275–295 is a useful indicator of tDOM transformations and degradation (Helms et al., 2008; Fichot and Benner, 2012). The applicability of this optical tracer of tDOM relies on a strong nonlinear relationship between S275–295 and the DOC-normalized lignin yield in rivers and along the freshwater-marine continuum in river-influenced ocean margins (Fichot and Benner, 2012; Fichot et al., 2013). The ratio of absorption at 250 nm and 365 nm (E2/E3) is another optical property that strongly correlates with aromatic content, molecular weight and degradation of DOM (de Haan, 1972; Lou and Xie, 2006; Helms et al., 2008; Spencer et al., 2012; Bouillon et al., 2014; Santos et al., 2014).
The present study investigated the riverine sources and transformations of lignin and CDOM in Otsuchi Bay on the Pacific Ocean coast of Japan. Measurements of lignin phenols and CDOM were used to trace tDOM in the river and bay waters, and a lignin decomposition experiment was used to determine the susceptibility of riverine DOM to photochemical and biological degradation. These experiments demonstrate relationships between lignin phenols and CDOM optical properties and provide a framework for interpreting field data and the transformations of tDOM in bay waters.
Materials and Methods
Study Area and Sampling Overview
Otsuchi Bay is a semi-closed coastal area along the Sanriku ria coast in northern Japan, and is one of the areas struck by a massive tsunami associated with the 2011 Tohoku earthquake. The tsunami caused considerable damage along the Pacific side of the Tohoku Region and the northern part of the Kanto Region (Kazama and Noda, 2012). The Otsuchi River, Kozuchi River and Unosumai River flow into Otsuchi bay. The catchments of these 3 rivers are 116, 66, and 150 km2, respectively (Coastal Oceanography of Japanese Island, 1985). The total freshwater discharge into the bay ranges from 3 to 35 m3 s−1. Approximately 55% of the freshwater entering the bay comes from the Unosumai River, with 30 and 15% freshwater coming from the Otsuchi and Kozuchi Rivers, respectively (Anbo et al., 2005). Water exchange between the bay and coastal ocean is rapid, with water residence time within the bay estimated to be on the order of a week to a month based on the residual current (3–5 cm s−1; Otobe et al., 2009) and the physical dimensions of the bay (length 7 km; wide 2–4 km; Fukuda et al., 2015). Water circulation changes on a seasonal basis in Otsuchi Bay. The density current is affected by river discharge, tide-induced residual current and seasonal changes in wind (Otobe et al., 2009). Fukuda et al. (2015) recently investigated nutrient dynamics in the water column following the 2011 Tohoku earthquake and noticed 3 distinct periods: (1) a stratified period (stratification between Tsugaru current with high salinity and river water: May-September), (2) a mixing period (October-January), and (3) an Oyashio current intrusion period (low salinity and low temperature: February-April). Other studies also indicated that river inflow is the key factor controlling water exchange and nutrient concentrations in this bay (Furuya et al., 1993; Kawamiya et al., 1996; Anbo et al., 2005; Fukuda et al., 2007), thereby suggesting river inflow has a major influence on DOM dynamics. Hence, although water is frequently flushed out of the bay to the coastal zone, terrigenous DOM is likely an important driver of the biogeochemical cycles in the bay.
Samples were collected from the 3 rivers and along a transect in Otsuchi Bay during 2012–2013 (Figure 1A). Water samples from the rivers were collected using a bucket, and water samples from the bay were collected at the surface (1 m) and near the bottom using a Niskin bottle (maximum depth of 78 m at station L0). In order to assess the vertical distribution of tDOM in the middle of the bay, seawater samples were collected at different depths at station L3 in November 2013. The depths of each station were: 78 m at L0, 44 m at L1, 41 m at L2, 35 m at L3, 26 m at L4, 18 m at L5, 7 m at L6, and 17 m at L8, respectively. The average salinity values (mean ± 1-standard division, 1-SD) were 32.39 ± 0.26 (n = 6) and 33.60 ± 0.08 (n = 4) in September and November 2012; 33.57 ± 0.08 (n = 12), 33.25 ± 0.64 (n = 18), 32.62 ± 1.63 (n = 22), and 33.34 ± 0.35 (n = 5) in March, May, July and November 2013, respectively. These data demonstrate that the freshwater volume represented a small fraction of the total water volume of the bay during all seasons.
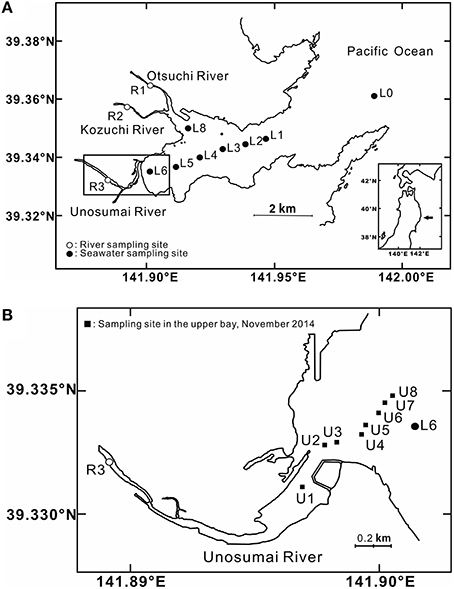
Figure 1. (A) Sampling sites in the three rivers in the catchment basin and in Otsuchi Bay (B) mid-salinity stations in the upper bay near the mouth of the Unosumai River.
In Otsuchi Bay, the water exchange rate can be very rapid with dramatic salinity increases over a short distance from river mouths to the bay. This often makes it difficult to interpret an accurate mixing model. In order to overcome this issue, additional samples were collected in the limited area of mid-salinity range around the Unosumai River mouth at station U1-U8 (Figure 1B) in November 2014 for optical analyses, and the average salinity was 29.77 ± 5.17 (1-SD, n = 14).
Lignin Extraction and Analysis
Seawater and river samples were filtered through Whatman® polycarbonate filter (1-μm pore size) and then acidified to ca. pH 2.5 using sulfuric acid. Most of the in-situ lignin samples were acidified immediately after filtration, but a few samples were stored at low temperature in the dark until acidification ~48 h after collection. Dissolved lignin was then extracted from either 10 L (seawater) or 5 L (river water) by solid phase extraction (SPE) on a C18 cartridge (Varian MegaBond Elut) at a flow rate of ~50 mL min−1 using a peristaltic pump (Masterflex L/S tubing pump, Cole-Parmer; Louchouarn et al., 2000; Hernes and Benner, 2002). Before extraction, 50 mL of methanol was passed through the cartridges followed by 1 L of acidified Milli-Q water (pH = 2.5). After extraction, the cartridges were stored at 4°C until elution with 30 mL methanol. The eluate was then stored at −20°C. Eleven lignin phenols were produced by the CuO oxidation method, and were identified and quantified using an Agilent 7890 gas chromatograph equipped with a Varian DB5-MS capillary column and an Agilent 5975 mass selective detector (Kaiser and Benner, 2012).
Total dissolved lignin concentrations were calculated as the sum of 11 lignin phenols (TDLP11; nmol L−1) from four phenol families: p-hydroxy phenols [p-hydrobenzaldehyde (PAL), p-hydroxybenzoic acid (PAD), p-hydroxyacetophenone (PON)], vanillyl phenols [vanillin (VAL), vanillic acid (VAD), acetovanillone (VON)], syringyl phenols [syringaldehyde (SAL), syringic acid (SAD), acetosyringone (SON)] and cinnamyl phenols [p-coumaric acid (CAD) and ferulic acid (FAD)]. The sum of nine phenols (TDLP9), including PAL, PAD, PON, VAL, VAD, VON, SAL, SAD, and SON, was also presented in this study. Finally, the ratios of p-hydroxy to vanillyl phenols (P/V), syringyl to vanillyl phenols (S/V), cinnamyl to vanillyl phenols (C/V), acid/aldehyde ratios of p-hydroxy [(Ad/Al)P], acid/aldehyde ratios of vanillyl [(Ad/Al)V], and acid/aldehyde ratios of syringyl phenols [(Ad/Al)S] were also calculated.
Chl. a and CDOM Analysis
Samples were gravity-filtered directly from the Niskin bottle and through pre-combusted Whatman® GF/F filters (0.7-μm pore size). The GF/F filters were immediately stored at –20°C in the dark for chlorophyll a (Chl. a) measurements (Suzuki and Ishimaru, 1990). The filtrate was collected in pre-combusted glass vials (teflon-lined cap), and stored frozen in the dark for CDOM analysis. CDOM absorbance was measured from 200 to 800 nm using a dual-beam spectrophotometer (UV-1800, Shimadzu) and with Milli-Q used as the blank. A 5-cm quartz cell was used for most samples, and a 3-cm quartz cell was used for a few samples. The method of Yamashita and Tanoue (2009) was used to convert absorbance to Napierian absorption coefficient.
Absorption coefficients of CDOM decreased with increasing wavelength and were fit to the following exponential equation (1):
where a(λ) and a(λi) are the absorption coefficients at wavelength λ and reference wavelength λi (m−1), respectively, and S is the spectral slope coefficients (nm−1) over the corresponding spectral range (λ − λi). The CDOM absorption coefficients at 250 nm [a(250)] and 350 nm [a(350)], and the spectral slope coefficients between 275 and 295 nm (S275–295) and between 350 and 400 nm (S350–400), and the slope ratio (SR) of S275–295 to S350–400 were reported in this study. The ratio of absorption coefficient at 250 nm to that at 365 nm (E2/E3) was also calculated.
tDOM Decomposition Incubation Experiment
A large sample was collected from the Unosumai River in July 2013 in order to investigate the photochemical and microbial degradation of tDOM. River water was filtered through a Whatman® polycarbonate membrane (1-μm pore size), collected in an acid-washed Nalgene carboy. Four polycarbonate containers (30 L) were filled with the filtrate and incubated in a water bath (24 ± 5°C during incubation) for 62 days on the roof of a building at the University of Tokyo. Two containers were covered with quartz plate and exposed to natural sunlight. The other two containers were wrapped with aluminum foil and used as a dark treatment. Killed controls were not used, so we assume lignin removal in the dark was due to microbial degradation. A photo-radiometer (Delta OHM, spectral range: 315~400 nm) was equipped to monitor UVA irradiance. Subsamples were collected after 3, 10, 20, 41, and 62 days of incubation, and subsamples were filtered through 1-μm filter before the extraction of lignin and CDOM measurements. Simple exponential decay constants (k) (d−1) were calculated to examine the susceptibility of lignin phenols to photochemical and microbial degradation. Equation (2) was used to fit to derive k,
where Ct is the lignin phenol concentrations (TDLP9) at time t, and C0 is the initial lignin phenol concentrations (TDLP9).
Results
Dissolved Lignin Phenols and CDOM in the Otsuchi, Kozuchi and Unosumai Rivers
Lignin phenol concentrations varied from 2 to 5-fold among rivers and on a seasonal basis. Overall, TDLP9 ranged from 5.97 to 80.7 nmol L−1 (Table 1), and TDLP11 ranged from 7.09 to 87.0 nmol L−1 (Table S1). The Otsuchi River consistently exhibited the lowest concentrations, whereas the Unosumai River consistently exhibited the highest concentrations. Lignin concentrations for all three rivers were several-fold higher in July 2013, following a period of heavy rainfall (Table 1). In contrast, lignin phenol compositions exhibited little seasonal variability. Lignin phenol ratios [P/V, S/V, C/V, (Ad/Al)p, (Ad/Al)v, (Ad/Al)s] were slightly higher in the Otsuchi River and lower in the Unosumai River. The P/V ranged from 0.52 to 1.16, S/V ranged from 0.61 to 0.87, C/V ranged from 0.17 to 0.50 (Table 1). The (Ad/Al)P, (Ad/Al)V, and (Ad/Al)S ranged from 1.00 to 1.69 in (Ad/Al)P; 0.64–1.11 in (Ad/Al)V and 0.50–0.78 in (Ad/Al)S, respectively (Table 1 and Table S1).
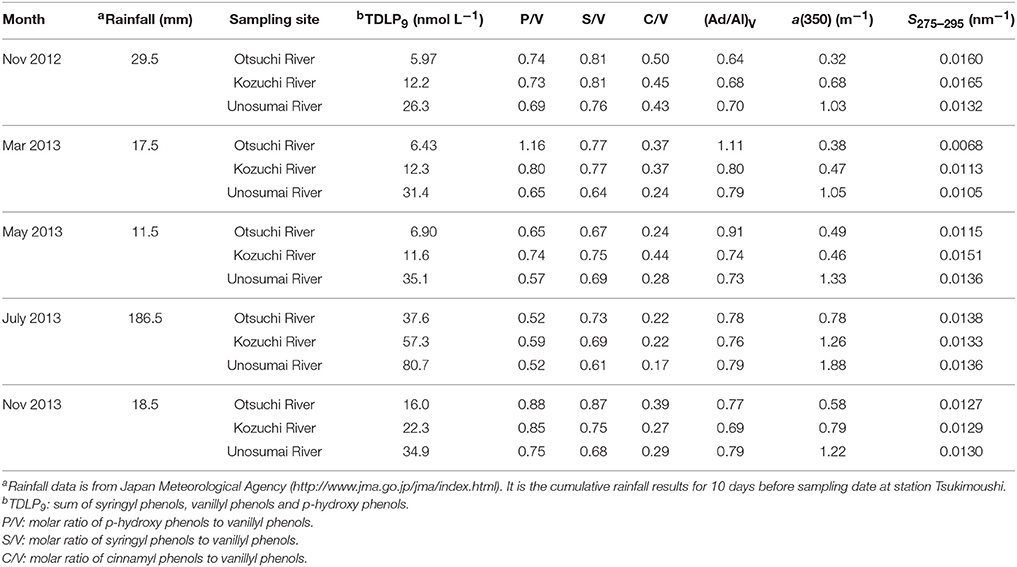
Table 1. Dissolved lignin phenol concentrations (TDLP9), composition ratios [P/V, S/V, C/V and (Ad/Al)V] and CDOM absorption coefficient at 350 nm [a(350)] and spectral slope 275–295 nm [S275–295] in the rivers.
The absorption coefficients of CDOM at a(250) and a(350) (± range of duplicate samples) in the rivers ranged several-fold from 1.79 (± 0.05) to 7.08 (± 0.08) m−1 and from 0.32 (± 0.01) to 1.88 (± 0.02) m−1, respectively (Table 1 and Table S1). The spectral slope coefficients, S275–295 and S350–400, ranged from 0.0068 to 0.0165 and 0.0105 to 0.0167 nm−1, respectively, and the slope ratio, SR, ranged from 0.65 to 1.14 (Table 1 and Table S1). The lowest S275–295, S350–400 and SR values were all observed in March 2013. The E2/E3 ratios ranged from 3.78 to 7.23 (Table S1).
Dissolved Lignin Phenols and CDOM in Otsuchi Bay
The changes in chlorophyll a concentrations, lignin phenol concentrations, and CDOM absorption coefficients along the river-ocean continuum in Otsuchi Bay are shown in Figure 2. Chlorophyll a concentrations ranged from 0.23 to 9.96 μg L−1, peaking at mid-salinities in July 2013 and dropping to relatively low concentrations at salinities >32 (Figure 2A). TDLP9 and CDOM absorption in surface waters decreased with increasing salinity, which was consistent with their terrigenous origin (Figures 2B,C; Table 2 and Table S2). Lignin concentrations (TDLP9) and the CDOM absorption coefficient a(350) were significantly linearly correlated (R2 = 0.63, p < 0.001, n = 32). Lignin concentrations ranged from 1.47 to 24.5 nmol L−1 (TDLP9) in surface waters and 2.46 to 14.3 nmol L−1 in subsurface waters, respectively (Table 2). The CDOM absorption coefficient, a(350), ranged from 0.17 (± 0.01) to 0.55 (± 0.01) m−1 in surface water (Table 2) and 0.12 to 0.38 (± 0.01) m−1 in subsurface waters.
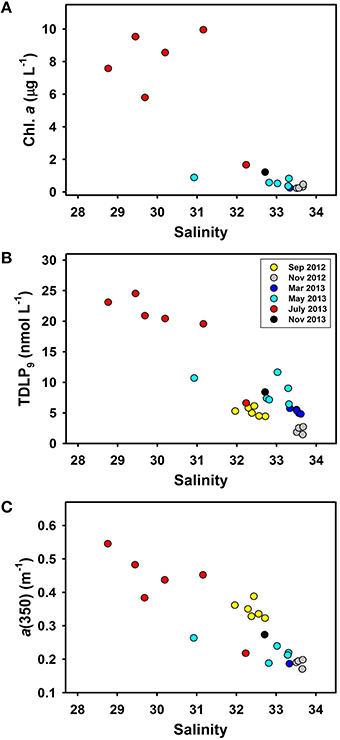
Figure 2. Relationships between salinity and (A) chlorophyll a (Chl. a), (B) dissolved lignin phenol concentrations (TDLP9), and (C) CDOM absorption coefficients [a(350)] in surface waters of Otsuchi Bay.
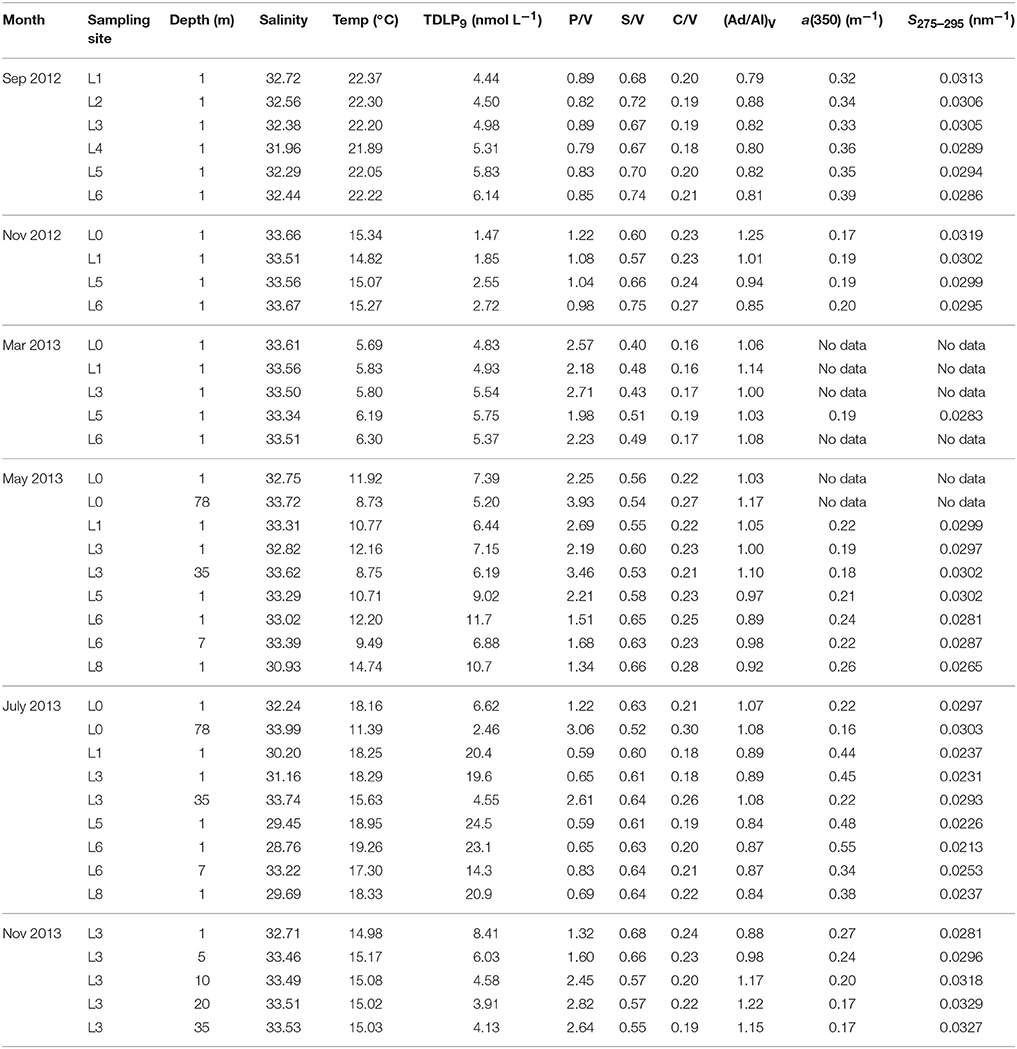
Table 2. Dissolved lignin phenol concentrations (TDLP9), composition ratios [P/V, S/V, C/V, and (Ad/Al)V], and CDOM parameters [a(350) and S275–295] in Otsuchi Bay.
Seasonal variations in lignin phenol compositions were minimal, whereas compositions varied significantly across the salinity gradient (p < 0.001). In surface waters, P/V, S/V, and (Ad/Al)V changed rapidly at salinities >32 (Figures 3A–C). The P/V, S/V, and (Ad/Al)V in surface waters ranged from 0.59 to 2.71, 0.40 to 0.75, and 0.79 to 1.25, respectively (Figures 3A–C; Table 2). The S275–295 also increased at salinities >32 (Figure 3D). No clear trends were observed between salinity and C/V (range 0.16–0.28), (Ad/Al)P (range 1.16–2.40), and (Ad/Al)S (range 0.48–0.75; Table 2 and Table S2). In surface and subsurface waters, S275–295 ranged from 0.0213 to 0.0319 nm−1 and 0.0243 to 0.0331 nm−1 (Table 2 and Table S2), S350–400 ranged from 0.0135 to 0.0177 nm−1 and 0.0125 to 0.0176 nm−1, SR ranged from 1.23 to 2.25 and 1.49 to 2.24, and E2/E3 ranged from 7.16 to 13.0 and 8.16 to 14.6, respectively (Table S2). Lignin phenol concentrations (TDLP9) were strongly correlated with S275–295 in surface and subsurface waters (R2 = 0.91, p < 0.001, n = 23 in surface water; R2 = 0.72, p < 0.01, n = 9 in subsurface water).
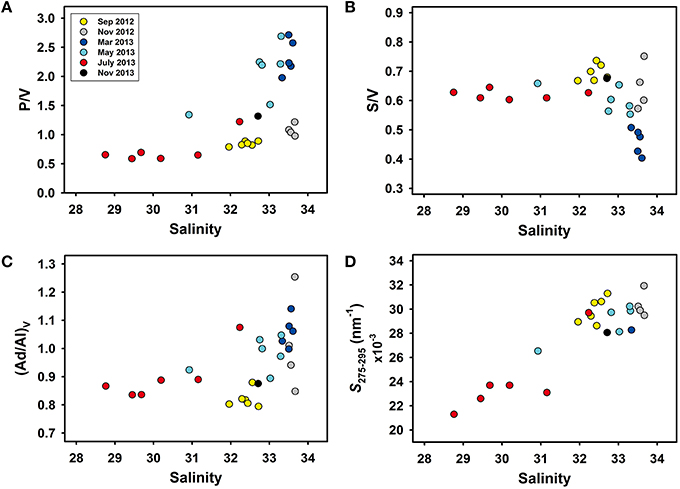
Figure 3. Relationships between salinity and lignin phenol compositions (A) molar ratio of p-hydroxy phenols to vanillyl phenols (P/V), (B) molar ratio of syringyl phenols to vanillyl phenols (S/V), (C) molar ratio of vanillic acid to vanillin phenols [(Ad/Al)V], and (D) the spectral slope coefficient of CDOM absorption coefficient spectrum between 275 and 295 nm (S275–295) in surface waters of Otsuchi Bay.
Variations in lignin phenol compositions (C/V, S/V, P/V) and S275–295 among river and surface seawater samples are shown in Figure 4. Lignin phenols in rivers had elevated S/V and C/V compared to the surface waters of Otsuchi Bay, and bay waters with salinities < 32 had S/V and C/V values that clustered between the river and high salinity (>32; Figure 4A). These observed trends were consistent with the rivers being the major source of lignin in the bay, and with physical mixing and decomposition processes shaping the parameters. The P/V and S275–295 were relatively low in the rivers and increased in the bay, and confirmed the riverine source of the tDOM and CDOM and the role of physical mixing and decomposition processes (Figure 4B). Five lower salinity (< 32) samples had P/V values similar to those in river water. These samples had S275–295 values that were intermediate between those in river and higher salinity bay waters. At higher salinities (>32), there was a broad range in P/V (0.6–2.6), indicative of mixing and alteration processes (Figure 4B).
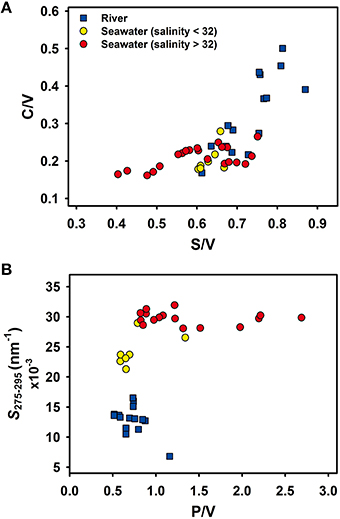
Figure 4. Scatter plots of lignin phenol compositions (A) S/V ratio vs. C/V ratio, (B) P/V ratio vs. spectral slope S275–295 in river (blue squares) and surface waters (yellow and red circles).
A vertical profile at station L3 in November 2013 revealed the variations in physical properties, lignin concentrations, and CDOM with depth in the water column (Figure 5). A vertical density gradient was observed in the upper few meters of the water column (Figure 5A). Lignin phenol concentrations (TDLP9) were maximal (8.41 nmol L−1) near the surface and declined rapidly to 3.91 nmol L−1 at 20 m (Figure 5A). The a(350) tracked lignin phenol concentrations and decreased rapidly with depth, whereas the P/V and S275–295 increased rapidly with depth from 1.32 to 2.82 and 0.0281 to 0.0327 nm−1, respectively (Figure 5B). The P/V, S/V, and C/V values in surface water were 1.32, 0.68, and 0.24, respectively, and 2.82, 0.57, and 0.22, respectively, at 20 m depth (Table 2). The observed vertical trends in lignin phenols and CDOM were consistent with physical mixing being a dominant process shaping the observed distributions of tDOM concentration and composition in the upper 20 m of the water column. Similar changes in concentrations and compositions of lignin phenols and CDOM were observed when comparing surface and bottom waters at other stations and during other seasons (Table 2 and Table S2).
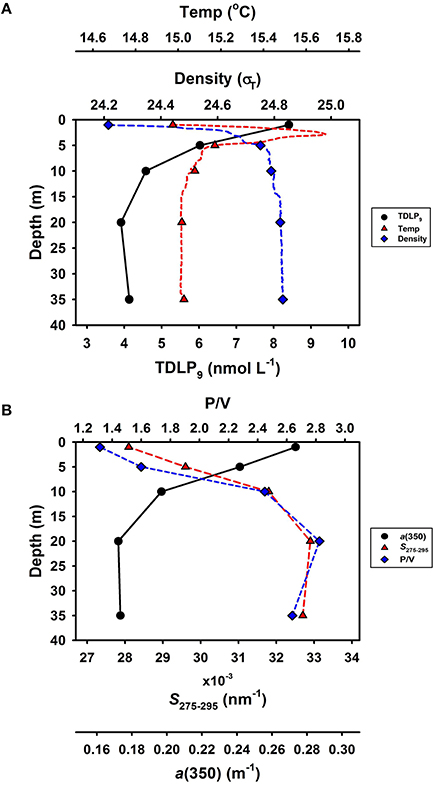
Figure 5. Vertical profiles of (A) lignin phenol concentrations (TDLP9), temperature and density (σT), (B) CDOM absorption coefficient a(350), spectral slope S275–295 and lignin composition P/V at station L3 in November 2013. Temperature and density data are form conductivity-temperature-depth (CTD) sensors at each 0.1 m.
Physical Mixing of CDOM in Otsuchi Bay
During November 2014, water samples were collected near the mouth of the Unosumai River and adjacent bay waters to investigate CDOM distributions and mixing across a salinity gradient (Figure 1B). A simple conservative mixing model was constructed using CDOM values from the Unosumai River as a freshwater end member and coastal seawater from station L6 as a marine end member (Figure 6 and Table S3). Measured values of a(350), a proxy for lignin phenol concentrations, were consistently below the conservative mixing line at mid salinities indicating some removal (< 25%) of CDOM across the salinity gradient in upper Otsuchi Bay (Figure 6A). Most values of S275–295 were below the mixing line at salinities < 28, with values closer to the mixing line at higher salinities (Figure 6B), which is consistent with the cumulative effects of photochemical alteration of CDOM.
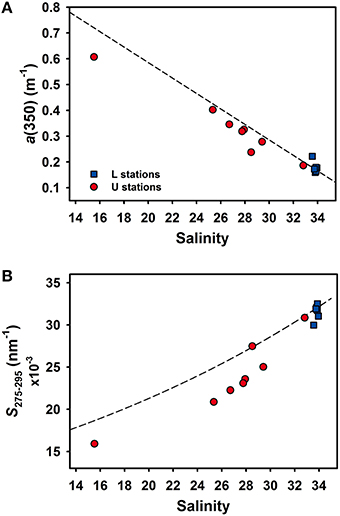
Figure 6. Relationships between salinity and (A) a(350) and (B)salinity and S275–295 in surface waters including mid salinity (U stations, red circles) and high salinity (L stations, blue squares) samples in November 2014. Dashed lines are conservative mixing curves constructed using the Unosumai River as the riverine end-member and station L6 as the marine end-member.
Lignin Decomposition Experiments with Unosumai River Water
The photochemical and biological decomposition of lignin was investigated in experiments with river water incubated under natural sunlight and in the dark for 62 days (Figure 7). The light treatment includes photochemical and biological processing, whereas the dark treatment only includes biological processes. Concentrations of lignin phenols decreased rapidly (29%) during the first 3 days in the light treatment compared with the dark treatment (5%; Figure 7A). The rapid loss of lignin phenols in the light treatment was accompanied by a sharp decrease in the S/V, indicating a preferential removal of syringyl phenols (Figure 7C). During the next 59 days, an additional 30% of lignin phenols were removed in the light treatment, vs. 34% in the dark treatment (Table 3). Relatively minor differences in P/V and S/V were observed between the light and dark treatments. Slightly higher P/V and lower S/V were observed in the light treatment after 62 days (Figures 7B,C). There was also a rapid decrease (27%) in a(350) in the light treatment compared with the dark treatment (~0%) during the first 3 days (Figure 7D). During the following 59 days, there was a removal of an additional 40% of a(350) in the light treatment and 20% in the dark treatment (Table 3). The S275–295 increased dramatically in the light treatment but only minimally in the dark treatment (Figure 7E). Likewise, the (Ad/Al)v increased dramatically in the light treatment and declined slightly in the dark treatment (Figure 7F). Throughout the incubation period, S350–400 values increased by 21 and 10% in the light and dark treatments, but the slope ratio (SR) increased by 37% in the light treatment and decreased by 4% in the dark treatment (Table 3). The E2/E3 ratio increased by 55 and 12%, in the light and dark treatment, respectively (Table 3). In this incubation, TDLP9 was highly correlated with S275–295 R2 = 0.95, p = 0.001, n = 6) in both treatments, and similar correlations were also observed between TDLP9 and E2/E3 (R2 = 0.87, p < 0.01, n = 6).
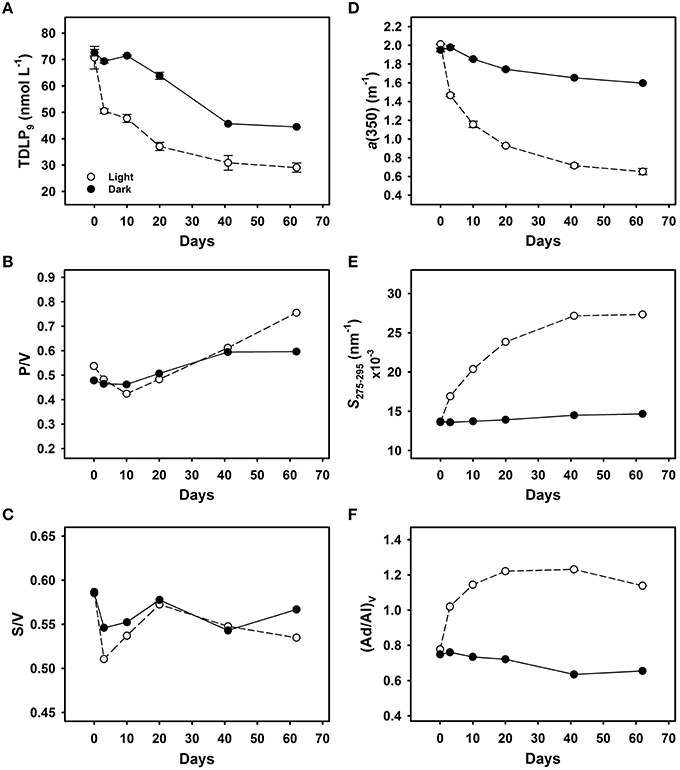
Figure 7. Photochemical and biological degradation of DOM in Unosumai River water. Time-course changes in (A) lignin phenol concentrations (TDLP9), (B) lignin phenol P/V composition, (C) lignin phenol S/V composition, (D) CDOM absorption coefficient a(350), (E) spectral slope S275−295, and (F) lignin phenol (Ad/Al)V composition. Experiments were conducted with duplicate samples incubated under natural sunlight (light treatment; photochemical and biological processes; open circles) and duplicate samples wrapped in aluminum foil (dark treatment; biological processes; closed circles). Plots are presented as average value ± range of duplicate samples.
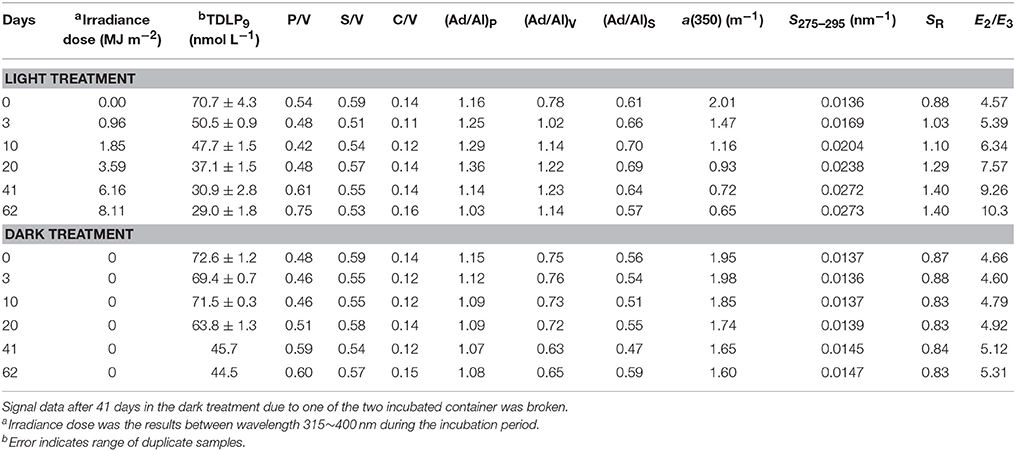
Table 3. Decomposition experiments of DOM in Unosumai River water under natural sunlight and dark treatments.
After 62 days, lignin phenol concentrations, a(250), and a(350) decreased by 59, 32, and 68% in the treatment exposed to sunlight and by 39, 9, and 18% in the dark treatment (Table 3). The steady decrease in a(250) and a(350) in both treatments suggested the aromatic structures in lignin were effectively degraded by microorganisms in the absence of ultraviolet radiation. Simple exponential decay constants (k) were calculated for lignin (TDLP9) removal in the light treatment (0.0125 d−1, R2 = 0.81, p < 0.05) and dark treatment (0.0089 d−1, R2 = 0.92, p < 0.01). Similar calculations for the different families of lignin phenols indicated the following sequence of decay constants S > V > P in both the light and dark treatments, in agreement with similar patterns observed in degradation experiments using DOM from the Broad River in South Carolina (Benner and Kaiser, 2011).
The relative contributions of photochemical and biological processes in the lignin decomposition experiments can be estimated by comparing lignin removal in the light treatment (41.7 ± 3.0 nmol L−1) to that in the dark treatment (28.1 nmol L−1). Photodegradation, photo-enhanced biodegradation and biodegradation occurred in the light treatment, whereas only biodegradation occurred in the dark treatment. During the 62-day experiments, lignin biodegradation in the dark treatment accounted for 67% of the total lignin degradation observed in the light treatment. Based on this calculation, photodegradation and photo-enhanced biodegradation accounted for 33% of the lignin removal in the light treatment.
Discussion
Riverine Sources of Lignin and CDOM
The Unosumai River is the source of more than half of the freshwater, CDOM and lignin entering Otsuchi Bay from continental runoff. Lignin concentrations in the Unosumai River were typically several-fold higher than those in the Otsuchi and Kozuchi rivers. Concentrations of lignin phenols and CDOM absorption were highest during July when precipitation was the highest recorded during this study. This observation is consistent with other observations of high lignin and CDOM concentrations during major precipitation events in other river systems (Spencer et al., 2009; Amon et al., 2012; Shen et al., 2012). A different pattern was observed in November 2012, when higher precipitation was associated with lower lignin concentrations, potentially due to snowmelt (Baker et al., 2000).
The S/V and C/V values indicated the lignin in these rivers originated primarily from non-woody angiosperm tissues (Hedges and Mann, 1979). The P/V, S/V, and C/V values were similar to those in the Mississippi River (Shen et al., 2012), but the S/V and C/V were higher than those in large Arctic rivers, which have greater contributions from gymnosperm vegetation (Amon et al., 2012). Although lignin phenol compositions in rivers draining into Otsuchi Bay were similar to those observed in the Mississippi River, the TDLP11 concentrations in the Mississippi River (146.2 ± 56.3 nmol L−1; Shen et al., 2012) were three to nine times higher than the average TDLP11 in the rivers flowing into Otsuchi Bay.
Lignin concentrations were not strongly coupled with discharge in the Otsuchi and Kozuchi rivers, indicating other factors influence lignin and CDOM concentrations. High discharge was associated with lower lignin concentrations and a(350) in the Otsuchi River. This could be the result of human activities and land use, considering the river sampling site is located downstream of the city of Otsuchi and many people migrated here after the 2011 Tohoku earthquake. Previous studies have observed that land use, vegetation cover and hydrology play important roles in shaping the quantity and quality of CDOM and DOM in rivers (Yamashita et al., 2011; Walker et al., 2013; Mann et al., 2014). Strong relationships were observed between lignin phenol concentrations and CDOM absorption coefficients a(250) (R2 = 0.88, p < 0.001, n = 15) and a(350) (R2 = 0.87, p < 0.001, n = 15), indicating the potential for using these optical parameters as tracers of lignin in river and bay waters.
Biodegradation and Photodegradation of Lignin and CDOM
Exposure to solar radiation led to the rapid decomposition of lignin and CDOM in this study. Losses of lignin phenols and CDOM absorption were several times greater in the light than in the dark during the first 3 days of the experiments, which is consistent with the known susceptibility of lignin to photodegradation (Opsahl and Benner, 1998; Stubbins et al., 2010). Following this initial burst of photodegradation and photobleaching, lignin phenol decay rates were similar during the next 2 months in the light and dark treatments. Photochemical processes can produce bioavailable photoproducts (Miller and Moran, 1997; Obernosterer and Benner, 2004), but the similar rates of lignin degradation in the light and dark treatments during the ensuing 2 months indicated photochemical processes had a minor impact on lignin biodegradation after the initial 3 days of solar exposure. In contrast, alterations of a(350) and S275–295 continued to be much greater in the light treatment, suggesting some photobleaching was not directly linked with lignin decomposition. The biodegradation decay rate for lignin in the Unosumai River was higher than that observed in the Broad and Mississippi rivers (Opsahl and Benner, 1998; Fichot and Benner, 2014), which could be related to more rapid mobilization and transport of tDOM in the Unosumai River basin.
Previous studies have observed varying susceptibility to photodegradation among lignin phenols (Opsahl and Benner, 1998; Spencer et al., 2009; Benner and Kaiser, 2011). In the present study a relatively small increase in P/V and decrease in S/V was observed in the light treatment, whereas the (Ad/Al)V increased rapidly in the light treatment. The rapid increase in (Ad/Al)V was matched by rapid increases in S275–295 and E2/E3. Previous studies have linked increases in S275–295 and E2/E3 with decreases in the average molecular weight of DOM (de Haan, 1972; Helms et al., 2008). Overall these observations indicated the photodegradation of lignin is accompanied by a decrease in its molecular weight, as previously demonstrated during the photodegradation of lignin in Mississippi River water (Opsahl and Benner, 1998). Relatively minor increases in S275–295 and E2/E3 were observed in the absence of solar radiation even though the rate of lignin biodegradation and photodegradation were similar after the initial 3 days of decomposition. Losses of a(350) were substantially higher than those of lignin phenols in the light treatment, whereas losses of a(350) were lower than those of lignin phenols in the dark treatment. It appears the pathways of lignin and CDOM degradation are different in the presence and absence of solar radiation (see section below).
Transformations of Lignin and CDOM in Otsuchi Bay
The physical mixing of river and coastal seawater played an important role in controlling the distributions and concentrations of lignin and CDOM in Otsuchi Bay. Our seasonal data in Otsuchi Bay were limited, but a simple mixing curve for a(350) indicated some lignin removal (up to 25%) across mid salinities in the upper bay. Evidence indicated photochemical and biological processes both played a role in the decomposition of lignin and CDOM in the bay. Molecular indicators of lignin transformations, including P/V, S/V, and (Ad/Al)V, provided strong evidence of the oxidation and decomposition of lignin at higher salinities (>32) in surface and subsurface waters. Likewise, the spectral slope (S275–295) indicated transformations of tDOM and CDOM were evident at higher salinities in surface and subsurface waters of Otsuchi Bay. Indeed, previous studies (Helms et al., 2008; Fichot and Benner, 2012; Yamashita et al., 2013) and our upper bay results (salinity < 28) have shown that the photochemical degradation of CDOM, unlike microbial degradation, effectively increases S275–295. Assuming photochemical processes were largely responsible for spectral slope (S275–295) transformations (Helms et al., 2008; Fichot and Benner, 2012), the elevated spectral slopes observed in deeper waters indicated previous exposure to solar radiation.
The decomposition experiments demonstrated the susceptibility of lignin to microbial and photochemical decomposition. As with previous experimental studies, solar exposure promoted relatively rapid alterations of lignin and CDOM (Opsahl and Benner, 1998; Hernes and Benner, 2003; Spencer et al., 2009; Benner and Kaiser, 2011; Fichot and Benner, 2012). The relative contributions of photochemical and biological processes in the transformation and decomposition of lignin and CDOM is dependent on several environmental variables, including solar irradiance, water clarity, microbial community structure, temperature, and physical mixing. On the Louisiana shelf in the northern Gulf of Mexico, biodegradation dominated lignin transformations in the shelf mixed layer and accounted for 60% of total decomposition of lignin (Fichot and Benner, 2014). Photo-enhanced biodegradation accounted for 32% of total lignin decomposition and direct photodegradation accounted for 8% of lignin removal on the Louisiana shelf. Based on the relative contributions of photodegradation and biodegradation in the lignin decomposition experiments, and assuming solar exposure in the light treatment was similar to that in surface seawaters of Otsuchi Bay, we estimated that biodegradation accounted for 67% of total lignin removal and photo-enhanced biodegradation plus direct photodegradation accounted for 33% of total lignin removal.
This study confirms that biodegradation appears to be a dominant process in the mineralization of lignin and tDOM in the coastal ocean, and it indicates photochemical transformations of fresh riverine tDOM can be significant in the early stages of plume dispersal and mixing with surface waters in the bay. The short water residence times in Otsuchi Bay (~0.5–1 month) indicate the potential for substantial export of tDOM and associated nutrients and trace elements from Otsuchi Bay to offshore waters.
Author Contributions
HO, HF, and CL collected the in situ samples for lignin and CDOM measurements. HO designed the decomposition experiment and carried it out with CL. CL processed the lignin and CDOM samples and wrote the manuscript with important discussion with RB, HO, and HF. YY and CF corrected the text and all authors contributed to this version.
Funding
This study was conducted as a part of the project “Tohoku Ecosystem-Associated Marine Science” (TEAMS) sponsored by the Ministry of Education, Culture, Sports, Science and Technology (MEXT). RB received support from the U.S. National Science Foundation (1504137).
Conflict of Interest Statement
The authors declare that the research was conducted in the absence of any commercial or financial relationships that could be construed as a potential conflict of interest.
Acknowledgments
We thank the staff of the International Coastal Research Center, Atmosphere and Ocean Research Institute, the University of Tokyo for technical and logistical support. We are very grateful to the assistance from Yuan Shen for lignin analysis.
Supplementary Material
The Supplementary Material for this article can be found online at: http://journal.frontiersin.org/article/10.3389/fmars.2016.00085
References
Amon, R. M. W., Rinehart, A. J., Duan, S., Louchouarn, P., Prokushkin, A., Guggenberger, G., et al. (2012). Dissolved organic matter sources in large Arctic rivers. Geochim. Cosmochim. Acta 94, 217–237. doi: 10.1016/j.gca.2012.07.015
Anbo, A., Otobe, H., and Takagi, M. (2005). River water flowing into Otsuchi Bay. Otsuchi Mar. Res. Cent. Rep. 30, 4–8.
Baker, M. A., Valett, H. M., and Dahm, C. N. (2000). Organic carbon supply and metabolism in a shallow groundwater ecosystem. Ecology 81, 3133–3148. doi: 10.1890/0012-9658(2000)081[3133:OCSAMI]2.0.CO;2
Benner, R., and Kaiser, K. (2011). Biological and photochemical transformations of amino acids and lignin phenols in riverine dissolved organic matter. Biogeochemistry 102, 209–222. doi: 10.1007/s10533-010-9435-4
Benner, R., and Opsahl, S. (2001). Molecular indicators of the sources and transformations of dissolved organic matter in the Mississippi river plume. Org. Geochem. 32, 597–611. doi: 10.1016/S0146-6380(00)00197-2
Bouillon, S., Yambélé, A., Gillikin, D. P., Teodoru, C., Darchambeau, F., Lambert, T., et al. (2014). Contrasting biogeochemical characteristics of the Oubangui River and tributaries (Congo River basin). Sci. Rep. 4:5402. doi: 10.1038/srep05402
de Haan, H. (1972). Molecule size distribution of soluble humic compounds from different natural waters. Freshwater. Biol. 2, 235–241. doi: 10.1111/j.1365-2427.1972.tb00052.x
Del Vecchio, R., and Blough, N. V. (2002). Photobleaching of chromophoric dissolved organic matter in natural waters: kinetics and modeling. Mar. Chem. 78, 231–253. doi: 10.1016/S0304-4203(02)00036-1
Fichot, C. G., and Benner, R. (2011). A novel method to estimate DOC concentrations from CDOM absorption coefficients in coastal waters. Geophys. Res. Lett. 38:L03610. doi: 10.1029/2010gl046152
Fichot, C. G., and Benner, R. (2012). The spectral slop coefficient of chromophoric dissolved organic matter (S275-295) as a tracer of terrigenous dissolved organic carbon in river-influenced ocean margins. Limnol. Oceanogr. 57, 1453–1466. doi: 10.4319/lo.2012.57.5.1453
Fichot, C. G., and Benner, R. (2014). The fate of terrigenous dissolved organic carbon in a river-influenced ocean margin. Global Biogeochem. Cycles 28, 300–318. doi: 10.1002/2013GB004670
Fichot, C. G., Kaiser, K., Hooker, S. B., Amon, R. M. W., Babin, M., Bélanger, S., et al. (2013). Pan-Arctic distributions of continental runoff in the Arctic Ocean. Sci. Rep. 3:1053. doi: 10.1038/srep01053
Fukuda, H., Katayama, R., Yang, Y., Takasu, H., Nishibe, Y., Tsuda, A., et al. (2015). Nutrient status of Otsuchi Bay (northeastern Japan) following the 2011 off the Pacific coast of Tohoku Earthquake. J. Oceanogr. 72, 39–52. doi: 10.1007/s10872-015-0296-2
Fukuda, H., Ogawa, H., Sohrin, R., Yamasaki, A., and Koike, I. (2007). Sources of dissolved organic carbon and nitrogen in Otsuchi Bay on the Sanriku ria coast of Japan in the spring. Coastal Mar. Sci. 31, 19–29.
Furuya, K., Takahashi, K., and Iizumi, H. (1993). Wind-dependent formation of phytoplankton spring bloom in Otsuchi Bay, a ria in Sanriku, Japan. J. Oceanogr. 49, 459–457. doi: 10.1007/BF02234960
Hedges, J. I., Keil, R. G., and Benner, R. (1997). What happens to terrestrial organic matter in the ocean? Org. Geochem. 27, 195–212. doi: 10.1016/S0146-6380(97)00066-1
Hedges, J. I., and Mann, D. C. (1979). The characterization of plant tissues by their lignin oxidation products. Geochim. Cosmochim. Acta 43, 1803–1807. doi: 10.1016/0016-7037(79)90028-0
Helms, J. R., Stubbins, A., Ritchie, J. D., Minor, E. C., Kieber, D. J., and Mopper, K. (2008). Absorption spectral slopes and slope ratios as indicators of molecular weight, source, and photobleaching of chromophoric dissolved organic matter. Limnol. Oceanogr. 53, 955–969. doi: 10.4319/lo.2008.53.3.0955
Hernes, P. J., and Benner, R. (2002). Transport and diagenesis of dissolved and particulate terriigenous organic matter in the North Pacific. Deep-Sea Res. Pt. I 49, 2119–2132. doi: 10.1016/S0967-0637(02)00128-0
Hernes, P. J., and Benner, R. (2003). Photochemical and microbial degradation of dissolved lignin phenols: implication for the fate of terrigenous dissolved organic matter in marine environments. J. Geophys. Res. 108, 1453–1466. doi: 10.1029/2002JC001421
Kaiser, K., and Benner, R. (2012). Characterization of lignin by gas chromatography and mass spectrometry using a simplified CuO oxidation method. Anal. Chem. 84, 459–464. doi: 10.1021/ac202004r
Kawamiya, M., Kishi, M. J., Ahmed, M. D. K., and Sugimoto, R. (1996). Cause and consequences of phytoplankton blooms in Otsuchi Bay, Japan. Cont. Shelf Res. 16, 1683–1698. doi: 10.1016/0278-4343(96)00007-6
Kazama, M., and Noda, T. (2012). Damage statistics (summary of the 2011 off the Pacific coast of Tohoku earthquake damage). Soils Found. 52, 780–792. doi: 10.1016/j.sandf.2012.11.003
Lou, T., and Xie, H. (2006). Photochemical alternation of the molecular weight of dissolved organic matter. Chemosphere 65, 2333–2342. doi: 10.1016/j.chemosphere.2006.05.001
Louchouarn, P., Opsahl, S., and Benner, R. (2000). Isolation and quantification of dissolved lignin from natural waters using solid-phase extraction and GC/MS. Anal. Chem. 72, 2780–2787. doi: 10.1021/ac9912552
Mann, P. J., Spencer, R. G. M., Dinga, B. J., Poulsen, J. R., Hernes, P. J., Fiske, G., et al. (2014). The biogeochemistry of carbon across a gradient of streams and rivers with the Congo Basin. J. Geophys. Res. 119, 687–702. doi: 10.1002/2013JG002442
Meyers-Schulte, K. J., and Hedges, J. I. (1986). Molecular evidence for a terrestrial component of organic matter dissolved in ocean water. Nature 321, 61–63. doi: 10.1038/321061a0
Miller, L. M., and Moran, M. A. (1997). Interaction of photochemical and microbial processes in the degradation of refractory dissolved organic matter from a coastal marine environment. Limnol. Oceanogr. 42, 1317–1324. doi: 10.4319/lo.1997.42.6.1317
Miller, W. L., and Zepp, R. G. (1995). Photochemical production of dissolved inorganic carbon from terrestrial organic matter: significance to the oceanic organic carbon cycle. Geophys. Res. Lett. 22, 417–420. doi: 10.1029/94GL03344
Mopper, K., and Kieber, D. J. (2002). “Photochemistry and the cycling of carbon, sulfur, nitrogen and phosphorus,” in Biogeochemistry of Marine Dissolved Organic Matter, eds D. A. Hansell and C. A. Carlson (San Diego, CA: Academic Press), 455–508.
Moran, M. A., Sheldon, W. M. J. R., and Zepp, R. G. (2000). Carbon loss and optical property changes during long-term photochemical and biological degradation of estuarine dissolved organic matter. Limnol. Oceanogr. 45, 1254–1264. doi: 10.4319/lo.2000.45.6.1254
Nelson, N. B., Siegel, D. A., Carlson, C. A., and Swan, C. M. (2010). Tracing global biogeochemical cycles and meridional overturning circulation using chromophoric dissolved organic matter. Geophys. Res. Lett. 37:L03610. doi: 10.1029/2009GL042325
Obernosterer, I., and Benner, R. (2004). Competition between biological and photochemical processes in the mineralization of dissolved organic carbon. Limnol. Oceanogr. 49, 117–124. doi: 10.4319/lo.2004.49.1.0117
Opsahl, S., and Benner, R. (1997). Distribution and cycling of terrigenous dissolved organic matter in the ocean. Nature 386, 480–482. doi: 10.1038/386480a0
Opsahl, S., and Benner, R. (1998). Photochemical reactivity of dissolved lignin in river and ocean water. Limnol. Oceanogr. 43, 1297–1304. doi: 10.4319/lo.1998.43.6.1297
Otobe, H., Onishi, H., Inada, M., Michida, Y., and Terazaki, M. (2009). Estimation of water circulation in Otsuchi Bay, Japan inferred from ADCP observation. Coastal Mar. Sci. 33, 78–86.
Santos, L., Santos, E. B. H., Dias, J. M., Cunha, A., and Almeida, A. (2014). Photochemical and microbial alternations of DOM spectroscopic properties in the estuarine system Ria de Aveiro. Photochem. Photobiol. Sci. 13, 1146–1159. doi: 10.1039/C4PP00005F
Schlesinger, W. H., and Melack, J. M. (1981). Transport of organic carbon in the world's river. Tellus 33, 172–187. doi: 10.1111/j.2153-3490.1981.tb01742.x
Shen, Y., Fichot, C. G., and Benner, R. (2012). Floodplain influence on dissolved organic matter export from the low Mississippi-Atchafalaya River system to the Gulf of Mexico. Limnol. Oceanogr. 57, 1149–1160. doi: 10.4319/lo.2012.57.4.1149
Spencer, R. G. M., Butler, K. D., and Aiken, G. R. (2012). Dissolved organic carbon and chromophoric dissolved organic matter properties of rivers in the USA. J. Geophys. Res. 117:G03001. doi: 10.1029/2011JG001928
Spencer, R. G. M., Stubbins, A., Hernes, P. J., Baker, A., Mopper, K., Aufdenkampe, A. K., et al. (2009). Photochemical degradation of dissolved organic matter and dissolved lignin phenols from the Congo River. J. Geophys. Res. 114:G03010. doi: 10.1029/2009JG000968
Stubbins, A., Spencer, R. G. M., Chen, H., Hatcher, P. G., Mopper, K., Hernes, P. J., et al. (2010). Illuminated darkness: molecular signatures of Congo River dissolved organic matter and its photochemical alteration as revealed by ultrahigh precision mass spectrometry. Limnol. Oceanogr. 55, 1467–1477. doi: 10.4319/lo.2010.55.4.1467
Suzuki, R., and Ishimaru, T. (1990). An improved method for the determination of phytoplankton chlorophyll using N, N-dimethylformamide. J. Oceanogr. Soc. Jpn. 46, 190–194. doi: 10.1007/BF02125580
Walker, S. A., Amon, R. M. W., and Stedmon, C. A. (2013). Variations in high-latitude riverine fluorescent dissolved organic matter: a comparison of large Arctic rivers. J. Geophys. Res. Biogeosci. 118, 1689–1702. doi: 10.1002/2013JG002320
Ward, N. D., Keil, R. G., Medeirod, P. M., Brito, D. C., Cunha, A. C., Dittmar, T., et al. (2013). Degradation of terrestrially derived macromolecules in the Amazon River. Nat. Geosci. 6, 530–533. doi: 10.1038/ngeo1817
Yamashita, Y., Kloeppel, B. D., Knoepp, J., Zausen, G. L., and Jaffé, R. (2011). Effects of watershed history on dissolved organic matter characteristics in headwater streams. Ecosystems 14, 1110–1122. doi: 10.1007/s10021-011-9469-z
Yamashita, Y., Nosaka, Y., Suzuki, K., Ogawa, H., Takahashi, K., and Saito, H. (2013). Photobleaching as a factor controlling spectral characteristics of chromophoric dissolved organic matter in open ocean. Biogeosciences 10, 7207–7217. doi: 10.5194/bg-10-7207-2013
Keywords: terrigenous dissolved organic matter, lignin phenols, chromophoric dissolved organic matter, photodegradation, biodegradation, Otsuchi Bay
Citation: Lu C-J, Benner R, Fichot CG, Fukuda H, Yamashita Y and Ogawa H (2016) Sources and Transformations of Dissolved Lignin Phenols and Chromophoric Dissolved Organic Matter in Otsuchi Bay, Japan. Front. Mar. Sci. 3:85. doi: 10.3389/fmars.2016.00085
Received: 15 February 2016; Accepted: 17 May 2016;
Published: 07 June 2016.
Edited by:
Javier Arístegui, University of Las Palmas de Gran Canaria, SpainReviewed by:
Laura Lorenzoni, University of South Florida, USALeanne C. Powers, Skidaway Institute of Oceanography, USA
Copyright © 2016 Lu, Benner, Fichot, Fukuda, Yamashita and Ogawa. This is an open-access article distributed under the terms of the Creative Commons Attribution License (CC BY). The use, distribution or reproduction in other forums is permitted, provided the original author(s) or licensor are credited and that the original publication in this journal is cited, in accordance with accepted academic practice. No use, distribution or reproduction is permitted which does not comply with these terms.
*Correspondence: Chia-Jung Lu, bHVjakBhb3JpLnUtdG9reW8uYWMuanA=
†Present Address: Cédric G. Fichot, Jet Propulsion Laboratory, California Institute of Technology, Pasadena, CA, USA