 Antoine Bruge
 Paula Alvarez
 Almudena Fontán
 Unai Cotano
 Guillem Chust
- 1Marine Research Division, AZTI-Tecnalia, Sukarrieta, Spain
- 2UFR Sciences and Techniques de la Côte Basque, Université de Pau et des Pays de l'Adour, Anglet, France
North-east Atlantic mackerel spawning distribution has shifted northward in the last three decades probably in response to global sea warming. Yet, uncertainties subsist regarding on the shift rate, causalities, and how this species will respond to future conditions. Using egg surveys, we explored the influence of temperature change on mackerel's spawning distribution (western and southern spawning components of the stock) between 1992 and 2013, and projected how it may change under future climate change scenarios. We developed three generalized additive models (GAMs): (i) a spatiotemporal model to reconstruct the spawning distribution for the north-east Atlantic stock over the period 1992–2013, to estimate the rate of shift; (ii) a thermal habitat model to assess if spawning mackerel have tracked their thermal spawning-niche; and (iii) a niche-based model to project future spawning distribution under two predicted climate change scenarios. Our findings showed that mackerel spawning activity has shifted northward at a rate of 15.9 ± 0.9 km/decade between 1992 and 2013. Similarly, using the thermal habitat model, we detected a northward shift of the thermal spawning-niche. This indicates that mackerel has spawned at higher latitudes to partially tracking their thermal spawning-niche, at a rate of 28.0 ± 9.0 km/°C of sea warming. Under future scenarios (mid and end of the century), the extrapolation of the niche-based model to coupled hydroclimatic and biogeochemical models indicates that center of gravity of mackerel spawning distribution is expected to shift westward (32 to 117 km) and northward (0.5 to 328 km), but with high variability according to scenarios and time frames. The future of the overall egg production in the area is uncertain (change from −9.3 to 12%). With the aim to allow the fishing industry to anticipate the future distribution of mackerel shoals during the spawning period, future research should focus on reducing uncertainty in projections.
Introduction
Climate change is altering ocean physico-chemistry and circulation and this trend is projected to be exacerbated over the 21st century (Collins et al., 2013). In particular, global sea warming has modified the distribution and phenology of several marine fish species and plankton communities (Beaugrand et al., 2002; Edwards and Richardson, 2004; Perry et al., 2005; Cheung et al., 2013; Chust et al., 2013; Munday et al., 2013; Montero-Serra et al., 2015). Numerous species have shifted their distributions northward to follow the displacement of their thermal habitat—also called niche tracking (Monahan and Tingley, 2012). Possible consequences include the alteration of large-scale to local ecosystems, fish recruitment and break down of the established food chain (Beaugrand et al., 2003). This will strongly affect fisheries (Brander, 2010; Pecl et al., 2014; Gamito et al., 2015), stressing the need to improve our understanding of past changes in fish distribution to allow reliable future projections.
In this study, we investigated the case of Atlantic mackerel (Scomber scombrus), a pelagic species performing seasonal migrations between feeding and spawning grounds (Uriarte and Lucio, 2001). In particular, we investigated the North-East Atlantic mackerel (NEAM) population which spawns from January to July along the continental shelf edge from Portuguese to Scottish waters and in the North Sea (Reid et al., 1997; Villamor et al., 1997; Reid, 2001; Beare and Reid, 2002). After spawning, NEAM migrates toward the North Sea and Norwegian Sea to feed. Mackerel is an economically important species for several European countries with approximately 1.4 million tonnes landed in 2014 (ICES, 2015). Until 1995, NEAM was originally divided into three separated management units (North, West, and South stocks). However, from that year on (based on tagging experiments, which validated the migratory route of mackerel in the Northeast Atlantic waters), it was agreed to unify the population in a single stock. This stock is divided into three spawning components (ICES, 1996): North Sea Spawning Component (NSC), Western Spawning Component (WSC, Biscay to northwest of Scotland), and Southern Spawning Component (SSC, Gibraltar to southern Biscay); the existence of these spawning components still remains controversial Some studies on natal homing studies indicate the existence of structures within the spawning components (Nesbö et al., 2000; Jansen et al., 2013) with mixing between them (Jansen and Gislason, 2013), although most of the studies failed to identify patterns (Jamieson and Smith, 1987; MacKenzie, 1990; Abaunza et al., 1995).
NEAM spawning localization has shifted northward in the last three decades (Beare and Reid, 2002) probably due in part to global sea warming (ICES, 2012, 2013a; Hughes et al., 2014). Beare and Reid (2002) showed that the intensity of spawning activity from 1977 to 1998 has shifted, declining in the south and rising in the north, although without clear relation between egg density and sea temperature. Hughes et al. (2014) modeled the spawning activity occurring in the western component during the period 1977–2010 and estimated a northward shift of 37.7 km/°C of warming. Heath et al. (2012) observed a northward shift in mean latitude of NEAM's catches for the two periods studied i.e., 1970–1980 and 1980–1990. However, Montero-Serra et al. (2015) did not find significant changes in the mean latitude of occurrence of NEAM captures in the North Sea for the period 1965–2012. Nevertheless, this analysis showed that NEAM abundance seems to have increased in the North Sea. More recently, in late September 2013, NEAM were recorded for the first time in Isfjorden, Svalbard (78°15′ N, 15°11′ E). This observation represents a possible northward expansion of mackerel's distributional range (of ca. 5° latitude) and seems to be linked with the increase in water temperature (Berge et al., 2015). The phenology also seems to be altered. Punzón and Villamor (2009) analyzed the handline fishery landings occurring in the Cantabrian Sea at the end of the winter and concluded that the fishing season shifted forward by 29 days between 2000 and 2006. Overall, uncertainties regarding the shift rate of NEAM spawning activity, its causes, and how this species will adapt to future conditions, still remain unclear.
To address these questions, the distribution of mackerel spawning activity was modeled using Generalized Additive Models (GAMs). We aimed to identify the drivers of spawning activity, how this species is affected by oceanic variability, and how this might be modified in the future under climate change scenarios. In particular, we built and compared two different models to analyse the trends and potential drivers over the period 1992–2013, based on the approach developed by Chust et al. (2013), and a third model to project future spawning distribution: (i) a spatiotemporal model to reconstruct the monthly spawning distribution for the NEAM stock (western and southern components) over the period 1992–2013 and to estimate the rate of shift; (ii) a thermal habitat model over the same period to assess whether the thermal spawning-niche (i.e., sea temperature suitability for spawning) has shifted or not; and (iii) an ecological niche-based (sensu Hutchinson (1957)) model to project future spawning distribution over the 21st century under IPCC RCP (Representative Concentration Pathway) climate change scenarios.
Materials and Methods
Biological Data
Since 1977, ICES (International Council for the Exploration of the Sea) partners undertook triennially a mackerel egg survey in the north-east Atlantic, providing the only fishery-independent measure of spawning stock biomass. Until 1989, mackerel egg surveys were exclusively conducted in the WSC (see above). Only since 1992, surveys started covering the whole spawning area of the WSC and SSC, from January to July, following the south to north spawning migration as the water temperature gradually warms up. Data collection consists of towing plankton hauls in location, usually centered on ICES half statistical rectangles (0.5° latitude × 0.5° longitude in WSC and 0.25° latitude × 0.333° longitude in SSC). Surveys are conducted by several countries using different sampling gears. Therefore, a standardization procedure is implemented to ensure data homogeneity. Details about the sampling strategy can be found in the survey manual (ICES, 2013b).
Because the egg survey for the SSC has only been undertaken since 1992, in this study, we analyzed the integrated data from the WSC and SSC, collected during the period 1992–2013. Presence/Absence (Pres/Abs) data and egg production (EP, eggs m−2 days−1) were used as response variables. EP was preferred to egg count according to findings from Augustin et al. (1998). The equation can be found in Hughes et al. (2014).
Environmental Data
Several environmental variables were compiled with the aim of identifying the drivers of NEAM spawning activity. In order to comprise the entire vertical distribution of mackerel eggs in the water column (Coombs et al., 2001), ICES recommends a maximum sampling depth of 200 m, or 5 m above the bottom in shallower areas. Therefore, a large part of the data summarizes the amount of eggs located in the upper 200 m water column. Considering this, monthly averaged-200-m-water-column temperatures were calculated using multi-water-layers from NCEP Global Ocean Data Assimilation System (GODAS; Derber and Rosati, 1989; Ji et al., 1995; Behringer et al., 1998; Saha et al., 2006; Nishida, 2011). GODAS provides monthly water temperature data on a 0.333° × 1° latitude–longitude grid. A bilinear interpolation was performed to obtain a 0.5° × 0.5° latitude–longitude resolution. Monthly Sea Surface Temperature (SST), Sea Surface Salinity (SSS), Sea Surface Height (SSH), and Mixed Layer Depth (MLD) were extracted from the same model and interpolated in a similar way. Bathymetry was extracted from NOAA database using the marmap R package (Pante and Simon-Bouhet, 2013). As a surrogate of phytoplankton, we extracted monthly-averaged surface chlorophyll concentration from satellite data (merged data from different sensors: SeaWIFS, MODIS, MERIS, and VIIRS) between 1998 and 2013 (available from GlobColour at http://hermes.acri.fr/).
Spawning Distribution Modeling
The distribution of mackerel spawning activity was modeled using GAMs (Hastie and Tibshirani, 1990). GAMs were selected as they enable the fit of non-linear responses for a wide range of statistical distributions. The specific method designed to model the monthly spawning distribution was inspired by the procedure described in Borchers et al. (1997) for horse mackerel (Trachurus trachurus), in which Pres/Abs is modeled separately from non-zero (i.e., abundance) observations. The method is based on three steps described as following:
Step (1) A first GAM using egg Pres/Abs as response variable was built (thereafter, referred as the Pres/Abs model). A binomial error distribution with a logit-link function was chosen to run the model. Variable selection was undertaken first by removing variables that were not statistically significant, and second, by adding and removing terms according to the criteria of deviance change (>1%) in a forward stepwise procedure, in order to select the model with the highest explained deviance and lowest AIC (Akaike Information Criterion) (Guisan and Zimmermann, 2000). Degrees of smoothness were limited to fit unimodal response curves, according to the ecological niche concept, and were restricted from 3 to 5 to avoid overfitting. All simulations were performed in R (R Core Team, 2014) using the mgcv package (Wood, 2011).
Step (2) A second GAM was built to model non-zero EP (thereafter, referred as the abundance model). The log-transformed EP was used as response variable with a Gaussian error distribution. Predictors and degree of smoothness were chosen identical to the one used in the Pres/Abs model.
Step (3) Pres/Abs and abundance models were then combined. The predicted EP of a particular point was conserved in the final model only if presence was predicted for this same location by the Pres/Abs model. In the case of a predicted absence, the EP was set to 0.
After model building, model validation has been undertaken (see Data Sheet S1).
Spawning Reconstruction Model (1992–2013)
Following the 3-step model building method detailed in the previous section, a GAM model was built to reconstruct the monthly spawning distribution between 1992 and 2013. Since shifts in egg production distribution is related to an expansion in the distribution in survey effort (Hughes et al., 2014), the objective of the reconstruction model was to avoid bias due to a shift in sampling effort (Chust et al., 2013). Therefore, year, month (as a factor), latitude and log-transformed bathymetry were used as predictors. Latitude was used as spatial term, and month and year were used to reconstruct the temporal pattern. Log-transformed bathymetry was integrated into the model as a descriptor of geographical attachment (Planque et al., 2011), since spawning activity ranges along the continental shelf edge. Geographical attachment may be the consequence of site fidelity or of the recurrence of favorable conditions at particular areas associated to large scale oceanographic features (Reglero et al., 2012).
Thermal Spawning-Niche Model (1992–2013)
Following the same 3-step model building method as detailed in the previous section, a GAM model was built to describe NEAM thermal spawning-niche and to analyse its distribution evolution between 1992 and 2013. The thermal spawning-niche is defined as the habitat where sea temperature is the most suitable for WSC and SSC mackerel spawning. EP was predicted according to averaged-200-m-water-column temperature and log-transformed bathymetry. Areas of high EP indicate the favorable location for mackerel spawning in terms of sea temperature. Log-transformed bathymetry was integrated in the model to maintain the thermal spawning-niche along the continental shelf edge where the spawning activity is known to be the highest. Thus, we assessed whether the thermal spawning-niche has shifted or not between 1992 and 2013 (see Section below).
We also estimated the trend of the integrated-200-m-water-column temperature by considering the averaged boundaries of the spawning area as well as the spawning period (January–July) as a working base. Only spatial points with EP >0.1 were considered. Then, it was possible to divide the spawning area into the western and southern component according to the boundaries agreed on in stock assessments (ICES, 2010). January-to-July-means of the integrated-200-m-water-column temperature were, therefore, computed for the spawning area for each January–July period. Subsequently, a linear model was fitted to estimate the trend.
Projecting Distribution Shifts under Climate Change Scenarios
In order to assess the potential response of NEAM spawning to future climate change, we have developed a niche-based model, using GAMs, which has been projected to future conditions. The niche-based model building followed the same 3-step methodology used in previous section. As predictors for the niche-spawning model, we selected monthly hydroclimatic and biogeochemical modeled data obtained from the DKRZ-CERA (the database of the German Climate Computing Center) under IPCC RCP4.5 and 8.5 scenarios for the period 2006–2100 (Giorgetta, 2012, Giorgetta et al., 2013). RCPs (Representative Concentration Pathways) are greenhouse gas concentration trajectories adopted by the IPCC (Intergovernmental Panel on Climate Change) for its fifth Assessment Report (AR5) in 2014. RCP4.5 corresponds to a medium emission-mitigation scenario (630 ppm CO2-eq. ppm by the year 2100), whilst RCP8.5 is the highest-carbon-emission scenario (936 CO2-eq. ppm by the year 2100) developed by the last IPCC report (Collins et al., 2013) among the four scenarios considered; both of them usually used as “business as usual” scenarios for the purposes of estimating the consequences of climate change. Projected SST, multi-water-layers temperature, SSS, multi-water-layers salinity, SSH, MLD, O2, and pH were extracted from the Max Planck Institute's Ocean Circulation Model (MPIOM) (Jungclaus et al., 2013) and simulated phytoplankton and zooplankton carbon concentration (thereafter, referred as phytoplankton and zooplankton, respectively) were extracted from the Hamburg Ocean Carbon Cycle (HAMOCC, a sub-model of the MPIOM) (Marsland et al., 2003; Ilyina et al., 2013). In particular, we used the CMIP5 (Coupled Model Intercomparison Project Phase 5) ensemble member r1i1p1 run over the mixed-resolution version (MR). Data are distributed aggregated on a tripolar grid of ~0.4°. Therefore, a bilinear interpolation was required to obtain a 0.5° × 0.5° resolution.
The niche-based model was built with the reference period at the early century (2006–2020); subsequently, the model was applied to mid-century (2040–2059) and end-of-the-century (2080–2099) periods, and compared with present state. To better understand the future environmental changes in the spawning area, we used linear regressions and a Wilcoxon test to estimate the trends and differences in averaged-200-m-water-column temperature, zooplankton and phytoplankton, under both climate scenarios.
Center of Gravity for Past and Future Distribution
Spawning distribution shift through time was analyzed using the gravity center (CoG), which it is defined as the weighted mean geographic location of a population (Woillez et al., 2009). A linear trend model was fitted to the annual values of CoG to evaluate the shift in the distribution of EP for each model (i.e., reconstruction, thermal habitat, and projections), sampling effort and raw EP observations, over the period. We also computed the annual latitude location of the percentile 5% (P5%) and 95% (P95%) of the EP. We analyzed the linear relation between the CoG displacement of the EP reconstructed model with that of the thermal habitat. If this relation is significant, hence, we estimated the shift rate in kilometer per degree Celsius of warming. Projected shifts in the CoG, P5 and P95% under RCP4.5 and 8.5 were analyzed in a similar way. We calculated those three indices for every period: present, mid-century, and end-of-the-century.
We also analyzed the expected overall EP and spawning area underRCP4.5 and 8.5. To estimate the overall EP, we summed the projected EP of the whole area of every month for the three periods: present, mid-century, and end-of-the-century. Those values were then transformed into percentage of increase or decrease compared with the present conditions. To analyse the evolution of the spawning area, we calculated for each spatial point the percentage of increase or decrease in EP for mid-century and end-of-the-century conditions compared with present conditions. Subsequently, we estimated the percentages of the studied area that will undergo an increase and a decrease in EP. The term “rear-edge areas” was used to define areas expected to become unsuitable for EP and the term “leading-edge areas” to define areas expected to become suitable for EP.
Results
Changes in Spawning between 1992 and 2013
In 2013, sampling effort CoG of NEAM occurred 609 km further north compared with its latitudinal position in 1992 (Figure 1A), with a trend of 289.8 ± 40.9 km/decade (Table 2). Sampling effort boundaries, represented by P5 and P95% had similarly shifted northward with the CoG. The CoG of the raw EP observations had shifted 84.6 ± 57.3 km/decade (Table 2).
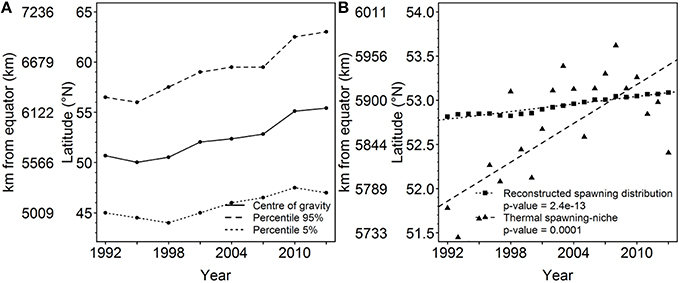
Figure 1. Latitudinal shift of the sampling effort, reconstructed spawning distribution, and thermal spawning-niche. (A) Shift in CoG, percentile 5 and 95 for the sampling effort of NEAM over the period 1992–2013, (B) Shift in CoG of the reconstructed NEAM spawning distribution and that of thermal spawning-niche model over the period 1992–2013.
Figure 2 shows the spawning distribution reconstructed using year, month, latitude, and log-transformed bathymetry. All these variables were significantly correlated with mackerel's egg distribution. AUC and model accuracy (0.70 and 71%, respectively) for the Pres/Abs model indicate moderate model reliability. The cross-validated R-squared value from the abundance model (19.7%) was similar to the deviance explained (16.6%), indicating no overfitting. Model set up is detailed in Table 1. CoG of the resulting spatiotemporal model showed that distribution of the mackerel spawning activity has shifted northward (Figure 1B). Combined southern and WSCs have shifted at a rate of 15.9 ± 0.9 km/decade over the modeled period while the western component taken as a single entity has shifted at 12.2 ± 1.1 km/decade (Table 2).
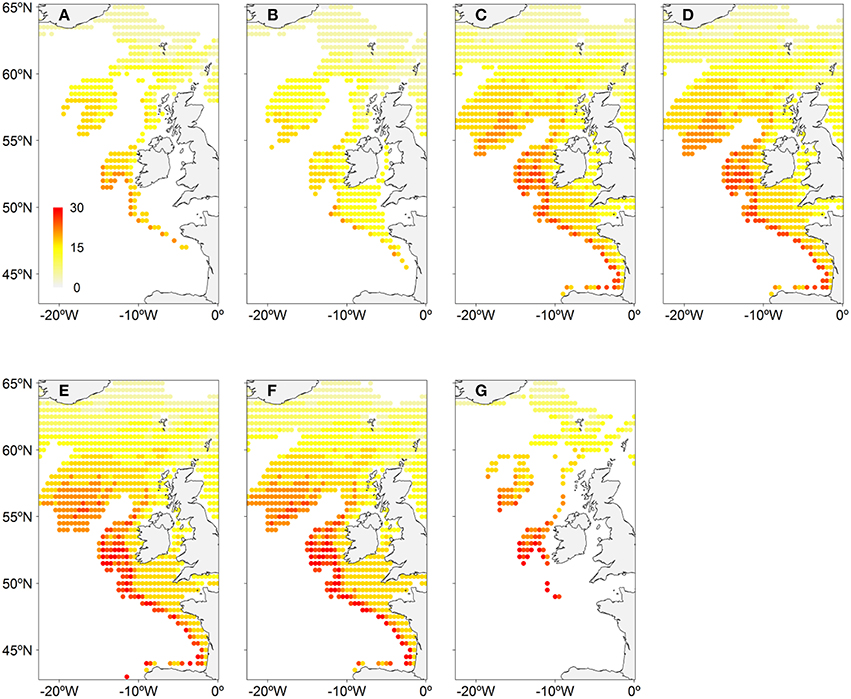
Figure 2. Monthly average reconstructed NEAM spawning distribution. (A) January, (B) February, (C) March, (D) April, (E) May, (F) June, (G) July.
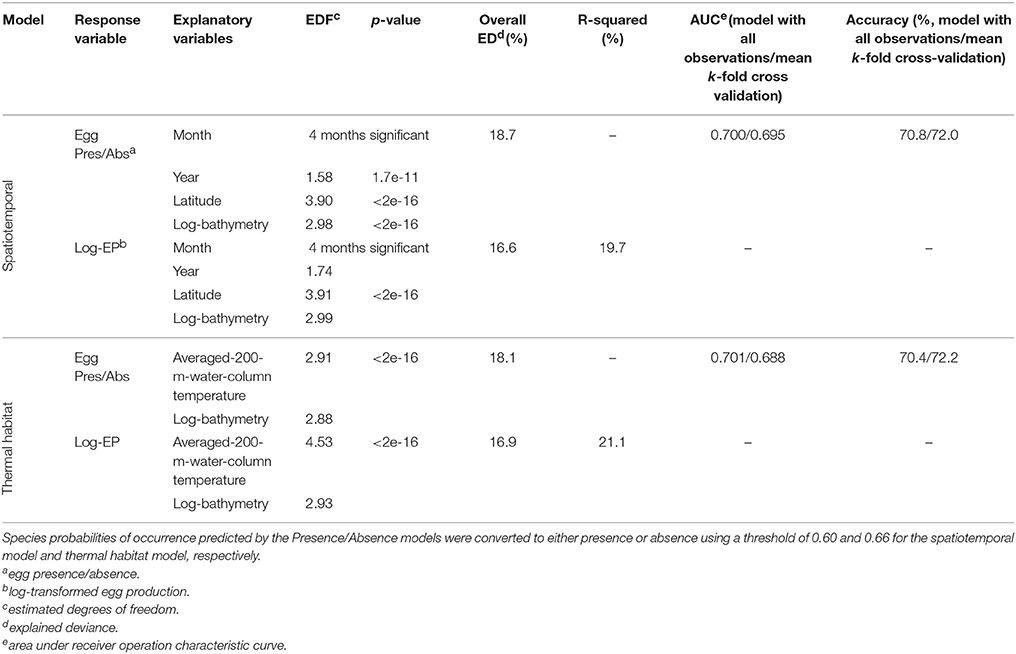
Table 1. Reconstruction GAMs for the EP western and southern component.
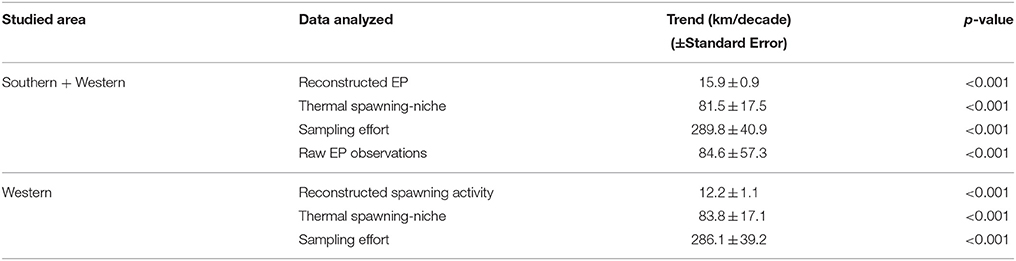
Table 2. Latitudinal CoG shift of sampling effort, spatiotemporal reconstruction, and thermal spawning-niche model of north-east Atlantic mackerel spawning activity between 1992 and 2013.
After analysing each predictor independently, we concluded that sea temperature is the second most influencing environmental variable after bathymetry for the NEAM spawning activity based on the explained deviance (Table 3). Integrated-200-m-water-column temperature proved to be more accurate than SST to predict the spawning activity (Table 3). The thermal habitat model was relatively accurate with AUC and model accuracy having the values of 0.70 and 70%, respectively (Table 1). The evaluation indicates no model overfitting. Results show a northward shift of the thermal spawning-niche of NEAM between 1992 and 2013 (Figure 1B). The thermal spawning-niche of the western and southern component had shifted at a rate of 81.5 ± 17.5 km/decade and a similar shift was found for the western component—taken as a single entity (Table 2). Both the reconstructed spawning distribution and the thermal spawning-niche had shifted northward between 1992 and 2013. The analysis of the sea temperature trends showed a warming of the integrated-200-m-water-column temperature of 0.219°C/decade for the whole spawning area (western and southern component, Figure 3) and of 0.230°C/decade for the western component over the period January–July 1992–2013 (p = 0.001, 0.0007, respectively). Regarding the southern component, the linear regression was not significant (p = 0.244). The peak spawning period (March-April) was found to have undergone a faster warming of 0.221°C/decade for both southern and western components, and of 0.233°C/decade for the western component taken individually (p = 0.0008, 0.0005, respectively). The linear regressions between the CoG shift in the reconstructed model and the yearly-mean temperature of the spawning area were statistically significant (r2 = 0.26, p = 0.005 for WSC, r2 = 0.29, p = 0.009 for WSC and SSC, see Figure S1); from this we inferred a shift in spawning activity CoG of 28.0 ± 9.0 km/°C of sea warming for the WSC and SSC and a shift of 20.6 ± 7.1 km/°C of sea warming for the WSC.
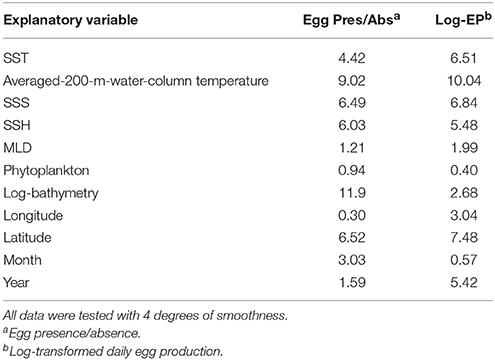
Table 3. Explained deviance (%) of mackerel egg occurrence and log-transformed daily egg production to each environmental variable taken individually.
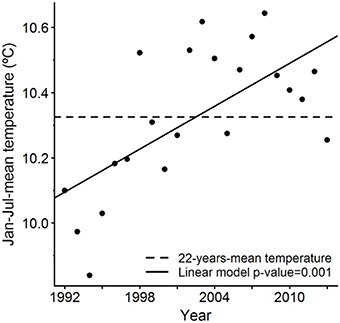
Figure 3. January-July-mean of integrated-200-m-water-column temperature for the spawning area between 1992 and 2013.
Projections of Spawning Activity under Climate Change Scenarios
The MPIOM model run under RCP8.5 (i.e., highest-carbon-emission scenario) forecasts an increase in the integrated-200-m-water-column temperature of the spawning area (for the spawning period January–July) of 0.086°C ± 0.189°C for mid-century (2040–2059) and of 0.315°C ± 0.294°C for the end-of-the-century (2080–2099) (Wilcoxon rank sum test, p = 0.039, p < 0.0001, respectively), with respect to present (2006–2020). Results for the RCP4.5 (medium emission-mitigation scenario) differ significantly from RCP8.5 with a projected decrease in the integrated-200-m-water-column temperature of the spawning area of −0.245°C ± 0.225°C for the end-of-the-century (Wilcoxon rank sum test, p < 0.0001). For the same scenario, no significant change in the integrated-200-m-water-column temperature of the spawning area is predicted for the mid-century (Wilcoxon rank sum test, p = 0.0543). For both scenarios, water temperature changes predicted in the spawning area are highly variable from one place to another (Figure 4). It is likely that the waters of the Bay of Biscay, forming the SSC, and the south part of the WSC, will warm over the 21st century. Inversely, the east part of the WSC will cool down. Overall, the two climate scenarios project a decrease in zoo- and phytoplankton concentration over the end-of-the-century. Under RCP4.5, phytoplankton and zooplankton are, respectively, projected to decrease at a rate of −8.4e-5 and −2.3e-5 mol.m−3.dec−1 (both p < 1e-4) over the course of the 21st century. Under RCP8.5, the decrease will be stronger with a rate of −1.672e-5 mol.m−3.dec−1 for phytoplankton and a rate of −4.1e-6 mol.m−3.dec−1 for zooplankton (both p < 1e-4).
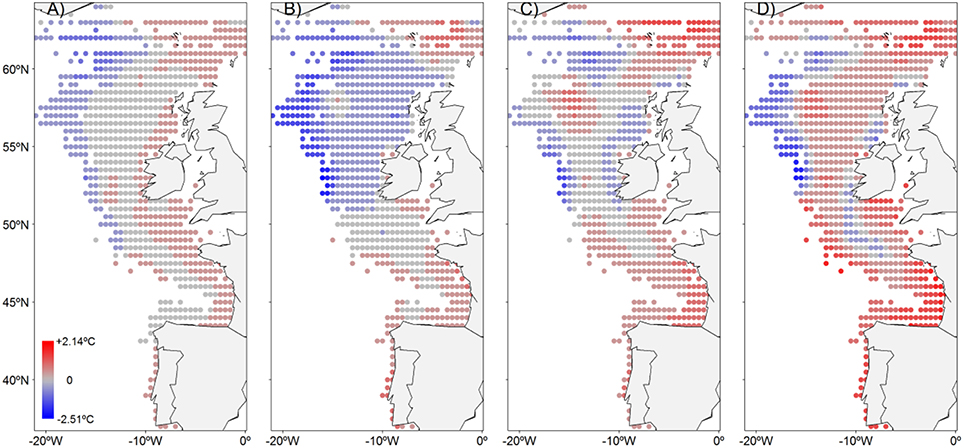
Figure 4. Averaged-200-m-water-column temperature anomalies for the NEAM spawning area between: (A) present (2006-2020) and mid-century (2040-2059) under RCP4.5, (B) present (2006-2020) and end-of-the-century (2080-2099) under RCP4.5, (C) present (2006-2020) and mid-century (2040-2059) under RCP8.5, and (D) present (2006-2020) and end-of-the-century (2080-2099) under RCP8.5.
We assessed future changes in mackerel's spawning distribution under IPCC RCP4.5 and 8.5 scenarios. Integrated-200-m-water-column temperature, zooplankton, phytoplankton, and log-transformed bathymetry were the variables selected in the final model (Table S1, Figures S2, S3), which explains, on average, 28 and 23% of the deviance for the Pres/Abs and abundance models, respectively. Salinity was not included due to its low contribution to the explained deviance of the model. No overfitting was detected. Models are detailed in Table S1, response curves in Figure S2 (Pres/Abs model) and Figure S3 (EP model), and the projected present EP is shown in Figure 5. As an additional measure to evaluate the reliability of this model, we assessed its correspondence with the spatio-temporal reconstructed model (Figure 2) using the correlation at monthly basis. The correlation (r2) was high in well sampled months corresponding also to high spawning activity months (0.65 in May, 0.53–0.58 in March–April, 0.47–0.52 in June–July) and low in only 2 months at the beginning of the spawning season (0.22–0.25 in January-February). This is probably because January and February were scarcely sampled.
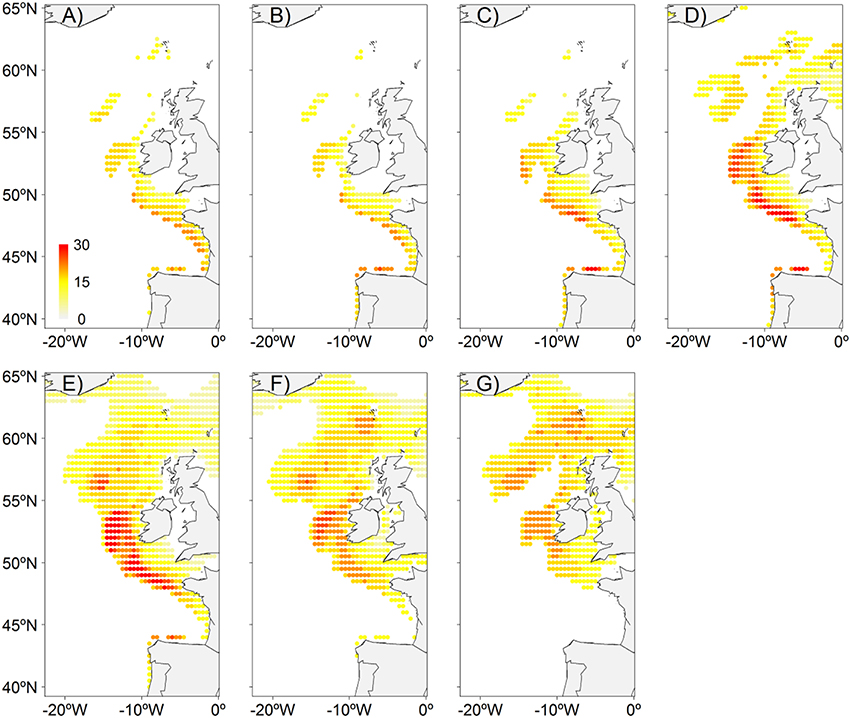
Figure 5. NEAM spawning niche model distribution in present (2006–2020) conditions under RCP4.5 scenario. (A) January, (B) February, (C) March, (D) April, (E) May, (F) June, (G) July.
The two scenarios projected are significantly different (Figure 6). The highest emission scenario (RCP8.5) projects a northward shift of the CoG of the spawning distribution of 175 km north for the middle of the century (2040–2059) and of 328 km for the end-of-the-century (2080–2099). A westward shift of 32 km for the middle of the century and of 117 km for the end-of-the-century is also forecasted. The medium emission-mitigation scenario (RCP4.5) leads to a less clear trend, with a northward shift of 24 km projected for mid-century and no shift predicted for the end-of-the-century. However, P5% and P95% confirm a shift of the NEAM spawning distribution range under RCP4.5. The spawning activity should decrease in the south and rise in the north. P5 and P95% are both expected to shift northward by 56 km to the end-of-the-century. EP should shift westward by 68 and 76 km at mid-century and end-of-the-century, respectively. The present spawning area is expected to undergo strong changes in terms of EP under both scenarios (Table 4). The EP is projected to decrease in the east part of the spawning area while it should rise in the north. Overall EP projections vary according to scenarios and time frames. Under RCP4.5, a decrease of 9.3% on overall EP is projected to the middle of the century while an increase of 12.0% is projected to the end-of-the-century under RCP4.5. Conversely, RCP8.5 projects an increase of 3.5% to the middle of the century and a decrease of 8.2% to the end-of-the-century.
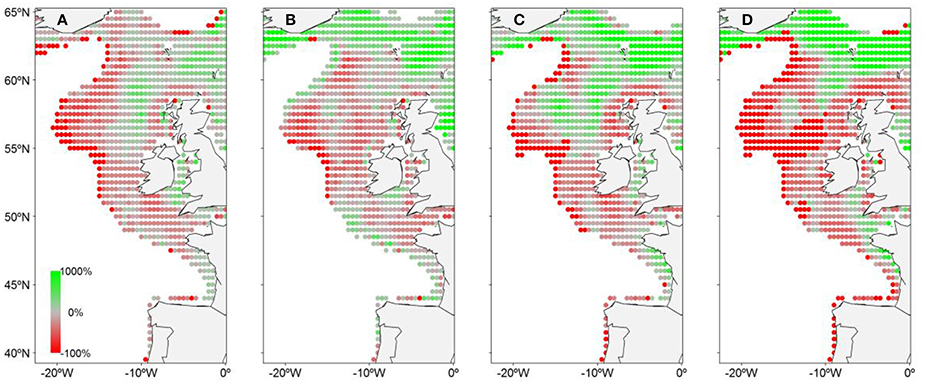
Figure 6. Change (%) in daily egg production under RCP4.5 and 8.5.Change between: (A) present and mid-century under RCP4.5, (B) present and end-of-the-century under RCP4.5, (C) present and mid-century under RCP8.5, and (D) present and end-of-the-century under RCP8.5.
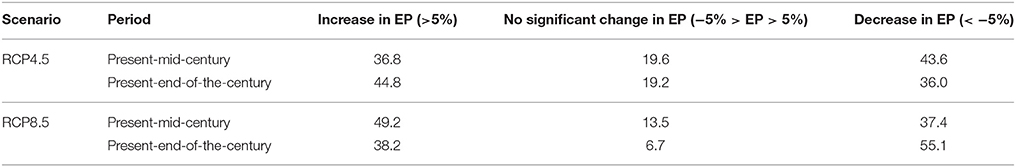
Table 4. Percentage of the spawning area that should undergo a change in daily egg production (EP) over the 21st century.
Discussion
Past Trends and Niche Tracking
Two GAM-based models, a spatiotemporal reconstruction, and a thermal niche model have been built to analyse the past trends of the NEAM spawning distribution. To confirm that NEAM has shifted northward in response to sea warming, we compared the shift of the reconstructed spawning activity CoG with the shift of the thermal spawning-niche CoG. This approach avoids bias due to the northward expansion of the sampling effort, which is estimated in 289.8 ± 40.9 km/decade. As a result of the sampling effort shift, the CoG of the raw EP observations shift rate (84.6 ± 57.3 km/decade) is overestimated, since it is higher than the reconstructed EP (15.9 ± 0.9 km/decade). This approach has been implemented for the first time for NEAM spawning. Moreover, we also included the SSC and the year 2013 in our analysis providing a more complete view of the NEAM spawning changes. The spatiotemporal reconstruction model CoG analysis confirms a northward shift of NEAM spawning distribution. The WSC and SSC have shifted 33 km northward between 1992 and 2013. NEAM thermal spawning-niche has shifted 180 km north in a similar manner. Those results suggest that NEAM has shifted its spawning distribution northward to track its thermal spawning-niche, which is supported by a statistically significant correlation between the CoG of the reconstructed spawning model and the yearly-mean temperature of the spawning area. We estimated that the warming of the spawning area induces a shift of 20.6 ± 7.1 km/°C of sea warming for the western component, taken individually. Our estimated rate of shift is slightly lower than the one calculated by Hughes et al. (2014) (i.e., 37.7 km/°C of warming). Differences in the timeframe and model parameters used could explain those differences. The larger shift rate of the thermal spawning habitat compared with the shift in spawning activity might be due to a time lag in the response to sea warming, to be affected by other factors such as prey abundance, or to certain adaptability to the new conditions through, for instance, phenological changes. Mackerel is able to spawn in a wide range of temperature (8–18°C) (Reid, 2001). However, the most suitable temperature for egg development seems to range from 12 to 13°C (Ibaibarriaga et al., 2007). Concerning the lack of northern shift of the southern component, the explanation should deserve more research since this component occupies a small area which is influenced by the Galician upwelling with colder waters compared to the SE corner of the Bay of Biscay which is at the same latitude.
Among other potential environmental variables in explaining poleward spawning distribution shift, we have analyzed phytoplankton (chlorophyll concentration), salinity, sea height, and MLD. The temporal trends of those variables in the spawning zone along period were not statistically significant for chlorophyll concentration (p = 0.281) and for SSS (p = 0.104), hence these two variables cannot explain the spawning distribution shift. The temporal trends of MLD decreased in the spawning zone along period (p = 0.0152), although it contributes < 2% to explain the deviance of spawning distribution (Table 3). Therefore, MLD cannot explain the spawning distribution shift. The temporal trend of SSH increased in the spawning zone along period (p = 0.0014), although it contributes less than sea temperature to explain the deviance of spawning distribution (Table 3, Figure 6 and 9%, respectively, for Pres/Abs model). Moreover, when the two variables are included in the Pres/Abs model, sea height adds only 1% in explaining the overall spawning distribution deviance, since the two variables are highly correlated (r2 = 0.72). This indicates that those four biotic and environmental variables are not potential candidates to explain poleward spawning distribution shift.
The significant thermal spawning habitat shift seems to conform with the strong increase in sea temperature detected between 1992 and 2013. Although the oceans have warmed since the middle of the twentieth century (Levitus et al., 2005), the warming is non-homogeneously distributed across space and time. The Atlantic has exhibited significant multidecadal variability in sea temperature due to changes in circulation patterns (Robson et al., 2012; Roberts et al., 2014). Palmer and Haines (2009) detected a significant warming for the North Atlantic Ocean. Specifically, the south-eastern Bay of Biscay, where high spawning intensity for mackerel occurs, has warmed significantly over the past three decades (deCastro et al., 2009; Goikoetxea et al., 2009; reviewed in Chust et al., 2011). Hughes et al. (2014) estimated that the WSC's SST, if it had remained in the 1977 distribution, would have warmed at a rate of 0.125°C/decade between 1977 and 2010. The higher rate of warming we estimated (0.219°C/decade for integrated-200-m-water-column) is due to the different period of time considered (1992–2013).
Future Projections
The climate scenarios analyzed here indicate that future spawning distribution changes will be more complex than a simple northward shift. A spatially heterogeneous warming over the spawning area is projected and the waters south of Greenland and Iceland are even expected to undergo a cooling specially under RCP4.5 due to the weakening of the Atlantic Meridional Overturning Circulation (AMOC) (Collins et al., 2013). All RCP scenarios predict a decrease in the strength of this important oceanic current over the course of the 21st century (Collins et al., 2013). Projections in sea temperature of the MPIOM model are in the average range compared with other earth system models used in the IPCC AR5 (Collins et al., 2013). If the emissions of greenhouse gases follow a high emissions scenario (i.e., RCP8.5), a strong northward shift in the spawning distribution is expected. Under the medium emission-mitigation scenario (RCP4.5), the spawning distribution CoG is not expected to shift; however, the distribution range boundaries will evolve, rising in the north, and decreasing in the south.
Eggs and larvae development requires specific physiological ranges; one of the most important seems to be a suitable water temperature. Based on the time series analysis and projections, we can conclude that NEAM is expected to continue tracking its thermal niche as the water temperature gradually warms up due to climate change. Those changes in the distribution might have severe impact on the recruitment since the leading-edge areas might not fit all the needs for egg and larvae development. For instance, winds and currents play an important role in the passive transport of larvae toward nursery grounds (Bartsch et al., 2004). Such favorable winds and currents might not prevail in leading-edge areas, triggering poor recruitment. Leading-edge areas are mainly located in the Norwegian and Greenland Sea, while rear-edge areas cover the Bay of Biscay, and the Portuguese and northern Spanish coasts. On the other hand, there is still high uncertainty on the future overall EP and recruitment, according to our projections.
As a migratory species, mackerel has a capacity to adapt quickly to environmental changes (Hughes et al., 2014), although its fidelity to the feeding and spawning areas may constrain its adaptation if climate changes significantly. A migratory fish species has three choices in their adaptation to ocean warming: (1) to shift their spatial distribution to maintain their thermal range (i.e., niche tracking); (2) to change their timing migration to arrive earlier when waters are cooler (i.e., phenology changes), or (3) to change their depth-distribution, i.e., migrating to deeper waters to search for cooler temperatures (Perry et al., 2005). It is possible that the adaptation strategy combine those three possibilities. However, the egg gravity is species-specific and the vertical distribution of mackerel eggs vary with hydrography and development stage (Sundby, 1983). Since water temperature and currents often vary with depth, the vertical position of the eggs can affect their rate of development, and rate and direction of drift (Kendall, 2001). Therefore, it is probably not possible for mackerel to spawn in deeper, cooler waters.
The state of the mackerel stock and its influence on NEAM distribution has not been investigated in the current analysis. However, recent studies underlined the hypothesis that an expansion of the stock could be a potential co-factor to explain the northward shift (Hughes et al., 2015). Phenotypic and genotypic adaptation can also play an important role in species adaptation. Although, there is growing evidence for rapid adaptive evolution in response to climate change (Lavergne et al., 2010), ecological niche-based models, such as the one used in this study, ignore the adaptive potential of species (Villarino et al., 2015). Ecological processes such as competition, positive interactions, and trophic relationship and ecological processes such as dispersal and population dynamics are other factors that were not included in our models and which can affect rates of species range shifts (Lavergne et al., 2010). For instance, the future distributions projected in our study assume the same interactions with competitors and predators as in the present, which presumably will change. Further research in the adaptive potential of NEAM is required to improve projections. Other uncertainties in our projections are due to the error propagation in the coupling of the hydroclimatic and biogeochemical model projections with our habitat model. In particular, high uncertainty still remains in the projections of the primary production (Chust et al., 2014) and zooplankton abundance (Villarino et al., 2015) in this area, which are key trophic levels for the Atlantic mackerel juveniles.
For climate change modeling, it is generally accepted that averaging of results from an ensemble of models produces a more reliable result (e.g., Pierce et al., 2009), although here only a single model was used. This implies the need for caution since our conclusions on mackerel spawning projections are subject to an unknown uncertainty associated to the use of a single global model. It is known for instance that MPIOM present significant biases in SST in North Atlantic compared to present (1980–2005) observed climatology, with lower temperatures in the central part and higher temperatures in the northern area (Jungclaus et al., 2013) which might affect the north-eastern boundaries of the NEAM spawning area projections. On the other hand, since the estimation of changes is based on the relative comparison between the future with respect to reference period, the effect of those biases on projected spawning change is probably attenuated.
Several European countries exploit the mackerel stock during the spawning season. EP is based on stage 1 eggs, and as mackerel eggs spend only 1–2 days in stage 1, it is a suitable proxy for the location of spawning adults (Hughes et al., 2014). Projecting future spawning distribution aims to provide adaptation criteria for local fisheries within a sustainable fisheries management framework. As mentioned previously, the future change of EP and recruitment over this century is uncertain. It is likely that future changes in NEAM distribution will lead to new fishing opportunities in the Norwegian and Greenland Sea. Contrastingly, mackerel abundance will decrease in areas subject to strong warming such as the in Bay of Biscay, and the fishing period might shift earlier. Caution should therefore be taken in stock management in the Bay of Biscay where the NEAM population is identified as vulnerable to climate change.
From an evolutionary point of view, the selection of periods and grounds for spawning might be considered as a specific evolutionary adaptation of the species to encourage their reproductive success. It is known that the most vulnerable phases throughout fish life cycle are eggs and larval stages, when their survival rates are strongly dependent on external factors. According to Hjort's hypothesis (Hjort, 1926), failures during the first-feeding larval stage or “aberrant drift” of eggs and larvae can produce higher mortality and it plays an important role in determining fish cohort strength. Continuous failures in recruitment tend to causes a dramatic reduction in fish populations, with resulting negative consequences for fishery industry.
In summary, this study showed that both the spawning activity distribution and the thermal spawning-niche of NEAM have shifted northward between 1992 and 2013. This suggests that NEAM has tracked its thermal spawning-niche in response to sea warming, although the warming is certainly not the only cause of this shift. Other potential drivers such as stock size and density-dependent processes deserve to be investigated. Ocean warming is expected to continue affecting NEAM spawning activity over the 21st century, with displacements toward the northwest and differences in amplitude according to emission scenario and timeframe. Consequences for the survival of early life stages could certainly be detrimental when aberrant drift occurs in combination with these changes. Our projections aim to allow the fishing industry to anticipate the future distribution of mackerel shoals during the spawning period. Therefore, this study has implications in terms of future international management of the stock, for fisheries adaptation, and for the planning of future ICES egg surveys. Future research should focus on other potential drivers, on phenology response, on the adaptive potential of NEAM to climate change, and reducing uncertainty from future projections by considering different climate change models.
Author Contributions
AB conducted the statistical analysis. PA provided biological data. AF provided past climate data. GC conceived and designed the research. AB, GC, and UC wrote the main manuscript text. All authors reviewed the manuscript.
Conflict of Interest Statement
The authors declare that the research was conducted in the absence of any commercial or financial relationships that could be construed as a potential conflict of interest.
Acknowledgments
This research was funded by the Basque Government (Department Deputy of Agriculture, Fishing, and Food Policy). Various European Union Funds have been instrumental in promoting the mackerel and horse mackerel egg surveys necessary for the collection of these data. AB has benefited from an Erasmus scholarship. Thanks is due to the ICES Working Group of Mackerel and Horse Mackerel Egg Survey (WGMEGS) for providing the egg data and especially to Finlay Burns (from Marine Scotland Science) for his effort in the standardization of the egg database. We are grateful to Hannes Thienman, Peter Lenzen, and Johann Jungclaus from the CERA-DKRZ for their valuable support on CMIP5 data. GODAS data provided by the NOAA/OAR/ESRL PSD, Boulder, Colorado, USA, from their Web site at http://www.esrl.noaa.gov/psd/. Thanks to Ernesto Villarino and Leire Ibaibarriaga for providing advice in R. This is contribution 767 from AZTI Marine Research Division.
Supplementary Material
The Supplementary Material for this article can be found online at: http://journal.frontiersin.org/article/10.3389/fmars.2016.00086
Figure S1. Linear regression between the CoG shift in the reconstructed model and the yearly-mean sea temperature of the spawning area for WSC and SSC (r2 = 0.29, p = 0.009).
Figure S2. NEAM response curves for the Pres/Abs model used for future projections.
Figure S3. NEAM response curves for the EP model used for future projections.
Data Sheet S1. Model validation.
Table S1. GAMs used for extrapolation under RCP4.5 and 8.5. Species probabilities of occurrence predicted by the presence/absence model were converted to either presence or absence using a mean-threshold of 0.69.
References
Abaunza, P., Villamor, B., and Pérez, J. (1995). Infestation by larvae of Anisakis simplex (Nematoda: Ascaridata) in horse mackerel, Trachurus trachurus, and Atlantic mackerel, Scomberscombrus, in ICES Divisions VIIIb, VIIIc and IXa (N-NW of Spain). Sci. Mar. 59, 223–233.
Augustin, N., Borchers, D., Clarke, E., Buckland, S., and Walsh, M. (1998). Spatiotemporal modelling for the annual egg production method of stock assessment using generalized additive models. Can. J. Fish. Aquat. Sci. 55, 2608–2621. doi: 10.1139/f98-143
Bartsch, J., Reid, D., and Coombs, S. (2004). Simulation of mackerel (Scomber scombrus) recruitment with an individual-based model and comparison with field data. Fish. Oceanogr. 13, 380–391. doi: 10.1111/j.1365-2419.2004.00306.x
Beare, D., and Reid, D. (2002). Investigating spatio-temporal change in spawning activity by Atlantic mackerel between 1977 and 1998 using Generalized Additive Models. ICES J. Mar. Sci. J. Cons. 59, 711–724. doi: 10.1006/jmsc.2002.1207
Beaugrand, G., Brander, K. M., Lindley, J. A., Souissi, S., and Reid, P. C. (2003). Plankton effect on cod recruitment in the North Sea. Nature 426, 661–664. doi: 10.1038/nature02164
Beaugrand, G., Reid, P. C., Ibanez, F., Lindley, J. A., and Edwards, M. (2002). Reorganization of North Atlantic marine copepod biodiversity and climate. Science 296, 1692–1694. doi: 10.1126/science.1071329
Behringer, D. W., Ji, M., and Leetmaa, A. (1998). An improved coupled model for ENSO prediction and implications for ocean initialization. Part I: the ocean data assimilation system. Mon. Weather Rev. 126, 1013–1021.
Berge, J., Heggland, K., Lønne, O. J., Cottier, F., Hop, H., Gabrielsen, G. W., et al. (2015). First records of Atlantic mackerel (Scomber scombrus) from the Svalbard Archipelago, Norway, with possible explanations for the extension of its distribution. Arctic 68, 54–61. doi: 10.14430/arctic4455
Borchers, D., Buckland, S., Priede, I., and Ahmadi, S. (1997). Improving the precision of the daily egg production method using generalized additive models. Can. J. Fish. Aquat. Sci. 54, 2727–2742. doi: 10.1139/f97-134
Brander, K. (2010). Impacts of climate change on fisheries. J. Mar. Syst. 79, 389–402. doi: 10.1016/j.jmarsys.2008.12.015
Cheung, W. W. L., Watson, R., and Pauly, D. (2013). Signature of ocean warming in global fisheries catch. Nature 497, 365–368. doi: 10.1038/nature12156
Chust, G., Borja, A., Caballero, Á., Irigoien, X., Sáenz, J., Moncho, R., et al. (2011). Climate change impacts on coastal and pelagic environments in the southeastern Bay of Biscay. Climate Res. 48, 307–332. doi: 10.3354/cr00914
Chust, G., Allen, J., Bopp, L., Schrum, C., Holt, J., Tsiaras, K., et al. (2014). Biomass changes and trophic amplification of plankton in a warmer ocean. Glob. Chang. Biol. 20, 2124–2139. doi: 10.1111/gcb.12562
Chust, G., Castellani, C., Licandro, P., Ibaibarriaga, L., Sagarminaga, Y., and Irigoien, X. (2013). Are Calanus spp. shifting poleward in the North Atlantic? A habitat modelling approach. ICES J. Mar. Sci. 71, 241–253. doi: 10.1093/icesjms/fst147
Collins, M., Knutti, R., Arblaster, J., Dufresne, J.-L., Fichefet, T., Friedlingstein, P., et al. (2013). “Long-term climate change: projections, commitments and irreversibility,” in Climate Change 2013: The Physical Science Basis, Working Group I Contribution to the IPCC Fifth Assessment Report (AR5), eds T. F. Stocker, D. Qin, G.-K. Plattner, M. Tignor, S. K. Allen, J. Doschung, A. Nauels, Y. Xia, V. Bex, and P. M. Midgley (Cambridge: Cambridge University Press), 1029–1136.
Coombs, S., Morgans, D., and Halliday, N. (2001). Seasonal and ontogenetic changes in the vertical distribution of eggs and larvae of mackerel (Scomber scombrus L.) and horse mackerel (Trachurus trachurus L.). Fish. Res. 50, 27–40. doi: 10.1016/S0165-7836(00)00240-X
deCastro, M., Gómez-Gesteira, M., Alvarez, I., and Gesteira, J. L. G. (2009). “Present warming within the context of cooling-warming cycles observed since 1854 in the Bay of Biscay,” in Continental Shelf Research (100 Years of Research within the Bay of Biscay - XI International Symposium on Oceanography of the Bay of Biscay), Vol. 29, 1053–1059.
Derber, J., and Rosati, A. (1989). A global oceanic data assimilation system. J. Phys. Oceanogr. 19, 1333–1347.
Edwards, M., and Richardson, A. J. (2004). Impact of climate change on marine pelagic phenology and trophic mismatch. Nature 430, 881–884. doi: 10.1038/nature02808
Gamito, R., Teixeira, C. M., Costa, M. J., and Cabral, H. N. (2015). Are regional fisheries' catches changing with climate? Fish. Res. 161, 207–216. doi: 10.1016/j.fishres.2014.07.014
Giorgetta, M. (2012). CMIP5 Simulations of the Max Planck Institute for Meteorology (MPI-M) Based on the MPI-ESM-LR Model: The rcp85 Experiment, Served by ESGF. Hamburg: World Data Center for Climate at DKRZ.
Giorgetta, M. A., Jungclaus, J., Reick, C. H., Legutke, S., Bader, J., Böttinger, M., et al. (2013). Climate and carbon cycle changes from 1850 to 2100 in MPI-ESM simulations for the Coupled Model Intercomparison Project phase 5. J. Adv. Model. Earth Syst. 5, 572–597. doi: 10.1002/jame.20038
Goikoetxea, N., Borja, Á., Fontán, A., González, M., and Valencia, V. (2009). Trends and anomalies in sea-surface temperature, observed over the last 60 years, within the southeastern Bay of Biscay. Cont. Shelf Res. 29, 1060–1069. doi: 10.1016/j.csr.2008.11.014
Guisan, A., and Zimmermann, N. E. (2000). Predictive habitat distribution models in ecology. Ecol. Model. 135, 147–186. doi: 10.1016/S0304-3800(00)00354-9
Hastie, T., and Tibshirani, R. (1990). Generalized Additive Models, Volume 43 of Monographs on Statistics and Applied Probability. London: Chapman & Hall.
Heath, M. R., Neat, F. C., Pinnegar, J. K., Reid, D. G., Sims, D. W., and Wright, P. J. (2012). Review of climate change impacts on marine fish and shellfish around the UK and Ireland. Aquat. Cons. Mar. Freshw. Ecosyst. 22, 337–367. doi: 10.1002/aqc.2244
Hjort, J. (1926). Fluctuations in the year classes of important food fishes. J. Cons. 1, 5–38. doi: 10.1093/icesjms/1.1.5
Hughes, K., Dransfeld, L., and Johnson, M. (2015). Climate and stock influences on the spread and locations of catches in the northeast Atlantic mackerel fishery. Fish. Oceanogr. 24, 540–552. doi: 10.1111/fog.12128
Hughes, K. M., Dransfeld, L., and Johnson, M. P. (2014). Changes in the spatial distribution of spawning activity by north-east Atlantic mackerel in warming seas: 1977–2010. Mar. Biol. 161, 2563–2576. doi: 10.1007/s00227-014-2528-1
Hutchinson, G. (1957). Concluding Remarks: Cold Spring Harbor Symposia on Quantitative Biology. New Haven, CT: Yale University.
Ibaibarriaga, L., Irigoien, X., Santos, M., Motos, L., Fives, J., Franco, C., et al. (2007). Egg and larval distributions of seven fish species in north-east Atlantic waters. Fish. Oceanogr. 16, 284–293. doi: 10.1111/j.1365-2419.2007.00430.x
ICES (1996). Report of the Working Group on the Assessment of Mackerel, Horse Mackerel, Sardine and Anchovy. ICES CM 1996/Assess 7, 340.
ICES (2010). Report of the Working Group on Mackerel and Horse Mackerel Egg Surveys (WGMEGS). ICES Document ICESCM 2010/SSGESST:02, 59.
ICES (2012). Report of the Working Group on Mackerel and Horse Mackerel Egg Sur-veys (WGMEGS). Galway, Ireland. ICES CM 2012/SSGESST:04, 135.
ICES (2013a). Report of Ad Hoc Group on the Distribution and Migration of Northeast Atlantic Mackerel (AGDMM). ICES Document ICES, CM 2013/ACOM:58, 211.
ICES (2013b). Report of the Working Group on Mackerel and Horse Mackerel Egg Surveys (WGMEGS). ICES Document ICES CM 2013/SSGESST:04, 144.
ICES (2015). Report of the Working Group on Widely Distributed stocks (WGWIDE). ICES CM 2015/ACOM:15, 562.
Ilyina, T., Six, K. D., Segschneider, J., Maier-Reimer, E., Li, H., and Núñez-Riboni, I. (2013). Global ocean biogeochemistry model HAMOCC: Model architecture and performance as component of the MPI-Earth system model in different CMIP5 experimental realizations. J. Adv. Model. Earth Syst. 5, 287–315. doi: 10.1029/2012MS000178
Jamieson, A., and Smith, P. J. (1987). Atlantic mackerel (Scomber scombrus L.) stocks and genes: a review. J. Cons. ICES J. Mar. Sci. 44, 66–72. doi: 10.1093/icesjms/44.1.66
Jansen, T., Campbell, A., Brunel, T., and Worsøe Clausen, L. (2013). Spatial segregation within the spawning migration of North Eastern Atlantic Mackerel (Scomber scombrus) as indicated by juvenile growth patterns. PLoS ONE 8:e58114. doi: 10.1371/journal.pone.0058114
Jansen, T., and Gislason, H. (2013). Population structure of Atlantic mackerel (Scomber scombrus). PLoS ONE 8:e64744. doi: 10.1371/journal.pone.0064744
Ji, M., Leetmaa, A., and Derber, J. (1995). An ocean analysis system for seasonal to interannual climate studies. Mon. Weather Rev. 123, 460–481.
Jungclaus, J., Fischer, N., Haak, H., Lohmann, K., Marotzke, J., Matei, D., et al. (2013). Characteristics of the ocean simulations in the Max Planck Institute Ocean Model (MPIOM) the ocean component of the MPI-Earth system model. J. Adv. Model. Earth Syst. 5, 422–446. doi: 10.1002/jame.20023
Kendall, A. W. (2001). Specific Gravity and Vertical Distribution of Walleye Pollock (Theragra chalcogramma) Eggs. National Oceanic and Atmospheric Administration, National Marine Fisheries Service, Alaska Fisheries Science Center.
Lavergne, S., Mouquet, N., Thuiller, W., and Ronce, O. (2010). Biodiversity and climate change: integrating evolutionary and ecological responses of species and communities. Annu. Rev. Ecol. Evol. Syst. 41, 321–350. doi: 10.1146/annurev-ecolsys-102209-144628
Levitus, S., Antonov, J., and Boyer, T. (2005). Warming of the world ocean, 1955–2003. Geophys. Res. Lett. 32:L02604. doi: 10.1029/2004GL021592
MacKenzie, K. (1990). Cestode parasites as biological tags for mackerel (Scomber scombrus L.) in the Northeast Atlantic. J. Cons. ICES J. Mar. Sci. 46, 155–166. doi: 10.1093/icesjms/46.2.155
Marsland, S. J., Haak, H., Jungclaus, J. H., Latif, M., and Röske, F. (2003). The Max-Planck-Institute global ocean/sea ice model with orthogonal curvilinear coordinates. Ocean Model. 5, 91–127. doi: 10.1016/S1463-5003(02)00015-X
Monahan, W. B., and Tingley, M. W. (2012). Niche tracking and rapid establishment of distributional equilibrium in the house sparrow show potential responsiveness of species to climate change. PLoS ONE 7:e42097. doi: 10.1371/journal.pone.0042097
Montero-Serra, I., Edwards, M., and Genner, M. J. (2015). Warming shelf seas drive the subtropicalization of European pelagic fish communities. Glob. Chang. Biol. 21, 144–153. doi: 10.1111/gcb.12747
Munday, P. L., Warner, R. R., Monro, K., Pandolfi, J. M., and Marshall, D. J. (2013). Predicting evolutionary responses to climate change in the sea. Ecol. Lett. 16, 1488–1500. doi: 10.1111/ele.12185
Nesbö, C. L., Rueness, E. K., Iversen, S. A., Skagen, D. W., and Jakobsen, K. S. (2000). Phylogeography and population history of Atlantic mackerel (Scomber scombrus L.): a genealogical approach reveals genetic structuring among the eastern Atlantic stocks. Proc. R. Soc. Lond. B Biol. Sci. 267, 281–292. doi: 10.1098/rspb.2000.0998
Nishida, T. (2011). Validation of the Global Ocean Data Assimilation System (GODAS) Data in the NOAA National Centre for Environmental System (NCEP) by theory, Comparative Studies, Applications and Sea Truth. Shizuoka. IOTC-2011-WPB09-11.
Palmer, M. D., and Haines, K. (2009). Estimating oceanic heat content change using isotherms. J. Clim. 22, 4953–4969. doi: 10.1175/2009JCLI2823.1
Pante, E., and Simon-Bouhet, B. (2013). marmap: a package for importing, plotting and analyzing bathymetric and topographic data in R. PLoS ONE 8:e73051. doi: 10.1371/journal.pone.0073051
Pecl, G. T., Ward, T. M., Doubleday, Z. A., Clarke, S., Day, J., Dixon, C., et al. (2014). Rapid assessment of fisheries species sensitivity to climate change. Clim. Change 127, 505–520. doi: 10.1007/s10584-014-1284-z
Perry, A. L., Low, P. J., Ellis, J. R., and Reynolds, J. D. (2005). Climate change and distribution shifts in marine fishes. Science 308, 1912–1915. doi: 10.1126/science.1111322
Pierce, D. W., Barnett, T. P., Santer, B. D., and Gleckler, P. J. (2009). Selecting global climate models for regional climate change studies. Proc. Natl. Acad. Sci. U.S.A. 106, 8441–8446. doi: 10.1073/pnas.0900094106
Planque, B., Loots, C., Petitgas, P., Lindstrom, U., and Vaz, S. (2011). Understanding what controls the spatial distribution of fish populations using a multi-model approach. Fish. Oceanogr. 20, 1–17. doi: 10.1111/j.1365-2419.2010.00546.x
Punzón, A., and Villamor, B. (2009). Does the timing of the spawning migration change for the southern component of the Northeast Atlantic Mackerel (Scomber scombrus, L. 1758)? An approximation using fishery analyses. Cont. Shelf Res. 29, 1195–1204. doi: 10.1016/j.csr.2008.12.024
R Core Team (2014). R: A Language and Environment for Statistical Computing. Vienna: R Foundation for Statistical Computing.
Reglero, P., Ciannelli, L., Alvarez-Berastegui, D., Balbín, R., López-Jurado, J. L., and Alemany, F. (2012). Geographically and environmentally driven spawning distributions of tuna species in the western Mediterranean Sea. Mar. Ecol. Prog. Ser. 463, 273–284. doi: 10.3354/meps09800
Reid, D. (2001). SEFOS—shelf edge fisheries and oceanography studies: an overview. Fish. Res. 50, 1–15. doi: 10.1016/S0165-7836(00)00238-1
Reid, D. G., Turrell, W. R., Walsh, M., and Corten, A. (1997). Cross-shelf processes north of Scotland in relation to the southerly migration of Western mackerel. ICES J. Mar. Sci. 54, 168–178. doi: 10.1006/jmsc.1996.0202
Roberts, C., Jackson, L., and McNeall, D. (2014). Is the 2004–2012 reduction of the Atlantic meridional overturning circulation significant? Geophys. Res. Lett. 41, 3204–3210. doi: 10.1002/2014GL059473
Robson, J., Sutton, R., Lohmann, K., Smith, D., and Palmer, M. D. (2012). Causes of the rapid warming of the North Atlantic Ocean in the mid-1990s. J. Clim. 25, 4116–4134. doi: 10.1175/JCLI-D-11-00443.1
Saha, S., Nadiga, S., Thiaw, C., Wang, J., Wang, W., Zhang, Q., et al. (2006). The NCEP Climate Forecast System. J. Clim. 19, 3483–3517. doi: 10.1175/JCLI3812.1
Sundby, S. (1983). A one-dimensional model for the vertical distribution of pelagic fish eggs in the mixed layer. Deep Sea Research Part A. Oceanogr. Res. Papers 30, 645–661. doi: 10.1016/0198-0149(83)90042-0
Uriarte, A., and Lucio, P. (2001). Migration of adult mackerel along the Atlantic European shelf edge from a tagging experiment in the south of the Bay of Biscay in 1994. Fish. Res. 50, 129–139. doi: 10.1016/S0165-7836(00)00246-0
Villamor, B., Abaunza, P., Lucio, P., and Porteiro, C. (1997). Distribution and age structure of mackerel (Scomber scombrus, L.) and horse mackerel (Trachurus trachurus, L.) in the northern coast of Spain, 1989-1994. Sci. Mar. 61, 345–366.
Villarino, E., Chust, G., Licandro, P., Butenschön, M., Ibaibarriaga, L., Kreus, M., et al. (2015). Modelling the future biogeography of North Atlantic zooplankton communities in response to climate change. Mar. Ecol. Prog. Ser. 531, 121–142. doi: 10.3354/meps11299
Woillez, M., Rivoirard, J., and Petitgas, P. (2009). Notes on survey-based spatial indicators for monitoring fish populations. Aquat. Living Resour. 22, 155–164. doi: 10.1051/alr/2009017
Keywords: Scomber scombrus, spawning activity, habitat model, GAMs, climate change, niche tracking
Citation: Bruge A, Alvarez P, Fontán A, Cotano U and Chust G (2016) Thermal Niche Tracking and Future Distribution of Atlantic Mackerel Spawning in Response to Ocean Warming. Front. Mar. Sci. 3:86. doi: 10.3389/fmars.2016.00086
Received: 29 February 2016; Accepted: 18 May 2016;
Published: 01 June 2016.
Edited by:
Susana Agusti, King Abdullah University of Science and Technology, Saudi ArabiaReviewed by:
Diego M. Macias, European Commission. Joint Research Center, ItalyE. Christien Michael Parsons, George Mason University, USA
Copyright © 2016 Bruge, Alvarez, Fontán, Cotano and Chust. This is an open-access article distributed under the terms of the Creative Commons Attribution License (CC BY). The use, distribution or reproduction in other forums is permitted, provided the original author(s) or licensor are credited and that the original publication in this journal is cited, in accordance with accepted academic practice. No use, distribution or reproduction is permitted which does not comply with these terms.
*Correspondence: Guillem Chust, Z2NodXN0QGF6dGkuZXM=