 Laura Hoikkala1,2†
 Helen Tammert3,4†Risto Lignell1Eeva Eronen-Rasimus1
 Kristian Spilling1
 Veljo Kisand3*
- 1Marine Research Centre, Finnish Environment Institute, Helsinki, Finland
- 2Tvärminne Zoological Station, University of Helsinki, Hanko, Finland
- 3Institute of Technology, University of Tartu, Tartu, Estonia
- 4Department of Biology, University of Bergen, Bergen, Norway
The dynamics of dissolved organic matter (DOM) and the succession of bacterial community composition (BCC) were investigated during bloom of filamentous cyanobacteria in a mesocosm experiment conducted in the western Gulf of Finland, the Baltic Sea. The effects of labile dissolved organic carbon (glucose), inorganic nutrients (N and P) and large zooplankton (> 100 μm) on the DOM pool, bacterial production and the composition of bacterial communities were analyzed over a period of 10 days. In addition, the bioavailability of dissolved organic carbon (DOC) and its turnover by heterotrophic bacteria (biomass and respiration) were investigated in three 1-week bacterial bioassays. Heterotrophic bacteria rapidly utilized about 25–55% of the DOC released from the plankton community, thus assuming it to be highly labile DOC. More than half of the accumulating net DOC pool was degraded over 7 days, thus assuming it to be labile. In average, labile autochthonous DOC was degraded with bacterial growth efficiency of 25%. A distinct succession of bacterial communities accompanied the supply of autochthonous DOM, with the most prominent responses occurring in a few single phylotypes of the Delta- and Gammaproteobacterial classes. About 40% of the variation in the relative shares of dominant bacterial classes could be explained by changes in the functional groups of autotrophs. Inorganic nutrient treatment proved beneficial to Deltaproteobacteria and increased bacterial production over that of other mesocosms.
Introduction
In surface waters, heterotrophic bacteria, which can process about 50% of primary production within short time frames (weeks), are the main degraders of the DOM (Ducklow and Carlson, 1992). The biological degradability of DOM molecules forms a continuum from highly labile DOM (HLDOM) that can be utilized within hours or days, resulting in nanomolar ambient concentrations, to refractory compounds that can resist bacterial degradation for millennia (Williams and Druffel, 1987; Keil and Kirchman, 1999). Biologically available DOM pools are often divided into labile DOM (e.g., Søndergaard et al., 2000; Hoikkala et al., 2012) that causes short-term (hours–days–weeks) variability in the DOM concentrations and semilabile DOM (degraded within months) that controls the seasonal variability of the DOM concentrations (e.g., Williams, 2000; Lønborg and Søndergaard, 2009). The semilabile DOM accumulates in the surface waters during the productive season (e.g., Copin-Montégut and Avril, 1993; Carlson et al., 1994; Kulinski et al., 2011; Hoikkala et al., 2012) and can support the production of specialist bacteria during the non-productive season such as winter (Kisand et al., 2005).
Carbon cycling is modulated largely by the bacterial assimilation of DOC, and the transfer efficiency of C via microbial loop to higher trophic levels. The transfer efficiency of assimilated C is affected by the bacterial growth efficiency (BGE; i.e., the ratio of bacterial C biomass produced to the DOC assimilated). The production of bacterial biomass can fuel higher trophic levels via grazing by heterotrophic nanoflagellates or become recycled by viral lysis. The rest of the C assimilated is lost as CO2 in bacterial respiration. BGE varies with the productivity of aquatic systems and ranges from 1% in oligotrophic systems to over 50% in most eutrophic ones (del Giorgio and Cole, 1998). BGE is largely regulated by temperature and the quality of the DOM (del Giorgio and Cole, 1998; Apple and Del Giorgio, 2007). The ratio can vary several-fold within a system. For example, the BGE values of bacterial communities in the Gulf of Riga, the Baltic Sea, ranged from 5 to 60% between seasons (e.g., Donali et al., 1999). How organic C, produced by primary production, partitions into pools of bacterial biomass, CO2 and DOC, has important biogeochemical consequences, affecting food chain efficiency and oxygen consumption and, thus, the CO2 and O2 balance of the photic zone in aquatic systems.
The utilization of DOM compounds varies between major bacterial phylogenetic groups (e.g., Cottrell and Kirchman, 2000; Elifantz et al., 2005; Alonso-Sáez and Gasol, 2007; Teira et al., 2010; Gómez-Consarnau et al., 2012; Teeling et al., 2012). For example, certain Gammaproteobacteria and the Roseobacter of Alphaproteobacteria can react rapidly to an increase in easily assimilated low-molecular-weight substrates (e.g., Eilers et al., 2000; Alonso-Sáez and Gasol, 2007; Teira et al., 2010; Teeling et al., 2012), whereas the common SAR11 clade of Alphaproteobacteria can grow on highly diluted substrate concentrations (Giovannoni et al., 2005). The vast range of different DOM molecules in marine environments supports the growth of highly diverse bacterial communities (Sarmento and Gasol, 2012). The responses of bacterial groups to specific DOM compounds vary across locations and seasons (Alonso-Sáez and Gasol, 2007; Teira et al., 2010), suggesting that environmental conditions, such as the availability of inorganic nutrients, may modify them (Teira et al., 2010). Bacteria range from specialists restricted to growth on specific substrates to generalists utilizing a wide variety of substrates (Gómez-Consarnau et al., 2012).
Cosmopolitan, abundant bacteria with streamlined genomes can probably grow only slowly, whereas many, rarely abundant opportunistic taxa are potentially capable of rapid growth under energy-rich conditions (Yooseph et al., 2010). Phytoplankton blooms provide bacteria with a relatively rapid change in the quality and quantity of substrates and, consequently, may induce rapid changes in the composition of the bacterial plankton community (e.g., Riemann et al., 2000; Pinhassi et al., 2004; Teeling et al., 2012; Buchan et al., 2014). Phytoplankton blooms have been shown to support the growth of limited numbers of bacterial lineages, mainly members of the Rhodobacteraceae family of class Alphaproteobacteria (including Roseobacter clade), Gammaproteobacteria and Flavobacteriia (Riemann et al., 2000; Pinhassi et al., 2004; Teeling et al., 2012; Buchan et al., 2014). Major bacterial phylogenetic groups differ in their responses to DOMs derived from different phytoplankton species (Sarmento and Gasol, 2012), and differences in the phytoplankton composition can lead to changes in the BCC (Pinhassi et al., 2004).
Theoretical models that assume fixed parameter values seem unable to simulate both bacterial growth intensities and treatment response patterns recorded in mesocosm experiments, suggesting that the more accurate reproduction of bacterial productivity requires more flexible parametrization (e.g., flexible growth yields, cell sizes or C:N:P stoichiometry, Lignell et al., 2013). Temporal changes in these parameters can reflect the succession of dominant groups in a bacterial community. The complexity of the DOM pools and large taxonomic diversity of bacterial communities hamper our understanding of the interactions between bacterial groups and community functioning (e.g., Gasol et al., 2008). Thus, more information on the growth of bacterial groups in different environmental conditions, such as different types of phytoplankton blooms, is necessary to improve our understanding of the connections between the composition of bacterial communities and the biogeochemical cycling of C and nutrients.
The main aims of this study were (1) to evaluate the partition of autochthonous organic C produced during the development of a late summer cyanobacterial bloom into bacterial biomass, CO2 and DOC, and (2) to examine the effects of the bloom development on the composition of a bacterial community. In addition, we investigated the sensitivity of C sequestration and BCC to the availability of inorganic nutrients and labile C, as well as to the presence of large zooplankton (>100 μm), which could affect bacterial growth via both the DOM supply from “sloppy feeding” and trophic cascading effects on bacterial grazers.
Materials and Methods
Mesocosm Experiment
We carried out a 10-day mesocosm experiment at a sheltered archipelago site close to the Tvärminne Zoological Station in the northwest Gulf of Finland, the Baltic Sea, from 2 to 13 July 2007. In the study area, the water column stratifies during summer with a thermocline at a depth of 10 to 15 m. After the spring bloom, the surface layer becomes N depleted, and pico- and nanophytoplankton dominate the phytoplankton community. In this location blooms of diazotrophic (N2-fixing) filamentous cyanobacteria emerge in July–August, driving the plankton community toward combined N and P limitation (Lignell et al., 2003).
We enclosed natural surface water into 10 floating 4-m3 plastic bags (diameter 1 m, depth 5 m) the day before the experiments began. We treated nine mesocosms with nutrients (NP; combined daily addition of 1 μmol -N L−1 and 0.06 μmol -P L−1), glucose-C (S; daily addition of 10 μmol C L−1) and a top predator (Z; addition of > 100 μm to 10 times the natural concentration at the start of the experiment) in all combinations (complete factorial 23 design; Table 1). Three replicate mesocosms were treated with all additions (NPSZ). We left one mesocosm untreated to serve as the Control. We sampled and determined bacterial production daily, and DOC, DON, and DOP concentrations every other day. We also sampled the Control (Cont), NP, S, NPS, Z, and NPZ treatments every other day for changes in bacterial community composition.
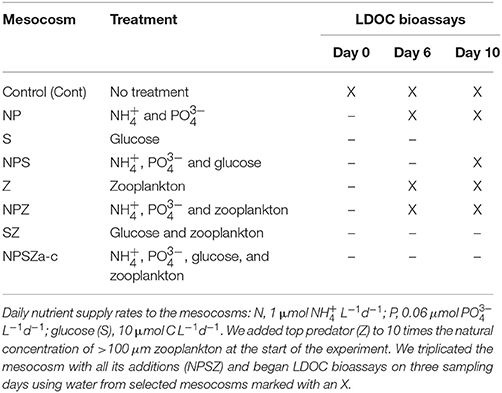
Table 1. Design of the 10-day mesocosm experiments and 1-week labile dissolved organic carbon (LDOC) bioassay experiments.
Labile DOC Pool Bioassays
During the mesocosm experiment, we examined the biological availability of the DOC pool three times from selected mesocosms (Table 1). We pre-sieved <20 μm of the water samples and then filtered them through combusted (4 h at 400°C) GF/F glassfiber filters (retention at 0.7 μm, Whatman) to remove bacterial grazers and larger organisms. We dispensed five replicate samples per mesocosm into 1-L glass bottles, amended them with inorganic N (7.1 μmol -N L−1) and P (1.4 μmol P L−1) to ensure C-limitation of bacterial growth, and incubated them in the dark at in situ temperature (from 12 to 19°C) for 1 week. At least every other day, we analyzed bacterial and heterotrophic nanoflagellate abundance, respiration and concentrations of DOC and DON. To determine bacterial community composition, we took samples from one replicate of each treatment at the beginning, after 3 days and at the end of the 1-week incubation period.
Water Chemistry
We filtered samples through 0.2 μm pore size filters (Minisart, Sartorius) to determine the concentrations of inorganic and dissolved organic nutrients. In the Tvärminne Zoological Station laboratory, we measured inorganic nutrients (, + , ) fresh according to Grasshoff et al. (1983). We then stored filtered samples at −20°C until the determination of DOC and total dissolved N using a high-temperature catalytic oxidation method with a Shimadzu TOC-V CPH carbon and nitrogen analyser (Lignell et al., 2008). Total dissolved phosphorus (TDP) was measured spectrophotometrically after wet oxidation (Solórzano and Sharp, 1980), and DOP concentrations were calculated from TDP concentrations subtracting concentrations.
Autotrophs
For determining chlorophyll a (Chl-a) concentrations, duplicate samples were filtered on GF/F glass fiber filters (Whatman) and extracted in 96% ethanol (Jespersen and Christoffersen, 1987). Chl-a fluorescence was measured with a spectrofluorometer (Shimadzu RF-5000) using excitation and emission wavelengths of 450 and 670 nm, respectively.
The abundance and size of filamentous cyanobacteria were recorded on two fixed width transects over the phytoplankton settling chamber by microscopy. For Aphanizomenon flos-aquae the length of all filaments was recorded and for Anabaena lemmermannii the cell number of all filaments was recorded. For Pseudanabaena sp., the number of filaments was recorded from each sample and the average filament length was calculated from four samples and then used to calculate the biovolumes in all samples. Biovolumes and C biomass of all filamentous cyanobacteria were determined using values reported in HELCOM PEG Biovolume reporting.
Bacterial Growth, Respiration, Carbon Demand, and Growth Efficiency
We used flow cytometry as described in Gasol et al. (1999), with few exceptions, to count the bacteria. In short, we fixed 1-mL samples with a mixture of paraformaldehyde (Sigma, final concentration 1%) and glutaraldehyde (Sigma, final concentration 0.05%; Marie et al., 1996) incubated at room temperature for 10 min and stored at −80°C. We stained the samples with SybrGreen I (Sigma) and then used a Becton Dickinson LSRII flow cytometer to count the stained cells. We added Countbright® absolute counting beads (Invitrogen) of a known concentration to each sample to determine the bacterial concentration. We then identified bacteria based on their signature in a plot of green fluorescence against side light scattering. We measured bacterial cell volumes (= 200 cells per sample) with digital image analysis (Massana et al., 1997) using a Leitz Aristoplan epifluorescence microscope and later converted the bacterial biovolumes to bacterial biomass using the formula 0.12 pg C × (μm3 cell−1)0.7 (Norland, 1993).
We used the centrifugation method (Smith and Azam, 1992), with double-labeled samples, to measure bacterial 3H-thymidine incorporation (TTI) and 14C-leucine incorporation (LeuI). Each day we double-stained four replicates from each mesocosm and two formaldehyde-treated blanks with 3H-thymidine (SA 20 Ci mmol−1; f.c. 20 nmol L−1, NEN, Perkin Elmer) and 14C-leucine (SA 0.3 Ci mmol−1; f.c. 166 nmol L−1, NEN, Perkin Elmer), and incubated them for 1 h in the dark at in situ temperature. We used a HiSafe III scintillation cocktail (Wallac) with an LKB Wallac Rackbeta 1215 liquid scintillation counter to measure radioactivity. We then used a thymidine conversion factor of 1.1 × 10¹⁸ cells mol−1 (Riemann et al., 1987) and a carbon conversion factor of 0.12 pg C × (μm 3 cell−1)0.7 (Norland, 1993) with measured mean bacterial cell volumes to convert 3H-thymidine incorporation to bacterial production (BP), and a theoretical conversion factor of 1.55 kg C mol−1 to convert 14C-leucine incorporation to BP.
Respiration rate was determined from the net change in oxygen concentration during a 48 h incubation period. Three replicate 120 mL Winkler-bottles were used for each mesocosm, and respiration rate was calculated from the average of these. The concentration of O2 was measured using a fiber optical dipping probe (PreSens, Fibox 3), calibrated against anoxic (0% O2, obtained by adding sodium dithionite) and air saturated water (obtained by bubbling sampled water with air for 5 min followed by 15 min of stirring with a magnetic stirrer). The final O2 concentration was calculated using the Fibox 3 software including temperature compensation. We used a Respiratory Quotient (RQ) of 1.2 (Berggren et al., 2012) to convert oxygen consumption (μmol O2 L−1) to respired CO2 (μmol C L−1), and used the bacterial growth (biomass increase, ΔB) and respiration (R) responses during the first 1–2 days of incubation in the DOM bioavailability experiments (BGE = ΔB/(ΔB+R)) to determine bacterial growth efficiency. Bacterial Carbon Demand (BCD) was calculated from BGE and BP (BCD = BP/BGE).
Heterotrophic Nanoflagellates
We fixed the samples with glutaraldehyde (final concentration 5%), stained them with proflavine and counted them with an epifluorescence microscope (Leitz Aristoplan) as described in Hoikkala et al. (2009). We then used epifluorescence microscopy with a New Porton grid to determine cell volumes, and used a conversion factor of 0.22 pg C μm−3 (Børsheim and Bratbak, 1987) to convert the biovolumes to C biomass.
DNA Extraction, Sequencing, and Classification of OTUs
We used sterile 0.2-μm polycarbonate membrane filters (Whatman) to collect samples for bacterial community analysis. We then used a PowerSoil DNA Isolation Kit (MoBio Laboratories, Inc.) to extract the DNA, which we later stored at −80°C. A two-step PCR was used to amplify the fragments of the 16S rRNA genes (V1–V3 region), which were then sequenced with an Illumina MiSeq paired-end multiplex platform at the Institute of Biotechnology (Helsinki, Finland).
PANDA (Masella et al., 2012), which allows zero mismatches in the overlapping region, served to pair raw Illumina reads; thereafter, we removed any chimeric reads and assigned operational taxonomic units (OTUs) by pairwise similarity at a threshold of 97% using cd-hit-otu (Li et al., 2012). We used SINA 1.2 (Pruesse et al., 2012) against the SILVA database (v. 115) to classify unique OTUs and estimated the abundance of each OTU using in-house Python script. All sequences are deposited int NCBI SRA archive under Bioproject PRJNA307158.
Statistical Analyses
General regressions over the 10-day mesocosm experiment served to test the significance of temporal trends in the DOC, DON, and DOP concentrations, DOM stoichiometry and bacterial thymidine and leucine incorporation. We then determined important treatment effects by fitting polynomial curves to the data with orthogonal regression analysis as explained in Lignell et al. (2003) and references therein. The factorial design allowed all single and combined effects of the treatments (NP, S and Z) to be extracted. We also included four time steps (Days 0, 3, 6, and 9) into the analyses, resulting in a 4 × 23 design. This allowed the effect of each treatment to be represented by a polynomial fit with its linear, second- and third-degree temporal trends, the corresponding significant regression coefficients being identified by normal probability plots (e.g., Lignell et al., 2003).
One-way analysis of variance (ANOVA) served to test the significance of the treatment effects on the labile DOC (LDOC) shares of the total DOC pool (%LDOC) and bacterial responses (respiration, BGE, BCD) in the LDOC bioassays conducted on Days 0, 6, and 10 of the mesocosm experiment. Tukey's comparison of means then served to identify significant treatment effects. In addition, we used the two-sample Student's t-test of all NP-treated samples vs. all samples without NP treatment to test for the significance of the NP treatment.
Prior to the statistical analysis of the OTU data, we excluded all singleton and doublet OTUs from the dataset, as well as OTUs appearing in one sample from any downstream statistical analysis. In the analysis, we used the relative abundance of OTUs in each sample which were square-root transformed and omitted all OTUs affiliated with the chloroplasts and cyanobacteria. We then tested the effects of the incubation time (succession) and treatments on the relative shares of the bacterial OTUs by using permutational multivariate ANOVA (PERMANOVA, adonis in R package vegan) to compare the variance in the bacterial community structure. Correspondence analysis (CA) (vegan package in R) served to describe the variability of the BCC in the mesocosm and LDOC experiments.
Redundancy analysis (rda analysis in vegan), a constrained ordination method with a linear response model, served to test the effects of heterotrophic nanoflagellates (HNF) and functional groups of autotrophs on the most abundant bacterial classes in 36 analyzed samples. We square-root transformed the bacterial community data to more closely follow a normal distribution. We also checked the multicollinearity of the response variables by inspecting the variance inflation factor (VIF). We then removed the autotrophic group of size class 2–10 μm from the model to keep the VIF <3. Correlation scaling served in the biplots, which enabled approximation of the correlations between the response and explanatory variables from the angles between them.
Results
Responses of Phytoplankton and Bacterial Production to DOM Dynamics in the Mesocosms
The different treatments had clear effects on the phytoplankton and bacterial community. The phytoplankton biomass (Chl-a) doubled in all mesocosms with NP treatment during the 10-day period (Figure 1), while in mesocosms without inorganic nutrient additions, the phytoplankton biomass remained relatively stable (about 6 μg L−1). Large (> 10 μm) algae accounted for most of the chlorophyll a increase in the NP units. The biomass of N2-fixing filamentous cyanobacteria more than doubled, increasing by about 15 μmol C L−1 in all mesocosms.
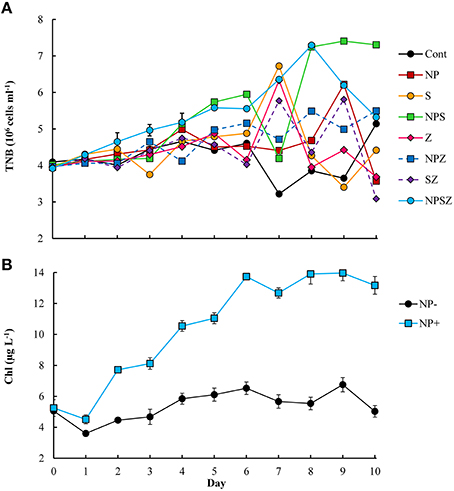
Figure 1. Time course of (A) total number of bacteria (TNB) in all mesocosms and (B) pooled data of chlorophyll a concentrations in nutrient addition (NP+) or without (NP−) mesocosms during the 10-day experiment.
The ambient DOC concentration increased on average 1.9 μmol C L−1 day−1 (linear regression, r2 = 0.64, p < 0.001) in the mesocosms with no added glucose (Figure 2A). In the mesocosms with added glucose, the DOC accumulated at a four-fold rate (6.8 μmol C L−1 day−1, accounting for 68% of the daily glucose addition; Table 2). The DON concentration increased by 0.12 μmol N L−1 day −1 (linear regression, r2 = 0.25, p < 0.001) (Figure 2B), with no clear treatment effects. The DOP concentration stayed at initial level or decreased slightly (0.1–0.2 μmol P L−1) within the 10 days experiment (linear regression, r2 = 0.2–0.4, p < 0.005 for samples with and without NP treatment; Figure 2C). The DOC:DON ratio increased significantly in the glucose-treated samples (linear regression; r2 = 0.22, p < 0.005), but showed no significant trend in samples with no added glucose (linear regression, r2 = 0.04, p = 0.4). Due to increase in DOC and DON but not in DOP concentrations the DOP content of the DOM pool increased (linear regression; r2 = 0.31, p < 0.001 for DOC:DOP and r2 = 0.24, p < 0.001 for DON:DOP).
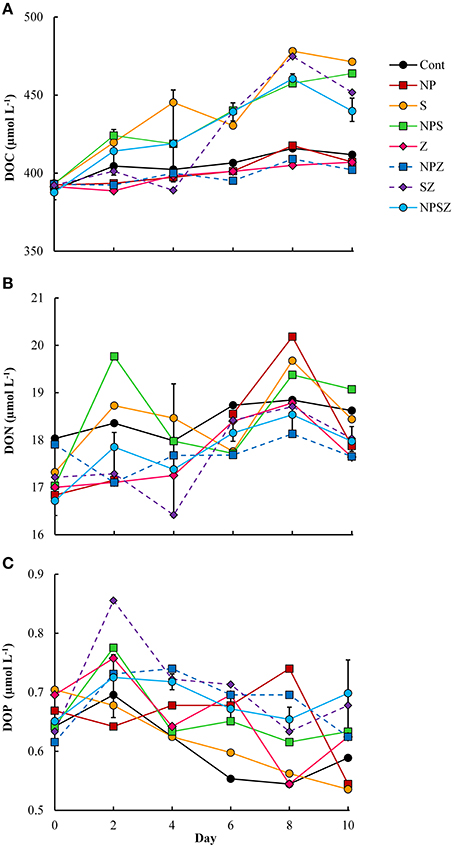
Figure 2. Time courses of (A) dissolved organic carbon (DOC), (B) dissolved organic nitrogen (DON), and (C) dissolved organic phosphorus (DOP) during the 10-day mesocosm experiment. Treatment explanations appear in Table 1.
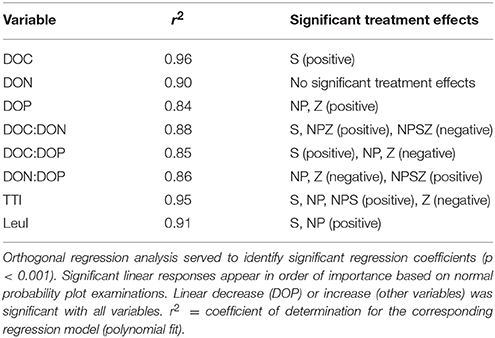
Table 2. Responses of DOM concentrations and stoichiometry, bacterial thymidine (TTI), and leucine incorporation (LeuI) to and (NP), glucose (S), and zooplankton (Z) treatments during the 10-day mesocosm experiment following a factorial design with all combinations of treatments.
Bacterial biomass doubled from 5 to 11 μmol C L−1 with no consistent treatment effects during the mesocosm experiment. Bacterial TTI was highest in the NPS-treated mesocosms where substrate availability did not limit bacterial production (Figure 3A). According to orthogonal regression analysis, glucose had the highest positive effect on TTI. TTI significantly increased also in NP treatment, whereas the addition of zooplankton decreased TTI (Table 2). Bacterial LeuI was also highest in the NPS-treated mesocosms. However, LeuI in the Control sample peaked abruptly on Days 6 and 7 (Figure 3B); we removed these two outliers from the LeuI data used in further analyses. Orthogonal regression analysis of LeuI supported the role of glucose as the most important promoter of bacterial production. In samples with no added glucose, cumulative bacterial production estimates over the 10-day incubation period were on average 41 and 29 μmol C L−1, based on the TTI- and LeuI-derived production estimates, respectively.
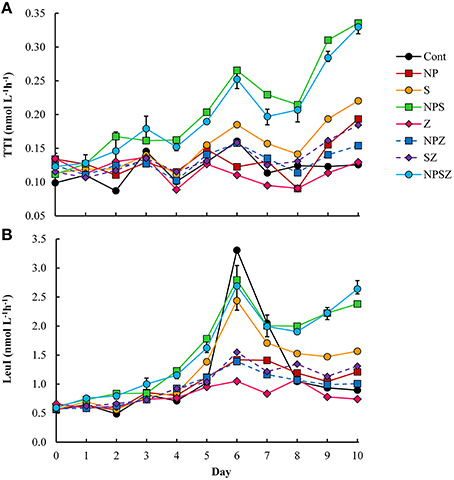
Figure 3. Bacterial incorporation rate of (A) 3H-thymidine (TTI) and (B) 14C-leucine (LeuI) during the mesocosm experiment. Treatment explanations appear in Table 1.
Bacterial Degradation of the Labile DOC Pool (LDOC Bioassays)
The bacterial biomass increased in all LDOC bioassays by 2.2–6.3 μmol C L−1, peaking after 2–3 days (Figure 4) with no clear treatment effects. We encountered HNF in all samples after five incubation days, but their biomass remained low (0.10–0.15 μmol C L−1 at the end of the incubation period). Cumulative bacterial respiration was 13.9–47.0 μmol C L−1 within four to six incubation days (Figure 5). In samples derived from the Control mesocosm, respiration decreased from Day 0 to Day 10, and in samples derived from the Z mesocosm, from Day 6 to Day 10. No such change occurred in samples from the NP-treated mesocosms. NP treatment significantly increased bacterial respiration in bioassays that began on Days 6 and 10 (Table 3). Respiration was highest in the the NPS-treated samples, in the bioassay, which began on Day 10. All referred samples were treated with inorganic N and P; consequently, the response differences may have stemmed from variations in the quality and quantity of bioavailable DOM.
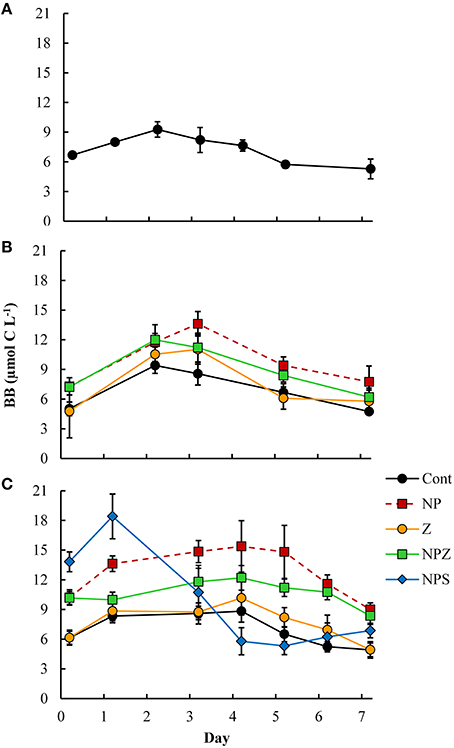
Figure 4. Time courses of bacterial biomass (BB, μmol C l−1) during the 1-week LDOC bioassays in samples drawn from selected mesocosms (A) at the start of the mesocosm experiment, (B) on Day 6 and (C) at the end of Day 10. Error bars show the SD for the five treatment replicates. Treatment explanations appear in Table 1.
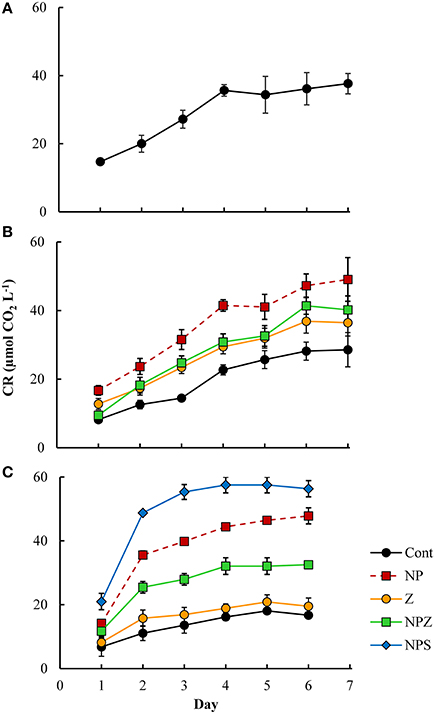
Figure 5. Cumulative bacterial respiration (CR) in the 1-week LDOC experiments in the samples drawn from selected mesocosms (A) at the start of the mesocosm experiment, (B) on Day 6, and (C) at the end of Day 10. Error bars show the SD for the five treatment replicates. Treatment explanations appear in Table 1.
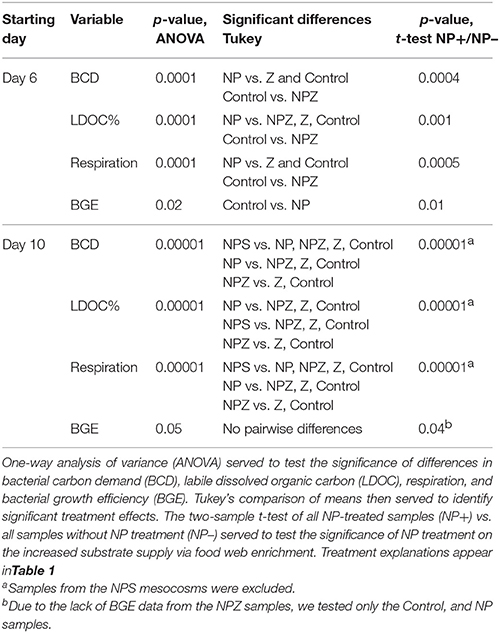
Table 3. Statistical significance of bacterial responses to treatments in the LDOC bioassays.
BGE in bioassays increased with incubation time of mesocosms (Figure 6). In samples from the Control mesocosm, BGE increased from an initial 0.06–0.13 (Day 0) to 0.19–0.39 (Day 6 and Day 10). In Day 6 bioassays, average BGE was significantly (p < 0.05) lower in samples from the NP-treated mesocosms than in Control mesocosms (Table 3).
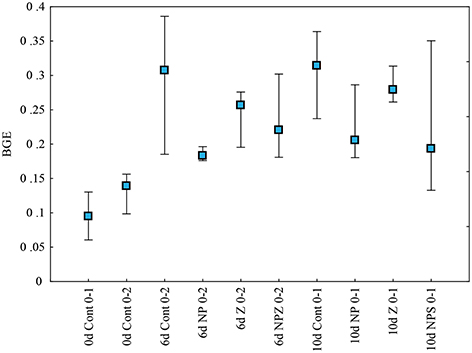
Figure 6. Bacterial growth efficiency (BGE) in the LDOC bioassays with samples from different mesocosms at the start of the experiment (0 day), after 6 incubations days (6 days), and at the end of 10 day incubation (10 days). BGE was determined from the bacterial growth (biomass increase) and respiration responses either within over 1 day (0–1) or two (0–2) days, depending on the availability of biomass data. Bars show the minimum, maximum, and box indicates median of five treatment replicates (more explanations in Table 1).
In Day 0 bioassay, DOC decline was on average 16 μmol C L−1 accounting for 4% of the total DOC (Table 4). The BCD-based estimate of degraded DOC was on average 31 μmol C L−1 accounting for 8% of the total DOC. On Day 10 bioassay, both estimates accounted for on average 25 μmol C L−1 (6% of the total DOC pool). Due to the high background of the refractory DOC, between-replicate variation in direct DOC measurements was too high to determine significant treatment effects on the DOC concentration trends. In Days 6 and 10 bioassays, the BCD and DOC-based estimates of the%LDOC were both significantly higher (p ≤ 0.001) in samples from the NP-treated mesocosms than in the ones with no NP treatment (Z and Control, Table 3).
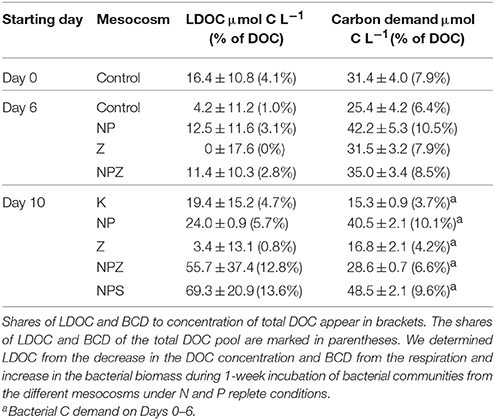
Table 4. Concentration of labile dissolved organic carbon (LDOC) and bacterial carbon demand (BCD) in the mesocosms during the three selected sampling days.
Decline of DOC recorded in Day 0 bioassay was used as an estimate for ambient net LDOC concentration in the enclosed initial sample water. Correspondingly, DOC decline recorded in Day 10 bioassay was used to estimate the labile share of autochthonous DOC that accumulated by the end of the mesocosm experiment. Bacterial <0.7 μm size fractionation for the bioassays was done with glass fiber filters, and evidently part of the bacterial community (e.g., attached bacteria) were excluded by the pre-screening. Moreover, the pre-screening removed phytoplankton and zooplankton communities, affecting the substrate supply to bacteria. Incubations were conducted in dark, which can also change bacterial development relative to natural conditions (Gasol et al., 2008). Thus, our bioassay results cannot directly be extrapolated to mesocosms. However, without size-based pre-screening estimation of bacterial degradation of net LDOC pool becomes a challenging task. Our earlier experiments with <0.7 μm bacterial bioassays have shown that the estimated LDOC shares are quite robust, different combinations of nutrient and light treatments having only a small effect on them (Lignell et al., 2008). Thus, altogether we believe that the time courses of net LDOC pool degradation in our bioassays are a meaningful way of estimating the size of these pools.
The availability of inorganic nutrients did not limit degradation of DOC in any of the LDOC bioassays. In the LDOC bioassays that began on Days 0 and 10 of the mesocosm experiment, the concentration in the samples decreased by 1.6–2.8 μmol N L−1 within three days, accounting for about 20–40% of the added . In the LDOC bioassay that began on Day 6, the concentration remained in the original level. We recorded no significant decline of the DON in any of the LDOC experiments. The phosphate concentration decreased by 0.14 (SD 0.07) μmol P L−1 (11% of added ) in the LDOC bioassay that began on Day 0 of the mesocosm experiment and remained constant in the other LDOC bioassays. Thus, in none of the LDOC bioassays did the availability of inorganic nutrients limit the degradation of DOC.
DOC Partition in Mesocosms
The major share of BCD was supported by autochthonous DOM. Assuming that the ambient LDOC in the enclosed initial sample water degraded over the 10-day experiment, a total of 35 or 50 μmol C L−1 (average DOC increase of 19 μmol C + average initial LDOC of 16 μmol C L−1 (based on direct DOC measurements) or 31 μmol C L−1 (based on BCD) of new DOC accumulated during the experiment in the mesocosms with no added glucose. These values accounted for 37% (SD ± 9) and 65% (SD ± 17) of the cumulative primary production in the mesocosms with (NP and NPZ) and without (Control and Z) added NP, respectively.
Assuming an average BGE of ~0.45 for labile DOM uptake, recorded previously in enclosed temperate marine plankton communities (Søndergaard et al., 2000; Hoikkala et al., 2009), the BCD in the mesocosms without glucose treatment was on average 64–91 μmol C L−1 (average cumulative bacterial production of 41 and 29 μmol C L−1 based on TTI and LeuI, respectively, divided by 0.45). The initial ambient (net) LDOC pool (degradable within 1 week) accounted for 18–48% of the estimated BCD, and thus the major share of BCD (at minimum 52–82%, 33–75 μmol C L−1) was supported by DOC released from the plankton community during the experiment. This BCD represents the part of released DOC that was taken up by bacteria over time scales of hours. Based on the above estimates and the cumulative primary production in the mesocosms, bacteria could potentially assimilate 36% (SD 10) and 70% (SD 22) of the primary production in samples with (NP and NPZ) and without (Control and Z) added NP.
At the end of the 10-d mesocosm experiment, on average 25 μmol C L−1 (6%) of the ambient net DOC pool was degradable by bacterial communities within a week. With the assumptions above, altogether 50–71% of the accumulating autochthonous DOC (25 μmol C L−1 of 35–50 μmol C L−1) was thus potentially labile.
Bacterial Community Composition in the Mesocosms
The main effects on bacterial community were due to temporal development and glucose addition. Based on amplicon sequencing of the 16S rDNA V1–V3 fragment, Cyanobacteria was the most abundant bacterial phylum at the beginning of the mesocosm experiment, accounting for 47% (SD ± 6.5) of the OTUs. Their share decreased during the experiment in all samples, falling to 28% (SD ± 9.2) by the end of the 10-day incubation period. Synecochoccus accounted for 72–90% of the cyanobacterial species present. When Cyanobacteria were excluded, the rest of the bacterial community at the begining of the experiment was dominated by Alphaproteobacteria (51%, SD ± 2.2; Figure 7), most of which (70–90%) belonged to the SAR11 clade. By Day 4, the share of Deltaproteobacteria increased from an initial 0.9% (SD ± 0.2) to 16.0% (SD ± 2.2) and 10.5% (SD ± 2.5) in samples with (NP, NPZ, NPS) and without (Control, Z, S) NP treatment, respectively. The share of Deltaproteobacteria peaked in the NP samples on Day 6 (Figure 7). During the peak, 99 to 100% of the Deltaproteobacteria in all samples belonged to Myxococcales. After them, the share of Gammaproteobacteria increased, peaking on Day 6 in the Control, S and NPS samples, and on Day 8 in the NP, NPZ, and Z samples. The peak was highest in the Control and S samples, reaching 60 and 41% of OTUs, respectively (Figure 7), and coinciding with a marked peak in leucine incorporation (Figure 3B). The most abundant Gammaproteobacteria were affiliated with two different Pseudomonas species, one of which increased in the Control treatment and the other in all other treatments. In the glucose-treated S and NPS samples, a Gammaproteobacterial peak was followed by an increase in the relative shares of Actinobacteria, affiliated with Microbacteriaceae, peaking (15 and 28%, respectively) at the end of the 10-day incubation period. The share of Betaproteobacteria constantly decreased toward the end of the experiment from an initial 7.7% (SD ± 0.8) to 2.2% in the NPS samples (Figure 7). Bacteriodetes comprised 8% (SD ± 1.7) of the total community in the beginning and grew in the Z samples to 16%, accounting for a 54% share of the Flavobacterium species toward the end of the experiment. PERMANOVA analysis of the relative shares of OTUs in the mesocosms identified the sampling date as the major factor affecting bacterial community composition (F. model = 10.38, p = 0.001). In addition, glucose treatment (S) significantly affected the bacterial community (F. model = 2.78, p = 0.009), whereas NP and Z showed no significant effects on the bacterial community (p > 0.2). CA also showed a clear temporal development of the bacterial communities. In addition, increasing variation and grouping according to the treatments (S and NPS together and NP separated) over time was observed (Figure 8).
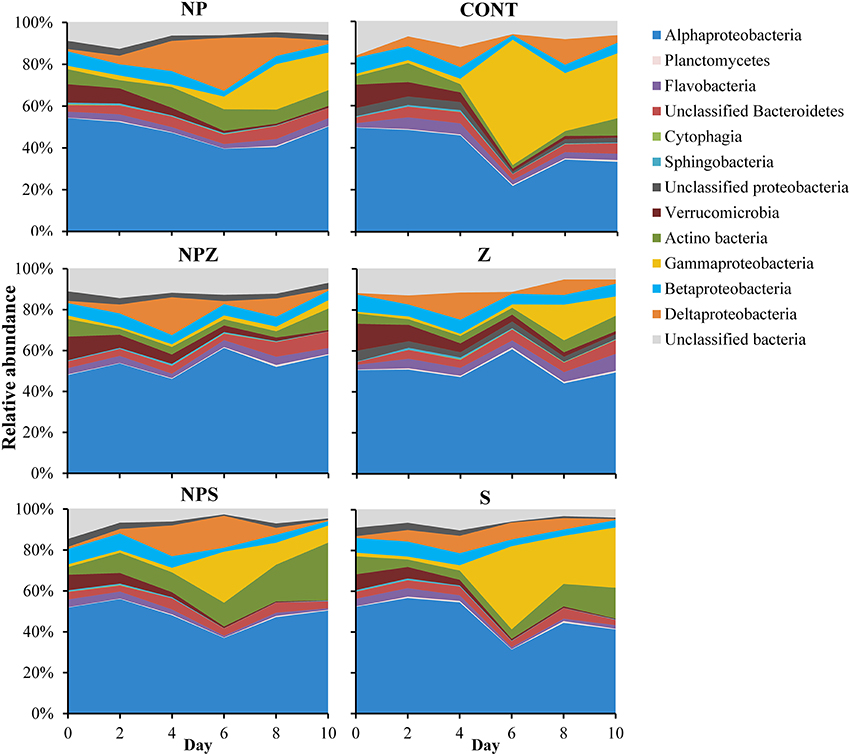
Figure 7. Relative shares of bacterial classes in different treatments during the 10-day mesocosm experiment. Treatment explanations appear in Table 1.
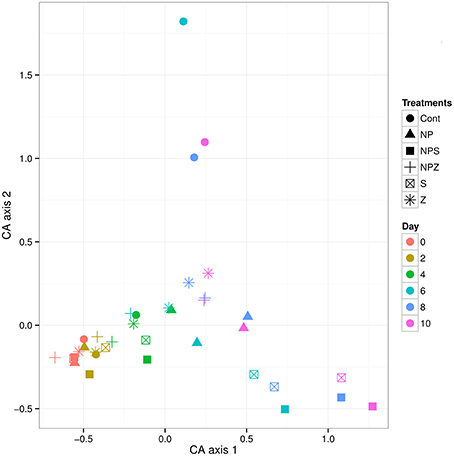
Figure 8. Bacterial community composition dynamics in the 10-day mesocosm experiment. Sample scores of correspondence analysis appear in the two-dimensional space of the first two major axes (CA1 and CA2).
In the RDA model of the effects of different functional groups of autotrophs and the heterotrophic nanoflagellates on the most abundant bacterial classes, both the first and second axes proved significant, but together explained only 32% of the total variation (Figure 9). After removing the most abundant bacterial class, Alphaproteobacteria, which correlated with none of the explanatory variables, the explanatory value of the two first axes increased to 38% (data not shown). According to the RDA model, the share of Gammaproteobacteria correlated with the biomass of autotrophs of size class 10–25 μm and the biomass of Pseudoanabaena. The shares of Betaproteobacteria and Verrucomicrobia correlated negatively with the same groups, reflecting the decrease in their shares during the development of the bloom. Deltaproteobacteria correlated most closely with the autotroph biomass of <2 μm, which consisted mainly of picocyanobacteria, whereas Actinobacteria, which were most abundant in glucose treated mesocosm showed no clear correlation with any of the explanatory variables in our RDA model.
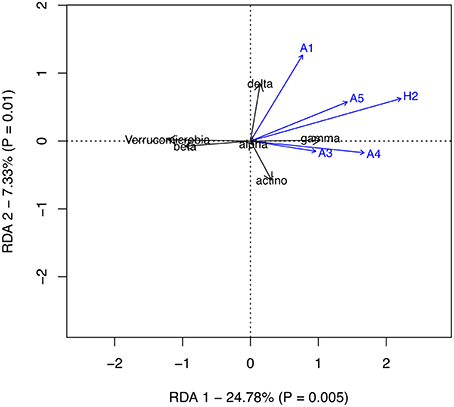
Figure 9. Redundancy analysis of the effects of the functional groups of autotrophs and heterotrophic nanoflagellates on the most abundant bacterial classes. Autotrophic groups: A1 = <2 μm, A3 = 10–25 μm, A4 => 20 μm non-N2-fixing cyanobacteria (Pseudoanabaena), A5 = > 20 μm N2-fixing cyanobacteria, H2, heterotrophic nanoflagellates.
Bacterial Community Composition in LDOC Bioassays
Degradation of the ambient LDOC led to differentiation of the bacterial communities from those developed in the mesocosms. Filtration of the samples (~0.7 μm GF/F) resulted in only modest changes in the bacterial community composition (mesocosm vs. LDOC Day 0 samples). Degradation of the ambient LDOC led to differentiation of the bacterial communities from those that developed in the mesocosms (Figure 10). In the LDOC bioassays that began on Days 6 and 10 of the mesocosm experiment, the shares of Gammaproteobacteria increased within 3 days from 1–5 to 22–25% and from 1–6 to 7–15%, respectively, suggesting that they were actively utilizing the LDOC pools that accumulated in the mesocosms (Figure 11). The only exception was in a sample from the Control mesocosm on Day 6, where the initially high share of Gammaproteobacteria (25%) remained constant. The most pronounced responses in Gammaproteobacteria occurred in the relative shares of Pseudomonas that also thrived in the mesocosms, and Cellvibrio, which we observed in the mesocosms only in low abundance toward the end of the experiment. The share of Flavobacteriia increased in all LDOC bioassays from an initial 1–3 to 5–12% (Figure 11). Actinobacteria increased in the Control samples at each time point (Day 0, Day 6, and Day 10), but not in other samples. During the phase of the decrease in bacterial biomass from Day 3 to Day 7 of the LDOC bioassays, the share of Gammaproteobacteria increased further in part of the samples (Day 0 Control, Day 6 NPZ, and Day 10 all NP-treated mesocosms NP, NPZ, NPS), whereas the share of Alphaproteobacteria of the SAR11 clade increased in the rest of the samples (Day 6 Control, NP, Z, and Day 10 Control and Z).
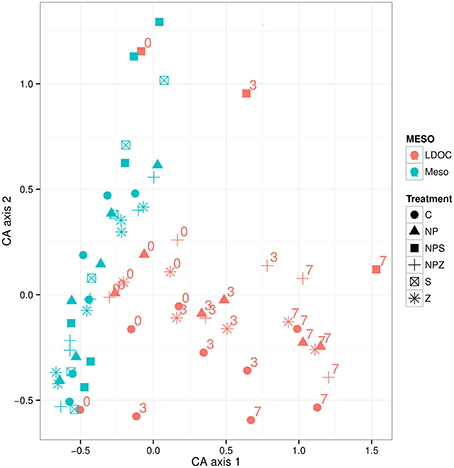
Figure 10. Variation of BCC in the samples from mesocosm and LDOC bioassay in space of first to CA axes. Color of symbols signifies origin of the BCC–mesocosm experiment or LDOC bioassay samples. Incubation days of the LDOC bioassays (0, 3, 7) appear with numbers on the plot. Treatment explanations appear in Table 1.
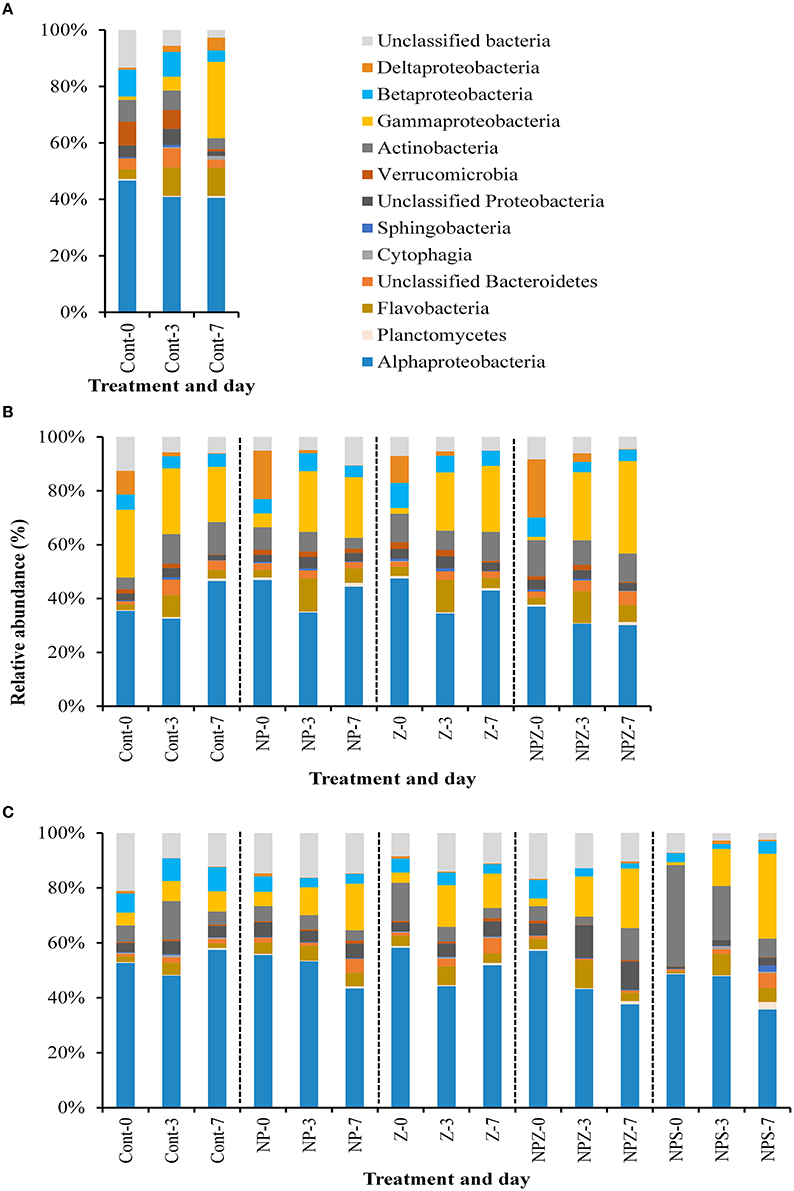
Figure 11. Relative shares of bacterial classes during the 1-week LDOC-experiments in samples taken from selected mesocosms (A) at the start (Day 0), (B) on Day 6, and (C) at the end (Day 10) of the mesocosm experiment. Treatment explanations appear in Table 1.
Discussion
In our mesocosm experiment conducted during the bloom of filamentous cyanobacteria, the bacterial community responded most clearly to labile organic carbon (glucose) addition (Figures 7, 8). In addition, the species diversity of the heterotrophic bacteria changed along with labile DOM released by phytoplankton bloom that developed in the mesocoms. A major part of the organic C released was channeled to highly labile DOC (HLDOC) and labile DOC (LDOC) and subsequently was taken up by bacteria, leading to significant changes in the bacterial community composition.
DOC Partitioning
The accumulation of DOC and BCD that was supported by autochthonous HLDOM over the 10 days experiment together accounted for 73 and 135% of primary production in the mesocosms with and without NP treatment, respectively. These high values suggest that the plankton food web effectively recycled C fixed by primary producers via DOM releasing processes such as “sloppy feeding” and viral lysis. Values exceeding 100% are possible, because recycling of LDOC would mean that part of organic C is utilized by bacteria more than once, allowing BCD to exceed direct C inputs from primary production (e.g., Elmgren, 1984; Strayer, 1988; Søndergaard et al., 2000). The recycling of autochthonous DOC produced during the experiment was probably significant, with a maximal value of 1.8, assuming a BGE of 0.45 recorded previously in enclosed temperate marine plankton communities [(Maximum recycled DOC = 1/(1–BGE) c.f., Søndergaard et al., 2000); BGE values: Søndergaard et al., 2000; Hoikkala et al., 2009]. Efficient recycling of HLDOC will lead to high loss of fixed C, since on each round, a fraction of organic C is lost as CO2 in bacterial respiration.
The minimum estimate for net DOC assimilation was 18–42 μmol C L−1 (assuming maximal recycling, BCD/1.8), which accounted for 20% (SD ± 6) and 39% (SD ± 12) of the primary production in samples with (NP and NPZ) and without (Control and Z) added NP, respectively. Gross DOC production is the sum of net DOC assimilation and DOC accumulation. Assuming maximal recycling, gross DOC production accounted for on average 57 and 104% of production in mesocosms with and without added NP, respectively. The high percentages show that most of the net primary production was converted to DOC. Equally high estimates for the partitioning of net primary production into DOC (gross DOC production) were obtained in the Sargasso Sea, where DOC production accounted for 55–111% of the total production (Carlson et al., 1998). In temperate marine mesocosms, DOC production also accounted for 82–111% of the production after an initial 6-day phase of nutrient-replete growth (Søndergaard et al., 2000). In our experiment, the partitioning of production into DOC was lower in the NP-treated samples, where the accumulation of algal biomass was higher. These results are in accordance with previous findings that the partitioning of total production into DOC may be lowest in autotrophic communities with accumulating biomass (Carlson et al., 1998; Søndergaard et al., 2000). These results suggest also that availability of nutrients can affect the partitioning of the primary production into heterotrophic bacteria.
Using our minimum net DOC assimilation estimates, heterotrophic bacteria consumed within hours 26–55% of the autochthonous DOC released from the plankton community during the experiment. Based on bioassays, more than half of the accumulated total DOC pool (50–71%) was estimated to be bioavailable for the bacterial community within a week. Summing the estimates of DOC that was taken up by bacteria over time scales of hours with the accumulated net LDOC pool suggests that the majority (63–87%) of the total DOC release was potentially degradable for the bacterial community. The high bioavailability of the DOC yield agrees with a recent budget for autochthonous DOC in the Baltic Sea, which exported only an estimated 4–6% of its autochthonous DOC yield to the North Sea (Hoikkala et al., 2015; DOC export values in Kuliński and Pempkowiak, 2011; Osburn and Stedmon, 2011; Gusstafsson et al., 2014). These results suggest that DOC pool may act as a long term storage for only a small fraction of autochthonously produced organic C.
The BGE estimates we recorded doubled from low initial (Day 0) values of about 0.1 to on average 0.25 during the latter half of the mesocosm experiment, most likely reflecting the increase in fresh substrates originating from the phytoplankton (c.f. del Giorgio and Cole, 1998; Apple and Del Giorgio, 2007). Our values fell within the range of BGE values for heterotrophic bacteria in the Baltic Sea (e.g., 0.05–0.6 in the Gulf of Riga, Donali et al., 1999), and between the average values of 0.15 and 0.6 for bacteria degrading phytoplankton detritus and algal exudates, respectively (reviewed in del Giorgio and Cole, 1998). Based on our LDOC and BGE values, the bacterial biomass assimilated an estimated 13–18% of the accumulated DOC and respired about 38–53% of it as CO2. Altogether, the recorded high share of primary production channeled into LDOC and HLDOC recycled with the low BGE of bacteria suggests that bacterial respiration was responsible for the rapid loss of a large share of the organic C yield as CO2.
The C:N ratio of accumulating net DOM pool did not differ from that of the initial DOM pool (23; SD ± 1). The ΔDOC:Δ DON ratio was thus somewhat higher than the seasonal average value of 17 obtained for seasonal changes in the DOC:DON ratio in the open-sea nearby our study area (Hoikkala et al., 2012). These values are double the corresponding ratios in open-ocean areas (Hopkinson and Vallino, 2005) and could reflect higher bacterial uptake rates of N-rich DOM compounds.
Altogether, these results show that a major share of primary production during early phase of cyanobacterial bloom was channeled into DOC and assimilated by bacteria within days. However, this conversion of autochthonous organic C to DOC was lower when inorganic nutrients were available and primary production was higher. High values of partitioning of primary production into DOC indicated recycling of LDOC. Recycling and BGE of bacteria degrading LDOC suggest that a large share of the organic C was lost as CO2. Therefore, the communal CO2 assimilation efficiency of the plankton system was low.
Phylogenetic Structure of Bacterial Communities Degrading Bloom-Derived Highly Labile DOM and Ambient LDOM Pools
In this study, we aimed to find the bacteria responsible for the rapid degradation of bloom-derived HLDOM in mesocosm experiment and bacteria degrading the ambient bloom-derived labile DOM pools in separate bioassays. In general, the same class-level patterns emerged in all mesocosms, even though the magnitude of the changes differed depending on the treatment. Since BCD in the mesocosms was supported mainly by the rapid degradation of new DOC inputs, the observed succession of bacterial communities reflected the degradation of the bloom-derived HLDOM.
The initial total bacterial community was dominated by autotrophic Cyanobacteria (mainly Synechococcus) and oligotrophic heterotroph Alphaproteobacteria (mainly SAR11 clade), both of which are common in the surface water of the Baltic Sea in summer (Herlemann et al., 2011). The share of Alphaproteobacteria showed no clear temporal trend and, according to the RDA, did not respond to the changes in the phytoplankton community. Marine and brackish water Alphaproteobacteria is the group that thrives in oligotrophic environments by utilizing available low-molecular-weight DOM (Giovannoni et al., 2005; Malmstrom et al., 2005), and species, such as Roseobacter, that can consume labile monomeric compounds, such as amino acids (Alonso-Sáez and Gasol, 2007). In our experiment, SAR11 clade dominated the Alphaproteobacteria throughout the experiment.
The first major change in the bacterial community occurred on Days 4–6, when the share of Deltaproteobacteria Myxococcales peaked. Species of Myxococcales are common in terrestrial habitats, especially in soils (reviewed in Dawid, 2000), and widely distributed in or above the sediments, but a study investigating their occurrence in marine environments did not detect them in surface water (Brinkhoff et al., 2012). Species of Myxococcales excrete hydrolytic enzymes, degrade complex biopolymers—including cellulose or chitin—and can feed on other bacteria and yeasts (Dawid, 2000; Shimkets et al., 2006). According to RDA, the share of Deltaproteobacteria in the mesocosms was related to the biomass of autotrophs <2 μm in size, suggesting that they may have utilized organic matter originating from picocyanobacteria (based on 16S rDNA sequence fragment analysis of mainly Synechococcus). Culture experiments have shown species of Myxococcales to lyse Cyanobacteria Phormidium luridum and to be capable of long-term control of Cyanobacterial populations (Burnham et al., 1981, 1984). Their success in our mesocosm experiment could thus stem from their lysing of picocyanobacteria.
The most pronounced phylogenetic response to the bloom-derived DOM occurred in the relative abundance of Gammaproteobacteria. Many Gammaproteobacteria are known to be copiotrophic opportunists (e.g., Lauro et al., 2009; Spring et al., 2015), and capable of high growth rates (Teira et al., 2009). Some of them benefit from algae-derived organic matter (e.g., Teeling et al., 2012; Eronen-Rasimus et al., 2014) and can contribute to the decomposition of algal-derived organic matter during phytoplankton blooms (Teeling et al., 2012). Most of the Gammaproteobacteria in this study affiliated to Pseudomonas, which can occasionally be abundant in the Baltic Sea (Hagström et al., 2000; Koskinen et al., 2011). In addition, it is among the most abundant genera in bacterial isolates during Cyanobacterial blooms in lakes, rivers and the Baltic Sea (Berg et al., 2009). Thus, the increase in the abundance of Pseudomonas could be related to the growth of filamentous Cyanobacteria in the samples. However, as the abundance of Pseudomonas in the Gulf of Finland can be high in spring (Koskinen et al., 2011) when diatom- and dinoflagellates dominate, they may benefit from algae-produced organic matter derived from different types of phytoplankton communities in the Baltic Sea. According to RDA, Gammaproteobacteria in our mesocosm experiment correlated most clearly with nanoalgae (10–25 μm), which dominated the autotrophic community in the NP-treated samples, and with Cyanobacteria Pseudoanabaena.
The bacterial communities degrading ambient LDOC pools in our bioassays significantly differed from those that degraded HLDOC in the mesocosms (Figure 9). Bacteria that responded to ambient (accumulated) LDOC pools were more diverse. In addition to Pseudomonas, Gammaproteobacteria that increased in the LDOC experiments included, for example, Cellvibrio sp., which was rare in our mesocosms. Moreover, Flavobacteriia, an important degrader of DOM originating from phytoplankton blooms (e.g., Pinhassi et al., 2004; Teeling et al., 2012), increased in the LDOC experiments.
The accumulation of DOC in the surface water can occur due to its low degradability by the ambient bacterial population or due to the limitation of bacterial growth by external factors, such as nutrient deficiency (e.g., Zweifel et al., 1995). Theoretical models suggest that the accumulation of LDOC can also occur due to the combination of different factors, such as the simultaneous limitation of bacterial production by nutrient availability and the control of bacterial biomass by flagellate grazing (Thingstad and Lignell, 1997). In our experiment, the addition of glucose showed the most important treatment effect and enhanced bacterial production, thereby supporting our earlier results on the C-limitation of heterotrophic bacteria in summer in the Gulf of Finland (Lignell et al., 2008; Hoikkala et al., 2009; Tammert et al., 2012). The accumulation of LDOC in the mesocosms, despite the C-limitation of the bacterial community, was probably controlled by the biodegradability of the LDOC pool combined with strict grazing control of bacterial biomass (e.g., Thingstad and Lignell, 1997). The difference in the quality of the utilized substrates most likely resulted in the observed differences in the identity of the responding bacteria. Ambient net LDOM pool probably comprised a large variety of different compounds in low concentrations, contributing to the greater diversity of responding bacteria in the LDOC bioassays than in the mesocosms.
Altogether, our results strongly suggest that phytoplankton blooms can favor different bacterial types: (1) bacteria that can rapidly consume releases of highly labile substrates and which dominate the bacterial community during the bloom, and (2) bacteria that more slowly degrade the ambient (accumulating) LDOM of intermediate lability; however, certain bacteria, such as Pseudomonas in our experiment, can benefit from both LDOM pools.
Sensitivity of Functional and Qualitative Responses to Organic C and Nutrient Availability
Various treatments in our mesocosm experiment markedly affected the functioning of the bacterial community and the bacterial community composition. The observed positive production response to glucose co-occurred with significant changes in bacterial community composition, supporting the growth of copiotrophic bacteria with a high affinity for glucose. The bacteria that benefited most from the glucose treatment were Gammaproteobacteria, Pseudomonas spp. Glucose can stimulate several genera of Gammaproteobacteria from various marine environments (Alonso-Sáez et al., 2009; Gómez-Consarnau et al., 2012).
NP treatment also significantly increased bacterial production, which appeared to benefit Deltaproteobacteria Myxococcales. Based on BCD estimates, the flux into the LDOC pool was also higher in the NP-treated mesocosms. Enhanced bacterial production and LDOC accumulation probably reflected an indirect effect of the enhanced availability of organic substrates, derived from larger standing stocks of plankton in these eutrophied mesocosms. The uptake of algal exudates by heterotrophic bacteria in the study area meets only ≤25% of their carbon demand (Lignell, 1990), and the “sloppy feeding” of nanoalgae (10–25 μm), which dominated in the NP-treated mesocosms, probably accounted for most of the LDOC production. Another possible explanation is that the availability of inorganic nutrients limited part of the bacterial community's growth. Bacterial taxa differ in their ability to utilize different DOM compounds and comprise species ranging from generalists to specialists (e.g., Gómez-Consarnau et al., 2012). Such specialization could lead to different requirements for inorganic nutrients (e.g., depending on the quality of the available substrate).
Studies have found that the long-term bioavailability of DOM correlates positively with BGE (Apple and Del Giorgio, 2007), but in our experiment, the increased availability of bacterial substrates did not lead to higher BGE values in the NP-treated mesocosms. It seems that the increase in the availability of inorganic nutrients could (via their effects on autotrophic growth and the subsequent supply of LDOM) even lead to lower BGE values and thus to higher relative partitioning of autochthonous LDOC into CO2.
As expected, cascading effects of large zooplankton addition (mainly cladocera and copepoda) affected the DOM pool and bacteria less than the glucose and nutrient additions did. However, the addition of large zooplankton did decrease bacterial production and appeared to affect negatively the growth of Gammaproteobacteria, as well as Deltaproteobacteria in the NP-treated samples. This could be due to a cascading effect in which increased phytoplankton grazing pressure reduces the release of DOC.
Conclusions
Altogether, our results showed that bacteria rapidly degraded the majority of the DOC produced during a bloom of filamentous cyanobacteria. In addition, more than half of the accumulating DOC was labile and presumably consumed within days by the C-limited bacterial community dominated by Pseudomonas (Gammaproteobacteria). Gammaproteobacteria dominated bacterial communities in both mesocosm and LDOM bioassay; however, LDOM communities were more diverse and included bacteria such as Flavobacteriia, which were less abundant in mesocosm experiment. Efficient LDOC utilization increased the loss of organic C via bacterial respiration of CO2 over the situations where mineral nutrients limited bacterial growth and allowed LDOC accumulation. Thus, C-limitation of heterotrophic bacteria reduces the efficiency of CO2 uptake by the total plankton system, and eventually leads to lower efficiency in counteracting the greenhouse effect. In conclusion, our study demonstrates the usefulness of experimental approach in improving our understanding about carbon cycle processes in marine systems which are difficult to evaluate on the bases of observation of non-manipulated natural processes.
Author Contributions
LH, HT, and VK wrote the manuscript with contributions from all other authors. The mesocosm experiment was designed by RL and bioassays LH. Investigation on bacterial community composition was performed by LH, HT, and VK. LH, HT, KS, RL, and VK took part to the experiments and analyzed the samples. VK was responsible for the bioinformatics. All authors contributed the data analyses.
Conflict of Interest Statement
The authors declare that the research was conducted in the absence of any commercial or financial relationships that could be construed as a potential conflict of interest.
Acknowledgments
Eero Asmala and staff of Tvärminne Zoological station, especially laboratory technicians Mervi Sjöblom, and Elina Salminen are thanked for their valuable contribution during sampling and laboratory work. Johanna Oja is thanked for phytoplankton and zooplankton microscopy. The study was funded by the Academy of Finland project “The response of pelagial food web to nutrient enrichment” (#116677), Walter and Andrée de Nottbeck Foundation and by the European Social Fund (programme Mobilitas grant MJD 173).
References
Alonso-Sáez, L., and Gasol, J. M. (2007). Seasonal variation in the contribution of different bacterial groups to the uptake of low molecular weight-compounds in NW Mediterranean coastal waters. Appl. Environ. Microbiol. 73, 3528–3535. doi: 10.1128/AEM.02627-06
Alonso-Sáez, L., Unanue, M., Latatu, A., Azua, I., Ayo, B., Artolozaga, I., et al. (2009). Changes in marine prokaryotic community induced by varying types of dissolved organic matter and subsequent grazing pressure. J. Plankton Res. 31, 1373–1383. doi: 10.1093/plankt/fbp081
Apple, J. K., and Del Giorgio, P. A. (2007). Organic substrate quality as the link between bacterioplankton carbon demand and growth efficiency in a temperate salt-marsh estuary. ISME J. 1, 729–742. doi: 10.1038/ismej.2007.86
Berg, K. A., Lyra, C., Sivonen, K., Paulin, L., Suomalainen, S., Tuomi, P., et al. (2009). High diversity of cultivable heterotrophic bacteria in association with cyanobacterial water blooms. ISME J. 3, 314–325. doi: 10.1038/ismej.2008.110
Berggren, M., Lapierre, J.-F., and del Giorgio, P. A. (2012). Magnitude and regulation of bacterioplankton respiratory quotient across freshwater environmental gradients. ISME J. 6, 984–993. doi: 10.1038/ismej.2011.157
Børsheim, K. Y., and Bratbak, G. (1987). Cell volume to cell carbon conversion factors for a bacterivorous Monas sp Enriched from seawater. Mar. Ecol. Prog. Ser. 36, 171–175. doi: 10.3354/meps036171
Brinkhoff, T., Fischer, D., Vollmers, J., Voget, S., Beardsley, C., Thole, S., et al. (2012). Biogeography and phylogenetic diversity of a cluster of exclusively marine myxobacteria. ISME J. 6, 1260–1272. doi: 10.1038/ismej.2011.190
Buchan, A., LeCleir, G. R., Gulvik, C. A., and González, J. M. (2014). Master recyclers: features and functions of bacteria associated with phytoplankton blooms. Nat. Rev. Microbiol. 12, 686–698. doi: 10.1038/nrmicro3326
Burnham, J. C., Collart, S. A., and Daft, M. J. (1984). Myxococcal predation of the cyanobacterium Phormidium luridum in aqueous environments. Arch. Microbiol. 137, 220–225. doi: 10.1007/BF00414547
Burnham, J. C., Collart, S. A., and Highison, B. W. (1981). Entrapment and lysis of the cyanobacterium Phormidium luridum by aqueous colonies of Myxococcus xanthus PCO2. Arch. Microbiol. 129, 285–294. doi: 10.1007/BF00414699
Carlson, C. A., Ducklow, H., Hansell, D. A., and Smith, W. O. Jr. (1998). Organic carbon partitioning during spring phytoplankton blooms in the Ross Sea polynya and the Sargasso Sea. Limnol. Oceanogr. 43, 375–386. doi: 10.4319/lo.1998.43.3.0375
Carlson, C. A., Ducklow, H. W., and Michaelis, A. F. (1994). Annual flux of dissolved organic carbon from the euphotic zone in the northwestern Sargasso Sea. Nature 371, 405–408. doi: 10.1038/371405a0
Copin-Montégut, G., and Avril, B. (1993). Vertical distribution and temporal variation of dissolved organic carbon in the north-western Mediterranean Sea. Deep Sea Res. Part Oceanogr. Res. Pap. 40, 1963–1972. doi: 10.1016/0967-0637(93)90041-Z
Cottrell, M. T., and Kirchman, D. L. (2000). Natural assemblages of marine proteobacteria and members of the Cytophaga-Flavobacter cluster consuming low- and high-molecular-weight dissolved organic matter. Appl. Environ. Microbiol. 66, 1692–1697. doi: 10.1128/AEM.66.4.1692-1697.2000
Dawid, W. (2000). Biology and global distribution of myxobacteria in soils. FEMS Microbiol. Ecol. 24, 403–427. doi: 10.1111/j.1574-6976.2000.tb00548.x
del Giorgio, P. A., and Cole, J. J. (1998). Bacterial growth efficiency in natural aquatic systems. Annu. Rev. Ecol. Syst. 29, 503–541. doi: 10.1146/annurev.ecolsys.29.1.503
Donali, E., Olli, K., Heiskanen, A. S., and Andersen, T. (1999). Carbon flow patterns in the planktonic food web of the Gulf of Riga, the Baltic Sea: a reconstruction by the inverse method. J. Marine Syst. 23, 251–268. doi: 10.1016/S0924-7963(99)00061-5
Ducklow, H. W., and Carlson, C. A. (1992). “Oceanic bacterial productivity,” in Advances in Microbial Ecology, ed K. C. Marshall (New York, NY: Plenum Press), 113–181.
Eilers, H., Pernthaler, J., and Amann, R. (2000). Succession of pelagic marine bacteria during enrichment: a close look at cultivation-induced shifts. Appl. Environ. Microbiol. 66, 4634–4640. doi: 10.1128/aem.66.11.4634-4640.2000
Elifantz, H., Malmstrom, R. R., Cottrell, M. T., and Kirchman, D. L. (2005). Assimilation of polysaccharides and glucose by major bacterial groups in the Delaware Estuary. Appl. Environ. Microbiol. 71, 7799–7805. doi: 10.1128/AEM.71.12.7799-7805.2005
Elmgren, R. (1984). Trophic dynamics in the enclosed, brackish Baltic Sea. Rapp. P-v. Réun. Cons. Int. Explor. Mer. 183, 152–169.
Eronen-Rasimus, E., Kaartokallio, H., Lyra, C., Autio, R., Kuosa, H., Dieckmann, G. S., et al. (2014). Bacterial community dynamics and activity in relation to dissolved organic matter availability during sea-ice formation in a mesocosm experiment. Microbiologyopen 3, 139–156. doi: 10.1002/mbo3.157
Gasol, J. M., Pinhassi, J., Alonso-Sáez, L., Ducklow, H., Herndl, G. J., Koblízek, M., et al. (2008). Towards a better understanding of microbial carbon flux in the sea. Aquat. Microb. Ecol. 53, 21–38. doi: 10.3354/ame01230
Gasol, J. M., Zweifel, U. L., Peters, F., Fuhrman, J. A., and Hagström, Å. (1999). Significance of size and nucleic acid content heterogeneity as measured by flow cytometry in natural planktonic bacteria. Appl. Environ. Microbiol. 65, 4475–4483.
Giovannoni, S. J., Tripp, H. J., Givan, S., Podar, M., Vergin, K. L., Baptista, D., et al. (2005). Genome streamlining in a Cosmopolitan Oceanic bacterium. Science 309, 1242–1245. doi: 10.1126/science.1114057
Gómez-Consarnau, L., Lindh, M. V., Gasol, J. M., and Pinhassi, J. (2012). Structuring of bacterioplankton communities by specific dissolved organic carbon compounds. Environ. Microbiol. 14, 2361–2378. doi: 10.1111/j.1462-2920.2012.02804.x
Grasshoff, K., Erhardt, M., and Kremling, K. (1983). Methods of Seawater Analysis, 2 Edn. Weinheim: Verlag Chemie.
Gusstafsson, E., Deutsch, B., Gustafsson, B. G., Humborg, C., and Mörth, C.–M. (2014). Carbon cycling in the Baltic Sea - The fate of allochthonous organic carbon and its impact on air-sea CO2 exchange. J. Marine Syst. 129, 289–302. doi: 10.1016/j.jmarsys.2013.07.005
Hagström, Å., Pinhassi, J., and Zweifel, U. L. (2000). Biogeographical diversity among marine bacterioplankton. Aquat. Microb. Ecol. 121, 231–244. doi: 10.3354/ame021231
Herlemann, D. P. R., Labrenz, M., Jürgens, K., Bertilsson, S., Waniek, J. J., and Andersson, A. F. (2011). Transitions in bacterial communities along the 2000 km salinity gradient of the Baltic Sea. ISME J. 5, 1571–1579. doi: 10.1038/ismej.2011.41
Hoikkala, L., Aarnos, H., and Lignell, R. (2009). Changes in nutrient and carbon availability and temperature as factors controlling bacterial growth in the Northern Baltic Sea. Estuar. Coast. 32, 720–733. doi: 10.1007/s12237-009-9154-z
Hoikkala, L., Kortelainen, P., Soinne, H., and Kuosa, H. (2015). Dissolved organic matter in the Baltic Sea - review. J. Marine Syst. 142, 47–61. doi: 10.1016/j.jmarsys.2014.10.005
Hoikkala, L., Lahtinen, T., Perttilä, M., and Lignell, R. (2012). Seasonal dynamics of dissolved organic matter on a coastal salinity gradient in the northern Baltic Sea. Cont. Shelf. Res. 45, 1–14. doi: 10.1016/j.csr.2012.04.008
Hopkinson, C. S., and Vallino, J. J. (2005). Efficient export of carbon to the deep ocean through dissolved organic matter. Nature 433, 142–145. doi: 10.1038/nature03191
Jespersen, A. M., and Christoffersen, K. (1987). Measurements of chlorophyll-a from phytoplankton using ethanol as extraction solvent. Arch. Hydrobiol. 109, 445–454.
Keil, R. G., and Kirchman, D. L. (1999). Utilization of dissolved protein and amino acids in the northern Sargasso Sea. Aquat. Microb. Ecol. 18, 293–300. doi: 10.3354/ame018293
Kisand, V., Andersson, N., and Wikner, J. (2005). Bacterial freshwater species successfully immigrate to the brackish water environment in the northern Baltic. Limnol. Ocean. 50, 945–956. doi: 10.4319/lo.2005.50.3.0945
Koskinen, K., Hultman, J., Paulin, L., Auvinen, P., and Kankaanpää, H. (2011). Spatially differing bacterial communities in water columns of the northern Baltic Sea. FEMS Microbiol. Ecol. 75, 99–110. doi: 10.1111/j.1574-6941.2010.00987.x
Kuliński, K., and Pempkowiak, J. (2011). The carbon budget of the Baltic Sea. Biogeosciences 8, 3219–3230.
Kulinski, K., She, J., and Pempkowiak, J. (2011). Short and medium term dynamics of the carbon exchange between the Baltic Sea and the North Sea. Cont. Shelf. Res. 31, 1611–1619. doi: 10.1016/j.csr.2011.07.001
Lauro, F. M., McDougald, D., Thomas, T., Williams, T. J., Egan, S., Rice, S., et al. (2009). The genomic basis of trophic strategy in marine bacteria. Proc. Natl. Acad. Sci. U.S.A. 106, 15527–15533. doi: 10.1073/pnas.0903507106
Li, W., Fu, L., Niu, B., Wu, S., and Wooley, J. (2012). Ultrafast clustering algorithms for metagenomic sequence analysis. Brief. Bioinform. 13, 656–668. doi: 10.1093/bib/bbs035
Lignell, R., Haario, H., Laine, M., and Thingstad, T. F. (2013). Getting the “right” parameter values for models of the pelagic microbial food web. Limnol. Oceanogr. 58, 301–313. doi: 10.4319/lo.2013.58.1.0301
Lignell, R., Hoikkala, L., and Lahtinen, T. (2008). Effects of inorganic nutrients, glucose and solar radiation on bacterial growth and exploitation of dissolved organic carbon and nitrogen in the northern Baltic Sea. Aquat. Microb. Ecol. 51, 209–221. doi: 10.3354/ame01202
Lignell, R., Seppälä, J., Kuuppo, P., Tamminen, T., Andersen, T., and Gismervik, I. (2003). Beyond bulk properties: responses of coastal summer plankton communities to nutrient enrichment in the northern Baltic Sea. Limnol. Oceanogr. 48, 189–209. doi: 10.4319/lo.2003.48.1.0189
Lignell, R. (1990). Excretion of organic carbon by phytoplankton: its relation to algal biomass, primary productivity and bacterial secondary productivity in the Baltic Sea. Mar. Ecol. Prog. Ser. 68, 85–99. doi: 10.3354/meps068085
Lønborg, C., and Søndergaard, M. (2009). Microbial availability and degradation of dissolved organic carbon and nitrogen in two coastal areas. Estuar. Coast. Shelf. Sci. 81, 513–520. doi: 10.1016/j.ecss.2008.12.009
Malmstrom, R. R., Cottrell, M. T., Elifantz, H., and Kirchman, D. L. (2005). Biomass production and assimilation of dissolved organic matter by SAR11 bacteria in the Northwest Atlantic Ocean. Appl. Environ. Microbiol. 71, 2979–2986. doi: 10.1128/AEM.71.6.2979-2986.2005
Marie, D., Vaulot, D., and Partensky, F. (1996). Application of the novel nucleic acid dyes YOYO-1, YO-PRO-1, and PicoGreen for flow cytometric analysis of marine prokaryotes. Appl. Environ. Microbiol. 62, 1649–1655.
Masella, A. P., Bartram, A. K., Truszkowski, J. M., Brown, D. G., and Neufeld, J. D. (2012). PANDAseq: paired-end assembler for illumina sequences. BMC Bioinformatics 13:31. doi: 10.1186/1471-2105-13-31
Massana, R., Gasol, J. M., Bjørnsen, P. K., Blackburn, M., Hagström, Å., Hietanen, S., et al. (1997). Measurement of bacterial size via image analysis of epifluorescence preparations: description of an inexpensive system and solutions to some of the most common problems. Sci. Mar. 61, 397–407.
Norland, S. (1993). “The relationship between biomass and volume of bacteria,” in Handbook of Methods in Aquatic Microbial Ecology, eds P. F. Kemp, B. F. Sherr, E. B. Sherr and J. J. Cole (Boca Raton, FL: CRC press), 303–306.
Osburn, C. L., and Stedmon, C. A. (2011). Linking the chemical and optical properties of dissolved organic matter in the Baltic–North Sea transition zone to differentiate three allochthonous inputs. Mar. Chem. 126, 281–294. doi: 10.1016/j.marchem.2011.06.007
Pinhassi, J., Sala, M. M., Havskum, H., Peters, F., Guadayol, O., Malits, A., et al. (2004). Changes in bacterioplankton composition under different phytoplankton regimens. Appl. Environ. Microbiol. 70, 6753–6766. doi: 10.1128/AEM.70.11.6753-6766.2004
Pruesse, E., Peplies, J., and Glöckner, F. O. (2012). SINA: accurate high-throughput multiple sequence alignment of ribosomal RNA genes. Bioinformatics 28, 1823–1829. doi: 10.1093/bioinformatics/bts252
Riemann, B., Bjørnsen, B. K., Newell, S., and Fallon, R. (1987). Calculation of cell production of coastal marine bacteria based on measured incorporation of [3H] thymidine. Limnol. Oceanogr. 32, 471–476. doi: 10.4319/lo.1987.32.2.0471
Riemann, L., Steward, G. F., and Azam, F. (2000). Dynamics of bacterial community composition and activity during a mesocosm diatom bloom. Appl. Environ. Microbiol. 66, 578–587. doi: 10.1128/AEM.66.2.578-587.2000
Sarmento, H., and Gasol, J. M. (2012). Use of phytoplankton-derived dissolved organic carbon by different types of bacterioplankton. Environ. Microbiol. 14, 2348–2360. doi: 10.1111/j.1462-2920.2012.02787.x
Shimkets, L. J., Dworkin, M., and Reichenbach, H. (2006). “The myxobacteria,” in Prokaryotes Vol. 7, eds M. Dworkin, S. Falkow, E. Rosenberg, K.-H. Schleifer and E. Stackebrandt (Singapore: Springer), 31–115.
Smith, D. C., and Azam, F. (1992). A simple, economical method for measuring bacterial protein synthesis rates in seawater using 3H-Leucine. Aquat. Microb. Ecol. 6, 107–114.
Solórzano, L., and Sharp, J. H. (1980). Determination of total dissolved phosphorus and particulate phosphorus in natural waters. Limnol. Oceanogr. 25, 754–758.
Søndergaard, M., Borch, N. H., and Riemann, B. (2000). Dynamics of biodegradable DOC produced by freshwater plankton communities. Aquat. Microb. Ecol. 23, 73–83. doi: 10.3354/ame023073
Spring, S., Scheuner, C., Göker, M., and Klenk, H.-P. (2015). A taxonomic framework for emerging groups of ecologically important marine gammaproteobacteria based on the reconstruction of evolutionary relationships using genome-scale data. Front. Microbiol. 6:281. doi: 10.3389/fmicb.2015.00281
Strayer, D. (1988). On the limits of secondary production. Limnol. Oceanogr. 33, 1217–1220. doi: 10.4319/lo.1988.33.5.1217
Tammert, H., Lignell, R., Kisand, V., and Olli, K. (2012). Labile carbon supplement induces growth of filamentous bacteria in the Baltic Sea. Aquat. Biol. 15, 121–134. doi: 10.3354/ab00424
Teeling, H., Fuchs, B. M., Becher, D., Klockow, C., Gardebrecht, A., Bennke, C. M., et al. (2012). Substrate-controlled succession of marine bacterioplankton populations induced by a phytoplankton bloom. Science 336, 608–611. doi: 10.1126/science.1218344
Teira, E., Martínez-García, S., Calvo-Díaz, A., and Moran, X. A. G. (2010). Effects of inorganic and organic nutrient inputs on bacterioplankton community composition along a latitudinal transect in the Atlantic Ocean. Aquat. Microb. Ecol. 60, 299–313. doi: 10.3354/ame01435
Teira, E., Martinez-Garcia, S., Lønborg, C., and Alvarez-Salgado, X. A. (2009). Growth rates of different phylogenetic bacterioplankton groups in a coastal upwelling system. Environ. Microbiol. Rep. 1, 545–554. doi: 10.1111/j.1758-2229.2009.00079.x
Thingstad, T. F., and Lignell, R. (1997). Theoretical models for the control of bacterial growth rate, abundance, diversity and carbon demand. Aquat. Microb. Ecol. 13, 19–27. doi: 10.3354/ame013019
Williams, P. J. L. (2000). “Heterotrophic bacteria and the dynamics of dissolved organic material,” in Microbial Ecology of the Oceans, ed D. Kirchman (New York, NY: Wiley-Liss), 153–200.
Williams, P. M., and Druffel, E. R. M. (1987). Radiocarbon in dissolved organic matter in the central North Pacific Ocean. Nature 330, 246–248. doi: 10.1038/330246a0
Yooseph, S., Nealson, K. H., Rusch, D. B., McCrow, J. P., Dupont, C. L., Kim, M., et al. (2010). Genomic and functional adaptation in surface ocean planktonic prokaryotes. Nature 468, 60–66. doi: 10.1038/nature09530
Keywords: Gulf of Finland, the Baltic Sea, cyanobacterial bloom, bacterial community composition, mesocosm experiments, assimilation of DOC
Citation: Hoikkala L, Tammert H, Lignell R, Eronen-Rasimus E, Spilling K and Kisand V (2016) Autochthonous Dissolved Organic Matter Drives Bacterial Community Composition during a Bloom of Filamentous Cyanobacteria. Front. Mar. Sci. 3:111. doi: 10.3389/fmars.2016.00111
Received: 08 February 2016; Accepted: 14 June 2016;
Published: 28 June 2016.
Edited by:
Chuanlun Zhang, Tongji University, ChinaReviewed by:
Michael R. Twiss, Clarkson University, USAZhanfei Liu, The University of Texas at Austin, USA
Copyright © 2016 Hoikkala, Tammert, Lignell, Eronen-Rasimus, Spilling and Kisand. This is an open-access article distributed under the terms of the Creative Commons Attribution License (CC BY). The use, distribution or reproduction in other forums is permitted, provided the original author(s) or licensor are credited and that the original publication in this journal is cited, in accordance with accepted academic practice. No use, distribution or reproduction is permitted which does not comply with these terms.
*Correspondence: Veljo Kisand, a2lzYW5kQHV0LmVl
†These authors have contributed equally to this work.