 Isabel Ferrera
 Caterina R. Giner
 Albert Reñé
 Jordi Camp
 Ramon Massana
 Josep M. Gasol
 Esther Garcés
- Biologia Marina i Oceanografia, Institut de Ciències del Mar, CSIC, Barcelona, Spain
Sequencing of rRNA gene polymerase chain reaction amplicons (rRNA tags) is the most common approach for investigating microbial diversity. The recent development of high-throughput sequencing (HTS) technologies has enabled the exploration of microbial biodiversity at an unprecedented scale, greatly expanding our knowledge on the microbiomes of marine ecosystems. These approaches provide accurate, fast, and cost efficient observations of the marine communities, and thus, may be suitable tools in biodiversity monitoring programs. To reach this goal, consistent and comparable methodologies must be used over time and within sites. Here, we have performed a cross-platform study of the two most common HTS methodologies, i.e., 454-pyrosequencing and Illumina tags to evaluate their usefulness in biodiversity monitoring and assessment of environmental status. Picoplankton biodiversity has been compared through both methodologies by sequencing the 16 and 18 S rRNA genes of a set of samples collected in the coast of Barcelona (NW Mediterranean). The results show that, despite differences observed in the rare OTUs retrieved, both platforms provide a comparable view of the marine picoplankton communities. On a taxonomic level, there was an accurate overlap in the detected phyla between the two methods and the overall estimates of alpha- and betadiversity were comparable. In addition, we explored the concept of “indicator species” and found that certain taxa (i.e., members of the Gammaproteobacteria among others) as well as the ratio between some phylogenetic groups (i.e., the ratio of Alphaproteobacteria/Gammaproteobacteria, Alteromonas/SAR11, and Alteromonas + Oceanospirillales/SAR11) have potential for being useful indicators of environmental status. The data show that implementing new protocols and identifying indicators of environmental status based on rRNA amplicon sequencing is feasible, and that is worth exploring whether the identified indices are universally applicable.
Introduction
The oceans are the largest ecosystem on Earth and provide countless ecosystem services to society (Liquete et al., 2013). Oceans regulate our planet's climate and represent one of the largest carbon reservoirs in the globe. Over a third of the world's population live in coastal areas, but virtually all humans depend to some extent on the ocean. Marine ecosystems provide resources for human survival and well-being, from fishing to natural products used in medicine or biotechnology. However, human-impacted marine ecosystems (i.e., coastal areas) are being increasingly threatened by pressures exerted due to changes in land use, overfishing, climate change, pollution, aquaculture, invasive species and other impacts of a rapidly growing human population (Halpern et al., 2007, 2008). Therefore, there is a need to report on the condition of the marine ecosystem in response to these human pressures, which may have an effect on all the components of the marine food web, from microorganisms to top animal predators (Brown et al., 2010; Claudet and Fraschetti, 2010; Hoegh-Guldberg and Bruno, 2010) and in the ocean services.
Legislation regarding the management of human impacts on the marine environment has been implemented worldwide to protect and conserve marine ecosystems. Several international (United Nations Convention on the Law of the Sea), regional [i.e., Marine Strategy Framework Directive (MSFD) in Europe, Oceans Act in the USA (Birk et al., 2012) among others] and local initiatives to protect the oceans exist. These initiatives include a number of criteria and methodological standards for assessing the environmental status of marine waters. The effect of anthropogenic impacts on the marine ecosystem is currently assessed through a variety of approaches (Birk et al., 2012). In any marine environmental assessment carried out for legislative or non-legislative reasons, there is a need to develop and test indicators at the species, habitat and ecosystem level. There is also a need for the cost-effective implementation of these indicators by defining monitoring and assessment strategies that are as simple, fast, and cheap as possible.
Among the different biological components of the marine ecosystem potentially used as indicators, the least known are the microbial communities, which are the major contributors to global marine diversity, and are a dominant component of the whole aquatic biota in terms of biomass and activity. Furthermore, they play a crucial role in its contribution to primary production and processing of organic matter (Kirchman, 2008). Microorganisms are the smallest biotic components and their intrinsic growth rates are the fastest among all biological components of natural aquatic systems. Microbial communities increase cell numbers as response to nutrients inputs, and as a consequence decrease their diversity, which also occurs in response to events of acute contamination (see review by Nogales et al., 2011). Since microorganisms are the fastest biotic responders to environmental changes, their abundances, community composition (i.e., the taxa present and their relative abundances) and relative indications of their activity have the potential for becoming useful indicators of ecosystem condition. Indeed, microbial indicators have been proposed in several legislative directives, such as the MSFD descriptors of biodiversity, food webs, eutrophication, and seafood contaminants. Including microbes in future monitoring programs has already been suggested (Caruso et al., 2015), and an intense research on this direction is being carried out particularly since the introduction of genetic methodologies.
Genetic technologies have the potential to provide accurate, rapid, and cost efficient observations of the marine environment. Molecular methods also represent a reliable taxonomic identification tool especially for organisms lacking conspicuous morphological traits such as microorganisms. Several molecular methods have been proposed for integration into existing monitoring programs (e.g., qPCR, SNP based methods, DNA barcoding, microarrays, metagenomics, metatranscriptomics; see review by Bourlat et al., 2013). Among those, DNA tagging (i.e., DNA barcoding or assigning taxonomy to a specimen/sample by sequencing a short DNA fragment) has a high potential for marine monitoring and assessment because of its relatively low cost and easy standardization once a reference database has been built.
The recent development of high-throughput sequencing (HTS) technologies has enabled the exploration of microbial biodiversity at an unprecedented scale, greatly expanding our knowledge on the microbiomes of different ecosystems (Cho and Blaser, 2012; Gilbert et al., 2014) including the oceans (Ferrera et al., 2015; Moran, 2015). Sequencing of rRNA gene polymerase chain reaction amplicons (rRNA tags) is currently the most common approach for investigating microbial biodiversity. Because this approach provides accurate, fast and cost efficient observations of the marine environment, it may be a suitable tool in biodiversity monitoring programs. While the potential for this method exists, testing and pilot studies are needed to answer relevant questions, for example, their benefits as compared to more traditional methods, and to test their general applicability (Bourlat et al., 2013).
In this study we evaluated two of the most commonly used HTS methodologies, i.e., 454-pyrosequencing (from now on 454) and Illumina, to study marine picoplanktonic biodiversity and explored their use in the assessment of ecosystem health status. The 454 method has been the most popular methodology since the development of HTS as it was the first to become commercially available and offers relatively long read length. The International Census of Marine Microbes program (Huse et al., 2008) used this approach. In contrast, Illumina provides shorter reads but offers significantly greater throughput than 454 at lower cost (Glenn, 2011) and is becoming the most popular deep sequencing platform for diversity applications, including the Earth Microbiome Project (Gilbert et al., 2014). Currently, only a few cross-platform studies are available; these two methodologies have been compared in metagenomic studies (Luo et al., 2012), and other applications such identifying single nucleotide substitutions in whole genome sequences (Ratan et al., 2013). Regarding tag sequencing, comparisons have been performed in lake, soil or human samples (Claesson et al., 2010; Sinclair et al., 2015). The initial results showed that the taxonomic classification of reads from the first Illumina sequencers was worse than 454 due to their shorter length and higher error rates (Claesson et al., 2010). Nonetheless, the improvement in quality and length reads of later Illumina sequencers has shown promising results; Illumina performed in a similar manner than 454 with regards to estimates of alpha- and betadiversity except when estimating evenness in soil and lake samples (Sinclair et al., 2015). Here, a careful comparison of the performance of sequencing 16 and 18 S (for marine planktonic prokaryotes and small Picoeukaryotes, respectively) rRNA gene tags by using 454 and Illumina (pair-ended 2 × 250 bp) has been performed to determine and quantify marine picoplankton biodiversity, and the robustness of the results has been tested. The results show minor differences in the performance of both sequencing methodologies for rare taxa, but overall both methodologies provide a comparable view of marine planktonic biodiverstity. Moreover, we also show that certain taxa as well as the ratio between some phylogenetic groups may be good indicators of ecosystem health status. HTS may thus provide valuable information for the assessment of the environmental status in marine waters.
Materials and Methods
Sample Collection and Basic Data
Surface waters were collected on 8th Aug 2013 in a 6 km inshore to offshore transect off the coast of Barcelona, NW Mediterranean. Five stations were sampled along the transect (Figure 1). Samples were sieved through a 200-μm mesh and transported to the laboratory within 2 h. Basic physical data was measured in situ with a conductivity, temperature and depth probe and surface salinity was analyzed with an AUTOSAL salinometer. The concentration of inorganic nutrients was determined spectrophotometrically by using an Alliance Evolution II autoanalyzer according to standard procedures (Grasshoff et al., 1983). Chlorophyll a (Chl a) concentration was measured from acetone extracts by fluorometry from the total fraction (< 200 μm) and the fractions less than 20 and 3 μm. To collect microbial biomass, about 5 l of surface seawater was sequentially filtered through a 3- and a 0.2-μm pore-size polycarbonate filters (Poretics, GE Osmotics, Delft, Netherlands) using a peristaltic pump. The filters were stored in cryogenic vials containing 1.7 ml of lysis buffer (50 mM Tris-HCl pH 8.3, 40 mM EDTA pH 8.0 and 0.75 M sucrose) at −80°C until further processing.
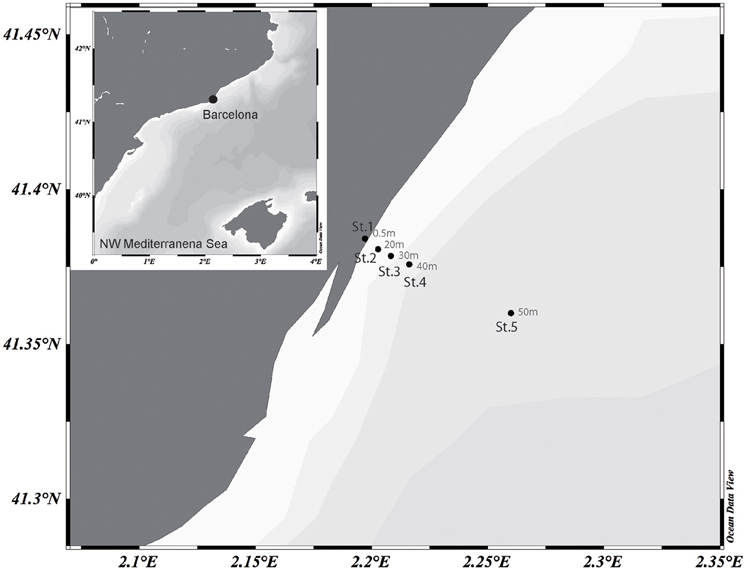
Figure 1. Map showing the transect sampled off the coast of Barcelona in the NW Mediterranean Sea. Station location and depths (m) are indicated. The map was generated with the Ocean Data View Software (https://odv.awi.de).
DNA Extraction and Sequencing
The 0.2-μm filters were treated with lysozyme, proteinase K and sodium dodecyl sulfate, and the nucleic acids were extracted with phenol and concentrated in an Amicon 100 (Millipore), as described in Massana et al. (1997). DNA was quantified spectrophotometrically (Nanodrop, Thermo Scientific), and two subsamples from each extraction were sent for sequencing. Sequencing was performed by the Research and Testing Laboratory (Lubbock, TX, USA; http://www.researchandtesting.com/). Primers 341F (5′-CCTACGGGNGGCWGCAG-3′), and 805R (5′-GACTACHVGGGTATCTAATCC-3′) were used to amplify bacterial 16 S rRNA gene (Herlemann et al., 2011) and primers TAReukFWD1 5′-CCAGCASCYGCGGTAATTCC-3′ and TAReukREV3 5′-ACTTTCGTTCTTGATYRA-3′ were used to amplify the V4 region of the eukaryotic 18 S rRNA gene (Stoeck et al., 2010). Pyrosequencing was performed using the bTEFAP method by 454 GL FLX technology as described previously (Dowd et al., 2008). Illumina MiSeq 2 × 250 flow cells were used for Illumina sequencing following protocols described elsewhere (Cúcio et al., 2016). Approximately 30,000 raw sequences per sample were obtained.
Data Analyses
High-Performance computing analyses were run at the Marine Bioinformatics Service of the Institut de Ciències del Mar (ICM-CSIC) in Barcelona. Reads from the two sequencing methodologies underwent method-specific quality filtering before being pooled. Bacterial-454 data was filtered by quality using QIIME (Quantitative Insights Into Microbial Ecology, Caporaso et al., 2010) as described in Sánchez et al. (2013). Briefly, sequences from the 454 run were assigned a sample IDs using a mapping file and the barcode assigned to each sample. After sample IDs were assigned, bacterial sequences were removed from the subsequent analyses if they were shorter than 150 bp or longer than 500 bp, had an average quality score < 25 calculated in sliding windows of 50 bp, contained more than two ambiguous characters or had an uncorrectable barcode. Eukaryotic-454 reads were quality checked and demultiplexed with QIIME following the same parameters described in Pernice et al. (2015). Shortly, sequences shorter than 150 bp or longer than 600 bp, with more than three mismatches in the primer, or having homopolymers longer than 8 bp were removed. Phred quality was analyzed in 50 bp running windows. Illumina sequences from bacteria and picoeukaryotes were quality filtered following a custom made pipeline (https://github.com/ramalok). Briefly, BayesHammer error correction of sequence reads was performed with SPAdes software (Nurk et al., 2013). Sequences were assembled with PEAR (http://pear.php.net/) and quality filtered in UPARSE (fastq_maxee value = 1). Clean bacterial-454 and bacterial-Illumina sequences were pooled and processed together; eukaryotic-454 and eukaryotic-Illumina sequences were also pooled together. Since 454 and Illumina sequences may have different length, bacterial sequences were truncated at equal depth (400 bp). However, for picoeukaryotes we did not truncate sequences, since large natural variability in the length of 18 S rRNA from different taxa occur. Sequences of both datasets were clustered into operational taxonomic units (OTUs) at 97% cutoff using the UPARSE algorithm implemented in USEARCH (Edgar, 2013). Both de novo chimera check and by comparison to reference database (SILVA) were done using the UCHIME algorithm (Edgar et al., 2011). Chimeric sequences and singleton OTUs (those represented by a single sequence) were removed. Taxonomic assignment of bacterial OTUs was performed using the BLAST classifier and the version 119 of the SILVA SSURef non-redundant database. OTUs assigned to chloroplasts were removed for subsequent analyses. For picoeukaryotes, OTUs were taxonomically classified by using BLAST against two reference databases: PR2 (Guillou et al., 2013) and a marine microeukaryote database (MASS9013, Pernice et al., 2013). After taxonomic assignment, metazoan OTUs were removed. Sequence data has been submitted to the Genbank Sequence Read Archive under accession number SRP079955.
Statistical analyses were performed using the R statistical software (R Developement Core Team, 2015) and the packages vegan, labdsv, venneuler, hmisc, and corrgram. Alpha- and betadiversity analyses were performed using an OTU abundance table that was previously subsampled down to the minimum number of reads in order to avoid artifacts due to an uneven sequencing effort among samples. For alphadiversity analyses, we calculated the Chao1 index as a measure of richness and Shannon and Simpson indices as diversity metrics. Differences in microbial composition (betadiversity) were assessed using hierarchical clustering of Bray-Curtis dissimilarity matrices and the Unweighted Pair Group Method with Arithmetic Mean algorithm (UPGMA). To search for “indicator species” we used the IndVal (INDicator VALues; Dufrêne and Legendre, 1997) analysis, which identifies indicator species based on OTU fidelity and relative abundance. Only OTUs with significant p-values (< 0.05), and >0.3 IndVal values were considered. To assess links between diversity and environmental data we performed linear regressions and pairwise correlations (Pearson's correlation coefficient). The results were thresholded at p < 0.05. Analysis of variance was run to test for differences among diversity data and categories (sequencing method, station) with Tukey-Kramer post hoc comparisons at the 5% significance.
Results
Five stations were sampled in an inshore-to-offshore transect off the coast of Barcelona. Station 1 was located closest to the shore. The following stations were sampled in increasing depth and distance to the shore (Figure 1). Basic physicochemical data is shown in Table 1. The sampled area is expected to suffer impacts from human activities due to a large urban development, and putatively receiving pollutants from urban and industrial activities (domestic waste, organic and inorganic nutrient enrichment). A decreasing nutrient concentration was observed as distance to shore increased. Despite this variability can in part be associated to natural processes, it can also reflect the degree of human impact (i.e., nutrient enrichment). Concentration of all nutrients measured showed the lowest values in Station 5 (offshore) and higher values closer to the shore.
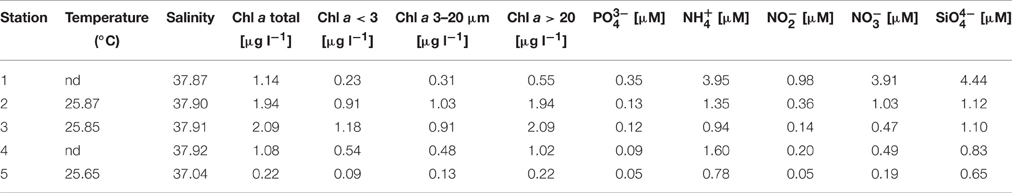
Table 1. Values of physicochemical variables measured along the inshore-to-offshore transect.
Influence of the Sequencing Platform on Microbial Diversity
Sequencing of all bacterial and most picoeukaryotic samples was successful yet two picoeukaryotic replicates (1a, 454, and Illumina) resulted in a low number of reads and were discarded from further analyses. The bacterial dataset resulted in 277,212 high quality reads that clustered in a total of 658 OTUs at 97% similarity. From those only 34.7% of OTUs were shared between samples sequenced by either 454 or Illumina (Figure 2). However, the unique OTUs in each methodology correspond to rare members; the proportion of shared OTUs (350 out of 658) represented 99.4% of the reads. We found a good correlation between the relative abundance of each OTU sequenced by both methodologies (R = 0.87, p < 0.001). Likewise, when grouping OTUs into the main bacterial taxa, a good agreement between contributions obtained by 454 or Illumina was found (R = 0.81, p < 0.001). In both cases, most bacterial sequences were related to the phyla Proteobacteria (average of all bacterial dataset, 72%), Bacteroidetes (20%), and Cyanobacteria (5%). Within the Proteobacteria, the most prevalent classes were the Alpha-(50%) and the Gammaproteobacteria (20%), whereas the Beta-, Delta-, and Epsilon- were present at low relative abundances (grouped as “Other Proteobacteria,” Figure 3). Within the Alphaproteobacteria, the OTUs showing higher relative abundances were affiliated to the Rhodobacterales, Rhodospirillales, Rickettsiales, and the SAR11 clade. The Bacteroidetes were largely represented by members of the Flavobacteriia. The Actinobacteria represented on average 1% of the total reads. Several other groups such as the Acidobacteria, Firmicutes, Gracilibacteria, Parcubacteria, Planctomycetes, and the Verrucomicrobia were also detected but at low read abundances (< 1%) and were grouped as “Other Bacteria” for plotting purposes. Analysis of the variance resulted in no significant differences in the contribution of the major taxa retrieved by each sequencing methodology.
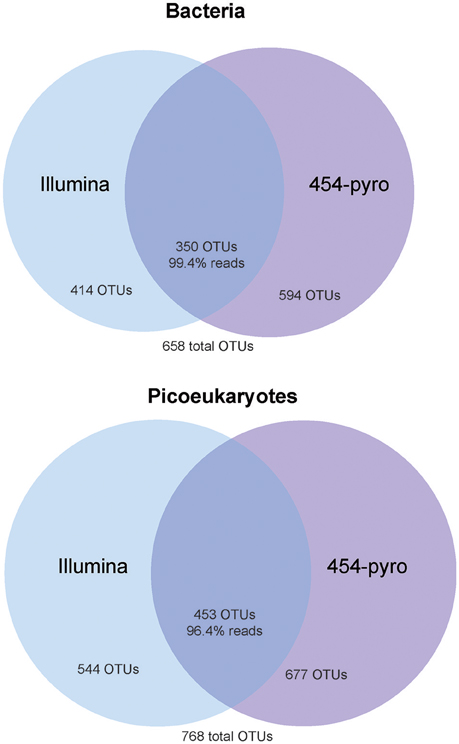
Figure 2. Venn diagrams showing the extent of overlapping and platform-specific OTUs between the 454 and Illumina datasets applied to the bacterial (top) and picoeukaryotic (bottom) analyses.
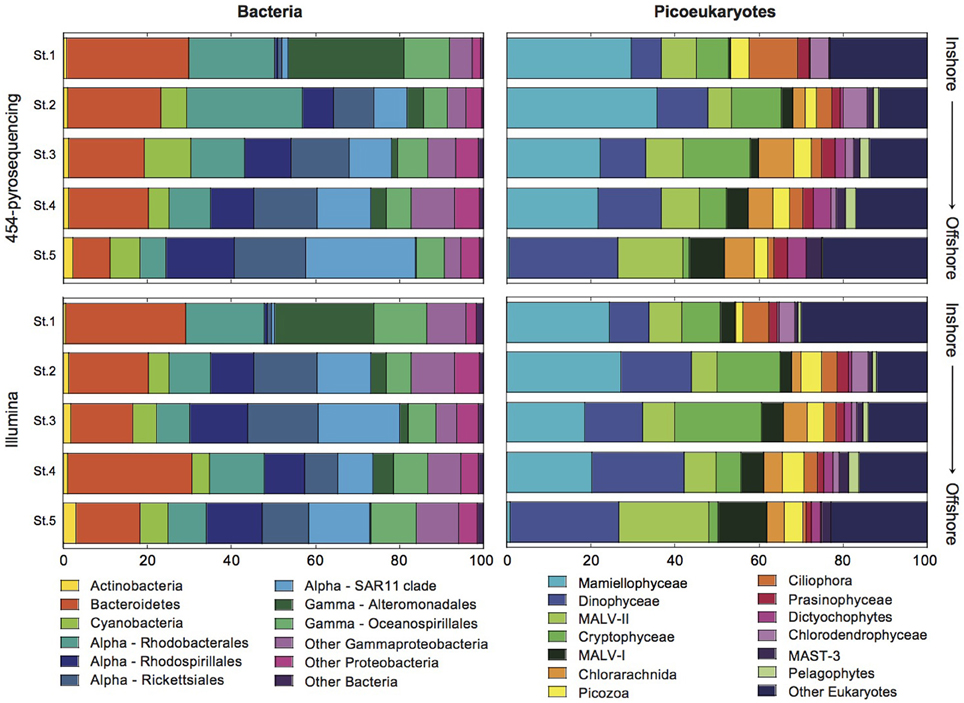
Figure 3. Bar graphs showing the relative contributions of the major bacterial and picoeukaryotic taxa to community structure in the coastal (Station 1) to offshore (Station 5) transect as retrieved using 454 and Illumina sequencing.
A similar pattern was observed for picoeukaryotes (0.2–3 μm size fraction). The 556,143 clean reads were clustered into an OTU table at 97% similarity that contained 768 OTUs; from those only 37.1% were shared between the two methodologies, but these represented the vast majority of reads (96.4%; Figure 2). OTUs recovered with only one of the sequencing methodologies represented very rare members. In fact, as for bacteria, we found very good correlations when comparing the relative abundance of the different taxa both at the OTU level or clustering them at the taxonomic group level (R = 0.84, p < 0.001, and R = 0.91, p < 0.001, respectively; see Figure 3). The picoeukaryotic OTUs were classified into 70 class-level groups. The taxonomic affiliation was dominated by four groups that accounted on average for >55% of the total number of reads within the picoeukaryotic dataset: Mamiellophyceae (19% of the reads, dominated by Micromonas OTUs [97% of Mamiellophyceae]), Dinophyceae (17%), MALV-II (10%), and Cryptophyceae (10%). Other less abundant groups included MALV-I, Chlorarachnida, Picozoa, Prasinophyceae, Dictyochophytes, Chlorodendrophyceae, MAST-3, and Pelagophytes. The remaining 58 taxonomic groups presented very low relative abundances (< 1.1%) and were grouped as “Other Eukaryotes.” No statistically significant differences in the relative abundance retrieved by 454 or Illumina for the difference groups were found.
In order to further explore whether the sequencing methodology had an influence on the bacterial and picoeukaryotic diversity, we calculated various widely used indices of alphadiversity: the Chao 1 index for richness, and the Shannon and Simpson indices for diversity estimation (Hill, 1973; Magurran, 1988; Chao and Lee, 1992; Figure 4). Analysis of variance showed no significant differences between sequencing platforms for any of the indices tested, neither for Bacteria nor for Picoeukaryotes (P > 0.05). Additionally, to infer the variation of the microbial assemblages along the gradients, that is, beta diversity, the Bray–Curtis dissimilarity index was used on community composition. Dissimilarity matrices were constructed based on the relative abundance of each OTU. The distance between samples and replicates was visualized using hierarchical clustering. The results show that, in general, replication was good within each sequencing platform, but replicates sequenced using the same methodology were more similar among each other, which indicates that the sequencing chemistry has a certain influence on the community composition observed (Figure 5). For Bacteria, the samples grouped according to station regardless of the sequencing platform, except for Stations 3 and 4, which grouped by method, indicating that the platform introduces errors and artifacts to a certain extent at the OTU level. A similar trend was observed for the picoeukaryotic dataset, in which samples grouped by station, and in general were more similar among replicates subjected to the same methodology. Yet, in one case, the replicate obtained by Illumina (Illu−4a) was fairly different to the rest of the replicates from the same station. The number of OTUs in Illu-4a sample was much lower than in the other three replicates of Station 4 (one from Illumina and two from 454), indicating some biases in amplification or sequencing of this specific sample.
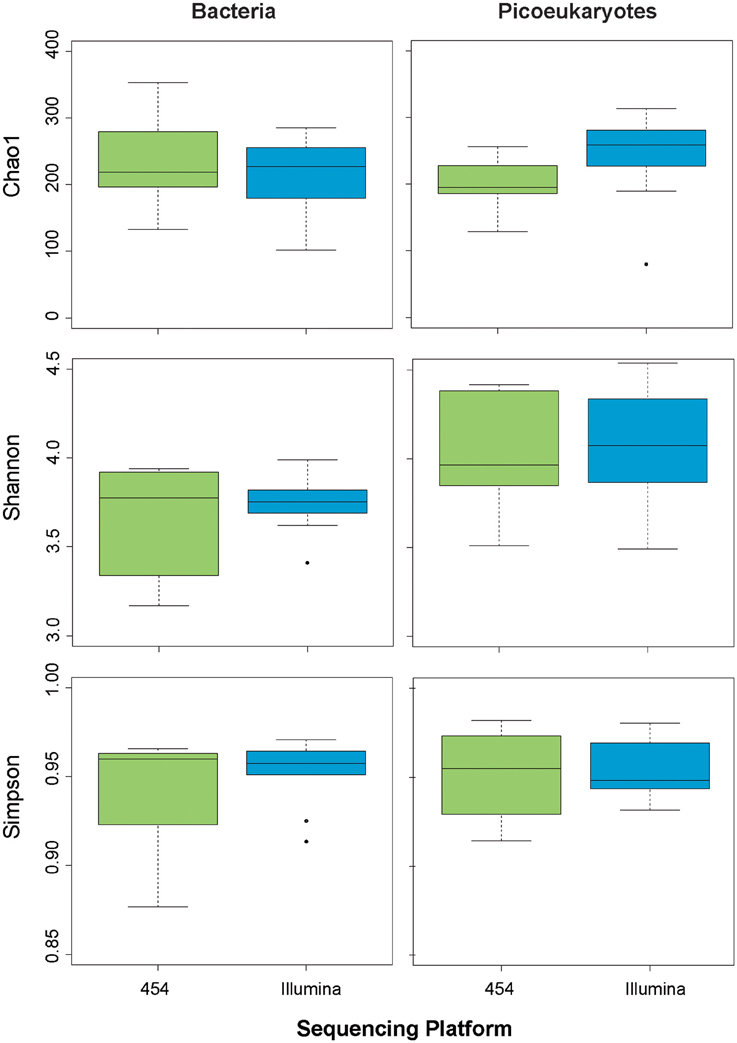
Figure 4. Box plots showing various estimates of alphadiversity (Chao1, Simpson, Shannon) depending on sequencing methodology for bacteria (left panels) and picoeukaryotes (right panels).
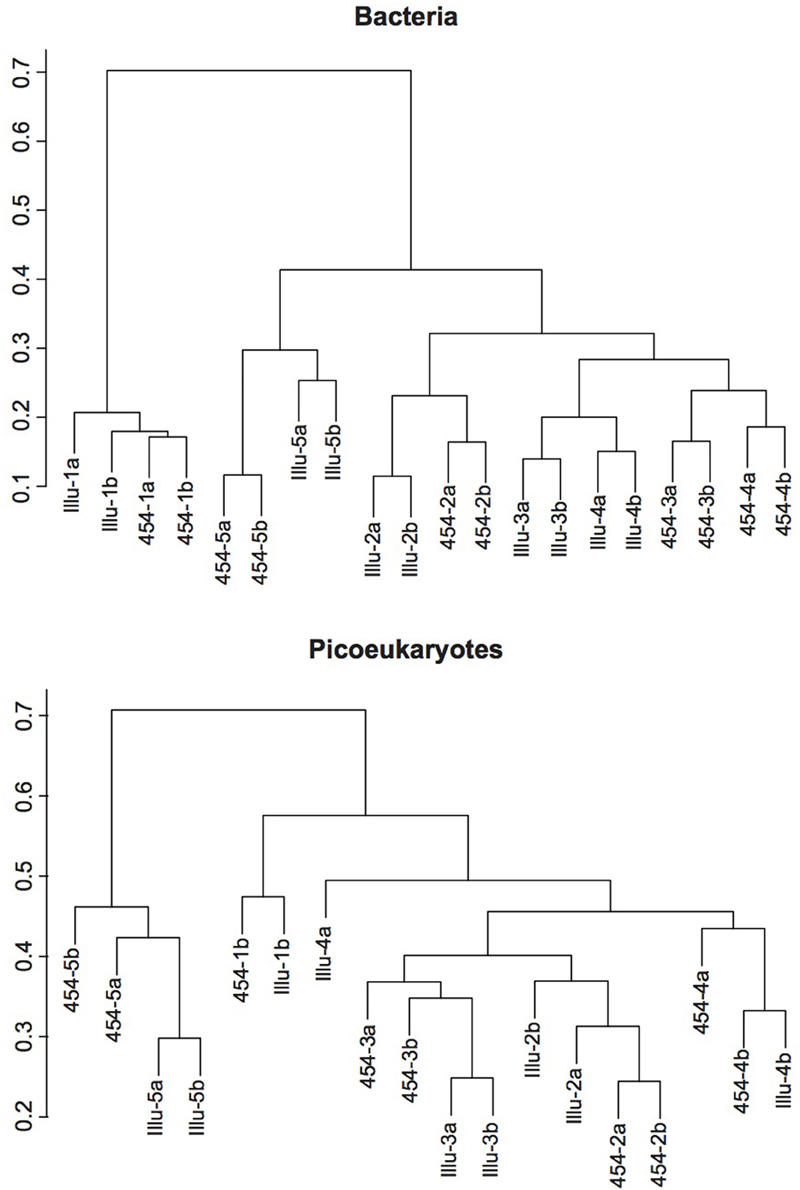
Figure 5. Hierarchical clustering dendograms representing Bray-Curtis dissimilarities for the bacterial (top) and picoeukaryotic (bottom) samples. The samples are coded with the platform used (Illu for Illumina, and 454 for 454-pyrosequencing), the station number (from 1, the coastal station, to 5, the offshore one), and the replicate (a, b).
Bacterial and Picoeukaryotic Plankton Diversity along a Inshore-to-Offshore Gradient
In order to obtain direct descriptors of the bacterial and picoeukaryotic diversity of plankton assemblages, we compared the diversity retrieved along the inshore-to-offshore gradient (Figure 1, Table 1). We observed significant differences in alphadiversity between stations (Figure 6). In particular, significant differences for Chao1 and Simpson indices were found for the bacterial dataset. The Chao1 showed a clear inshore-to-offshore decrease, whereas the Simpson index showed higher values in the transition zone from the coastal to the offshore station (Figure 6). The Shannon index showed a similar trend to the Simpson index but the differences detected were not significant. Interestingly, eukaryotic picoplankton showed a different trend. Whereas the values of Chao1 were quite constant along the gradient, the Shannon and Simpson diversity indices increased from coast to offshore. In fact, statistical analyses (ANOVA) confirmed significant differences, particularly between stations 1 and 5.
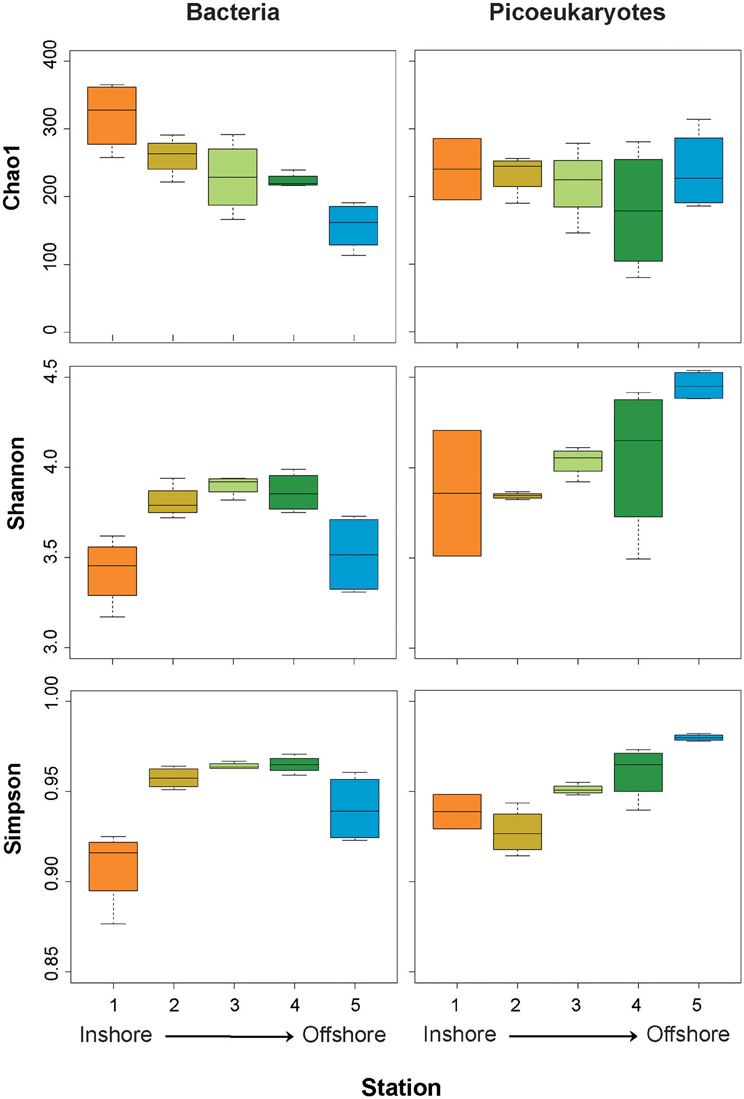
Figure 6. Box plots showing estimates of alphadiversity (Chao1, Simpson, and Shannon indices) from the coastal (Station 1) to the offshore station (Station 5) for bacteria (left panels) and picoeukaryotes (right panels).
In addition, clear inshore-to-offshore changes in community composition were found both for bacteria and eukaryotic picoplankton. The larger differences were detected between Station 1 (coastal) and Station 5 (offshore), whereas a transition in community composition was observed at intermediate stations (Figure 3). In the case of Bacteria, some phylogenetic groups (Phylum, Class, and Order levels) showed a clear increase in their abundance from coast to offshore. These include the phylum Actinobacteria and the orders Rhodospirillales, Rickettsiales, and SAR11 within the class Alphaproteobacteria. An opposite trend was observed for the phylum Bacteroidetes, order Rhodobacterales (Alphaproteobacteria), and orders Alteromonadales and Oceanospirillales of the Gammaproteobacteria. Phylum Cyanobacteria were small contributors to community composition in the coastal station and peaked at Station 3 coinciding with the highest value of Chl a. The greater differences were observed for the order Alteromonadales which represented >25% of the reads in the coastal station and decreased to almost nil in the offshore station. Conversely, the SAR11 clade increased from 1 to >20% of the reads along the transect. Analyses of variance confirmed significant differences between stations for all the above-mentioned groups (details now shown).
The picoeukaryotic community also changed along the gradient being likewise Station 1 the most different from Station 5. The lineage Mamiellophyceae showed similar high relative abundance (>20%) in all stations except in Station 5, where they were virtually absent. The relative abundance of Cryptophyceae increased from Station 1 to Station 3 and then decreased toward offshore stations. Dinophyceae, Dictyochophytes, marine alveolates (MALV-II and MALV-I), and Stramenopiles showed increasing contributions along the transect. Contrarily, Ciliophora were important contributors only in the coastal station. Other groups presented quite constant contributions in all stations (Picozoa, Prasinophyceae, Dictyochophytes; Figure 3).
Potential Indicators of Environmental Status
Potential “indicator species” were explored by calculating the indicator value (IndVal; Dufrêne and Legendre, 1997; Podani and Csányi, 2010) which identifies indicator species based on species (or OTU) fidelity and relative abundance, both for bacterioplankton and eukaryotic picoplankton. The IndVal of a species is a popular measure to express species importance in community ecology. Its potential to measure species explanatory power and to reflect environmental quality has been explored in biodiversity surveys (Gevrey et al., 2010; Keith et al., 2012; Lumbreras et al., 2016). We classified the stations into three categories, i.e., coastal (Station 1), transition (Stations 2, 3, and 4), and offshore (Station 5) and searched for indicator OTUs. We found 114 bacterial OTUs with significant IndVal values, potentially useful as indicator species. However, we considered only those OTUs showing (i) IndVal values >0.3, as this is the value that has been proposed to be a good threshold for habitat specialization (Dufrêne and Legendre, 1997), and (ii) overall relative abundance >1% since the potential as indicator species of rare OTUs is questionable taking into account the differences found between sequencing methods for the rare OTUs and the known biases of the PCR-based methodologies (Polz and Cavanaugh, 1998; Acinas et al., 2005). After selection, the list was reduced to 23 bacterial OTUs. We found OTUs with explanatory power for all three categories. The OTU with higher IndVal value was affiliated to a species of Gammaproteobacteria (Marinobacterium) and was indicative of coastal waters. On the contrary, alphaproteobacterial members of the SAR11 clade were explanatory for offshore waters and mainly Bacteroidetes for the transition zone. Within picoeukaryotes, a total of 164 OTUs with significant values were found but after filtering the table using the same criteria only 13 OTUs were retained. Most of them were explanatory for Station 5 in offshore waters. However, the indicator OTU presenting a higher contribution, OTU1, was classified as Micromonas pusilla, and was indicator for coastal waters in agreement with previous reports that have shown the preference of Micromonas species for coastal waters (Not et al., 2005, 2008). Overall, IndVal values for picoeukaryotic OTUs were lower than for bacterial OTUs. In both cases, the highest values were associated to rare species (details not shown) that were discarded based on abundance data. The selected IndVal scores and associated OTUs are listed in Table 2.
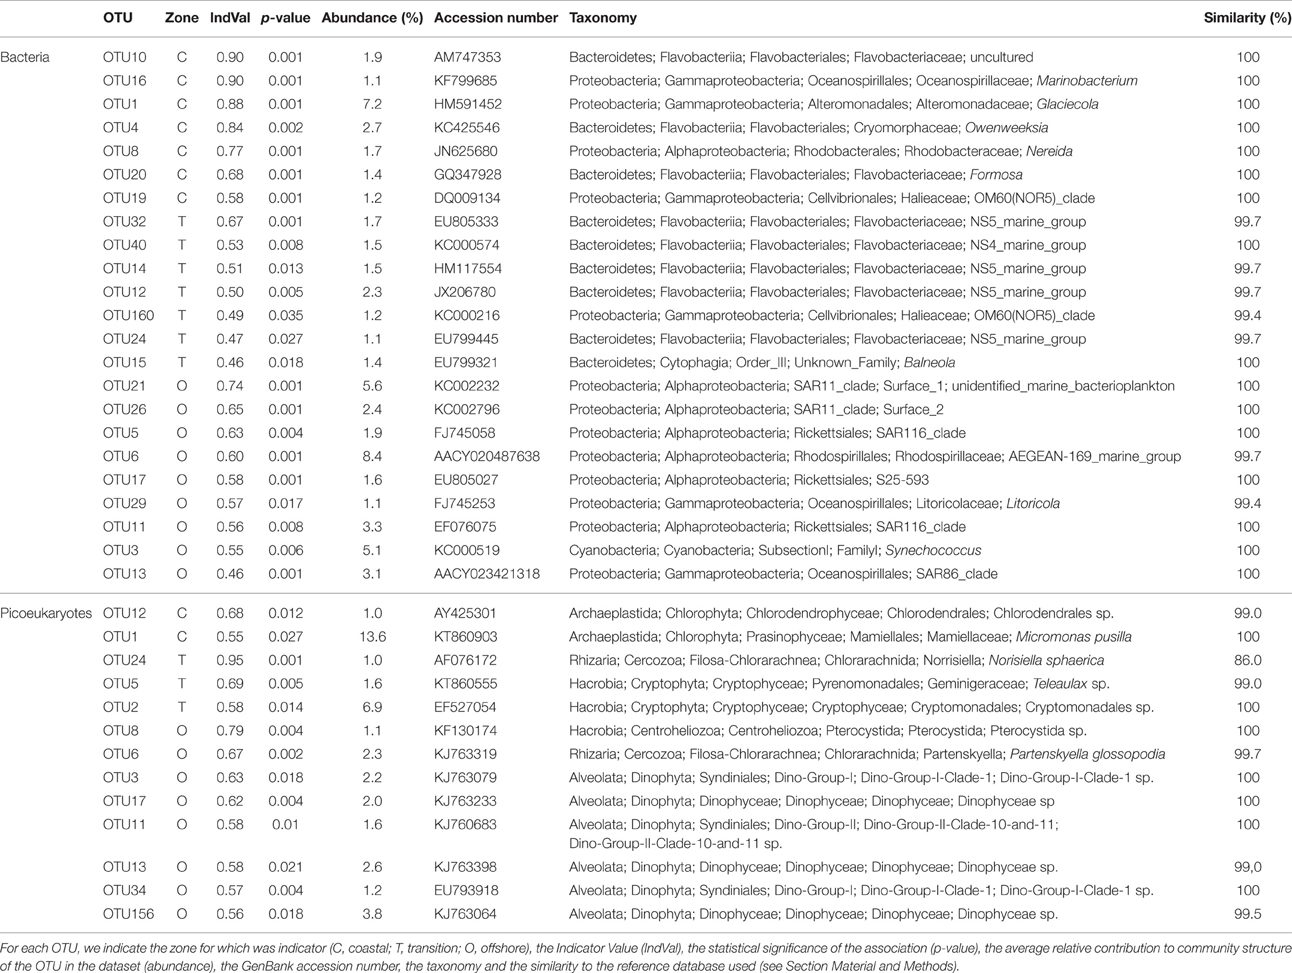
Table 2. Potential indicator OTUs identified with IndVal.
In addition to exploring potential “indicator species,” we explored the microbial profiles as possible descriptors of environmental status. That is, analyzing the relative abundance of the most abundant phylogenetic groups in each sample in relation to the degree of impact. The transect analyzed off the coast of Barcelona reflects a decreasing gradient of human impact from inshore (Station 1) to offshore (Station 5) which is somewhat reflected in the concentration of inorganic nutrients (see Table 1). The analysis of changes in community composition along the gradient together with the OTUs showing highest IndVal scores suggested the exploration of the ratios between taxa as potential indices of ecosystem health status. Interestingly, we found strong positive and negative correlations between the relative abundance of different bacterial groups as well as the ratio between taxa and the concentration of nutrients. The strongest correlation detected was a positive correlation between the relative abundance of Alteromonadales and all nutrients measured (phosphate, nitrite, nitrate, ammonium, silicate, R > 0.96, p < 0.0001). Likewise, the ratios Alphaproteobacteria/Gammaproteobacteria, Alteromonas/SAR11, and Alteromonas + Oceanospirillales/SAR11 were strongly correlated to nutrient concentration (R > 0.90, p < 0.0001). For picoeukaryotes, we found significant correlations between the relative abundance of certain taxa and the nutrient load, yet these correlations were in general weaker than for bacteria. The strongest positive correlations were found for Ciliophora and all nutrients (R = 0.85–0.88, p < 0.0001). Significant negative correlation between Chlorarachnida and nitrite (R = 0.79) and nitrate (R = 0.75) as well as between Dinophyceae and phosphate (R = 0.71) were also observed.
Discussion
Do Different Sequencing Methodologies Provide Comparable Views of Microbial Biodiversity in Marine Ecosystems?
Up to date, several studies have investigated the potential biases on the estimations of richness and evenness in microbial communities associated with the primer selection and the PCR step in amplicon-based studies (Acinas et al., 2005; Hong et al., 2009; Engelbrektson et al., 2010; Parada et al., 2015). However, since cross-platforms studies are rare, currently it is unclear whether the inherent differences in chemistry and sequencing protocols will affect the quality of the sequences and the estimates of genetic diversity and community structure. Furthermore, despite variability is known to be introduced during sample manipulation, PCR amplification and sequencing, the numerous studies on microbial diversity using HTS lack analysis of replicates (Prosser, 2010). For these reasons, we compared the two most frequently used HTS platforms, the Roche 454 FLX Titanium, and the Illumina MiSeq, on a set of DNA samples obtained from an inshore-to-offshore transect in the coast of Barcelona. Additionally, we explored the reproducibility of the results by sequencing replicates. Overall, the platforms provided a comparable view of the marine picoplankton communities but some differences were found when comparing the datasets at the OTU level.
Different HTS platforms produce millions of short sequence reads, which vary in length. It is known that sequence length can impact diversity estimates (Claesson et al., 2010). Nowadays, pair-end Illumina can produce up to 300 bp nucleotide reads, and thus is feasible to do a careful compassion with 454 using the same primer set, providing the same amplicon length, and thus distinguish the performance of both methodologies based only in potential differences in the chemistry of the sequencing. Here, we found that the sequencing methodology does not significantly influence estimates of alphadiversity. No significant differences in Chao1, Shannon, and Simpson indices were found between platforms. A recent study comparing the Illumina and 454 platforms to study bacterial diversity via 16 S rRNA gene amplicons in sediments and soda lakes also found that both methodologies performed in a similar manner and that the general trends in alphadiversity were conserved with the exception of evenness estimates where correspondence between methods was low (Sinclair et al., 2015). It is known that the OTU clustering method can influence the estimates of diversity (Edgar, 2013; Flynn et al., 2015; Sinclair et al., 2015). We used the UPARSE algorithm, which offers an improved accuracy compared to other methods, resulting in fewer OTUs likely closer to the expected number of species in a community (Edgar et al., 2011). Using this methodology may have reduced the influence of sequencing and amplification artifacts and resulted in comparable estimates of diversity by the two sequencing methodologies.
We did observe some differences for betadiversity, that is the variation of the microbial assemblages along the transect, despite the trends identified were in general similar for both methodologies. Replication was good within each sequencing platform but in general replicates were more similar among each other depending on methodology, revealing thus a certain influence of its chemistry. We found that the bacterial communities in Stations 3 and 4 were more similar depending on the method indicating that the platform introduces biases. Oceanographic conditions were quite similar between these two stations (Table 1), and therefore microbial communities could be expected to be fairly similar. Sampling artifacts associated with random sampling (Zhou et al., 2008), PCR biases (Polz and Cavanaugh, 1998; Acinas et al., 2005) or errors directly related to the performance of the technology per se (Berry et al., 2011; Schirmer et al., 2015) can occur at any time, but when comparing samples, the impact of these artifacts will depend on the similarity among those samples. In this case, it is feasible to assume that the potential artifacts associated to the methodology overwhelmed the natural differences between the communities in these closer stations. For picoeukaryotes, in general samples grouped by station as expected, indicating that the sequencing biases, if any, were minor. However, there is one replicate from Station 4 that differs substantially from the other replicates. Problems during PCR amplification or degradation of the DNA could explain this difference.
Venn diagrams showed that less than half of the total OTUs were equally retrieved by both methodologies. However, the non-shared OTUs correspond to very rare contributors of these microbial communities. The concept of the rare biosphere has attracted a lot of attention in the last years (Pedrós-Alió, 2012; see reviews by Lynch and Neufeld, 2015). Microbial communities are dominated by a small number of species that account for most of the biomass and a large number of species that are represented by only a few individuals (rare members). The development of HTS has allowed accessing at least some of these rare microbial species. However, it is known that some of the rare OTUs retrieved in microbial diversity surveys correspond to sequencing errors (Kunin et al., 2010). We discarded the singletons (OTUs represented by a single sequence in the whole dataset) to avoid potential artifacts in diversity estimates. Nevertheless, still over half of the OTUs were only retrieved by one methodology. Part of it can be explained because rare OTUs may or may not appear in a dataset only by random chance but we cannot discard that part of this diversity is due to sequencing errors. For that reason, for the purpose of finding indicator species, we decided to focus only on those OTUs that represented >1% of the total relative abundance. Regardless of the differences in the rare OTUs, the two sequencing technologies revealed very similar profiles when grouping OTUs at the class and family levels (Figure 3). Relative taxa abundances were consistent across technologies and thus, the view of the community composition was fairly comparable. The results show that, due to the improvement in the length of Illumina sequence reads, Illumina tags offer similar classification efficiencies than 454 tags at a much lower cost (Glenn, 2011), being therefore a cost efficient approach for biodiversity monitoring.
Does Plankton Diversity Have Informative Potential for Environmental Status Assessment?
Diversity and trophic state are two quality descriptors for evaluating ecosystem function in the MSFD. Despite the main goal of this work was to compare HTS methodologies for biodiversity monitoring, we further explored whether picoplankton biodiversity can be used as an alternative indicator of environmental status. The Mediterranean Sea is a valuable paradigm to assess anthropic pressure, because of the contrasting nature of its offshore and coastal areas. The offshore waters of the Mediterranean Sea are among the most oligotrophic areas of the world. In these waters, nutrient availability is low and inorganic phosphorus concentrations limit primary production. On the contrary, coastal areas are nutrient rich, as they receive river discharges, runoff from populated areas, and submarine groundwater, but they are also influenced by offshore oceanographic conditions. The coastal marine zone is therefore a transitional area characterized by strong physical, chemical, and biological gradients that extend from land to sea. Here, biological production is closely coupled to processes that deliver nutrients to surface waters. Anthropogenic forcing clearly influences the absolute availability of these nutrients and their stoichiometry, both of which impact phytoplankton productivity and species composition (Camp et al., 2015). The studied transect is expected to have a decreasing degree of anthropogenic pressure as the distance from the coast increases (from Station 1 to 5). Concentration of inorganic nutrients, as indication of eutrophication, showed indeed a decreasing concentration. We determined common alphadiversity indices as possible descriptors of the environmental status since pressures can lead to changes in microbial composition (Torsvik et al., 2002; Smith and Schindler, 2009) and those could reflect variations in biodiversity. For bacteria, Shannon and Simpson indices showed a similar trend with higher values at intermediate stations of the transect. The observed trend could be explained by the “intermediate disturbance hypothesis” (Connell, 1978), which suggests that intermediate intensity of disturbance maximizes diversity, and therefore systems with low and high disturbance, such Stations 5 and 1 in terms of nutrient load, can harbor similar levels of diversity. In any case, as previously observed in other systems (Garrido et al., 2014) these indices do not seem promising as indicators to asses environmental status. Contrarily, a clear decrease in richness was observed from coast to offshore. A sharp decrease of richness from coastal to offshore locations in the NW Mediterranean has been previously documented (Pommier et al., 2010). On the other hand, an increase in Shannon and Simpson indices was observed along the transect for picoeukaryotes, indicating a higher diversity in more oligotrophic stations (Cheung et al., 2010). Furthermore, the most abundant OTU in all stations but Station 5, Micromonas, is known to be more common in coastal areas than open ocean (Not et al., 2005), possibly related to higher nutrient load in coastal waters. The results found here suggest that it may be worth exploring the links between bacterial and picoeukaryotic diversity and environmental status on coastal waters over time and space covering a wide range of impacts.
Traditionally, several species of plants and animals have been and still are being used as indicator species for different types of pollution in monitoring programs (Borja et al., 2000, 2008; Ferrat et al., 2003; Montefalcone, 2009; Marbà et al., 2013). Likewise, plankton indicators have been proposed for diagnoses of ecosystem state (Beaugrand, 2005). Most studies have focused on species of zooplankton (i.e., Calanus finmarchicus) or some phytoplankton bloom-forming species. For example, Phaeocystis sp. produces spring blooms in the North Sea which magnitude might indicate an excess of available N or P in relation to dissolved silica and thus, is considered and indicator for eutrophication (Tett et al., 2007). However, several flaws in the usefulness of using large phytoplankton to reflect significant pressure-impact relationships have been identified (Cloern and Jassby, 2008, 2010; Camp et al., 2015). Bacterial and eukaryotic picoplankton constitute the smallest but most abundant organisms of plankton and are key players in ecosystem functioning. Since disturbances can affect community structure and ecosystem functioning, the smallest members of marine plankton may be crucial in understanding the magnitude of these disturbances particularly because of their fast response to environmental change. In fact, microorganisms have been already proposed as indicators of marine environmental quality, and not only the presence of pathogens such as E. coli, commonly used as indicator of fecal contamination, but in relation to biodiversity and ecosystem functioning (Caruso et al., 2015). Here we tested the Indicator Species Value from Dufrêne and Legendre (1997) in the different sampled stations. The IndVal identifies indicator species based on OTU fidelity and relative abundance. Different bacterial and picoeukaryotic OTUs showed high scores for Stations 1 and 5, as well as for intermediate stations and could represent potential “indicator species.” Alternatively to “indicator species,” we explored the potential of using the abundance of certain taxa and the ratio between different groups of microorganisms as an alternative indicator of environmental status. These indices may also offer ecological information (i.e., species relative composition). In fact, this approach has been explored in other ecosystems; for example in reclaimed waters, the ratio between the Bacteroidetes, Gammaproteobacteria, and Nitrospira/Betaproteobacteria (BGN:β) seems a possible alternative indicator of water quality (Garrido et al., 2014). We tested the correlation of different taxa and the degree of eutrophication (i.e., nutrient concentration) and found significant correlations between certain picoeukaryotic taxa e.g., Ciliophora, and nutrient load; this taxa has been found previously in high abundances in eutrophic waters (Romari and Vaulot, 2004). Yet, the strongest correlations were with the ratio of Alphaproteobacteria/Gammaproteobacteria, Alteromonas/SAR11, and Alteromonas + Oceanospirillales/SAR11. Whether these “indicator species” and indices can be used as robust alternative indicators of environmental status remains to be explored in different locations subjected to contrasting pressures and over time. The challenge is to discriminate between antropogenic-induced changes and the confounding effects of the natural variability of the marine environment.
Conclusions
HTS methods are commonly used to determine the diversity of complex marine microbial communities and have been proposed as a suitable tool in biodiversity monitoring programs. However, validating their usefulness is crucial for conducting rigorous analyses. Comparison of 454 and Illumina methodologies showed minor differences in the performance of both sequencing methodologies that can in part be attributed to inherent differences in chemistry and sequencing protocols, which may affect the quality of the sequences. Nevertheless, these differences were assigned to very rare OTUs and overall, both platforms provided a comparable view of the marine picoplankton communities. On a taxonomic level, there was very good overlap in the detected phyla between the two methods. The comparative analyses performed suggest that 454 and Illumina data can be combined if the same bioinformatic workflow for describing overall patterns of diversity and taxonomic composition is used. On the other hand, we found that plankton biodiversity surveys have the potential to be used as alternative indicators of environmental status. In particular, using bacterioplankton biodiversity (bacterial richness as well as the ratio between certain bacterial taxa) as an alternative indicator of water quality deserves further investigation. However, these preliminary results have to be further investigated by performing intensive surveys covering wide spatial and temporal scales in order to discriminate between changes resulting from human activities and the natural variability of the marine environment and test whether the identified indices are universally applicable.
Author Contributions
Conceived and designed the study: IF, AR, JC, JG, EG; Performed the experiments: IF, CG, AR. Contributed materials: JC, RM, JG, EG; Analyzed the data: IF, CG. Interpreted the data and wrote the paper: IF, CG, AR, JC, RM, JG, EG. All authors reviewed the manuscript.
Conflict of Interest Statement
The authors declare that the research was conducted in the absence of any commercial or financial relationships that could be construed as a potential conflict of interest.
The handling Editor declared a collaboration with the authors and states that the process nevertheless met the standards of a fair and objective review.
Acknowledgments
This manuscript is a result of DEVOTES (DEVelopment Of innovative Tools for understanding marine biodiversity and assessing GEnS) project, funded by the European Union (grant agreement no. 308392), and a MINECO Grant GRADIENTS Fine-scale structure of cross-shore GRADIENTS along the Mediterranean coast (CTM2012-39476-C02). We thank the Coastal Ocean Observatory (http://coo.icm.csic.es/) from the ICM for making possible the sampling and providing ancillary data, and the Marine Bioinformatics Service from the ICM, particularly Drs. Pablo Sánchez and Ramiro Logares for help with computing analyses. We also thank Dr. Eva Ortega-Retuerta for assistance using Ocean Data View and Laura Arin for chlorophyll analyses.
References
Acinas, S. G., Sarma-Rupavtarm, R., Klepac-Ceraj, V., and Polz, M. F. (2005). PCR-induced sequence artifacts and bias: insights from comparison of two 16s rRNA clone libraries constructed from the same sample. Appl. Environ. Microbiol. 71, 8966–8969. doi: 10.1128/AEM.71.12.8966-8969.2005
Beaugrand, G. (2005). Monitoring pelagic ecosystems using plankton indicators. ICES J. Mar. Sci. 62, 333–338. doi: 10.1016/j.icesjms.2005.01.002
Berry, D., Ben Mahfoudh, K., Wagner, M., and Loy, A. (2011). Barcoded primers used in multiplex amplicon pyrosequencing bias amplification. Appl. Environ. Microbiol. 77, 7846–7849. doi: 10.1128/AEM.05220-11
Birk, S., Bonne, W., Borja, A., Brucet, S., Courrat, A., Poikane, S., et al. (2012). Three hundred ways to assess Europe's surface waters: an almost complete overview of biological methods to implement the Water Framework Directive. Ecol. Indic. 18, 31–41. doi: 10.1016/j.ecolind.2011.10.009
Borja, A., Dauer, D. M., Diaz, R., Llansó, R. J., Muxika, I., Rodríguez, J. G., et al. (2008). Assessing estuarine benthic quality conditions in Chesapeake Bay: a comparison of three indices. Ecol. Indic. 8, 395–403. doi: 10.1016/j.ecolind.2007.05.003
Borja, A., Franco, J., and Pérez, V. (2000). A marine Biotic Index to establish the ecological quality of soft-bottom benthos within European estuarine and coastal environments. Mar. Pollut. Bull. 40, 1100–1114. doi: 10.1016/S0025-326X(00)00061-8
Bourlat, S. J., Borja, A., Gilbert, J., Taylor, M. I., Davies, N., Weisberg, S. B., et al. (2013). Genomics in marine monitoring: new opportunities for assessing marine health status. Mar. Pollut. Bull. 74, 19–31. doi: 10.1016/j.marpolbul.2013.05.042
Brown, C. J., Fulton, E. A., Hobday, A. J., Matear, R. J., Possingham, H. P., Bulman, C., et al. (2010). Effects of climate-driven primary production change on marine food webs: Implications for fisheries and conservation. Glob. Chang. Biol. 16, 1194–1212. doi: 10.1111/j.1365-2486.2009.02046.x
Camp, J., Flo, E., Vila, M., Arin, L., Reñé, A., Sampedro, N., et al. (2015). “Pros and cons of biological quality element phytoplankton as a water-quality indicator in the NW Mediterranean Sea,” in Experiences from Ground Coastal and Transitional Water Quality Monitoring, eds A. Munné, A. Ginebreda, and N. Prat (Springer: Switzerland), 135–160.
Caporaso, J. G., Kuczynski, J., Stombaugh, J., Bittinger, K., Bushman, F. D., Costello, E. K., et al. (2010). QIIME allows analysis of high-throughput community sequencing data. Nat. Methods 7, 335–336. doi: 10.1038/nmeth.f.303
Caruso, G., La Ferla, R., Azzaro, M., Zoppini, A., Marino, G., Petochi, T., et al. (2015). Microbial assemblages for environmental quality assessment: knowledge, gaps and usefulness in the European Marine Strategy Framework Directive. Crit. Rev. Microbiol. 7828, 1–22. doi: 10.3109/1040841X.2015.1087380
Chao, A., and Lee, S.-M. (1992). Estimating the number of classes via sample coverage. J. Am. Stat. Assoc. 87, 210–217. doi: 10.1080/01621459.1992.10475194
Cheung, M. K., Au, C. H., Chu, K. H., Kwan, H. S., and Wong, C. K. (2010). Composition and genetic diversity of picoeukaryotes in subtropical coastal waters as revealed by 454 pyrosequencing. ISME J. 4, 1053–1059. doi: 10.1038/ismej.2010.26
Cho, I., and Blaser, M. J. (2012). The human microbiome: at the interface of health and disease. Nat. Rev. Genet. 13, 260–270. doi: 10.1038/nrg3182
Claesson, M. J., Wang, Q., O'sullivan, O., Greene-Diniz, R., Cole, J. R., Ross, R. P., et al. (2010). Comparison of two next-generation sequencing technologies for resolving highly complex microbiota composition using tandem variable 16S rRNA gene regions. Nucleic Acids Res. 38:e200. doi: 10.1093/nar/gkq873
Claudet, J., and Fraschetti, S. (2010). Human-driven impacts on marine habitats: a regional meta-analysis in the Mediterranean Sea. Biol. Conserv. 143, 2195–2206. doi: 10.1016/j.biocon.2010.06.004
Cloern, J. E., and Jassby, A. D. (2008). Complex seasonal patterns of primary producers at the land-sea interface. Ecol. Lett. 11, 1294–1303. doi: 10.1111/j.1461-0248.2008.01244.x
Cloern, J. E., and Jassby, A. D. (2010). Patterns and scales of phytoplankton variability in estuarine-coastal ecosystems. Estuaries Coasts 33, 230–241. doi: 10.1007/s12237-009-9195-3
Connell, J. H. (1978). Diversity in tropical rain forests and coral reefs. Science 199, 1302–1310. doi: 10.1126/science.199.4335.1302
Cúcio, C., Engelen, A. H., Costa, R., and Muyzer, G. (2016). Rhizosphere Microbiomes of European + Seagrasses Are Selected by the Plant, But Are Not Species Specific. Front. Microbiol. 7:440. doi: 10.3389/fmicb.2016.00440
Dowd, S. E., Sun, Y., Wolcott, R. D., Domingo, A., and Carroll, J. A. (2008). Bacterial tag-encoded FLX amplicon pyrosequencing (bTEFAP) for microbiome studies: bacterial diversity in the ileum of newly weaned Salmonella-infected pigs. Foodborne Pathog. Dis. 5, 459–472. doi: 10.1089/fpd.2008.0107
Dufrêne, M., and Legendre, P. (1997). Species assemblages and indicator species: the need for a flexible asymmetrical approach. Ecol. Monogr. 67, 345–366. doi: 10.1890/0012-9615(1997)067[0345:SAAIST]2.0.CO;2
Edgar, R. C. (2013). UPARSE: highly accurate OTU sequences from microbial amplicon reads. Nat. Methods 10, 996–998. doi: 10.1038/nmeth.2604
Edgar, R. C., Haas, B. J., Clemente, J. C., Quince, C., and Knight, R. (2011). UCHIME improves sensitivity and speed of chimera detection. Bioinformatics 27, 2194–2200. doi: 10.1093/bioinformatics/btr381
Engelbrektson, A., Kunin, V., Wrighton, K. C., Zvenigorodsky, N., Chen, F., Ochman, H., et al. (2010). Experimental factors affecting PCR-based estimates of microbial species richness and evenness. ISME J. 4, 642–647. doi: 10.1038/ismej.2009.153
Ferrat, L., Pergent-Martini, C., and Roméo, M. (2003). Assessment of the use of biomarkers in aquatic plants for the evaluation of environmental quality: application to seagrasses. Aquat. Toxicol. 65, 187–204. doi: 10.1016/S0166-445X(03)00133-4
Ferrera, I., Sebastian, M., Acinas, S. G., and Gasol, J. M. (2015). Prokaryotic functional gene diversity in the sunlit ocean: stumbling in the dark. Curr. Opin. Microbiol. 25, 33–39. doi: 10.1016/j.mib.2015.03.007
Flynn, J. M., Brown, E. A., Chain, F. J. J., Macisaac, H. J., and Cristescu, M. E. (2015). Toward accurate molecular identification of species in complex environmental samples: testing the performance of sequence filtering and clustering methods. Ecol. Evol. 5, 2252–2266. doi: 10.1002/ece3.1497
Garrido, L., Sánchez, O., Ferrera, I., Tomàs, N., and Mas, J. (2014). Dynamics of microbial diversity profiles in waters of different qualities. Approximation to an ecological quality indicator. Sci. Total Environ. 468–469, 1154–1161. doi: 10.1016/j.scitotenv.2013.08.065
Gevrey, M., Comte, L., de Zwart, D., de Deckere, E., and Lek, S. (2010). Modeling the chemical and toxic water status of the Scheldt basin (Belgium), using aquatic invertebrate assemblages and an advanced modeling method. Environ. Pollut. 158, 3209–3218. doi: 10.1016/j.envpol.2010.07.006
Gilbert, J. A., Jansson, J. K., and Knight, R. (2014). The earth microbiome project: successes and aspirations. BMC Biol. 12:69. doi: 10.1186/s12915-014-0069-1
Glenn, T. C. (2011). Field guide to next-generation DNA sequencers. Mol. Ecol. Resour. 11, 759–769. doi: 10.1111/j.1755-0998.2011.03024.x
Grasshoff, K., Ehrhardt, M., and Kremling, K. (1983). Methods of Seawater Analysis. Weinheim: Verlag Chemie.
Guillou, L., Bachar, D., Audic, S., Bass, D., Berney, C., Bittner, L., et al. (2013). The Protist Ribosomal Reference database (PR2): a catalog of unicellular eukaryote small subunit rRNA sequences with curated taxonomy. Nucleic Acids Res. 41, 597–604. doi: 10.1093/nar/gks1160
Halpern, B. S., Selkoe, K. A., Micheli, F., and Kappel, C. V. (2007). Evaluating and ranking the vulnerability of global marine ecosystems to anthropogenic threats. Conserv. Biol. 21, 1301–1315. doi: 10.1111/j.1523-1739.2007.00752.x
Halpern, B. S., Walbridge, S., Selkoe, K. A., Kappel, C. V., Micheli, F., D'Agrosa, C., et al. (2008). A global map of human impact on marine ecosystems. Science 319, 948–953. doi: 10.1126/science.1149345
Herlemann, D. P., Labrenz, M., Jürgens, K., Bertilsson, S., Waniek, J. J., and Andersson, A. F. (2011). Transitions in bacterial communities along the 2000 km salinity gradient of the Baltic Sea. ISME J. 5, 1571–1579. doi: 10.1038/ismej.2011.41
Hill, M. (1973). Diversity and evenness: a unifying notation and its consequences. Ecology 54, 427–432. doi: 10.2307/1934352
Hoegh-Guldberg, O., and Bruno, J. F. (2010). The impact of climate change on the world's marine ecosystems. Science 328, 1523–1528. doi: 10.1126/science.1189930
Hong, S., Bunge, J., Leslin, C., Jeon, S., and Epstein, S. S. (2009). Polymerase chain reaction primers miss half of rRNA microbial diversity. ISME J. 3, 1365–1373. doi: 10.1038/ismej.2009.89
Huse, S. M., Dethlefsen, L., Huber, J. A., Welch, D. M., Relman, D. A., and Sogin, M. L. (2008). Exploring microbial diversity and taxonomy using SSU rRNA hypervariable tag sequencing. PLoS Genet. 4:e1000255. doi: 10.1371/journal.pgen.1000255
Keith, A. M., Boots, B., Hazard, C., Niechoj, R., Arroyo, J., Bending, G. D., et al. (2012). Cross-taxa congruence, indicators and environmental gradients in soils under agricultural and extensive land management. Eur. J. Soil Biol. 49, 55–62. doi: 10.1016/j.ejsobi.2011.08.002
Kunin, V., Engelbrektson, A., Ochman, H., and Hugenholtz, P. (2010). Wrinkles in the rare biosphere: pyrosequencing errors can lead to artificial inflation of diversity estimates. Environ. Microbiol. 12, 118–123. doi: 10.1111/j.1462-2920.2009.02051.x
Liquete, C., Piroddi, C., Drakou, E. G., Gurney, L., Katsanevakis, S., Charef, A., et al. (2013). Current Status and future prospects for the assessment of marine and coastal ecosystem services: a systematic review. PLoS ONE 8:e67737. doi: 10.1371/journal.pone.0067737
Lumbreras, A., Marques, J. T., Belo, A. F., Cristo, M., Fernandes, M., Galioto, D., et al. (2016). Assessing the conservation status of Mediterranean temporary ponds using biodiversity: a new tool for practitioners. Hydrobiologia. doi: 10.1007/s10750-016-2697-7. [Epub ahead of print].
Luo, C., Tsementzi, D., Kyrpides, N., Read, T., and Konstantinidis, K. T. (2012). Direct comparisons of Illumina vs. Roche 454 sequencing technologies on the same microbial community DNA sample. PLoS ONE 7:e30087. doi: 10.1371/journal.pone.0030087
Lynch, M. D. J., and Neufeld, J. D. (2015). Ecology and exploration of the rare biosphere. Nat. Rev. Microbiol. 13, 217–229. doi: 10.1038/nrmicro3400
Magurran, A. E. (1988). Ecological Diversity and Its Measurements. New Jersey, NJ: Princeton University Press.
Marbà, N., Krause-Jensen, D., Alcoverro, T., Birk, S., Pedersen, A., Neto, J. M., et al. (2013). Diversity of European seagrass indicators: patterns within and across regions. Hydrobiologia 704, 265–278. doi: 10.1007/s10750-012-1403-7
Massana, R., Murray, A, E., Preston, C. M., and DeLong, E. F. (1997). Vertical distribution and phylogenetic characterization of marine planktonic Archaea in the Santa Barbara Channel. Appl. Environ. Microbiol. 63, 50–56.
Montefalcone, M. (2009). Ecosystem health assessment using the Mediterranean seagrass Posidonia oceanica: a review. Ecol. Indic. 9, 595–604. doi: 10.1016/j.ecolind.2008.09.013
Nogales, B., Lanfranconi, M. P., Piña-Villalonga, J. M., and Bosch, R. (2011). Anthropogenic perturbations in marine microbial communities. FEMS Microbiol. Rev. 35, 275–298. doi: 10.1111/j.1574-6976.2010.00248.x
Not, F., Latasa, M., Scharek, R., Viprey, M., Karleskind, P., Balagué, V., et al. (2008). Protistan assemblages across the Indian Ocean, with a specific emphasis on the picoeukaryotes. Deep. Res. I Oceanogr. Res. Pap. 55, 1456–1473. doi: 10.1016/j.dsr.2008.06.007
Not, F., Massana, R., Latasa, M., Marie, D., Colson, C., Eikrem, W., et al. (2005). Late summer community composition and abundance of photosynthetic picoeukaryotes in Norwegian and Barents seas. Limnol. Oceanogr. 50, 1677–1686. doi: 10.4319/lo.2005.50.5.1677
Nurk, S., Bankevich, A., Antipov, D., Gurevich, A., Korobeynikov, A., Lapidus, A., et al. (2013). “Assembling genomes and mini-metagenomes from highly chimeric reads,” in Lecture Notes in Computer Science (including subseries Lecture Notes in Artificial Intelligence and Lecture Notes in Bioinformatics), eds M. Deng, R. Jiang, F. Sun, and X. Zhang (Berlin; Heidelberg: Springer-Verlag), 158–170.
Parada, A. E., Needham, D. M., and Fuhrman, J. A. (2015). Every base matters: assessing small subunit rRNA primers for marine microbiomes with mock communities, time series and global field samples. Environ. Microbiol. 18, 1403–1414. doi: 10.1111/1462-2920.13023
Pedrós-Alió, C. (2012). The rare bacterial biosphere. Ann. Rev. Mar. Sci. 4, 449–466. doi: 10.1146/annurev-marine-120710-100948
Pernice, M. C., Giner, C. R., Logares, R., Perera-Bel, J., Acinas, S. G., Duarte, C. M., et al. (2015). Large variability of bathypelagic microbial eukaryotic communities across the world's oceans. ISME J. 10, 945–958. doi: 10.1038/ismej.2015.170
Pernice, M. C., Logares, R., Guillou, L., and Massana, R. (2013). General patterns of diversity in major marine microeukaryote lineages. PLoS ONE 8:e57170. doi: 10.1371/journal.pone.0057170
Podani, J., and Csányi, B. (2010). Detecting indicator species: Some extensions of the IndVal measure. Ecol. Indic. 10, 1119–1124. doi: 10.1016/j.ecolind.2010.03.010
Polz, M. F., and Cavanaugh, C. M. (1998). Bias in template-to-product ratios in multitemplate PCR. Appl. Environ. Microbiol. 64, 3724–3730.
Pommier, T., Neal, P. R., Gasol, J. M., Coll, M., Acinas, S. G., and Pedrós-Alió, C. (2010). Spatial patterns of bacterial richness and evenness in the NW Mediterranean Sea explored by pyrosequencing of the 16S rRNA. Aquat. Microb. Ecol. 61, 221–233. doi: 10.3354/ame01484
Prosser, J. I. (2010). Replicate or lie. Environ. Microbiol. 12, 1806–1810. doi: 10.1016/j.ympev.2016.07.028
Ratan, A., Miller, W., Guillory, J., Stinson, J., Seshagiri, S., and Schuster, S. C. (2013). Comparison of sequencing platforms for single nucleotide variant calls in a human sample. PLoS ONE 8:e55089. doi: 10.1371/journal.pone.0055089
R Developement Core Team (2015). R: A Language and Environment for Statistical Computing. Vienna: R Foundation for Statistical Computing.
Romari, K., and Vaulot, D. (2004). Composition and temporal variability of picoeukaryote communities at a coastal site of the English Channel from 18S rDNA sequences. Limnol. Oceanogr. 49, 784–798. doi: 10.4319/lo.2004.49.3.0784
Sánchez, O., Ferrera, I., González, J. M., and Mas, J. (2013). Assessing bacterial diversity in a seawater-processing wastewater treatment plant by 454-pyrosequencing of the 16S rRNA and amoA genes. Microb. Biotechnol. 6, 435–442. doi: 10.1111/1751-7915.12052
Schirmer, M., Ijaz, U. Z., D'Amore, R., Hall, N., Sloan, W. T., and Quince, C. (2015). Insight into biases and sequencing errors for amplicon sequencing with the Illumina MiSeq platform. Nucleic Acids Res. 43, 1–16. doi: 10.1093/nar/gku1341
Sinclair, L., Osman, O. A., Bertilsson, S., and Eiler, A. (2015). Microbial community composition and diversity via 16S rRNA gene amplicons: evaluating the illumina platform. PLoS ONE 10:e0116955. doi: 10.1371/journal.pone.0116955
Smith, V. H., and Schindler, D. W. (2009). Eutrophication science: where do we go from here? Trends Ecol. Evol. 24, 201–207. doi: 10.1016/j.tree.2008.11.009
Stoeck, T., Bass, D., Nebel, M., Christen, R., Jones, M. D. M., Breiner, H. W., et al. (2010). Multiple marker parallel tag environmental DNA sequencing reveals a highly complex eukaryotic community in marine anoxic water. Mol. Ecol. 19, 21–31. doi: 10.1111/j.1365-294X.2009.04480.x
Tett, P., Gowen, R., Mills, D., Fernandes, T., Gilpin, L., Huxham, M., et al. (2007). Defining and detecting undesirable disturbance in the context of marine eutrophication. Mar. Pollut. Bull. 55, 282–297. doi: 10.1016/j.marpolbul.2006.08.028
Torsvik, V., Øvreås, L., and Thingstad, T. F. (2002). Prokaryotic diversity–magnitude, dynamics, and controlling factors. Science 296, 1064–1066. doi: 10.1126/science.1071698
Keywords: plankton diversity, high-throughput sequencing, marine ecosystems, prokaryotes, picoplankton, monitoring programs, indicators, environmental status
Citation: Ferrera I, Giner CR, Reñé A, Camp J, Massana R, Gasol JM and Garcés E (2016) Evaluation of Alternative High-Throughput Sequencing Methodologies for the Monitoring of Marine Picoplanktonic Biodiversity Based on rRNA Gene Amplicons. Front. Mar. Sci. 3:147. doi: 10.3389/fmars.2016.00147
Received: 14 June 2016; Accepted: 02 August 2016;
Published: 22 August 2016.
Edited by:
Marianna Mea, Jacobs University of Bremen, AustriaReviewed by:
Naiara Rodriguez-Ezpeleta, AZTI, SpainEugenio Rastelli, Polytechnic University of Marche and Stazione Zoologica Anton Dohrn, Italy
Copyright © 2016 Ferrera, Giner, Reñé, Camp, Massana, Gasol and Garcés. This is an open-access article distributed under the terms of the Creative Commons Attribution License (CC BY). The use, distribution or reproduction in other forums is permitted, provided the original author(s) or licensor are credited and that the original publication in this journal is cited, in accordance with accepted academic practice. No use, distribution or reproduction is permitted which does not comply with these terms.
*Correspondence: Isabel Ferrera, aWZlcnJlcmFAaWNtLmNzaWMuZXM=