 Gregory P. Dietl
 Stephen R. Durham
 Jansen A. Smith
 Annalee Tweitmann
- 1Paleontological Research Institution, Ithaca, NY, USA
- 2Department of Earth and Atmospheric Sciences, Cornell University, Ithaca, NY, USA
- 3Department of Natural Resources, Cornell University, Ithaca, NY, USA
AMBI and Bentix are widely used benthic indices for guiding remediation decisions under two major pieces of environmental legislation in Europe—the Water Framework Directive (WFD) and the Marine Strategy Framework Directive (MSFD). These indices usually incorporate all living marine benthic invertebrates in a sample. Some recent studies, however, have applied these benthic indices to only mollusk species due to the ease of identifying a single taxonomic group to the species level and because death assemblages (accumulated dead mollusk shells in sediments) may be valuable sources of data for assessing baseline conditions. Although they found that ecological status differences can be detected by applying AMBI and Bentix to mollusks, these studies did not test whether mollusk-only index values, and the ecological statuses indicated by them, are equivalent to those calculated from the whole benthic community. To test this assumption, we performed a meta-analysis of data from 12 European benthic community studies comparing mollusk-only index values with whole-community values. Using five mollusk-only data sets, we also assessed whether application of AMBI and Bentix to molluscan death assemblages can be used to detect changes in ecological status over time. We show that the application of AMBI and Bentix to only the molluscan taxa in benthic communities is a viable method for determining the ecological status of water bodies. Our results also suggest that the application of benthic indices to molluscan death assemblages has great potential to (1) establish baseline conditions for assessing ecological status under the WFD and (2) estimate the natural range of variation of ecosystem attributes for defining sustainability thresholds under the MSFD. We outline three recommendations for the future use of mollusk-only AMBI and Bentix based on our results: (1) mollusk-only index values should be adjusted to facilitate comparisons with whole-community studies; (2) if possible, local ecological group assignments should be used; and (3) we encourage collaboration between paleoecologists and benthic ecologists to facilitate interpretations of index values from death assemblages. We conclude that mollusk-only benthic index assessments of molluscan death assemblages have the potential to be a powerful tool for guiding management decisions under the WFD and MSFD.
Introduction
The Water Framework Directive (WFD; European Commission, 2000), a major piece of environmental legislation implemented by the European Union in 2000, has led to the development of numerous benthic indices (e.g., Borja et al., 2000; Simboura and Zenetos, 2002; Rosenberg et al., 2004; Dauvin and Ruellet, 2007; Muxika et al., 2007) designed to determine the ecological status of European coastal and estuarine waters. Such indices are used to provide objective, data-based guidance for water body restoration decisions and extensive intercalibration exercises have been undertaken to ensure comparability of WFD ecological assessment results between countries using different indices. The Marine Strategy Framework Directive (MSFD; European Commission, 2008)—the oceanic counterpart to the WFD—requires the standardization of assessment criteria on a regional scale to avoid the need for expensive and challenging intercalibrations (Van Hoey et al., 2010). Some of the benthic indices developed under the WFD, however, have continued to be important tools for remediation assessments under the MSFD (Borja et al., 2011; Simboura et al., 2012; Spagnolo et al., 2014), particularly with regard to evaluating structural and functional aspects of sea-floor integrity—one of the 11 “quality descriptors” outlined in the MSFD for evaluating “good environmental status” (Van Hoey et al., 2010).
Benthic indices are typically based on the entire macroinvertebrate benthic fauna (e.g., annelids, crustaceans, echinoderms, mollusks), but some have been established based on subsets of these taxa. For example, the benthic opportunistic polychaetes amphipods index (BOPA), as the name implies, is calculated using only certain polychaete and amphipod taxa (Dauvin and Ruellet, 2007; see also the Foram Stress Index, Dimiza et al., 2016). Although BOPA is calculated based on the ratio of opportunistic polychaetes to sensitive amphipods, the index was calibrated to the five WFD ecological status categories using AMBI and Bentix, two popular whole-community benthic indices. Thus, BOPA's ecological status assignments were designed to approximate whole-community ecological status in accordance with the WFD (Dauvin and Ruellet, 2007). Indices that are calculated from a subset of taxa have advantages (e.g., reduced burden of taxonomic familiarity; Dauvin and Ruellet, 2007). However, as was done with BOPA, it is important that taxon-specific indices address the potential biases associated with assessments based on only subsets of taxa (e.g., the variability between taxa in responses to disturbances, variations in habitat, etc.; Van Hoey et al., 2010) so that ecological status assignments remain on the same scale as other whole-community indices.
Mollusks, which often comprise up to 20 and 25% of individuals in disturbed and undisturbed benthic communities, respectively (Stergiou et al., 1997), have a long history of use as ecological indicators (Zenetos, 1996; Mahmoud et al., 2010; La Valle et al., 2011; Coelho et al., 2014; Velez et al., 2016), making them good candidates for a taxon-specific approach. For instance, using AMBI and Bentix, Nerlović et al. (2011) found notable differences in the WFD ecological status categories of the bivalve community following anoxic events in the eastern portion of the northern Adriatic Sea. Similarly, again using AMBI and Bentix, Leshno et al. (2016) were able to detect the effects of pollution on the molluscan fauna off the Israeli coast. Although these studies demonstrated that differences in ecological status categories can be detected using only mollusks, Nerlović et al. (2011) and Leshno et al. (2016) did not confirm that benthic indices based solely on mollusks were correlated with those calculated from the whole benthic community. Thus, their conclusions may be biased toward either higher or lower ecological status by differences in the responses of mollusks to disturbance relative to the whole-community, and are not necessarily directly comparable with the results of other WFD studies.
Here, in the context of the WFD, we investigate whether ecological status assignments from mollusk-only assessments are equivalent to whole-community AMBI and Bentix analyses. We also assess whether AMBI and Bentix can be applied to molluscan death assemblages—the calcium carbonate shells of dead mollusks that accumulate in sediments over time—to detect temporal change in ecological status. Death assemblages commonly record average ecological conditions on timescales of decades to centuries (Kidwell, 2013). Application of benthic indices to molluscan death assemblages (or geohistorical records; NRC, 2005) may, therefore, have the potential to (1) establish baseline conditions for assessing ecological status under the WFD and (2) estimate the natural range of variation of ecosystem attributes that can be used to set sustainability thresholds during the implementation of the MSFD, among other needs that have been identified in the ecological assessment literature (Van Hoey et al., 2010; Borja et al., 2012).
Methods
Benthic Indices: AMBI and Bentix
AMBI and Bentix are calculated by assigning species to five and two groups, respectively, based on sensitivity to disturbance, such as eutrophication (Borja et al., 2000; Simboura and Zenetos, 2002; Munari and Mistri, 2010). Using data on species abundances and the represented ecological groups, AMBI applies the equation:
GI through GV are ecological groups with increasing tolerance for disturbance. Resulting AMBI values range from zero to seven and correspond with the five WFD ecological status categories (High, 0 < AMBI < 1.2; Good, 1.2 < AMBI < 3.3; Moderate, 3.3 < AMBI < 4.3; Poor, 4.3 < AMBI < 5.5; Bad, 5.5 < AMBI < 7; Borja et al., 2004). According to the WFD, any water body ranked lower than “Good” requires remediation. Bentix assigns species to only two ecological groups, one for taxa sensitive to disturbance (GS) and the other for taxa that are tolerant (GT; Simboura and Zenetos, 2002). Bentix values can range from two to six (values of zero indicate azoic sediments) and are calculated using the equation:
Bentix values translate to the following WFD ecological status categories: Bad, Bentix = 0; Poor, 2.0 < Bentix < 2.5; Moderate, 2.5 < Bentix < 3.5; Good, 3.5 < Bentix < 4.5; High, 4.5 < Bentix < 6.0. Note that the AMBI scale is inversely correlated with ecological status, but the Bentix scale and ecological status are positively correlated.
The Bentix and AMBI indices are related (Bentix GS is equivalent to ecological groups I and II from AMBI and Bentix GT is equivalent to ecological groups III, IV, and V from AMBI) but draw from independent species lists for assigning taxa to ecological groups (Simboura and Zenetos, 2002; Munari and Mistri, 2010). Neither species list is exhaustive, but the AMBI list (n = ~8000) is more inclusive than the Bentix list (n = 1250). Consequently, when calculating Bentix values, ecological groupings from AMBI were applied using the above conversion when a species was absent from the Bentix list. When assigning ecological groups to species using the AMBI list, if a species did not occur on the list, the ecological group was assigned using the following rules: (1) the ecological group listed for the genus was applied; (2) if the genus name alone was also not on the list, then the species was assigned the ecological group shared by the majority of congeneric species on the list; (3) if there were no congeners or there was no clear majority ecological group among the congeners on the list, then the species was not assigned an ecological group.
Selection and Subdivision of Data Sets
We conducted internet searches of the published literature for papers reporting benthic community census data from European waters and contacted authors to obtain data sets from studies that did not report community abundance data. Our search yielded: (1) 12 live-only benthic community data sets from sites across Europe, including the English Channel, Baltic Sea, Bay of Biscay, Mediterranean Sea, Aegean Sea, and Adriatic Sea (Table S1.1 in Supplementary Material); and, (2) five live-dead mollusk-only data sets from the Mediterranean Sea (Table S1.2 in Supplementary Material). The live data sets were used to assess the correlation between whole-community and mollusk-only index values (i.e., AMBI and Bentix) and subsequently the correlation between directly calculated whole-community and estimated whole-community index values. The live-dead data sets were used to examine the degree of variation in AMBI and Bentix values when comparing live assemblages (LA) with death assemblages (DA; Table S1.2 in Supplementary Material).
To evaluate the relationship between index values calculated from the whole community and those calculated from mollusks only, we compiled 91 stations with at least 10 mollusk species from each live-only data set (Table S1.1 in Supplementary Material) into one master data set and calculated AMBI and Bentix values for both the whole community and only mollusks for each station. AMBI values were calculated with the AMBI 5.0 software (species list v. Nov2014) and Bentix values were calculated using the Bentix Add-In v1.0 (© 2009 Hellenic Center for Marine Research, Institute of Oceanography) for Excel (Microsoft Corporation). The stations were then ordered by the whole-community AMBI values from largest to smallest and alternately assigned to group A or group B to ensure an even distribution of AMBI values. The same process was repeated using the whole-community Bentix values. We used data group A to examine the relationship between whole-community and mollusk-only index values, saving data group B as an independent data set to test the utility of the relationship for predicting whole-community values from mollusk-only values.
Correlation between Whole-Community and Mollusk-Only Index Values
Using the 46 stations in data group A, index values calculated from the whole community were regressed on values calculated with just molluscan taxa. Note that because the AMBI software averages replicate samples and reports a single value for a given station, but the Bentix Excel script calculates a different value for each replicate, the total number of data points in the regressions differed between indices. For AMBI index values, a square-root transformation was applied as this adjustment has been shown to improve the results of AMBI (Tweedley et al., 2014). A regression equation with a slope of one indicates a perfect match between the whole-community and molluscan-only indices. If the slope is not one, then the molluscan community is either over-estimating or under-estimating the whole-community value.
Correlation between Directly Calculated and Estimated Whole-Community Index Values
The 45 stations assigned to data group B were used to evaluate the concordance of mollusk-only index values with those of whole-community index values, using data independent of those used to produce the regression (i.e., group A). The regression equation produced from the stations in data group A was used to produce estimated whole-community values from the mollusk-only values for each station in data group B. We then regressed the resulting estimated whole-community values against the directly calculated whole-community values for each station in data group B to evaluate the relationship between the two, and in particular the concordance of the ecological status assignments. To account for our use of square-root transformed abundance data, we also adjusted the AMBI default ecological status category boundaries using the equation resulting from the regression of untransformed whole-community abundance data against square-root transformed abundance data (Tweedley et al., 2014). For the Bentix calculations, we assigned ecological status using the standard category boundaries because the abundance data were untransformed.
In order to evaluate the goodness of fit of the estimated whole-community index to the directly calculated whole-community index, three potential error types were quantified: (1) the proportion of stations where WFD ecological status categories were misclassified by the estimated whole-community indices; (2) the direction of misclassifications and their relative frequencies (i.e., the potential for bias toward over- or under-estimates of directly calculated whole-community index values); and (3) the proportion of misclassified sites that were incorrectly classified into action (i.e., incorrectly classified below “Good”) or no action (i.e., incorrectly classified above “Moderate”) ecological status categories.
Variation between Live and Death Assemblage Mollusk-Only Index Values
In order for comparisons of AMBI and Bentix values between a LA and DA to be meaningful from a management perspective, they must be capable of showing enough variation to indicate changes in ecological status (assuming changes have occurred). Therefore, using the five live-dead studies (Table S1.2 in Supplementary Material) found during our search of the literature, we calculated and plotted the resulting LA and DA index values by station to visualize the potential trajectory of ecological status for each station (either worsening or improving over time).
Results
AMBI
Whole-community AMBI values were positively correlated (R2 = 0.46) with mollusk-only AMBI values for the 46 stations included in data group A (Figure 1). The slope was less than one, however, suggesting that mollusk-only analyses tended to yield slightly higher AMBI values than analyses that included the whole benthic community (i.e., mollusk-only analyses tended to slightly underestimate the ecological statuses of the stations).
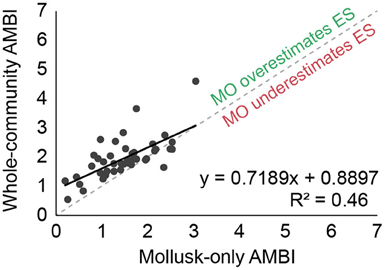
Figure 1. Regression of AMBI values calculated using data on abundances from all species in the benthic surveys against values including only molluscan taxa. Abundances were square-root transformed.
This pattern persisted when the estimated whole-community AMBI values calculated for the 45 stations in data group B were regressed against the directly calculated whole-community AMBI values (R2 = 0.46; Figure 2). However, the ecological status assignments based on estimated and directly calculated whole-community AMBI values still agreed for the majority (78%; n = 35) of stations because ecological status ratings are based on ranges of AMBI values (Figure 2).
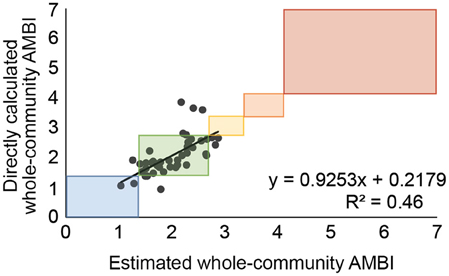
Figure 2. Regression of whole-community AMBI values calculated directly from all species against values estimated from the molluscan species at each station and the regression equation from Figure 1. Boxes indicate ranges of values falling into each of the ecological status classifications (Blue = High, Green = Good, Yellow = Moderate, Orange = Poor, Red = Bad).
Estimated whole-community AMBI values misclassified the ecological group in 10 (22%) cases. The estimated whole-community AMBI values overestimated the ecological statuses of 13% (n = 6) of the stations and underestimated the ecological statuses of 9% (n = 4) of the stations (Figure 3). Because the “Moderate”-“Good” ecological status boundary is the cut-off for when remediation is required, eight of these 10 cases of differing ecological status ratings would have resulted in different decisions about the necessity of remediation (Figure 3A). Most of the differences in action would have been conservative. Eighty-three percent (n = 5) of overestimated ecological status ratings for estimated whole-community AMBI values were “Good” or better, when ecological status ratings based on the directly calculated whole-community AMBI values for the same stations were “Moderate” or worse (i.e., no action would be recommended although it would have been supported by the directly calculated whole-community calculation; Figure 3B). The ecological status ratings of three stations (75%) were underestimated by the estimated AMBI values as “Moderate”, when the rating based on directly calculated AMBI values was “Good” (i.e., would have resulted in remediation, although it would not have been supported by the directly calculated whole-community calculation; Figure 3C).
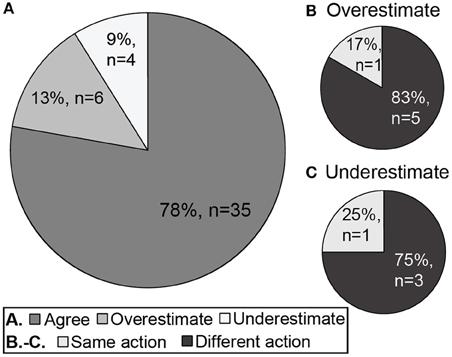
Figure 3. The concordance of directly calculated and estimated whole-community ecological status. Pie diagrams show (A) the proportion of estimated whole-community AMBI values that agreed with, overestimated, or underestimated the ecological status rating based on the directly calculated whole-community AMBI values, and the proportion of (B) overestimated and (C) underestimated AMBI values that would have resulted in the same or different conclusions about the need for remedial action (i.e., action when none is required or no action when remediation is necessary, for underestimated and overestimated ecological status ratings, respectively).
Bentix
Whole-community Bentix values were correlated (R2 = 0.3) with mollusk-only Bentix values for the 64 stations (or replicates) in data group A. Similar to the transformed AMBI regression, the slope was less than one, indicating that mollusk-only Bentix calculations will yield higher ecological status ratings than Bentix calculations that include the whole community (Figure 4). When estimated Bentix values were regressed against directly calculated whole-community Bentix values using data group B, the ecological status assignments agreed for 73% (n = 47) of the 64 calculations (R2 = 0.42; Figure 5).
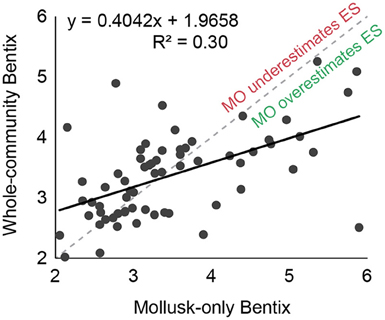
Figure 4. Regression of Bentix values calculated using data on abundances from all species in the benthic surveys against values including only molluscan taxa.
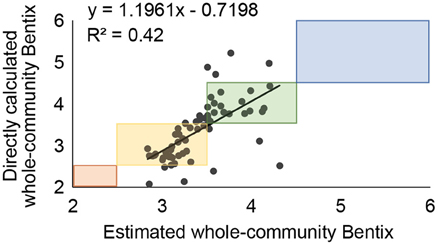
Figure 5. Regression of whole-community Bentix values calculated directly from all species against values estimated from the molluscan species at each station and the regression equation from Figure 4. Boxes indicate ranges of values falling into each of the Ecological Status classifications (Blue = High, Green = Good, Yellow = Moderate, Orange = Poor).
Estimated whole-community Bentix values misclassified the ecological group in 17 (27%) cases. The ecological status ratings based on estimated whole-community Bentix values overestimated those based on directly calculated whole-community Bentix values in 11% (n = 7) and underestimated them in 16% (n = 10) of the calculations (Figure 6). Of the 17 instances where estimated and directly calculated whole-community Bentix values did not agree on ecological status ratings, 10 crossed the “Good”-“Moderate” boundary at which remediation is required. A need for remediation would have been missed (i.e., ecological status was overestimated using estimated whole-community Bentix) in four out of the seven (57%) overestimates, whereas erroneous ecological status ratings of “Moderate” or worse in six out of the 10 (60%) underestimates would have unjustifiably suggested that remediation was necessary (Figure 6). Only one of the 17 (6%) misclassifications was by more than a single ecological status rating using estimated as opposed to directly calculated whole-community Bentix (Figure 5).
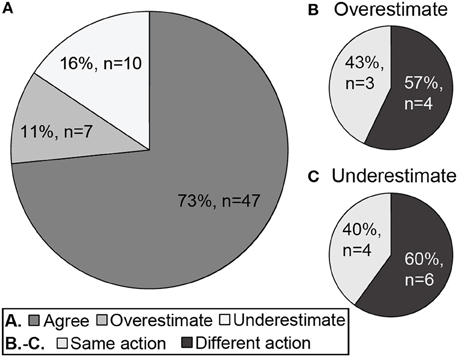
Figure 6. The concordance of directly calculated and estimated whole-community ecological status. Pie diagrams show (A) the proportion of estimated whole-community Bentix values that agreed with, overestimated, or underestimated the ecological status rating based on the directly calculated whole-community Bentix values, and the proportion of (B) overestimated and (C) underestimated Bentix values that would have resulted in the same or different conclusions about the need for remedial action (i.e., action when none is required or no action when remediation is necessary, for underestimated and overestimated ecological status ratings, respectively).
Variation between Live and Death Assemblage Mollusk-Only Index Values
When estimated whole-community AMBI and Bentix values were calculated using the data from five live-dead studies and the regression equations from Figures 1, 3, respectively, two out of 18 (11%) Bentix values indicated changes in ecological status vs. seven of the 18 (39%) AMBI values (Figure 7). The most dramatic difference between Bentix values was from the data of Zenetos and Van Aartsen (1995), which suggested a decline in ecological status from Good to Moderate from the DA to the LA. For AMBI, the largest difference was from the data of Peharda et al. (2002), which suggested an increase in ecological status from Good to High from the DA to the LA at station 23. Overall, there was only rough concordance between the two indices. The AMBI and Bentix values agreed on the direction of change (positive or negative) in ecological status in seven out of 18 (39%) cases (Figure 7), and AMBI and Bentix values resulted in the same ecological status category for both LA and DA data in five out of the 18 (28%) cases (Figure 7). Either AMBI or Bentix indicated a change in ecological status had occurred between the DA and the LA in eight out of the 18 (44%) pairs of LA and DA calculations. However, there was only one (6%) station for which AMBI and Bentix both showed a change in ecological status.
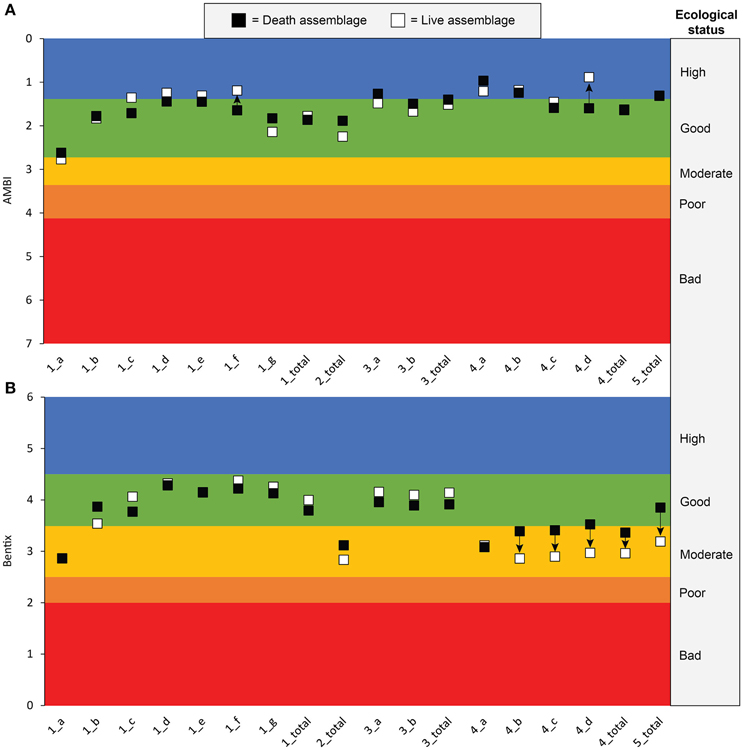
Figure 7. Plots of estimated whole-community (A) AMBI and (B) Bentix values for data from five European studies of molluscan live and death assemblages. AMBI values and ecological status boundaries reflect calculations using square-root transformed abundances. Arrows indicate direction of change from death to live assemblages. “1_a” = Intertidal_Inner Flat (Weber and Zuschin, 2013); “1_b” = Intertidal_Outer Flat (Weber and Zuschin, 2013); “1_c” = Intertidal_Sandbar (Weber and Zuschin, 2013); “1_d” = Intertidal_Channel (Weber and Zuschin, 2013); “1_e” = Sublittoral_Shallow (Weber and Zuschin, 2013); “1_f” = Sublittoral_Seagrass (Weber and Zuschin, 2013); “1_g” = Sublittoral_Delta Sand (Weber and Zuschin, 2013); “1_total” = all sites (Weber and Zuschin, 2013); “2_total” = all sites (Leshno et al., 2015); “3_a” = Intermediate (Giacobbe and Leonardi, 1985); “3_b” = Deep (Giacobbe and Leonardi, 1985); “3_total” = all sites (Giacobbe and Leonardi, 1985); “4_a” = station 2 (Peharda et al., 2002); “4_b = station 21 (Peharda et al., 2002); “4_c = station 22 (Peharda et al., 2002); “4_d = station 23 (Peharda et al., 2002); “4_total” = all sites (Peharda et al., 2002); “5_total” = all sites (Zenetos and Van Aartsen, 1995).
Discussion
The estimated whole-community AMBI and Bentix values resulted in the same ecological status ratings as index values directly calculated from whole-community data in more than 70% of stations for each index. Further, although there were cases where estimated whole-community indices would have resulted in misleading ecological status ratings, all of the values that would have erroneously indicated a need for remediation were for stations that were already close to the Good-Moderate boundary based on the directly calculated whole-community calculations for both AMBI and Bentix (Figures 2, 5). All of the cases where estimated whole-community index values substantially underestimated or overestimated ecological status either did not cross the Good-Moderate boundary (i.e., would not have resulted in different remediation recommendations), or crossed the boundary but overestimated the ecological status (i.e., no remediation recommended, although the directly calculated whole-community index values would have recommended it; Figures 2, 5). Thus, it appears that estimated whole-community AMBI and Bentix values based on only the molluscan taxa in the community can be used to reproduce the ecological status ratings that would be indicated by directly calculated whole-community values, and when errors in ecological status assignments occur, they tend to be conservative with regard to remediation recommendations. The high performance of the estimated whole-community AMBI and Bentix indices tested here is encouraging but not perfect, reinforcing the recommendation that multiple types of metrics and indicators (e.g., physical, chemical, biological) should be used for environmental assessments to reduce uncertainty in results (e.g., Borja and Muxika, 2005; Dauvin, 2007; Teixeira et al., 2007; Kröncke and Reiss, 2010).
The results of applying estimated whole-community AMBI and Bentix to LA and DA abundance data also show promise for detecting trajectories of ecological status over time. There was variation in the index values that may be indicative of recent changes in ecological status for both AMBI and Bentix; however, because the majority of original studies were not focused on assessing ecological change, more information on the history of anthropogenic impacts at the study sites would be necessary to determine the cause of the variation. Further research will also be required to understand why the AMBI and Bentix values did not agree on the direction and magnitude of change in ecological status between some LAs and DAs.
Precautions for Mollusk-Only AMBI and Bentix
Although our study results suggest that calculations of AMBI and Bentix using only the molluscan taxa in a benthic community will most often result in the same ecological status conclusions as whole-community calculations, there are a number of factors that must be considered to accurately interpret these values, particularly when involving DA data. For instance, our analysis clearly demonstrates that unadjusted mollusk-only AMBI and Bentix values are not directly comparable to those calculated from the whole-community. Mollusk-only values must be adjusted to estimated whole-community values for mollusk-only and whole-community ecological status ratings to be directly comparable. The lack of a one-to-one ratio of whole-community and mollusk-only AMBI and Bentix values is likely influenced by at least two variables: the percentage of individuals in the community that are mollusks, which varied from < 1 to ~59% in the data sets we compiled (Table S1.1 in Supplementary Material), and the ecological group of the most abundant mollusk species in the community (see Section 2 in Supplementary Material). First, mollusk-only values more accurately represent the whole community when more of the community's individuals are mollusks. For instance, the difference between the mollusk-only and whole-community index values decreases as the proportion of individuals in the whole community that are mollusks increases (Figure S2.1 in Supplementary Material). Second, mollusk-only and whole-community values are more consistent on average as the AMBI ecological group of the most abundant mollusk species in the community increases (Figure S2.1 in Supplementary Material). This pattern likely occurs because most mollusk species are categorized in low ecological groups (no mollusk species in the data sets we used were higher than AMBI ecological group 4). High variability in the “mollusk-only − whole-community” difference can result if mollusks are rare in the community or the ecological groups represented are lower (i.e., more sensitive) than the ecological groups represented by other taxonomic groups in the community, which could include more disturbance-tolerant species, such as annelid worms (Figure S2.2 in Supplementary Material). This difference in ecological group distributions may help explain why mollusk-only analyses tend to overestimate the ecological status of stations whose ecological status is already high and underestimate the ecological status of more highly disturbed stations (including natural disturbances; see Dauvin and Ruellet, 2007).
Additionally, given the importance of the distribution of individuals among ecological groups (especially when limited to a subset of taxa; i.e., mollusks), it is particularly necessary to correctly assign species to ecological groups (see Gillett et al., 2015 for an example). Concern over the potentially arbitrary nature of ecological group assignments was raised by Tweedley et al. (2014), who noted the strong family-level coherence of ecological group assignments between species, but found that family-level AMBI values could not accurately assess disturbance levels in estuaries outside of Europe.
Our results also suggest that comparisons between AMBI and Bentix values for LA and DA data are promising as indicators of ecological status changes through time, however, three important sources of bias in DAs—time-averaging, taphonomic inertia, and preservational bias (Kowalewski et al., 1998; Kidwell and Tomasovych, 2013)—must be considered when comparing LA and DA data. First, the degree of time-averaging, which is the accumulation and mixing of material of different ages into the same sedimentary layer (Kowalewski et al., 1998; Kidwell, 2013), at a given location can be highly variable depending on environmental factors such as water depth and sedimentation rate (Kidwell, 2013). Time-averaging can produce DAs that tend to be either young on average with less time-averaging (i.e., decades to centuries), or older on average with greater time-averaging (i.e., centuries to millennia), for estuaries and continental shelf environments, respectively. Although these differences in temporal mixing can result in misleading abundance or species composition data (Kowalewski et al., 1998; Kidwell, 2007), when properly quantified, time-averaging can be advantageous by dampening out the short-term temporal variability that characterizes LAs. Thus, DAs can yield data on the mean conditions of the benthic fauna and environmental conditions for the time period over which the assemblage is time-averaged and can indicate deviations from the mean conditions of the preceding decades or centuries relative to LAs (Kowalewski et al., 1998; Kidwell, 2007, 2013). The time-averaging process also tends to increase evenness in DAs relative to LAs because rare taxa will accumulate in a DA over time but occur too sparsely to be sampled in the LA (Kidwell, 2013). If unaddressed, this bias in the DA could decrease the accuracy of DA benthic index values, and cause misleading comparisons with LA data.
The second characteristic, taphonomic inertia (the lag in response of DA composition following changes in the LA; Kidwell, 2007) is sensitive to the degree of time-averaging. For instance, taphonomic inertia on the continental shelf is often greater than in estuaries, corresponding to the aforementioned difference in time-averaging. Additionally, taphonomic inertia is influenced by the balance between the gradual addition of dead remains to the seafloor and the constant reworking and removal of remains by biological, physical, and chemical processes such as bioturbation, wave action, and dissolution, respectively. Thus, the ecological signal of a DA (e.g., composition, abundance) lags behind the corresponding LA in time. For change in the DA composition to become evident, the signal from new material must overwhelm the existing time-averaged signal. Generally, it is assumed that similarity in metrics (e.g., species composition and rank-order abundance of species) between LAs and DAs indicates that there has been little disturbance in the ecosystem over long periods of time (Kidwell, 2007). Low taphonomic inertia can, however, lead to misleading conclusions in LA-DA comparisons. In such cases, the similarity between the LA and DA would not indicate a lack of disturbance in the LA, but simply that the DA reflects changes in the LA soon after they occur. Hence, it is important to consider the magnitude of taphonomic inertia to avoid misleading results from comparisons of LAs and DAs.
The third DA characteristic, preservational bias, is highly sensitive to the durability of molluscan remains, particularly when assemblages are time-averaged over long periods. For example, mollusk taxa that are small (< 1.0 mm), fragile, or shell-less rarely persist in DAs (Kidwell, 2001). Thus, DAs typically record only a fraction of the total living diversity, and how many taxa are preserved is both a function of the living diversity and characteristics of the preservational environment. Although such preservational bias restricts the diversity of higher taxa in DAs to varying degrees, the hard parts that remain intact to the point of final burial (the point at which they become buried deep enough that they are unlikely to be exhumed) can persist in the sedimentary record for millennia and provide ecologically meaningful data that are often the only source of local baseline information (Kidwell, 2013).
Advantages of Geohistorical Data
AMBI and Bentix calculations on molluscan DAs have high potential value for benthic assessment and implementation of environmental legislation (e.g., WFD and MSFD). The difficulty of obtaining reference conditions (e.g., “near-pristine” areas, historical data) for most coastal and marine habitats is currently an obstacle to environmental assessment (Van Hoey et al., 2010). This issue, however, is a promising potential area of application for geohistorical data, such as those from molluscan DAs. Depending on the degree of time-averaging in a given DA, it can yield data to help address information needs for ecological assessment by: (1) increasing the availability of local baseline data against which ecological status in the WFD can be measured, especially where no largely undisturbed (i.e., “pristine”) areas exist; (2) defining “naturalness” in an ecosystem by quantifying natural ranges of variability of ecosystem attributes in the past (including trajectories in those attributes over timescales beyond the reach of modern instrumental monitoring), which can be used to set sustainability thresholds during the implementation of the MSFD; (3) disentangling the relative importance of multiple ecological stressors responsible for benthic community changes, particularly for stressors acting over large temporal scales (e.g., climate change); and (4) identifying invasive species and estimating the duration of their presence in an ecosystem.
The most fundamental use for data from DAs is to improve local baseline data (Dietl and Flessa, 2011). Where the dead remains of benthic organisms with hard parts are easily buried and preserved, such as in coastal marine systems, location-specific geohistorical data are often readily available. The time-averaged and time-lagged nature of these data also means that they reflect environmental conditions from decades to millennia in the past. These attributes make geohistorical records, such as DAs, more useful sources of reference data for ecosystems than is generally realized in the restoration and conservation communities (Durham and Dietl, 2015; contra Borja et al., 2012). There is also abundant evidence that community attributes, such as species rank-abundances, which can be reconstructed from DAs, have high fidelity to corresponding undisturbed LAs (Kidwell, 2013).
By digging deeper into sediments, baseline information from multiple time intervals can be combined to document the natural range of variation of many ecosystem attributes and potentially also to document trajectories of change in the measured attributes during the recent past. This kind of information is becoming increasingly important for restoration and management planning activities (Wiens et al., 2012), particularly under the MSFD. Geohistorical data can provide information about this natural range of variation because they represent an average set of conditions from the preceding decades to millennia. They may also be more likely to reflect the ecological status of a specific habitat than reference conditions based on separate sites, avoiding the problem of comparing ecological “snapshots” from areas whose natural histories may differ. Thus, such data may help with defining regional and sub-regional sustainability thresholds for “good environmental status” because benthic indices are based only on the relative abundance of ecological groups in a sample (i.e., they are fundamentally ataxic in nature); that is, they are robust to changes in species composition of communities over time. Further, due to the decadal- to centennial-scale taphonomic inertia of most DAs, they can still be sampled to increase the temporal context and scope of baseline information from locations at which LA samples were already collected. These data could be used to refine sustainability thresholds that have already been defined, and may also be helpful for validating the results of intercalibration studies conducted under the WFD that may have lacked location-specific temporal context.
The data obtainable from DAs can also help to distinguish the relative importance of multiple stressors on an environment (Dietl et al., 2015), given that their onsets are unlikely to have been synchronous and DA data from multiple timescales may capture changes in ecosystem attributes related to the onset of each stressor. For instance, Casey et al. (2014) used fossil and archaeological data to show that major ecological changes in Long Island Sound, USA, such as the disappearance of oyster reefs, predated major eutrophication problems, but not overfishing, and showed that comparisons of LA and DA diversity did not follow the expected patterns based on a substantial east-west eutrophication gradient. These results strongly suggested that in the absence of efforts to address overfishing, pollution remediation may have only limited success in restoring the ecological condition of Long Island Sound (Casey et al., 2014). Further, multiple stressors may act on highly variable timescales that can easily exceed the amount of time typically accessible from instrumental and historical records (NRC, 2005). For instance, anchovy and sardine populations respond strongly to decadal-scale climatic cycles, but these natural population boom-bust patterns are difficult to distinguish from impacts related to overfishing without baseline data on the same timescales as the climatic cycle (Baumgartner et al., 1992; Valdés et al., 2008). Thus, in the absence of long-term baseline data, like those available from geohistorical records, it is very difficult (if not impossible) to disentangle the effects of multiple stressors on benthic communities.
The temporal context provided by data from DAs may also be very helpful for identifying invasive species and determining both the duration and effect of their presence in an ecosystem. For instance, the presence or absence of a presumed invasive or native species in geohistorical records of varying ages can help document the arrival times of the species (e.g., Chiba and Sato, 2014; Smith and Dietl, 2016). These records may also reveal simultaneous ecosystem changes with the arrival of the potential invasive species or other evidence to help evaluate whether an alien species qualifies as an invasive species under the MSFD, which requires that alien species cause harm in order to be termed “invasive” (Van Hoey et al., 2010). Distinguishing between species that are invasive vs. simply alien may be very difficult without the location-specific temporal context afforded by geohistorical records.
Finally, applying benthic indices to shallow DA samples requires relatively little additional cost or sampling effort, because DA material is often already collected in the process of sampling living benthic communities. For instance, many comparative studies of molluscan LAs and DAs bulk sample sediments using quadrat sampling, coring, or grab sampling methods, which sample both live and dead mollusks at a given station simultaneously. These bulk samples are then typically sieved through a screen and live and dead mollusks are retained for analysis, a very similar process to those already used to quantitatively sample living benthic communities. Due to this similarity in sample processing, the collection of DA data can also easily comply with existing LA sampling standards under the WFD and MSFD (e.g., for sample number, sieve sizes, gear types, etc.; Van Hoey et al., 2010).
Recommendations for Use of Mollusk-Only AMBI and Bentix
We agree with Leshno et al. (2016) and Nerlović et al. (2011) that benthic indices applied to mollusks are useful for evaluating ecological status. In particular, our study supports the findings of Leshno et al. (2016) that applying benthic indices to DAs shows promise as a tool for helping to address some intractable problems in ecological assessments, such as a lack of local baseline information, clear stressor-response relationships, and knowledge of the “naturalness” of an ecosystem (e.g., uncertainties regarding natural variability and thresholds of sustainability; Van Hoey et al., 2010). We have three recommendations for the future use of mollusk-only AMBI and Bentix: (1) index values should be adjusted to estimated whole-community values to facilitate comparisons with other studies that analyzed the whole benthic community; (2) local ecological group assignments for species should be used whenever possible; and (3) given the complexities of DA formation and corresponding challenges of applying benthic indices to DA data, we encourage collaboration between paleoecologists and benthic ecologists.
First, we have demonstrated that the mollusk-only values must be adjusted before conclusions about ecological status from mollusk-only and whole-community analyses can be directly compared. For this purpose, we provide regression equations based on all of the data in our meta-analysis (groups A and B combined) for AMBI (RT = square-root transformed abundance data) and Bentix:
To illustrate the need for adjusting mollusk-only index values, we converted the AMBI and Bentix values reported in Leshno et al. (2016) to estimated whole-community values. We applied Equation 4 for Bentix and the regression equation based on untransformed abundance data (UT) for AMBI because Leshno et al. (2016) did not transform their abundance data. The UT regression equation is:
Leshno et al. (2016) did not report the Bentix values from their final analysis, so we used the Figure Calibration plugin (Hessman, 2009) for ImageJ 1.50e image processing software (Rasband, 1997) to estimate the Bentix values from their Figure 9. As expected based on our results, the estimated whole-community values were lower than the mollusk-only values for higher ecological status stations, and higher for lower ecological status stations (Figure 8). In general, this means that mollusk-only index values in the “Good” and “Moderate” ecological status categories did not shift as much as stations in the “High,” “Poor,” and “Bad” categories, which can easily change ecological status categories when adjusted (Figure 8). Importantly, the apparent difference in ecological status between the impact and control stations was reduced following our adjustment (Figure 8), including narrower differences between DA and LA ecological status for all station and season combinations and a shift downward in the ecological status of values for the control stations (Figure 8). There was little agreement between the AMBIUT and Bentix values from Leshno et al. (2016) with regard to ecological status or the magnitude of change between DA and LA ecological status, although in all cases, AMBIUT yielded higher ecological status assignments than Bentix (this pattern also has been observed in the present study and in other studies comparing AMBI and Bentix; Simboura and Reizopoulou, 2007; Simboura and Argyrou, 2010; Leshno et al., 2016).
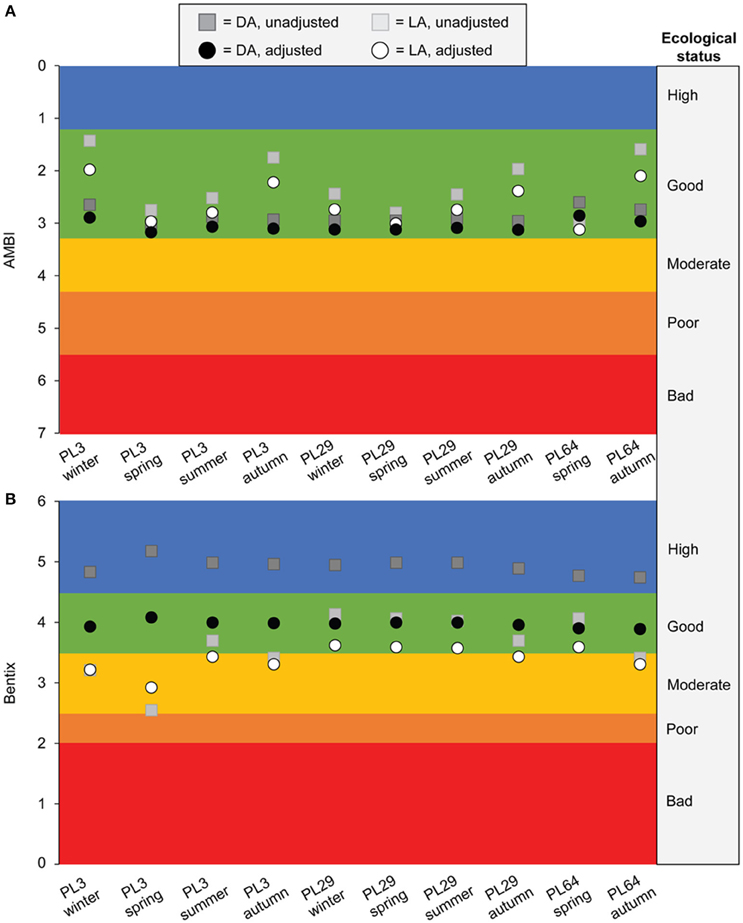
Figure 8. Plots of estimated whole-community (i.e., adjusted) vs. mollusk-only (i.e., unadjusted) (A) AMBI and (B) Bentix values for live assemblage (LA) and death assemblage (DA) data from Leshno et al. (2016). Station PL3 was impacted by a sewage outfall and stations PL29 and PL64 were controls (Leshno et al., 2016). The AMBI and Bentix index values from Leshno et al. (2016) were adjusted using Equations (4) and (5), respectively. See text for details.
A full discussion of whether AMBI or Bentix is better suited to comparing DA and LA data is beyond the scope of this paper, but it is important to point out that decisions about the ecological group assignments of species can have a dramatic impact on the resulting ecological status assignments. For instance, when Leshno et al. (2016) altered the ecological group assignment of one dominant clam species, Corbula gibba, from “tolerant” to “sensitive,” the ecological status ratings of the DAs at each station increased from about three (i.e., Moderate) to about five (i.e., High), and the ecological status ratings from the LAs increased substantially as well. Leshno et al. (2016) had an empirical reason for changing the ecological group of C. gibba—at the stations they sampled, the percent of individuals of C. gibba was positively correlated with ecological status. This example, among others (Tweedley et al., 2014; Gillett et al., 2015), suggests that the performance of AMBI and Bentix improves when ecological group assignments are based on local conditions and expertise. Hence, our second recommendation is that regional species lists for assigning ecological groups should be used whenever possible (e.g., Gillett et al., 2015).
Interpreting the results of DA analyses can be challenging due to the potentially biasing factors inherent to DAs (e.g., time-averaging, preservational bias). Thus, our third recommendation is that the application of benthic indices to DAs may best be done collaboratively between benthic ecologists and paleoecologists who regularly consider these biasing factors. In fact, there are already paleoecologists who are interested in applying their skills to conservation and resource management (e.g., Dietl et al., 2015) and calls for such integration from ecologists (e.g., Price and Schmitz, 2016). Such collaborations would help address concerns about taphonomic bias in the DA data, allow for quantification of important factors such as DA age and degree of time-averaging through better access to geochronological dating methods, and bring expertise in paleoenvironmental interpretation to the environmental assessment.
Future Work
There are several areas where further research is required. First, given calls for a better understanding of the cause of variable performance in benthic indices (Van Hoey et al., 2010), it may be helpful to further develop regional ecological group assignments for mollusks. Doing so will help determine whether differences in the performance of benthic indices between regions are due to variability in mollusks' tolerances to anthropogenic stressors or differing combinations of regionally acting stressors. Similarly, the sensitivity of mollusk-only benthic indices to different forms of environmental variability and anthropogenic disturbances, both between and within indices, demands further research. Van Hoey et al. (2010, p. 2191) pointed out the importance of using benthic indices with a “strong stressor-response relationship” to more confidently determine the ecological status of a location relative to reference conditions, and that indices will vary in their sensitivities to different kinds of stressors. Studies of the sensitivities of mollusk-only benthic indices could be accomplished by studying spatial variation in index values among stations with well-documented stress histories, or temporal variation using data that can be gathered from DAs on certain stressors. For instance, by analyzing trace elements in the mollusk shells themselves Gillikin et al. (2005) were able to track lead pollution over the past five decades in coastal waters near Cape Lookout, North Carolina, USA. Trace isotopic records of pollution or stress are independent and population-specific sources of data that could be used to help document the sensitivities of mollusk-only benthic indices to certain stressors, such as heavy metal pollution.
Further research into the application of benthic indices to molluscan DAs is also needed to help reconcile index results when different values are calculated for the same location, such as those of Leshno et al. (2016) for AMBI and Bentix. Integrating new research on index sensitivities, local information on anthropogenic impacts, and the application of multiple metrics to DAs, may be very helpful for interpreting apparently contradictory results of different mollusk-only benthic indices. Integrating multiple metrics and LA and DA data on multiple timescales may also be helpful for understanding the effects of multiple, potentially interacting, stressors on coastal and marine ecosystems and the corresponding benthic index results.
Conclusions
The application of AMBI and Bentix to only the molluscan taxa in benthic communities is a viable method for determining the ecological status of water bodies under the WFD. In order to ensure fidelity to whole-community values, mollusk-only results must be converted to estimated whole-community values. Also, although the application of benthic indices to geohistorical records, such as DAs, is in its infancy, the method has great potential to contribute local baseline information on multiple timescales. Such data can help address issues in ecological assessment, including improving our understanding of the natural variability of benthic ecosystems and environmental change through time. Further research is urgently needed to guide decisions about selecting the most appropriate benthic index (or indices) and how to account for sources of bias in the outcomes of ecological assessments using only mollusks, both in living communities (e.g., taxonomic biases in ecological group distributions) and DAs (e.g., time-averaging, preservational bias, evenness bias). Addressing these issues will make mollusk-only benthic index assessments of DAs a powerful tool for implementing environmental legislation.
Author Contributions
This paper is a product of a topics in paleoecology course (EAS 7650) at Cornell University. GD, JS conceived of the study. All authors contributed to the design of the study. SD, JS, AT collected the datasets. SD, AT analyzed the data. All authors contributed to data interpretation and writing of the manuscript.
Conflict of Interest Statement
The authors declare that the research was conducted in the absence of any commercial or financial relationships that could be construed as a potential conflict of interest.
Acknowledgments
We thank those who generously provided the data sets that were utilized in this study. The Basque Water Agency (URA) provided data from the Basque Country (North of Spain), through Dr. Angel Borja (AZTI). The Northeast Atlantic Shelf Data were kindly provided by Dr. Richard Warwick (Plymouth Marine Laboratory). We also thank Nomiki Simboura and G. Lynn Wingard, whose comments improved the manuscript.
Supplementary Material
The Supplementary Material for this article can be found online at: http://journal.frontiersin.org/article/10.3389/fmars.2016.00169
References
Baumgartner, T. R., Soutar, A., and Ferreira-Bartrina, V. (1992). Reconstruction of the history of Pacific sardine and northern anchovy populations over the past two millennia from sediments of the Santa Barbara Basin, California. CalCOFI Rep. 33, 24–40.
Borja, A., Barbone, E., Basset, A., Borgersen, G., Brkljacic, M., Elliott, M., et al. (2011). Response of single benthic metrics and multi-metric methods to anthropogenic pressure gradients, in five distinct European coastal and transitional ecosystems. Mar. Pollut. Bull. 62, 499–513. doi: 10.1016/j.marpolbul.2010.12.009
Borja, Á., Dauer, D. M., and Grémare, A. (2012). The importance of setting targets and reference conditions in assessing marine ecosystem quality. Ecol. Indic. 12, 1–7. doi: 10.1016/j.ecolind.2011.06.018
Borja, A., Franco, J., and Perez, V. (2000). A marine biotic index to establish the ecological quality of soft-bottom benthos within European estuarine and coastal environments. Mar. Pollut. Bull. 40, 1100–1114. doi: 10.1016/S0025-326X(00)00061-8
Borja, Á., Franco, J., Valencia, V., Bald, J., Muxika, I., Jesús Belzunce, M., et al. (2004). Implementation of the European Water Framework Directive from the Basque country (northern Spain): a methodological approach. Mar. Pollut. Bull. 48, 209–218. doi: 10.1016/j.marpolbul.2003.12.001
Borja, A., and Muxika, I. (2005). Guidelines for the use of AMBI (AZTI's Marine Biotic Index) in the assessment of the benthic ecological quality. Mar. Pollut. Bull. 50, 787–789. doi: 10.1016/j.marpolbul.2005.04.040
Casey, M. M., Dietl, G. P., Post, D. M., and Briggs, D. E. G. (2014). The impact of eutrophication and commercial fishing on molluscan communities in Long Island Sound, USA. Biol. Conserv. 170, 137–144. doi: 10.1016/j.biocon.2013.12.037
Chiba, T., and Sato, S. (2014). Invasion of a naticid predator and associated changes in death assemblages of bivalve prey in northern Japan: implications for palaeoecological studies. Lethaia 47, 4–14. doi: 10.1111/let.12033
Coelho, J. P., Duarte, A. C., Pardal, M. A., and Pereira, M. E. (2014). Scrobicularia plana (Mollusca, Bivalvia) as a biomonitor for mercury contamination in Portuguese estuaries. Ecol. Indic. 46, 447–453. doi: 10.1016/j.ecolind.2014.07.015
Dauvin, J.-C. (2007). Paradox of estuarine quality: benthic indicators and indices, consensus or debate for the future. Mar. Pollut. Bull. 55, 271–281. doi: 10.1016/j.ajp.2016.01.013
Dauvin, J. C., and Ruellet, T. (2007). Polychaete/amphipod ratio revisited. Mar. Pollut. Bull. 55, 215–224. doi: 10.1016/j.marpolbul.2006.08.045
Dietl, G. P., and Flessa, K. W. (2011). Conservation paleobiology: putting the dead to work. Trends Ecol. Evol. 26, 30–37. doi: 10.1016/j.tree.2010.09.010
Dietl, G. P., Kidwell, S. M., Brenner, M., Burney, D. A., Flessa, K. W., Jackson, S. T., et al. (2015). Conservation paleobiology: leveraging knowledge of the past to inform conservation and restoration. Annu. Rev. Earth Planet. Sci. 43, 79–103. doi: 10.1146/annurev-earth-040610-133349
Dimiza, M. D., Triantaphyllou, M. V., Koukousioura, O., Hallock, P., Simboura, N., Karageorgis, A. P., et al. (2016). The foram stress index: a new tool for environmental assessment of soft-bottom environments using benthic foraminifera. A case study from the Saronikos Gulf, Greece, Eastern Mediterranean. Ecol. Indic. 60, 611–621. doi: 10.1016/j.ecolind.2015.07.030
Durham, S. R., and Dietl, G. P. (2015). Perspectives on geohistorical data among oyster restoration professionals in the United States. J. Shellfish Res. 34, 227–239. doi: 10.2983/035.034.0204
European Commission (2000). Directive 2000/60/EC of the European Parliament and of the Council of 23 October 2000 establishing a framework for community action in the field of water policy. Off. J. Eur. Union L327, 1–72.
European Commission (2008). Directive 2008/56/EC of the European Parliament and of the Council establishing a framework for community action in the field of marine environmental policy (Marine Strategy Framework Directive). Off. J. Eur. Union L164, 19–40.
Giacobbe, S., and Leonardi, M. (1985). Caratteristiche dei sedimenti e bionomia bentonica in un'area campione del Golfo di Milazzo. Mem. Biol. Mar. E Oceanogr. 15, 165–189.
Gillett, D. J., Weisberg, S. B., Grayson, T., Hamilton, A., Hansen, V., Leppo, E. W., et al. (2015). Effect of ecological group classification schemes on performance of the AMBI benthic index in US coastal waters. Ecol. Indic. 50, 99–107. doi: 10.1016/j.ecolind.2014.11.005
Gillikin, D. P., Dehairs, F., Baeyens, W., Navez, J., Lorrain, A., and André, L. (2005). Inter-and intra-annual variations of Pb/Ca ratios in clam shells (Mercenaria mercenaria): a record of anthropogenic lead pollution? Mar. Pollut. Bull. 50, 1530–1540. doi: 10.1016/j.marpolbul.2005.06.020
Hessman, F. V. (2009). Figure Calibration. Gottingen: Instagram of Atrophysik, Geor-August-Universitat Gottingen.
Kidwell, S. M. (2001). Preservation of species abundance in marine death assemblages. Science 294, 1091–1094. doi: 10.1126/science.1064539
Kidwell, S. M. (2007). Discordance between living and death assemblages as evidence for anthropogenic ecological change. Proc. Natl. Acad. Sci. U.S.A. 104, 17701–17706. doi: 10.1073/pnas.0707194104
Kidwell, S. M. (2013). Time-averaging and fidelity of modern death assemblages: building a taphonomic foundation for conservation palaeobiology. Palaeontology 56, 487–522. doi: 10.1111/pala.12042
Kidwell, S. M., and Tomasovych, A. (2013). Implications of time-averaged death assemblages for ecology and conservation biology. Annu. Rev. Ecol. Evol. Syst. 44, 539–563. doi: 10.1146/annurev-ecolsys-110512-135838
Kowalewski, M., Goodfriend, G. A., and Flessa, K. W. (1998). High-resolution estimates of temporal mixing within shell beds: the evils and virtues of time-averaging. Paleobiology 24, 287–304.
Kröncke, I., and Reiss, H. (2010). Influence of macrofauna long-term natural variability on benthic indices used in ecological quality assessment. Mar. Pollut. Bull. 60, 58–68. doi: 10.1016/j.marpolbul.2009.09.001
La Valle, P., Nicoletti, L., Finoia, M. G., and Ardizzone, G. D. (2011). Donax trunculus (Bivalvia: Donacidae) as a potential biological indicator of grain-size variations in beach sediment. Ecol. Indic. 11, 1426–1436. doi: 10.1016/j.ecolind.2011.03.005
Leshno, Y., Benjamini, C., and Edelman-Furstenberg, Y. (2016). Ecological quality assessment in the Eastern Mediterranean combining live and dead molluscan assemblages. Mar. Pollut. Bull. 104, 246–256. doi: 10.1016/j.marpolbul.2016.01.014
Leshno, Y., Edelman-Furstenberg, Y., Mienis, H., and Benjamini, C. (2015). Molluscan live and dead assemblages in an anthropogenically stressed shallow-shelf: levantine margin of Israel. Palaeogeogr. Palaeoclimatol. Palaeoecol. 433, 49–59. doi: 10.1016/j.palaeo.2015.05.008
Mahmoud, N., Dellali, M., Bour, M. E., Aissa, P., and Mahmoudi, E. (2010). The use of Fulvia fragilis (Mollusca: Cardiidae) in the biomonitoring of Bizerta Lagoon: a multimarkers approach. Ecol. Indic. 10, 696–702. doi: 10.1016/j.ecolind.2009.11.010
Munari, C., and Mistri, M. (2010). Towards the application of the Water Framework Directive in Italy: assessing the potential of benthic tools in Adriatic coastal transitional ecosystems. Mar. Pollut. Bull. 60, 1040–1050. doi: 10.1016/j.marpolbul.2010.01.022
Muxika, I., Borja, Á., and Bald, J. (2007). Using historical data, expert judgement and multivariate analysis in assessing reference conditions and benthic ecological status, according to the European Water Framework Directive. Mar. Pollut. Bull. 55, 16–29. doi: 10.1016/j.marpolbul.2006.05.025
National Research Council NRC (2005). The Geological Record of Ecological Dynamics: Understanding the Biotic Effects of Future Environmental Change. Washington, DC: National Academy Press.
Nerlović, V., Doğan, A., and Hrs-Brenko, M. (2011). Response to oxygen deficiency (depletion): bivalve assemblages as an indicator of ecosystem instability in the northern Adriatic Sea. Biologia 66, 1114–1126. doi: 10.2478/s11756-011-0121-3
Peharda, M., Hrs-Brenko, M., Bogner, D., Lucic, D., Onofri, V., and Benovic, A. (2002). Spatial distribution of live and dead bivalves in saltwater lake Malo Jezero (Mljet National Park). Period. Biol. 104, 115–122.
Price, S. A., and Schmitz, L. (2016). A promising future for integrative biodiversity research: an increased role of scale-dependency and functional biology. Philos. Trans. R. Soc. B. Biol. Sci. 371:20150228. doi: 10.1098/rstb.2015.0228
Rosenberg, R., Blomqvist, M. C., Nilsson, H., Cederwall, H., and Dimming, A. (2004). Marine quality assessment by use of benthic species-abundance distributions: a proposed new protocol within the European Union Water Framework Directive. Mar. Pollut. Bull. 49, 728–739. doi: 10.1016/j.marpolbul.2004.05.013
Simboura, N., and Argyrou, M. (2010). An insight into the performance of benthic classification indices tested in Eastern Mediterranean coastal waters. Mar. Pollut. Bull. 60, 701–709. doi: 10.1016/j.marpolbul.2009.12.005
Simboura, N., and Reizopoulou, S. (2007). A comparative approach of assessing ecological status in two coastal areas of Eastern Mediterranean. Ecol. Indic. 7, 455–468. doi: 10.1016/j.ecolind.2006.05.003
Simboura, N., and Zenetos, A. (2002). Benthic indicators to use in ecological quality classification of Mediterranean soft bottom marine ecosystem, including a new biotic index. Mediterr. Mar. Sci. 3, 77–111. doi: 10.12681/mms.249
Simboura, N., Zenetos, A., Pancucci-Papadopoulou, M. A., Reizopoulou, S., and Streftaris, N. (2012). Indicators for the sea-floor integrity of the Hellenic Seas under the European Marine Strategy Framework Directive: establishing the thresholds and standards for good environmental status. Mediterr. Mar. Sci. 13, 140–152. doi: 10.12681/mms.31
Smith, J. A., and Dietl, G. P. (2016). The value of geohistorical data in identifying a recent human-induced range expansion of a predatory gastropod in the Colorado River delta, Mexico. J. Biogeogr. 43, 791–800. doi: 10.1111/jbi.12644
Spagnolo, A., Punzo, E., Santelli, A., Scarcella, G., Strafella, P., Grati, F., et al. (2014). Offshore platforms: comparison of five benthic indicators for assessing the macrozoobenthic stress levels. Mar. Pollut. Bull. 82, 55–65. doi: 10.1016/j.marpolbul.2014.03.023
Stergiou, K. I., Christou, E. D., Georgopoulos, D., Zenetos, A., and Souvermezoglou, C. (1997). The Hellenic seas: physics, chemistry, biology and fisheries. Oceanogr. Mar. Biol. Annu. Rev. 35, 415–538.
Teixeira, H., Salas, F., Pardal, M. A., and Marques, J. C. (2007). Applicability of ecological evaluation tools in estuarine ecosystems: the case of the lower Mondego estuary (Portugal). Hydrobiologia 587, 101–112. doi: 10.1007/s10750-007-0697-3
Tweedley, J. R., Warwick, R. M., Clarke, K. R., and Potter, I. C. (2014). Family-level AMBI is valid for use in the north-eastern Atlantic but not for assessing the health of microtidal Australian estuaries. Estuar. Coast. Shelf Sci. 141, 85–96. doi: 10.1016/j.ecss.2014.03.002
Valdés, J., Ortlieb, L., Gutierrez, D., Marinovic, L., Vargas, G., and Sifeddine, A. (2008). 250 years of sardine and anchovy scale deposition record in Mejillones Bay, northern Chile. Prog. Oceanogr. 79, 198–207. doi: 10.1016/j.pocean.2008.10.002
Van Hoey, G., Borja, A., Birchenough, S., Buhl-Mortensen, L., Degraer, S., Fleischer, D., et al. (2010). The use of benthic indicators in Europe: from the Water Framework Directive to the Marine Strategy Framework Directive. Mar. Pollut. Bull. 60, 2187–2196. doi: 10.1016/j.marpolbul.2010.09.015
Velez, C., Pires, A., Sampaio, L., Cardoso, P., Moreira, A., Leandro, S., et al. (2016). The use of Cerastoderma glaucum as a sentinel and bioindicator species: take-home message. Ecol. Indic. 62, 228–241. doi: 10.1016/j.ecolind.2015.10.051
Weber, K., and Zuschin, M. (2013). Delta-associated molluscan life and death assemblages in the northern Adriatic Sea: implications for paleoecology, regional diversity and conservation. Palaeogeogr. Palaeoclimatol. Palaeoecol. 370, 77–91. doi: 10.1016/j.palaeo.2012.11.021
Wiens, J. A., Hayward, G. D., Hugh, D., and Giffen, C. (2012). Historical Environmental Variation in Conservation and Natural Resource Management. West Sussex, UK: John Wiley and Sons.
Keywords: AMBI, Bentix, bivalves, death assemblage, gastropods, geohistorical data, Marine Strategy Framework Directive, Water Framework Directive
Citation: Dietl GP, Durham SR, Smith JA and Tweitmann A (2016) Mollusk Assemblages As Records of Past and Present Ecological Status. Front. Mar. Sci. 3:169. doi: 10.3389/fmars.2016.00169
Received: 16 June 2016; Accepted: 30 August 2016;
Published: 30 September 2016.
Edited by:
Maria C. Uyarra, AZTI Tecnalia, SpainReviewed by:
Nomiki Simboura, Hellenic Centre for Marine Research, GreeceG. Lynn Wingard, United States Geological Survey, USA
Copyright © 2016 Dietl, Durham, Smith and Tweitmann. This is an open-access article distributed under the terms of the Creative Commons Attribution License (CC BY). The use, distribution or reproduction in other forums is permitted, provided the original author(s) or licensor are credited and that the original publication in this journal is cited, in accordance with accepted academic practice. No use, distribution or reproduction is permitted which does not comply with these terms.
*Correspondence: Gregory P. Dietl, Z3BkM0Bjb3JuZWxsLmVkdQ==
†These authors have contributed equally to this work.